1. Introduction
Several tasks are involved in driving a vehicle, and braking is one of them. In general, gentle braking below the limit of maximum braking performance is employed by drivers. In normal traffic, the maximum braking power of the vehicle is usually not needed. However, in an emergency situation, the braking distance is critical, especially when there is an obstacle in front of the car. Furthermore, drivers should be prepared for sudden changes in road conditions, such as from dry to wet roads that are snowy or muddy. The driver’s ability to control the vehicle in such situations depends on the contact between the tires and the road, which is aided by driver assistance systems that are now standard in every vehicle to help bring the vehicle to a stop as quickly as possible. The maximum braking performance is mainly influenced by the interaction between the tire and the road. Therefore, in this article, the friction coefficient and braking distance of eight different summer tires on a dry asphalt surface are examined. When the brakes are applied by the driver, braking force is generated between the tire and the road. The friction coefficient (γ) is defined as the ratio between the braking force (Fb) and the vertical tire force (Fv), as expressed by the equation: γ = Fb/Fv [
1]. The friction coefficient mainly depends on the tire conditions, weather conditions, road surface, and vehicle speed. The aim of this article is to demonstrate the behaviour of different summer tires (dimensions and age) during braking on dry asphalt. Additionally, an investigation of the influence of ABS on braking distance and friction coefficient was conducted.
ABS, also known as the antilock braking system, is a vehicle safety system that prevents the wheels from locking during emergency braking and contributes significantly to road safety by reducing braking distances. If the wheels become locked, the vehicle’s ability to be steered in the desired direction is lost. This results in the vehicle moving in its current direction, regardless of the steering wheel direction of the driver. When the wheels are locked, a decrease in the friction coefficient occurs, leading to the initiation of skidding of the vehicle and an increase in the braking distance. The goal of ABS is to control the rotation of the wheels to prevent skidding and enable steering in the desired direction. ABS control is achieved through a combination of slip control and wheel acceleration control, with the slip ratio being determined based on the vehicle speed and the speed of the wheels (tires) [
2]:
where
γ is the slip ratio,
vv is the vehicle speed,
vw is the wheel speed,
r is the radius of the wheel, and
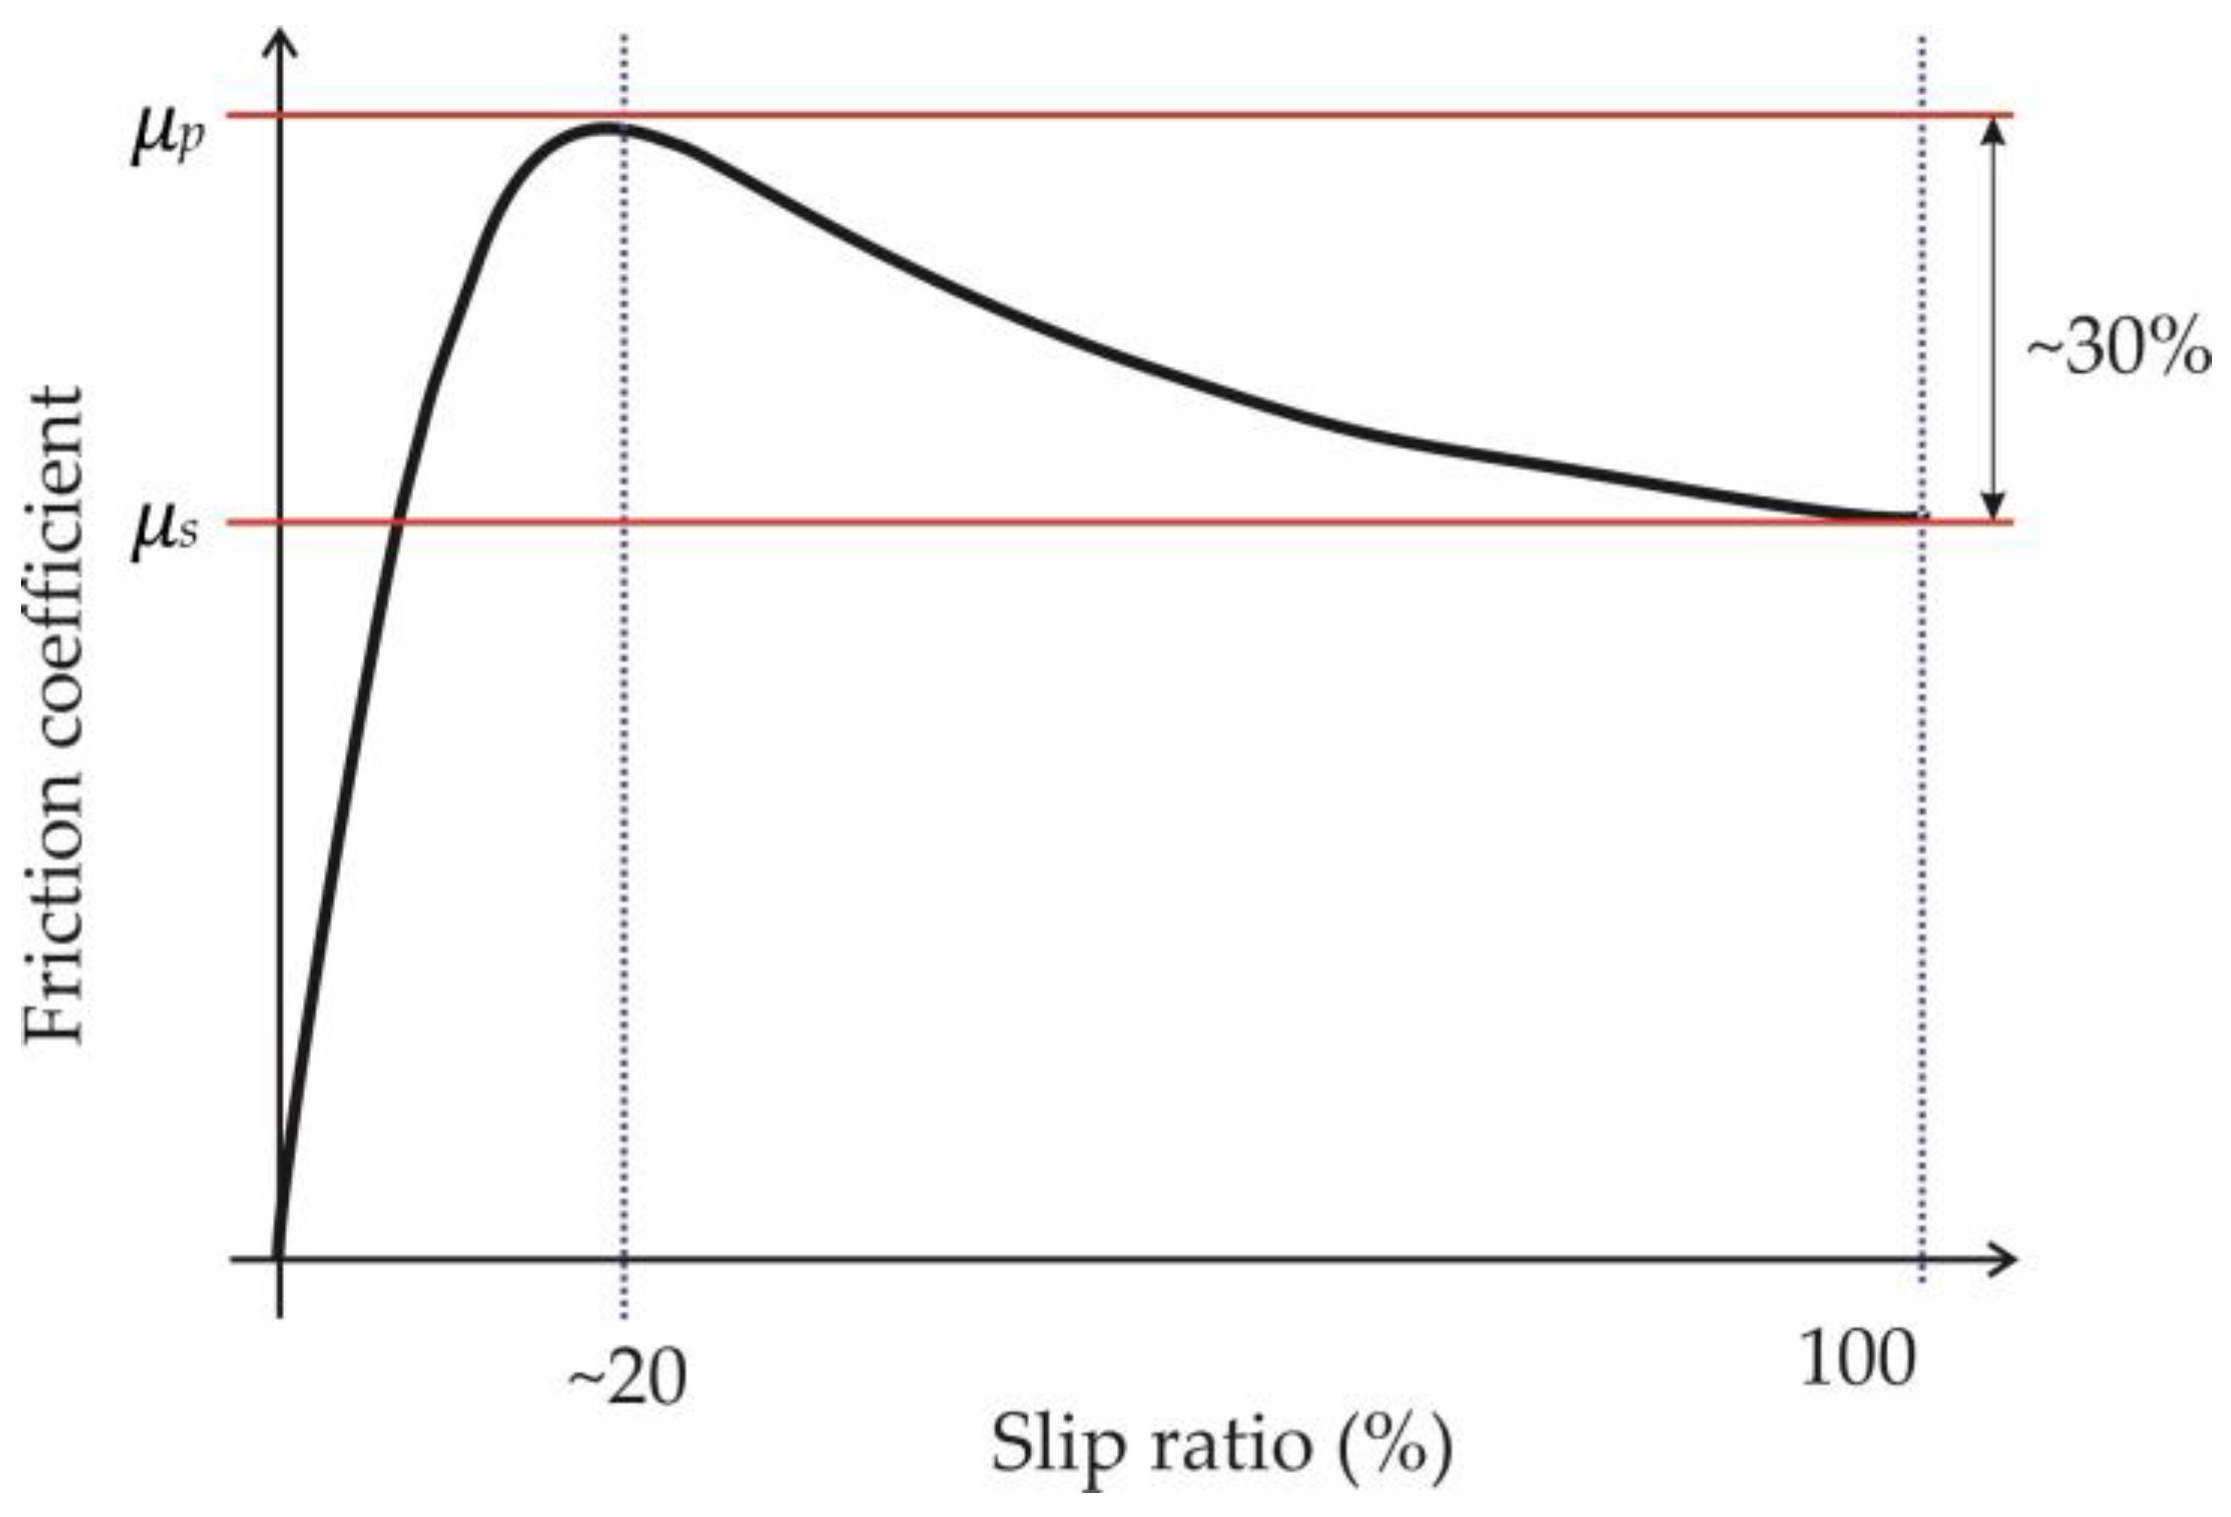
is the wheel’s angular velocity. Wheel slip on a vehicle is caused by the full application of the brakes while the vehicle is still in motion, but the wheels are not rotating. This is indicated by the rotation of the wheels being slower than the speed of the vehicle, resulting in wheel slip (Equation (1)). The relationship between the slip ratio of a vehicle and the friction coefficient can be represented by a slip curve (
Figure 1). The peak friction coefficient (
µp) is the maximum friction coefficient attained during a change in slip ratio. The coefficient of sliding friction (
µs) represents the friction coefficient when the wheel is sliding in a locked condition. The slip ratio generally reaches the maximum value of the friction coefficient at about 10–20% of the slip ratio for ABS vehicles [
3,
4].
The investigation of the braking performance of different types of tires (summer, all-season, and winter) on wet and dry asphalt surfaces was conducted by the authors of [
5]. The braking performance was compared with and without ABS, and it was concluded that the maximum braking distance of a vehicle is significantly influenced by tire friction and the use of ABS. The same conclusions were drawn by other researchers, namely [
1], who studied the influence of a TCS (traction control system), which is part of ESP (electronic stability program), which is utilized to prevent traction loss between the tires and the road. It was found that the TCS resulted in a slightly lower friction coefficient compared to ABS. A much more significant difference was observed between ABS and conventional braking without ABS. Furthermore, this study compared different road surfaces and determined that the type of road surface affects the friction coefficient. In [
6], the relationship between the friction coefficient of the tire and the road was studied when ABS was used during emergency braking on different types of surfaces. It was discovered that the friction coefficient decreases with an increasing initial speed for different types of surfaces.
An analysis of tire–road contact under different winter weather conditions was performed in [
7]. The effect of auxiliaries such as chains or studs on the traction characteristics of vehicles in winter conditions was experimentally confirmed by the authors. Additionally, ranges of friction coefficients for different winter road conditions were presented by them. Coefficients of friction for different surfaces obtained from different sources can be found in
Table 1.
As already mentioned, the braking distance is significantly affected by tire friction and the use of an ABS system. However, could tire ageing also have an effect on the braking performance of a car? In this study, the importance of tire ageing and the pollution caused by wear particles released during driving has been emphasized. The effect of tire ageing has been studied by many authors, namely in [
8,
9,
10]. A comparison was made between an oven-aged tire in a laboratory and a field-aged tire. All of these studies have focused on the ageing of car tires, particularly the changes in rubber properties inside the tire due to material ageing. However, none of them has examined the impact of tire ageing on the friction coefficient, which is crucial to braking performance. However, there are studies related to tire–road friction estimation. A comprehensive review of the tire–friction coefficient was conducted by [
11]. They categorized typical approaches to tire–road friction coefficient estimation into three categories: off-board sensors-based, vehicle dynamics-based, and data-driven-based methods. According to this review, our research falls under the category of vehicle dynamics-based approaches; specifically, investigating longitudinal dynamics. Furthermore, a noteworthy research study within our scope is [
12], which examined the effect of tire age on the slip ratio of a tire. Significant differences in the longitudinal coefficient of friction between new and worn tires were observed in this research. It was concluded that the coefficient of friction for worn tires is between 10 and 15% lower than that of new tires. However, it should be noted that this test was conducted on a new tire and an identical tire that had been artificially aged in an oven at 65 C for approximately eight weeks, equivalent to a four-year-old tire used in the field. However, in most of the literature, oven ageing of tires is being studied more and more frequently, probably because oven ageing occurs over a much shorter period than field ageing. Therefore, there is a lack of studies investigating the effect of tires aged in the field on the coefficient of friction. Additionally, [
12] indicated the need for further research to determine the significance of ageing on longitudinal force generation, as well as the potential for conducting studies on different tire types and sizes to observe potential major changes. Therefore, the purpose of this article is to investigate the effect of tire age on the friction coefficient. The research question is: “Is the effect of tire age on the friction coefficient constant or does it have a negative/positive effect?”
Tire wear is mainly caused by driving, which results in the reduction of tire thickness and the deposition of rubber particles from tire wear on and around the road surface, consequently contributing to water, soil, and air pollution as part of PM emissions [
13,
14]. According to [
15], more than 600 million tons of tire wear particles are emitted globally each year. Several methods have been used for generating, collecting, and analyzing tire wear particles. Tire wear particle samples can be collected directly from real roads or generated using laboratory road simulators. Samples may also come from different locations and have different size distributions and concentrations. In addition, tire debris from the road is usually mixed with other microplastic particles, necessitating the identification of tire wear debris. Since there are many analytical alternatives which are available, determining the most appropriate method for measurement is challenging. Therefore, a non-conventional approach was utilized in this article, where tire wear particles were evaluated based on field ageing and driving behaviour. On average, a typical car tire weighs one kilogram less at the end of its lifespan compared to when it was new. This can be illustrated with a simple calculation (Equation (2)). For example, considering a 195/55R16 summer tire, the typical density of the tire chips ranges from 320 kg/m
3 to 490 kg/m
3 (415 kg/m
3 was used for calculations) depending on the tire manufacturer [
16]. Additionally, the original (new) tread depth of the summer tire is about 8–9 mm. According to [
17], the average mileage for most people falls between 19,312 and 24,140 km, and the average lifespan of such a tire for an everyday driver is from three to five years. From this, it can be inferred that the average tire wear is between 1.280 and 2.133 mm per year. The calculation for determining the average tire wear in kg per year for an average tire was performed using the following calculation:
where 415 kg/m3 is the density of the tire, 0.001280 m is the average wear per year for five years of use, 0.195 m is the width of the tire, and 16 inches is the diameter of the tire, which is converted to meters and multiplied by pi and 2 (circumference of a circle). This missing 0.264 kg of rubber, composed of natural and synthetic elements, is represented by small microplastics that fall on the road and are washed into water or even carried into the air (becoming part of the PM10 pollution). According to the Secretariat of the International Rubber Study Group (IRSG), the global demand for natural and synthetic rubber has reached 27.07 million tons in 2020. Of this, the global demand for synthetic rubber reached 14.36 million tons in 2020 [
18]. When we look at the sources of primary plastic pollution in the oceans, textiles are the number one source, with 35% of the release of microplastics, followed by tire wear from driving at 28%. In 2019, there were approximately 1490 million vehicles in use worldwide [
19]. In addition, according to [
20], around 1.3 million tons of tire wear was generated on EU roads in 2014. The steady growth in the number of vehicles means increased rubber production, which means increased tire chips and wear and, as a result, waste rubber particles that are part of microplastics. In 2010, tires accounted for approximately 57% of total synthetic rubber consumption. The global consumption of synthetic rubber increased by 27% between 2002 and 2010 [
21]. Recent studies suggest that tire wear may be a major source of microplastics in the environment [
14,
22,
23]. Particles from a vehicle’s tires are released into the environment when the vehicle is driven. According to [
17], more than 90% of all tire wear particles are generated by the abrasion of tires, road surfaces, and braking systems on both rural roads and urban highways. These particles then enter storm drains, which serve as microplastic pollution hotspots. There are several studies, including [
24,
25], that address the particles from tires and roads (microplastics) that are washed into road runoff and storm drains, and thus into the environment.
According to [
26], a new 10 kg passenger car tire can produce from 1 to 1.5 kg of tire wear in its lifespan, or approximately 0.03 g/km. This means that such a tire can drive 50,000 km per lifespan. The tire wear per tire lifespan can be described as the number of grams of tire wear per km or per 1000 km. For this calculation, we used the average mileage of a car in the EU, which is 12,000 km per year [
27]. According to ADAC, an average of 120 g of tire wear per 1000 km is produced by a car [
28]. It should be noted that tire wear is dependent not only on tire dimensions but also on road topography, road surface, weather conditions, air temperature, vehicle weight, suspension or damping settings, engine power, driving speed, and driving style. This means that driving on mountainous roads will cause more wear than driving on city streets. Driving on concrete roads also causes more wear than driving on asphalt. As for the weather, wet roads cause more wear than dry roads, and the higher the air temperature, the more the wear which can be expected. Higher torque and a sportier chassis also have a negative effect on wear. In addition, more wear is caused by an aggressive driving style with substantial acceleration and braking, as well as driving at higher speeds.
The paper is organized as follows: The literature review is described in
Section 1, and the materials and methods used for measuring the friction coefficient and braking distance are described in
Section 2, along with the mathematical equations for assessments.
Section 3 discusses the effects of ABS on the braking distance and friction coefficient, and compares the results of ABS usage with conventional braking on two different surfaces. This section also examines the impact of tire age on the friction coefficient and braking distance, and presents the environmental impact of tire chips. The discussion is presented in
Section 4 and the conclusions are presented in
Section 5.
2. Materials and Methods
The purpose of this article is to compare braking with different tires on different surfaces; therefore, the repeatability and testing accuracy are important factors. To achieve this, a repeatable technology, the Vericom CV4000DAQ Performance Computer (
Figure 2), was used, which is claimed by the manufacturer to have an accuracy of ±0.003 for the measured G-force. However, during acceleration to the target speed, the activation of the unit may be prematurely triggered due to conditions such as gear shifting, resulting in measurement errors. Therefore, such tests were erased, and the tests were repeated.
The Vericom VC4000DAQ Performance Computer is an instrument used for measuring tire–road friction and vehicle performance, capable of accurately synchronising acceleration, deceleration, speed, time, and distance during vehicle braking. It is equipped with a 10 Hz GPS interface module, three-axis accelerometers, two-rate gyros, and a graphical display. Other technical features include a selectable G-range of 2 or 6 G, SD memory card, Bluetooth communication, OBDII CAN input, compass, USB port, battery, vacuum cup mounting, keypad, etc. Accurate results can be obtained even if the VC4000DAQ is not levelled, as it uses a threeaxis accelerometer that calculates the vector sum of all three axes for determining G force, velocity, and distance. As mentioned in the computer performance manual, the device can be mounted to the windshield or the side window of a car using a mounting arm and a pump-up vacuum cup. For the tests, it was mounted approximately at the center of the windshield with the x-axis aligned with the test direction (front to back of a car) and at 45° aligned with the direction of travel of the vehicle (
Figure 3). In addition, the three-axis accelerometer must always be mounted at the center of gravity of the test vehicle [
29].
The friction coefficient was measured using straight, flat surfaces. If the surface was slightly sloped, the slope was compensated for by the computer, ensuring that all data are accurate. The deceleration of a vehicle is calculated using the following equation [
5]:
where
a is the deceleration,
vi is the initial velocity,
ve is the final velocity, and
s is the distance measured from the starting point of deceleration (application of the brake pedal) to the stopping point. From this, it can be observed that the distance is expressed by the following equation [
5].
During the braking test, an attempt was made by the driver to keep the car in a straight line. The g-force is calculated using the following equation:
where
G is the g-force,
t is the braking time, and
g is the acceleration due to gravity, which pulls down with 1 g or 9.80665 m/s
2.
The study was conducted to determine how the friction coefficient and braking distance of summer tires change when the antilock braking system (ABS) is on and off. A single vehicle, a 2020 Renault Clio 1.0 with 74 kW, and a single set of Sava Intensa HP2 summer tires with the dimensions of 195/55R16 87H and at 1 year 50 week old were used for this test. The test was performed on both a dry asphalt surface and a wet sliding surface (
Figure 4). The Vericom VC4000DAQ Performance Computer (
Figure 2) was mounted on the windshield of the vehicle, positioned approximately at the center of gravity of the vehicle (
Figure 3).
All tests for this study were carried out at one of the Slovenian National Road Safety Centres. The tests were performed on a straight, flat section of dry asphalt and a wet sliding surface. Measurements were taken at different initial speeds, including 20 km/h, 30 km/h, 40 km/h, and 50 km/h. Different tire dimensions were selected, but all tires used were summer tires with at least 1.6 mm of tread depth, and they were all inflated to the recommended pressure as advised by the vehicle manufacturer.
3. Results
This section is divided into subsections with test results. The first subsection presents the braking distance and friction coefficient results measured with and without ABS. The second subsection presents the effect of tire age on the friction coefficient and braking distance. Furthermore, the third subsection addresses the environmental impact of tire chips generated by driving the vehicle.
3.1. Influence of Antilock Braking System on Braking Distance and Friction Coefficient
In this subsection, the effects of an anti-lock braking system on the braking distance and friction coefficient are studied. The results of using ABS are compared with those of conventional braking on two different surfaces. The test surfaces used for the braking tests, namely the wet sliding surface and the dry asphalt, are shown in
Figure 4.
Figure 4.
Test surfaces—dry asphalt (left) and wet slip surface (right).
Figure 4.
Test surfaces—dry asphalt (left) and wet slip surface (right).
Figure 5 shows that the friction coefficient is indeed affected by speed, as found by other authors in [
1,
6,
7]. The tire selected in
Figure 2 is a Sava Intensa HP2 summer tire, with a size of 195/55R16 87H and aged at 1 year and 50 weeks old. The test was performed on the same dry asphalt and with the same car. The test took place on a slightly foggy December day with a relative humidity of 79% and a temperature of +3 °C. An interesting observation is that the friction coefficient slightly increases with speed when ABS is used, while it decreases when ABS is not used. The target speeds of the test were 20 km/h, 30 km/h, and 40 km/h. The average friction coefficient with ABS was 0.83, ranging from 0.768 to 0.894. Additionally, the average friction coefficient without ABS was 0.73, ranging from 0.681 to 0.780. On average, the friction coefficient values were 13% higher with ABS than without ABS. The ABS deceleration graphs (
Figure 5 and
Figure 6) show the rate at which the car decelerated during a braking event, with time on the horizontal axis and friction coefficient (deceleration) on the vertical axis. The graph shows a series of peaks, with each peak representing a pulse of braking from the ABS system. The ABS deceleration graph is useful in assessing the performance of the ABS system and can be used to identify any problems with the system, such as a failed sensor. It can also be used to assess the vehicle’s braking performance.
When the friction coefficient on the wet sliding surface is compared with braking on the dry asphalt using the same pair of tires, similar results are obtained as before, namely that the friction coefficient is affected by ABS (
Figure 6). The initial speeds of the tests were 30 km/h and 40 km/h. The average friction coefficient with ABS was 0.35, ranging from 0.266 to 0.413. Additionally, the average friction coefficient without ABS was 0.24, ranging from 0.206 to 0.317. This indicates that the friction coefficient values with ABS are on average 30% higher than when braking without ABS.
The results of the test performed on dry asphalt compared to the test performed on a wet sliding surface confirm that the friction coefficient is influenced by the surface. When the asphalt is dry, a very high friction coefficient is observed. In such a situation, conventional braking without ABS is quite efficient. However, the friction coefficient decreases drastically when the road surface is wet. The slip ratio varies depending on the condition of the road’s surface: 0.1 on the wet surface and 0.2 on the dry surface [
30].
Figure 7 shows a comparison of the maximum braking distance on dry asphalt for vehicles with and without ABS. The tests were conducted at initial speeds of 20 km/h, 30 km/h, 40 km/h, and 50 km/h. For a vehicle with an initial speed of 40 km/h on dry asphalt, the average braking distance with ABS is 7.7 m, whereas without ABS it is 8.6 m. More specifically, ABS reduces the braking distance by 10.5%. At an initial speed of 50 km/h, the vehicle with ABS stops at an average distance of 12 m, while the vehicle without ABS stops at 14 m. In percentage terms, this means that ABS reduces the stopping distance by 14.3%. Notably, the difference in stopping distance increases appears to increase exponentially with a higher initial speed of the vehicle.
Comparing the maximum braking distance on wet roads with and without ABS reveals that similar results to those on dry roads are obtained. An average distance of 17 m is covered by the vehicle without ABS from an initial speed of 30 km/h. On the other hand, a vehicle with ABS braking stops at 10.7 m from an initial speed of 30 km/h. Specifically, on wet roads, ABS reduces the braking distance by 37%. It can be concluded that braking distance is reduced with the use of ABS.
3.2. The Effect of Tire Age on the Friction Coefficient and Braking Distance
Eight different summer tires were compared and listed in
Table 2. The tires ranged in age from 1 yr 50 w to 7 yr 43 w. The tires which were tested were all inflated to the vehicle manufacturer’s recommended pressure. The average maximum braking characteristics with ABS on dry asphalt at an initial speed of 30 km/h are shown in
Table 2, with the calculations performed using Equations (3)–(5).
The relationships between six variables of the tire (braking distance, braking time, deceleration, friction coefficient, vehicle speed, and the age of the tire) were examined with a simple regression analysis. The model assumed that each variable (
Y) could be described as follows:
where
ei is called the residual. It describes the error in fitting the model and provides information about the adequacy of the fitted model. The estimates of β
0 and β
1 produce a line that is, in a sense, a “best fit” to the data. The regression parameters β
1 (regression coefficient) and β
0 (regression constant) were estimated using the least squares method. A matrix of the Pearson correlation coefficient for tire F is shown in
Table 3. The maximum braking distance for tire F was measured 28 times at speeds of 20 km/h, 30 km/h, 40 km/h, and 50 km/h. Between six and eight measurements of braking were made for each speed.
A very high correlation between braking distance, braking time, and vehicle speed was observed in the Pearson correlation coefficient (
Table 3). There was also a very high correlation between deceleration and the friction coefficient.
The impact of tire age on the friction coefficient and braking distance was one of the main focuses of this study. Therefore, a comparison was made between the age of each tire and the average of the measurements for six variables from
Table 2.
The high negative correlation between the friction coefficient and deceleration, as well as the age of the tire, can be observed from the Pearson correlation coefficient between the average values. Additionally, a strong correlation between the friction coefficient and deceleration is shown in
Table 3 and
Table 4. It has been found in previous studies that the friction coefficient increases with speed until it reaches a maximum value at a certain speed, and then decreases [
7]. For example, in the current study, the average friction coefficient for all 214 measurements (eight tires) when braking on dry asphalt was 0.725 at a speed of 20 km/h, 0.759 at a speed of 30 km/h, 0.789 at a speed of 40 km/h, and 0.812 at a speed of 50 km/h. This means that the friction coefficient does indeed increase with velocity, but with a higher initial speed, it should decrease.
The changes in the friction coefficient with the age of the tire were also examined. Was it decreasing, increasing, or remaining steady?
Figure 8 shows the R-squared value of 0.6037, with a Pearson’s correlation coefficient of √0.6037 = 0.777, indicating a high (negative) linear correlation. If the R-squared is 0.6037, this means that the regression line explains 60.37% of the variation in the dependent variable (friction coefficient) based on the independent variable (age of tire) used in the model. This value indicates that the model can explain a moderate amount of the variability in the data, but there may be other factors that affect the dependent variables that are not captured in the model, such as tire width, height, diameter, etc. However, the aim of the study was to show the effect of tire age on the coefficient of friction, and it was observed that the coefficient of friction of a tire decreases as it ages.
3.3. Environmental Impact of Tires Chips and Wear
Public attention is increasingly focused on the impact of tire wear on the environment, often associated with the term microplastics. To minimize the negative impact on oceans, soils, and, ultimately, humans, efforts should be made to keep the amount of tire wear released by road traffic as low as possible. As mentioned in the introduction, abrasion (tire chips and tire wear) is generated by tires when they are driven on the road. Tires, being composed of rubber and natural and synthetic elements, contribute to environmental pollution through the release of tire chips. For drivers, the life of a tire is dependent on its tread depth. However, determining the environmental impact of a tire in terms of microplastic pollution based solely on tread depth is not sufficient. Therefore, it is necessary to calculate tire wear in terms of mass, measured in grams, to better assess the environmental impact.
In this subsection, a comparison is made between the tires shown in
Table 2 in terms of wear. Equation (2) was used to calculate how many chips are produced per year if the average distance driven on summer tires in Europe is 12,000 km per year. It was assumed that tires used for from five to eight years and driven at 12,000 km per year would wear 0.79–1.33 mm in one year, assuming the original tread depth of the new tire to be about 8 mm. However, the legal minimum tread depth in Europe for all summer tires is 1.6 mm. Based on this, the average wear of a tire is calculated to be 1 mm per year if the tire is used for about six years and travels at 12,000 km per year. Equation (2) can be used to calculate the average tire wear in grams when it travels 12,000 km per year. The results are presented in
Table 5.
In
Table 5, it is shown that tire F has produced more than 1 kg of tire wear. It can be concluded that this summer tire has traveled less than 12,000 km per year while still in use, considering that a typical vehicle tire weighs on average from 1 to 1.5 kg less at the end of its life than when it was new. It is observed (
Table 5) that it has worn at less than 1 mm per year, based on the age of the tire. According to the ADAC, an average of 120 g of tire wear is produced by a vehicle per 1000 km driven (Equation (7)). The calculation of tire chips is done as follows.
The calculation results show that 360 g of tire wear is produced by a tire per year, or 1.65 mm of tread height wear when driven for four years. The findings of [
26] state that a new 10 kg passenger car tire can produce from 1 to 1.5 kg of tire wear per lifespan, or approximately 0.03 g/km. It can be calculated that tire wear of 218 g per year corresponds to approximately 1 mm of tread height wear when driven for six years. According to the literature and
Table 5, tire wear and the generation of tire wear debris are caused by the contact of the tire with a surface, i.e., the width and diameter of the tire. This means that tires with a larger diameter (i.e., SUV tires) and a larger width generate more tire wear.
When tire wear is converted from grams to tread height in mm, the results of the assessments in
Table 6 are obtained. It can be observed that tire E (Bridgestone Turanza) should be completely worn out in terms of age (considering that an average wear of 6.4 mm occurs in 6.4 years). However, it still had a minimum tread depth of 1.6 mm, which means that it was driven less than 12,000 km per year, or wore out less than 1 mm per year. This may also be related to the manufacturer’s km warranty and, as a result, the tire’s lower wear rate.
However, it must be stressed that results in this research are based on certain parameters such as summer tires, 12,000 km driven, the used average tire wear of 218 g per tire in a year, and the weather conditions, i.e., summertime in Slovenia. If these tests had been carried out in, e.g., northern Europe (Scandinavia), the weather conditions would have been different (air and surface temperature, humidity, etc.). Other tires are also used there (e.g., studded tires) and there is also a shorter period of time for the use of summer tires, e.g., winter studded tires can be used in Finland from 1 November to 31 March and also during other periods if required by weather or road surface conditions. However, it is recommended in Finalnd that the tread depth on summer tires is at least 4 mm, which is more than the minimum permitted tire tread depth of 1.6 mm for summer tires in most other European countries. Therefore, the results of our assessment must be used with caution. Tests conducted under the same conditions and inputs (tire manufacturers, tire dimensions, Vericom computer, initial speeds and surfaces, weather, etc.) should produce similar results, meaning that the test can be repeatable.
4. Discussion
The results of this article indicate that the braking distance and friction coefficient can be significantly improved by ABS on both dry and wet surfaces. Moreover, our findings can be correlated with [
1], where a technical analysis of an experimental study on the friction coefficient of a car using conventional braking, an anti-lock braking system (ABS), and a traction control system (TCS) in the process of maximum braking force on different types of road surfaces was presented. The results of the study [
1] show that the friction coefficient decreases with the initial speed and depends on the braking surface. The same result was obtained in our study, as can be seen in comparison
Table 7. Moreover, this study shows that, on dry asphalt, the friction coefficient values were 13% higher with ABS than without ABS, and on a wet surface, 30% higher than when braking without ABS. The effect of ABS on stopping distance was also investigated, and it was concluded that ABS reduced the braking distance by 37% on a wet sliding surface and by 14.3% on dry asphalt. However, this is in contrast to the findings of the compared research [
1], where it was shown that, on rough and smooth pavement, the stopping distance increased as a result of using ABS. Thereafter, it is important to note that ABS is not a guarantee of shorter braking distances in all situations. The effectiveness of ABS depends on various factors such as the condition of the tires, the type of road surface, and the vehicle’s speed and weight. For example, in deep snow, the wheels may sink into the surface, reducing their rotation speed and causing the ABS system to activate unnecessarily. This can increase the braking distance as the wheels lose traction and slip.
Improvements that can be made to ABS have been investigated by many authors, such as estimating the optimal slip ratio [
31,
32,
33,
34]. However, the regenerative anti-lock braking system (RABS) has recently emerged as an interesting topic in ABS improvements for evaluating the enhancement of regenerative braking performance in electric and hybrid vehicles [
35,
36,
37]. A combination of two functions is used in an RABS system: first, the regenerative braking system is used to slow down the vehicle and convert the energy into electricity; second, the anti-lock braking system is used to prevent the wheels from locking. This not only improves the vehicle’s energy efficiency but also provides the driver with a smoother and more controlled braking experience. In [
35], a system was proposed to evaluate the improvement of regenerative braking performance at low-speed rates (up to 10 km/h) to enable the hybrid vehicle to recover a significant amount of electrical energy. RABS systems are increasingly being utilized in electric and hybrid vehicles due to their ability to improve both energy efficiency and safety. It is expected that research and development of regenerative anti-lock braking systems (RABS) will continue in the future, driven by the increasing demand for electric and hybrid vehicles, the need for more efficient and sustainable transportation solutions, and advancements in battery technologies for more efficient energy storage.
The correlation between the tire age, wear, braking distance, and friction coefficient is discussed in the article, with emphasis placed on the importance of tire wear and the friction coefficient as tires age. An average annual tire wear of 360 g is calculated from tire chips, resulting in a yearly decrease of approximately 1.65 mm of tread height when driving 12,000 km per year with a tire lifespan of four years. A prior study [
26] reported that a new 10 kg passenger car tire can generate between 1 and 1.5 kg of tire wear throughout its lifespan, which is equivalent to about 0.03 g/km. As a result, it is recommended that summer tires be used for from four to six years. However, it should be noted that these recommendations are specific and may not be applicable to all tire types or driving conditions. Thus, tires must be monitored regularly by drivers to determine the optimal time for tire replacement based on their driving habits and tire tread depth. Abrasion, including tire chips and tire wear, is produced by tires during their use on roads, as they consist of a combination of natural and synthetic materials such as rubber. The environmental impact of tire wear particles, which has been previously brought to light by other authors as well [
22,
26,
38,
39,
40,
41,
42], is essential to be underscored due to the negative impact on the environment caused by tire debris.
The potential for future refinement of our understanding of how different factors impact braking distance and friction coefficient, as well as the optimization of these factors to enhance vehicle safety and braking performance, has been identified in this research. Specifically, this includes: investigation of the impact of different tire types, such as winter tires, all-season tires, etc.; investigating the influence of other factors, such as tire pressure, vehicle weight, other road surface types and weather conditions, etc., on braking distance and friction coefficient; the evaluation of the effectiveness of different braking systems and technologies in reducing braking distance; investigation of the relationship between tire age and other aspects of tire performance that can provide valuable insights into improving vehicle safety and performance, such as handling, stability and fuel consumption, etc.
In conclusion, the effects of vehicle speed, ABS, and tire age on the braking distance and coefficient of friction of a vehicle have been elucidated in this article. The results of this research have important implications for understanding vehicle braking performance concerning different surfaces, tires, and braking systems.
5. Conclusions
The effects of speed and ABS on the friction coefficient and braking distance of a car are discussed in the article. The test was conducted on a Sava Intensa HP2 summer tire on dry asphalt and wet surfaces, with and without ABS, and at initial speeds of 20 km/h, 30 km/h, and 40 km/h. The friction coefficient was found to be 13% higher on average with ABS than without ABS on dry surfaces, and 30% higher on wet surfaces. It was observed that ABS reduced the braking distance by 14.3% on dry surfaces and 37% on wet surfaces. The results indicate a significant improvement in the friction coefficient and a reduction in braking distance with the use of ABS.
The relationship between tire age and the friction coefficient is also researched in the article, revealing a correlation between the two variables. A moderate to high correlation was found, indicating that the friction coefficient of a tire decreases as it ages. However, the model only explains a moderate amount of the variability in the data, and there may be other factors that affect the dependent variables which are not captured in the model (e.g., tire width, height, diameter, etc.).
Furthermore, the comparison of eight summer tires in terms of wear was discussed. It has been reported by ADAC that an average of 120 g of tire wear is produced by a vehicle per 1000 km driven, and based on the average distance driven in Europe, which is 12,000 km per year, it has been concluded that tire wear of 218 g per year corresponds to approximately 1 mm of tread height. This means that, after six years, the tire weighs 1.3 kg less than when it was new. With this calculation, an estimate of the tire wear in kg due to the traveled distance and tire dimensions was made. The comparison of eight summer tires based on wear reveals that tire E produces more than 1 kg of tire wear, and should be completely worn out if it has driven 12,000 km per year, but it is still in use, which means that it has been driven less than 12,000 km per year.
This article provides recommendations for replacing summer tires within from four to six years of use, based on 12,000 km driven per year, as braking performance decreases after that. The coefficient of friction also decreases with age, resulting in longer stopping distances, which is another reason to replace tires before they are six years old.


