Article

Physiological Characterization of Tripidium arundinaceum and Sugarcane (Saccharum spp.) Germplasm for Salinity Stress Tolerance at the Formative Stage

by
Channappa Mahadevaiah
1,2,*,
Palanisamy Vignesh
1,
Chinnasamy Appunu
1,
Ramanathan Valarmathi
1,
Pooja Dhansu
3,
Ashwani Kumar
4,
Selvarajan Dharshini
1,
Thelakat Sasikumar Sarath Padmanabhan
1,
Jayanarayanan Ashwin Narayan
1,
Kannan Selvamuthu
1,
Venkatarayappa Sreenivasa
1,
Huskur Kumaraswamy Mahadeva Swamy
1,
Vazhakkannadi Vinu
1,
Arun Kumar Raja
1,
Giriyapura Shivalingamurthy Suresha
1,
Govindakurup Hemaprabha
1 and
Ravinder Kumar
3,*
1
Division of Crop Improvement, ICAR-Sugarcane Breeding Institute, Coimbatore 6410074, India
2
ICAR-Indian Institute of Horticultural Research, Hesaraghatta Lake Post, Bangalore 560089, India
3
ICAR-Sugarcane Breeding Institute Regional Station, Karnal 132001, India
4
ICAR-Central Soil Salinity Research Institute, Karnal 132001, India
*
Authors to whom correspondence should be addressed.
Sustainability 2023, 15(8), 6962; https://doi.org/10.3390/su15086962
Submission received: 4 November 2022 / Revised: 2 March 2023 / Accepted: 20 March 2023 / Published: 20 April 2023

Abstract

:
A total of sixteen accessions of Tripidium arundinaceum (Retz.) Welker, Voronts. & E.A. Kellogg (previously known as Erianthus arundinaceus (Retz.) Jeswiet) were evaluated for salinity tolerance at the bud germination stage by irrigating with 175 mM salinized Hoagland solution in perlite-sand hydroponics. Six accessions, IND99-907, IND01-1134, IND01-1136, IK76-48, and Bethuadahari, were germinated with healthy roots as compared to other accessions. These six accessions were further evaluated for morphological, physiological, and root anatomical parameters for different levels of salinity stress at the formative phase. Young leaf elongation was ceased after the fourth and twelfth day in Co 97010 and Co 86032, respectively, at 175 mM of salinity stress. The growth of young leaves in Co 97010 and Co 86032 was observed up to 25 mM of salinity stress only, whereas in T. arundinaceum accessions viz., IND99-907 and Bethuadahari, growth was recorded even at 175 mM. Lignification of cell walls, thickening of protoxylems, and vacuolization of cortex regions were observed in Co 97010, Co 86032, Bethuadahari, and IND01-1134 as compared to the normal anatomical structures in IND99-907. The accession IND99-907 recorded the lowest Na/K ratio, followed by IND99-1136 at 175 mM of salinity stress. The accession IND99-907 was identified as a salinity-tolerant genotype and suitable for utilization in the sugarcane crop improvement programmes.

1. Introduction

Soil salinization is a global threat to crop production in arid and semiarid regions [1], and also affects microbiomes in the rhizosphere [2,3]. Nearly 20% of irrigated land worldwide is estimated to be affected with salinity, and salinity is projected to affect 50% of arable land by the middle of the twenty-first century [4,5]. Nearly a total of 900 million hectares of arable land are salt-affected and this figure is projected to grow by 2 million hectares (1%) annually [5]. Saline water also significantly contributes to salinity, and irrigation water with a salinity level more than 0.7 dSm−1 is not suitable for irrigation [6]. Though India is self-sufficient in sugar requirement, the projected yield by 2050 is 105 tonnes per hectares; this requires an additional sugarcane area of one million hectares, and is projected to meet only the 75% sugar requirement [7]. The recent decision of the Indian government to blend petroleum products with 20% ethanol [8] necessitates the higher demand for sugarcane for biofuel production and cogenerations. With a view to the global and national demands for sugar production and increasing land area under salinity, it is imperative to identify the novel genetic resources for salinity tolerance and their utilizations in crop improvement through conventional and biotechnological approaches [9].
Sugarcane is an important source of sugar and biofuel, cultivated in tropical and subtropical regions in the world. India is one of the largest producers of sugarcane, cultivated in 5.16 million hectares with production of 405.40 million tonnes during 2021 [10]. Sugarcane is a salt-sensitive or glycophyte crop that shows higher sensitivity to the salinity stress at various growth stages. High salt concentration exhibits toxicity symptoms, low sprout emergence, nutritional imbalance, and overall growth reduction, leading to low biomass production and sugar yield [11]. The most affected traits were cane height, leaf area, and biomass [12]. Salinity tolerance in sugarcane is a complex trait, and many traits such as a wax-coated stem, larger roots, higher leaf area, high tillering, and a good ratooning ability are significant contributors to the salinity tolerance in sugarcane [13]. Salt tolerance is a complex trait governed by many genes involved at the biochemical, molecular, and physiological levels. High salinity causes both hyperionic and hyperosmotic stresses and affects the plants in two major ways. Firstly, it reduces the ability of the plant roots to extract water from the soil with high salt concentrations, and secondly, the high salt concentration is toxic and kills the cells [14]. Many studies have observed that tolerant genotypes tended to adapt and grow even under salinity stress due to: protection against the oxidative damage and higher activities of antioxidant enzymes [15,16,17]; the regulated uptake of sodium and chlorine to avoid the sodium toxicity [2,18]; and the accumulation of osmoprotectants and compatible solutes such as proline, glycine betaine, sugars and polyols, as they are uncharged, polar, water-soluble, and do not interfere with cellular functions [5,19,20]. The specific metabolic pathways, complex physiological traits, and molecular or gene networks confer the higher level of tolerance in salinity-tolerant genotypes [19]. Therefore, identifying the novel genetic resources and genes associated with salinity tolerance would lead to many methods of crop improvement using molecular biology and genetic engineering techniques.
Tripidium arundinaceum (Retz.) Welker, Voronts. & E.A. Kellogg (previously known as Erianthus arundinaceus (Retz.) Jeswiet) [21,22] is a wild relative of sugarcane and harbours many genes for agronomic traits as well as tolerance to both biotic and abiotic stresses [23,24,25,26,27,28,29]. Identification of novel genetic resources from T. arundinaceum germplasm serves as a valuable breeding asset for sugarcane crop improvement [30]. ICAR-Sugarcane Breeding Institute, Coimbatore, has the largest collection of T. arundinaceum germplasm in India [31]. Hence, this study aims at the characterization of T. arundinaceum accessions collected from low-altitude regions along the coastal regions of India for morphological, anatomical, and phycological parameters. T. arundinaceum genotype IND99-907 was identified as the most tolerant genotype and suitable to use in sugarcane crop improvement through plant breeding and biotechnological approaches.

2. Materials and Methods

2.1. Plant Material and Treatments

A total of sixteen T. arundinaceum accessions were chosen for the study, collected from coastal regions with lower altitudes. These accessions were maintained in the national collection of germplasm maintained at the Indian Council of Agricultural Research (ICAR)-Sugarcane Breeding Institute (SBI), Coimbatore, India, and details are given in Table 1. The salinity-sensitive sugarcane genotype Co 97010 and the popular cultivar Co 86032 were also included in the study.

2.2. Screening of T. arundinaceum Accessions at the Germination Stage

The experiment was carried out under a polyhouse facility (16-h photoperiod, 30/25 °C day/night, 380−400 μmol m−2 s−1) at ICAR-Sugarcane Breeding Institute, Coimbatore, India. Single buds of T. arundinaceum and sugarcane genotypes were grown in a pots containing the mixture of perlite and sand. Each pot was irrigated with 25 mL of salinized Hoagland nutrient solution (175 mM) containing sodium chloride, calcium chloride, and sodium sulphate in 2:2:1 proportion (molar weight basis) for 14 days. Genotypes were scored for salinity tolerance level based on their shoot emergence, and observations on shoot length, leaf length, root length, and root number were recorded on the 14th days. The control treatment was maintained by irrigating with Hoagland nutrient solution. Based on the performance of entries during germination studies, the shortlisted entries were further evaluated for different levels of salinity stress at the formative phase.

2.3. Assessing the Salinity Tolerance Level at the Formative Stage

Single bud sets of five T. arundinaceum accessions and sugarcane cultivars (Co 97010 and Co 86032) were grown in perlite-sand hydroponics for 60 days in controlled conditions in a polyhouse facility. At the formative phase (60th day), healthy plants with uniform plant growth were selected and irrigated with salinized Hoagland nutrient solutions (25, 75, 125, 175 mM) containing salts of sodium chloride, calcium chloride, and sodium sulphate in 2:2:1 proportion (molar weight basis). The control treatment was maintained by irrigating with the Hoagland nutrient solution. Pots were arranged in factorial randomized block design with five replications [32]. To assess the salinity-induced stress tolerance, the freshly emerging terminal leaf was tagged and leaf growth/leaf elongation rate was recorded on days 0, 4, 8, 12, and 16 at 10:00 a.m. The actively growing roots and leaf samples were sampled on the 16th days of salinity stress for physiological and biochemical assays, and for estimation of sodium and potassium contents.

2.4. Root Anatomy during Various Levels of Salinity Stress

To assess the cellular changes in the root corticular and vascular tissues, root samples of 5 cm from the root tip were sampled from the 16th day of stressed and control treatments. The hand sections were made and mounted on a slide, and the observed image was captured from a light microscope under 4.5× and 40× resolutions.

2.5. Estimation of Sodium and Potassium in Root Samples

Oven-dried and finely ground roots (100 mg each) from each treatment were digested overnight with 10 mL of HNO3:HClO4 (3:1) diacid mixture. The flasks were gently heated on a hot plate until the development of intense white fumes, and the process continued till the digested mixture remained transparent. Leftover digested material was cooled and the final volume was increased up to 50 mL using doubled-distilled water. This solution was filtered with Whatman filter paper no. 42 and used for estimation of Na+, K+, Ca2+ and Mg2+contents using a flame photometer and ICP-OES (ICP 9000, Shimadzu, Japan), ICAR-Central Soil Salinity Research Institute, Karnal, India.

2.6. Relative Water Content

Relative water content was measured as per the protocol described by Augustine et al., 2015 [23]. Leaf samples collected from different treatments were cut into pieces of size approximately measuring around 10 cm and the fresh leaf weight was recorded. The leaves were soaked in the distilled water overnight. After soaking, excess water on the leaf surfaces was removed and turgid weight was recorded. The leaves were completely dried at 37 °C until the leaves attained a constant weight and dry weight was measured. The relative water content was calculated using the following formula:
Relative   Water   Content   RWC = Fresh   weight Dry   weight Turgid   weight   Dry   weight × 100

2.7. Biochemical Assay

Root and leaf samples sampled from control and stressed samples were used for biochemical and physiological assay and the detailed protocols were described in our previous studies [24]. Chlorophyll a, chlorophyll b, and carotenoid contents were estimated, as described by the Lichtenthaler and Wellburn (1983) method [33], and in brief, triplicate technical samples of control and treated from each genotype were taken for analysis. For each sample, 50 mg leaf sampled from a leaf of third whorl was digested with 10 mL of DMSO in a test tube at 65 °C for 4 h followed by cooling at room temperature, and absorbances were recorded at 470, 645, and 663 nm to estimate the chlorophyll a, chlorophyll b, and carotenoid contents by using the following formulae and expressed as mg g FW−1:
C h l o r o p h y l l   a = 12.21 × A 663 2.81 × A 645
C h l o r o p h y l l   b = 20.13 × A 645 5.03 × A 663
C a r o t e n o i d = 1000 × A 470 3.27 × C h l o r o p h y l l   a + 104 × C h l o r o p h y l l   b 229
Proline contents were estimated from the samples drawn from the root samples of control and stressed plants on the 16th days after imposing stress. Protocol described by Bates et al., (1973) [34] was used in our studies and in brief, 50 mg of root samples from each genotype for each treatment and control samples were homogenized in 5 mL of 3% aqueous sulphosalicylic acid and centrifuged at 10,000× g rpm for 15 min. Supernatant was separated, and 2 mL of filtrate was taken in a separate test tube, and 2 mL glacial acetic acid and 2 mL acid-ninhydrin were added, followed by heating for one hour and cooling instantly. The colour intensity was measured at 520 nm after adding the touline. The proline content was estimated by using the standard curve derived from pure L-proline and expressed as µmol g FW−1.
The total protein contents in the stressed roots of each treatment and control samples for each genotype were estimated by using the Bradford method [35,36]. The 1.0 g of root sample was homogenized in 2.0 mL of Bradford reagents, centrifuged at 10,000 rpm for 30 min, and colour development in the supernatant was measured at 595 nm. The total protein content was estimated using the standard curve deduced from bovine serum albumin and expressed as µg g FW−1.
Superoxide dismutase (SOD) activities were estimated by using the modified Beauchamp and Fridovich (1971) methods [37,38]. One gram of samples from each treatment and control root samples of each genotype were homogenized in ice-cold 50 mM Potassium phosphate buffer (pH of 7.8) by using a prechilled pestle and mortar, and centrifuged at 1000× g rpm at 4 °C for 10 min. The supernatant containing the enzyme and 50 µL of supernatant from each sample was mixed with 50 mM potassium phosphate buffer, 13 mM of methionine, 2 µM riboflavin, 0.1 mM EDTA, and 75 µM nitroblue tetrazolium, and the final volume was increased up to 3.0 mL. One blank sample was prepared without a supernatant and another blank without supernatant and nitroblue tetrazolium to calibrate the spectrophotometer reading. The absorbance was measured at 560 nm to estimate the SOD activities and was expressed as Units g FW−1. Peroxidase activities were measured using the method of Castillo et al. (1984) [39] by measuring the absorbance at 470 nm at 0-seconds, 30-seconds, and 1-minute time intervals and expressed as µmol ng FW−1 min−1.
The lipid peroxidation in the root samples of treatment and control for each genotype with triplicate technical replicates was conducted by using the Heath and Packer (1968) method [40]. One gram of root sample from each treatment and genotype was homogenized with 0.1% trichloroacetic acid buffer, centrifuged at 10,000× g rpm (4.0 °C) for 30 min. The supernatant contains malondialdehyde, and 1.0 mL of supernatant was mixed with 4 mL of 0.5% thiobarbituric acid, heated at 95 °C for 30 min, and the absorbance was measured at 532 nm; lipid peroxidation was estimated and expressed as nmol g FW−1.

3. Results

3.1. Effect of Salinity Stress on the Germination of T. arundinaceum

The germination studies were carried out in perlite-sand hydroponics by imposing the salinity stress by irrigating with salinized Hoagland solution containing 175 mM of salts. The control treatment was maintained by irrigating with the Hoagland solution. Most of the test entries showed dead roots under 175 mM and healthy roots under control (Figure 1). Only five entries, viz., IND99-907, IND01-1134, IND01-1136, IK76-48, and Bethuadahari, showed healthy roots, though there was a reduction in root number and root length (Table 2). Co 97010 recorded 54.32, 68.97, and 79.31% reductions for the shoot, leaf, and root lengths, observed in Co 97010, as compared to 29.17, 48.88, and 64.06% reductions in IND99-907, respectively. Co 97010 showed 84.7% reduction in root number, whereas IND99-907 showed only 28% reduction. The lowest reduction rate was observed for shoot length in IND01-1134 (5.88%) and Bethuadahari (15.49%), for root number in IND99-907 (28%), and for root length in Bethuadahari (5.21%).

3.2. Leaf Elongation Rate (LER) of T. arundinaceum and Sugarcane Genotypes under Salinity Stress

Based on germination studies, five T. arundinaceum accessions, viz., IND99-907, IND01-1134, IND01-1136, IK76-48, and Bethuadahari, were shortlisted for further evaluation to assess their salinity tolerance levels in perlite-sand hydroponics experiments. The 60-days-old plants were imposed with salinity stress by irrigating with salinized Hoagland solution containing 25, 75, 125, and 175 mM, and the controls were maintained by irrigating with nonsalinized Hoagland solution. The results showed a decreasing pattern in the leaf elongation rate with an increase in salinity levels (Figure 2). Leaf elongation was observed for most of the genotypes at minimal to moderate salinity levels, and a significant reduction in leaf elongation was observed at higher levels of salinity levels. The highest leaf elongation rate was observed in IND01-1136 (59.13 cm), followed by the genotype IND99-907 (58.13 cm) at 25 mM on the 16th day after imposing stress. Co 97010 showed no growth at the 175 mM saline level. IND99-907, IND01-1134, and Bethuadahari showed a consistent growth pattern at all levels of salinity, and Bethuadahari recorded the highest LER of 29.13 cm, followed by IND99-907 (27.94 cm) at 175 mM salinity at the 16th day of treatment. IND01-1136 showed high LER at a salinity stress of 25 mM, and the growth rate decreased with an increase in salinity levels.

3.3. The Effect of Various Levels of Salinity Stress on the Na/K Ratio in Roots

Root samples of T. arundinaceum were assessed for sodium and potassium contents in roots at different levels of salinity stress by a flame photometer (Table 3). Sodium content showed an increasing trend in all the genotypes. At 175 mM, IND99-907 recorded the highest sodium (19.06 mg/g) and potassium (18.79 mg/g) contents with a Na/K ratio of 1.01, indicating that genotype IND99-907 has an inherent mechanism to nullify the toxicity of sodium by an increased uptake of potassium. Similarly, IK76-48 recorded a 1.10 Na/K ratio, IND01-1136 recorded a 1.51 Na/K ratio, whereas roots of sensitive standard Co 97010 and Co 86032 completely dried and recorded 2.40 and 5.22, respectively. At 125 mM saline level, IND99-907 recorded the highest sodium (25.04 mg/g) and potassium, (23.72 mg/g) with an Na/K ratio of 1.06. However, lower Na/K ratios were recorded for IND01-1136 (0.88) and IK76-48 (0.94), whereas sensitive genotypes Co 86032 and Co 97010 recorded ratios of 1.49 and 1.59, respectively. Similarly, at 75 mM, IND99-907 showed the lowest Na/K ratio (0.54), followed by IK76-48 (0.86), IND01-1134 (1.01), and IND01-1136 (1.02), respectively. The two entries, viz., IND99-907 and IND01-1136, recorded a relatively lower Na/K ratio at all levels of salinity stress as compared to other genotypes.

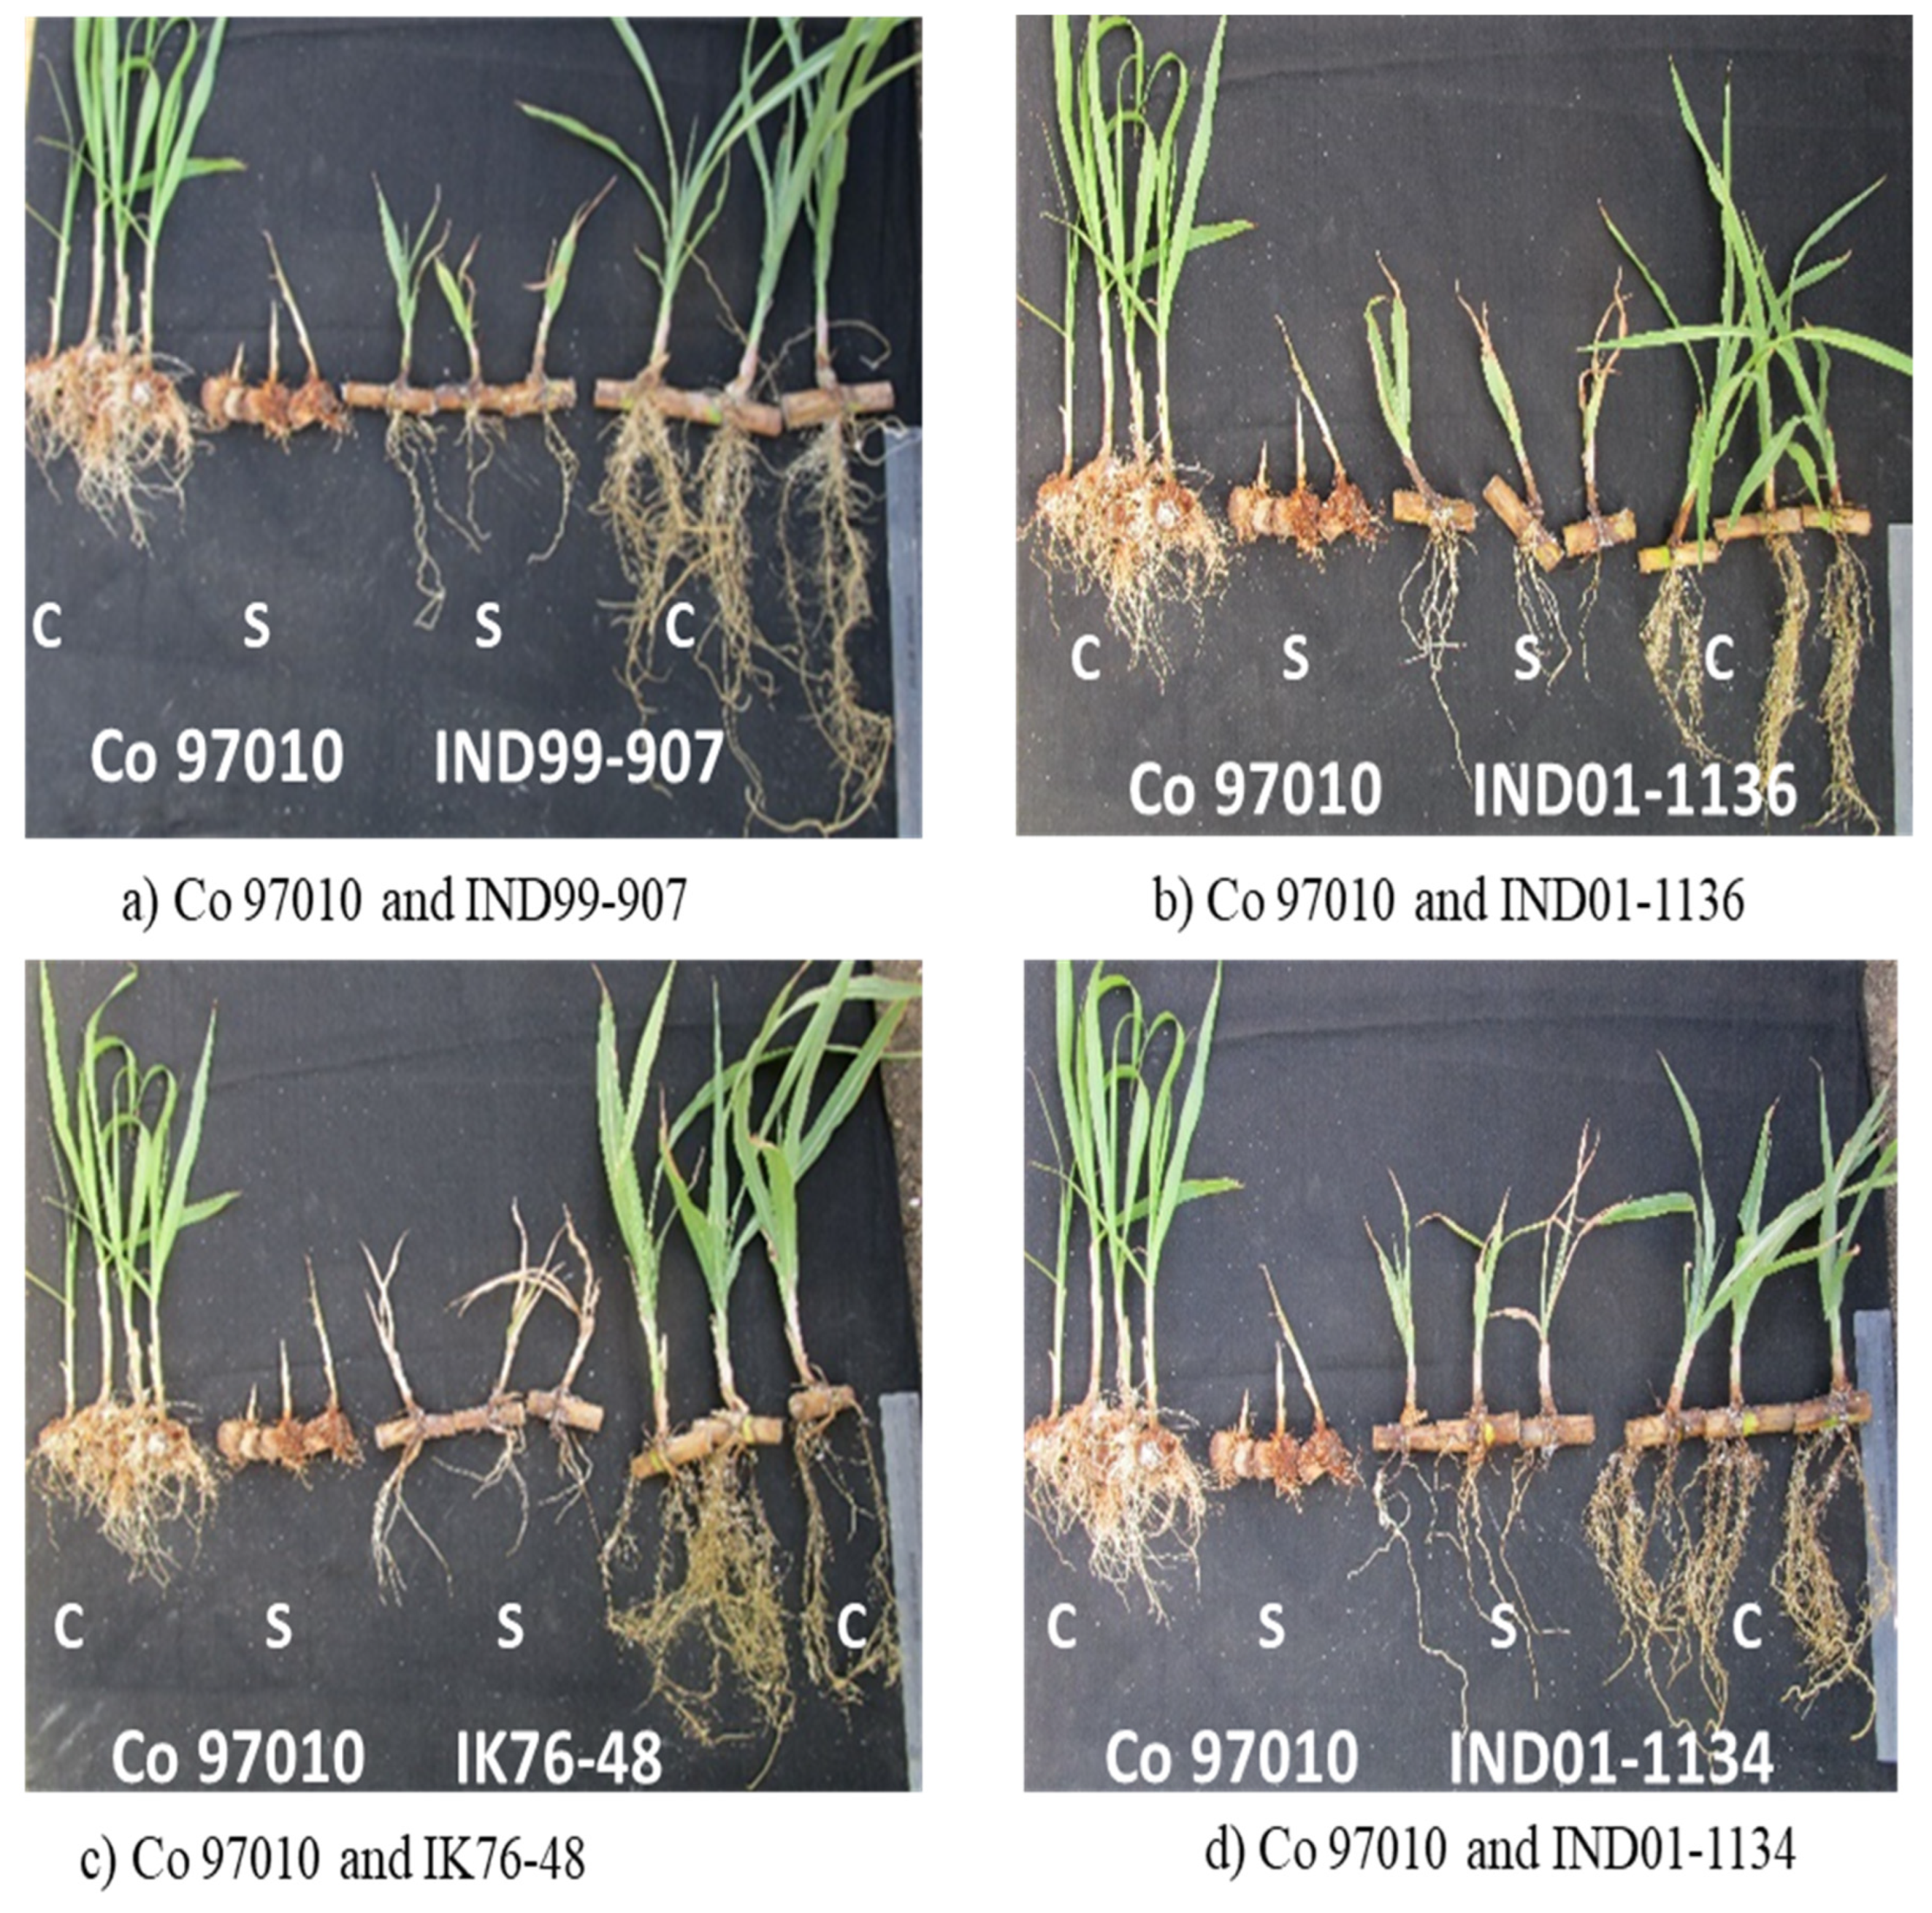
3.4. Root Anatomy under Salinity Stress

Microscopic images of the root structure showed the stelar regions of vascular tissues at various levels of salinity stress (Figure 3). Salinity-tolerant IND99-907 and sensitive Co 97010 showed clear differences in the lignification pattern of the cell wall around the metaxylem, contributing to the cell-wall thickening. Further, the root protoxylem thickness increased during the exposure to salt stress in Co 97010, Co 86032, Bethuadahari, and IND01-1134 at various levels of salinity stress. Vacuolization of cortex tissues was observed in most of the genotypes except IND99-907. No significant changes for thickening of root cell wall and metaxylem were observed in IND99-907, whereas a slight decrease in the metaxylem thickness was observed in the genotype Co 97010.

3.5. Chlorophyll a, Chlorphyll b, and Carotenoids Contents in Leaves

Photosynthetic pigments are essentially required for photosynthesis. The quantity and quality of photosynthetic pigments are important factors for plant assimilation [41]. In our studies, photosynthetic pigments such as carotenoids and chlorophyll a and b were skewed with decreasing patterns, with increases in salinity concentration for most of the genotypes, and this was in agreement with a previous study in sugarcane [12]. The highest chlorophyll a content was recorded for IND99-907 (2.33 mg g FW−1) at 175 mM, followed by IND01-1136 (1.89 mg g FW−1) and IK76-48 (1.66 mg g FW−1). A similar pattern was observed for carotenoids, with IND99-907 having the highest carotenoid content of 0.88 mg g FW−1, followed by IND01-1136 (0.78 mg g FW−1) and IK76-48 (0.76 mg g FW−1) at 175 mM. With regards to chlorophyll b, IK76-48 recorded the highest content (0.78 mg g FW−1), followed by IND99-907 (0.77 mg g FW−1) and IND01-1136 (0.75 mg g FW−1). At 125 mM salinity stress, Bethuadahari showed the highest contents of all three photosynthetic pigments, followed by IK76-48; the same was observed in the case of the salinity stress of 75 mM (Figure 4). Further comparison of pigment levels across different salinity stress levels showed that genotypes IND99-907 and IND01-1136 showed the higher contents of all three photosynthetic pigments as compared to other genotypes at 175 mM.

3.6. Relative Water Content (RWC) in Leaves under Salinity Stress

RWC is an essential indicator of water status [42] and a sensitive variable which response quickly to environmental stresses [43]. In this study, a decrease in the RWC was observed for all the genotypes with increasing salinity levels (Figure 5). At 175 mM of salinity stress, Co 97010 showed a drastic reduction in water content with less than 80% of RWC; similarly, <90% of RWC was observed in the genotype IND01-1134. Other genotypes maintained 90–95% of RWC at high salinity stress. The highest RWC was observed in IK76-48 with 93.73%, followed by 93.46% and 93.07% in IND00-1136 and Co 86032, respectively, at 175 mM of salinity stress. Genotypes IND01-1136, IK76-48, Co 86032, and Bethuadahari maintained steady levels of RWC at all levels of salt concentrations.

3.7. The Effect of Various Levels of Salinity Stress on the Accumulation of Proline

Proline plays a vital role in plant stress management by acting as an osmolyte and involving in the stabilization of subcellular structures like proteins and membranes, foraging free radicals, and buffering cellular redox potential in stress environments [44,45]. In this study, the level of proline accumulation varies with genotypes, and an overall increasing trend up to moderate levels of salinity stress and a decreasing trend at higher levels of salt stress was observed (Figure 6). Comparatively, all the other genotypes except Co 86032 and IND99-1134 showed an overall decreasing trend with increasing salinity stress. The genotypes IND99-907 and IK76-48 showed a peak at 75 mM of salinity stress with proline accumulations of 12.34 and 15.42 µmol g FW−1, respectively.

3.8. Accumulation of Total Protein under Various Levels of Salinity Stress

Proteins play a crucial role in plant stress tolerance and response since they are directly involved in the attainment of enhanced stress tolerance [46]. In this study, the protein content was observed to be following an overall decreasing trend for most of the genotypes (Figure 7). At 175 mM saline level, Bethuadahari recorded the highest protein content of 1165.93 µg g FW−1, followed by Co 97010 with 1110 µg g FW−1 of total protein content. The accession IND99-907 recorded 1181.48 µg g FW−1 of total protein content in the control, and the protein content was reduced with increase in salinity stress, recording the lowest protein content of 708.15 µg g FW−1 at 175 mM saline level. A similar pattern was observed for IND01-1136, where the protein content was 1313.33 µg g FW−1 in the control and 734.0715 µg g FW−1 was at 175 mM of salinity stress.

3.9. Superoxide Dismutase Activities under Various Levels of Salinity Stress

During stress conditions, antioxidant enzymes such as superoxide dismutase (SOD) play crucial roles in defense against plant stresses [47,48]. In this study, the SOD activity varied based on different levels of salinity stress (Figure 8), and an overall decreasing trend of SOD activity was observed for the most of the genotypes. At a 175 mM saline level, the highest SOD activity was recorded in Bethuadahari (21.94 Units g FW−1), followed by IND01-1136 (16.33 Units g FW−1), The IND99-907 showed an SOD activity of 7.16 Units g FW−1, but the sensitive Co 97010 recorded a SOD activity of 11.71 Units g FW−1. The highest SOD activity was observed for IND99-907 (32.23 Units g FW−1) at 25 mM of salinity stress.

3.10. Peroxidase Activity under Various Levels of Salinity Stress in Roots

Peroxidases are important enzymes majorly involved in the breakdown of hydrogen peroxide, and are expressed during exposure to both biotic and abiotic stresses in plants [3,49,50]. In our studies, peroxidase activity was observed to be diverse for increasing salt concentrations; there was no steady increase or decrease observed in the activity of the genotypes (Figure 9). The highest activity was observed for the sensitive Co 97010 (0.55 µ mol ng−1 min−1) at a salinity stress of 75 mM followed by IND99-907 (0.36 µ mol ng−1 min−1). The lowest peroxidase activity was observed for Co 86032 (0.10 µ mol ng−1 min−1) at a 125 mM saline level. IND99-907 showed a peak in enzyme activity (0.36 µ mol ng−1 min−1) at 75 mM of salinity stress and IND01-1136 (0.25 µ mol ng−1 min−1) at 25 mM of salinity stress.

3.11. Lipid Peroxidation in Roots

Lipid peroxidation is a major molecular mechanism and is considered as toxic to the cells, causing oxidative stress to the cell structures [51]. In this study, an overall decreasing trend was observed for all of the genotypes (Figure 10). IND99-907 and IND01-1136 showed a peak with 8.72 and 7.8 nmol g FW−1, respectively, at 25 mM of salinity stress, and a further decreasing trend was observed. IK76-48 showed the lowest lipid peroxidation profile, with values ranging between 2.20 to 2.40 nmol g FW−1. The sensitive genotype Co 97010 recorded a decreasing profile with the lowest lipid peroxidation of 3.21 nmol g FW−1at 175 mM of salinity stress. The lowest lipid peroxidation was observed in IK76-48 (2.40 nmol g FW−1), followed by the genotype Bethuadahari (2.75 nmol g FW−1) at a 175 mM saline level.

3.12. Changes in Na/K Ratio under Salinity Stress Studied Using ICP-OES

Based on physiological and biochemical assays and young leaf elongation rates, IND99-907 and IND01-1136 were shortlisted and compared with salt-sensitive genotype Co 97010 for the elemental distribution pattern of sodium, potassium, calcium, and magnesium by ICP-OES and SEM-EDX analysis (Table 4). Sodium absorption was similar in all genotypes, ranging from 21.05–22.52 mg g−1 of dry weight, but the potassium absorption was reduced under salinity stress as compared to control in most of the genotypes. IND99-907 has a higher potassium content of 9.65 mg g−1 of dry weight as compared to IND01-1136 (3.76 mg g−1 of dry weight) and Co 97010 (2.76 mg g−1 of dry weight). Estimation of the Na/K ratio by ICP-OES and SEM-EDX showed that IND-99-907 recorded the lowest Na/K ratio as compared to IND01-1136 and Co 97010. A similar trend was also observed in other cations such as calcium and magnesium.

4. Discussion

Salinity stress is a major limiting factor affecting crop productivity, and it significantly affects plant growth and biomass production [12,52,53]. Leaf elongation rate (LER) is correlated with plant growth and affects the total biomass [54]. Salt stress shortens the leaf elongation, specifically at the leaf base or growth zone, and is directly affected by salinity-induced osmatic and ionic stresses [55]. Salinity stress affects the growth and functioning of root tissues, low to moderate stress levels significantly reduces the growth and expansion of epidermal and xylem cells, whereas very negligible growth or no growth of epidermal cells and xylem vessels was observed under severe salt stress [56]. Early plant responses to salinity stress through the reduction in leaf growth [57] and reduction in LER were previously reported in many studies [58,59,60,61]. Many physiological mechanisms of associated with development or mitigation of reactive oxygen species (ROS), as well as enzymes associated with cell wall expansion and phosphorylation, are associated with the LER [62,63,64]. In the present study, salinity-sensitive standard Co 97010 showed a young leaf elongation up to 25 mM and growth ceased at 175 mM. Consistent young leaf elongation was observed in IND99-907, IND01-1136, and Bethuadahari at all levels of salinity stress. Similar observations of tolerant genotypes with increased LER/young leaf elongation were reported in maize [55] and sorghum [65,66].
The exposure of plants to salinity stress results in the accumulation of cytotoxic ions such as Na+ and Cl- ions in plant tissue, which interfere with metabolic processes resulting in premature leaf senescence and cell death [67]. Tolerant plants respond to salinity stress through three modes, viz., ionic exclusion, tissue tolerance by compartmentalization of toxic ions into vacuoles, and ion-independent tolerance by the maintenance of the turgor potential of cells or growth and water uptake through independent Na+ accumulation [67]. K+ ions are essentially required for the maintenance of the homeostasis of turgor pressure in plant tissues and co factor for many enzymatic reactions and maintaining homeostasis, playing a significant role in plant-adaptive responses to various environmental stresses [18,68]. During salinity stress, Na+ and K+ ions were identical for physicochemical properties [69,70] and compete in many ways, such as binding sites, protein, and ribosome functions, thus inhibiting many cellular processes and plant turgor homeostasis [67,71]. Hence, maintaining a balanced Na+/K+ ratio has become an important factor for the salt tolerance mechanism of plants [72]. In the present study, the salt-tolerant genotype IND99-907 showed a lower Na+/K+ ratio as compared to other T. arundinaceum genotypes and salt-sensitive Co 97010. A lower Na+/K+ ratio helps the plants in many physiological mechanisms such as promoting stomatal movement, photosynthesis, and transpiration control during salinity stresses [73,74,75].
Roots are indispensable organs for plants which help in the uptake of water and nutrients, develop a symbiotic association with microorganisms, act as an anchors for the plant’s stability, and are also used as storage organs [76]. Soil salinity hinders the water availability to plants, and roots must exhibit a higher osmatic potential to absorb the water, thereby affecting the yield. It is known that plant roots have an adaptive mechanism which changes their root morphology and structural features to resist environmental stresses [77]. Roots play a major role in salinity tolerance, as they are the first organs to become exposed to salinity stress and regulate the uptake and translocation of nutrients and water throughout the plant [78]. The root protoxylem and metaxylem thicknesses also change during exposure to abiotic stresses such as salt and drought stresses [79]. In our studies, salt tolerant IND99-907 and the sensitive Co 97010 showed clear differences in lignification of the cell wall around the metaxylem under salinity stress. No significant changes in cell-wall thickening around the metaxylem was observed in IND99-907 as compared to cell wall thickening around metaxylem and vacuolization of the cortex tissue in Co 97010. Further, the root protoxylem thickness increased during the exposure to salt stress in the Co 97010 genotype, but no significant change in the root thickness was observed in IND99-907.
Chief photosynthetic pigments are chlorophylls, while carotenoids also transfer extra energy to chlorophylls and absorb surplus energy from the same [80,81,82]. Chlorophyll and carotenoids can be found in the intrinsic part of the chloroplast and have varieties of functions including light garnering, energy transfer, photochemical redox reaction, and photoprotection [83,84]. Several studies support the quantitative decrease in the photosynthetic pigment content under the influence of salinity stress in different plants such as beans (Phaseolus vulgaris L.) [85], sunflower leaves [86], Madagascar periwinkle [57], steppe plants [82], scarlet sage [87], sorghum [41], and Salicornia prostrata and Suaeda prostrate [88]. Chlorophyll reduction due to salinity stress causes a reduction in the photosynthetic activity and a reduction of CO2 absorption [88]. In the present study, all the other genotypes except IND99-907 showed a decreasing trend in the photosynthetic pigments content with the increase of salt concentration; salinity-tolerant IND99-907 showed an increasing trend in both chlorophyll a and carotenoids content, although a decrease in chlorophyll b content at 25 mM of salinity stress was observed, and following, an increase in the same was observed as the salt concentration was increased. A similar raise in chlorophyll a content in the tolerant genotype was observed in Salicornia [88] and increases in chlorophyll a and chlorophyll b contents were observed in the tolerant genotype of maize [89] under salinity stress.
Relative water content (RWC) is a parameter for measuring the water condition in plants in terms of physiological consequences under water deficit conditions [90]. RWC drastically decreases in sensitive genotypes and is maintained at a higher level in tolerant genotypes under abiotic stresses [25,26]. In the present study, the decreasing trend for RWC was observed for all of the genotypes, and a drastic reduction in RWC below 80% was observed for sensitive genotype Co 97010 at 175 mM. Tolerant genotype IND99-907 maintained the stable RWC above 95% up to 125 mM and 90% of RWC at 175 mM. These results were in accordance with previous studies regarding maintaining a higher level of RWC in tolerant genotypes [91].
Proline accumulation in response to signaling pathways associated with reactive oxygen species during abiotic stresses was widely studied and reviewed [92,93]. It acts as an osmolyte and helps in stabilizing subcellular structures, scavenging free radicals, and buffering cellular redox potential under stressful conditions [94]. In the present study, all the genotypes showed increased accumulation of proline up to a certain level of salinity stress and decreasing trends at higher levels of salinity stress. The proline accumulation was very high in tolerant genotypes such as IND99-907, IK76-48, and Bethuadahari, and lower levels of accumulation were observed in sensitive genotypes such as Co 97010 and IND01-1134. The increased proline content under salinity stress was reported in previous studies in many crops [95].
Proteins play a crucial role in plant stress tolerance and are directly associated with various metabolic pathways to enhance stress tolerance [46,50]. The accumulation of salt stress-induced proteins has a significant role in osmatic adjustments [96,97,98]. Novel proteins are found to be involved in the plant stress response under salt stress accumulation, and differential expression of certain proteins were identified in alfalfa roots [99], sugarcane shoots [100], and chickpea genotypes [98]. Proteins such as heat shock proteins, osmotin-like proteins, TSI-1 protein, and protein inhibitors were observed to be upregulated in potatoes [101]. Studies have shown an increase in soluble protein content in the tolerant genotypes than the sensitive ones in plants such as tomato [97] and Paulownia [102]. In the current study, salinity-sensitive genotypes showed an increased accumulation of soluble proteins as compared to IND99-907 and IND01-1136.
Superoxide dismutase (SOD) is an enzyme that catalyzes the dismutation of superoxide radicals to oxygen and hydrogen peroxide and acts as a first line of defense against reactive oxygen species (ROS) [48,103]. Stresses like heat, drought, salinity, and pathogens are said to increase the activity of SOD [104,105,106], which is important for the development of plant stress tolerance [47,106]. Studies have shown the increase in the SOD activity in tolerant genotypes in various plants such as cotton [107], Siberian elm [108], and wheat [109]. In this study, the salt-sensitive genotype Co 97010 showed a decrease in SOD activity. SOD activity was higher, at 25 mM of salinity stress (>30 Units/g FW) for IND99-907.
Peroxidases are involved in various physiological processes, including lignin formation, suberin formation, cross-linking of cell wall constituents, and phytoalexin synthesis; they are also involved in the apoptosis of the infection site by activating the hypersensitive response and thereby limiting the pathogen development [110,111]. Ascorbate peroxidases are scavenging enzymes, which are particular to plants and algae, and are requisite in the detoxification of hydrogen peroxide and other hydroxyl radicals [112]. In a study carried out using Vigna seedlings, the effect of salinity stress on peroxidase activity showed maximum activity of peroxidases under higher-stress conditions [113]. Similarly, in sweet basil, the pyrogallol peroxidase (PPOX) and guaiacol peroxidase (GPOX) activities increased during plant growth [114]. In the present study, an overall increasing trend of POD activity was observed for all of the genotypes up to a certain level of salt stress and then a decrease in the activity was observed. Salt sensitive Co 97010 showed an increased POD as compared to tolerant T. arundinaceum genotypes IND99-907 and IND01-1136.
Lipid peroxidation is a process where oxidative agents such as free radicals react with the lipids and cause oxidative cell damage [84,115]. Lipid peroxidation is considered the major molecular mechanism involved in being toxic to the cells, causing oxidative stress to the cell structures, which eventually leads to cell death [51]. Peroxidation of lipids is the reason for the damage to proteins, DNA, and pigments [116]. Studies have reported lower lipid peroxidation in tolerant genotypes such as maize [117], salt-tolerant Plantago maritima, and salt-sensitive Plantago media [17], tomato [15], and sugar beet [16]. In the present study, an overall decreasing trend of lipid peroxidation was observed for all of the genotypes. All the genotypes recorded a lipid peroxidation of <6 nmoles/g FW, and the lowest value was observed for IK76-48, with <3 nmoles/g FW at a salinity of 175 mM. Morphological, root anatomical, and physiological studies revealed that IND99-907 and IND01-1136 showed higher levels of salinity stress tolerance as compared to other genotypes.

5. Conclusions

Salinity stress significantly affected all the growth parameters of all the sugarcane genotypes. There was a decrease in the root biomass, shoot biomass, leaf length, root number, leaf elongation rate, relative water content, photosynthetic pigments, proline accumulation, and enzyme activities such as peroxidase and superoxide dismutase, in almost all genotypes. Although there were differential performances among genotypes, IND99-907 was the superior for many parameters such as root number and length of root, shoot, and leaf, and young leaf elongation rate, and for physiological traits under salinity stress. The root anatomy studies showed the consistent structures for protoxylem and metaxylem in the stele of the roots as compared to damaged stelar regions in sensitive genotype Co 97010. The accession IND99-907 is a strong candidate genotype with a higher salt tolerance and is suitable for utilization in sugarcane crop improvement programmes.

Author Contributions

Project formulation and execution of the experiment: C.M., C.A., K.S. and R.K.; estimation of sodium and potassium analysis using ICP-OES method: P.D., A.K., R.K. and C.M.; root anatomical studies: R.V., C.M., V.S. and V.V.; biochemical and physiological analysis: S.D., T.S.S.P., J.A.N., H.K.M.S., A.K.R., V.S. and G.S.S.; data analysis and drafting of the manuscript: P.V., C.M., C.A., G.H., A.K.R. and R.K. All authors have read and agreed to the published version of the manuscript.

Funding

The present study was funded by ‘Science and Engineering Research Board, Department of Science and Technology (DST-SERB)’ under Early Career Research Award (File No.: DST/SERB/ECR/2017/000349).

Institutional Review Board Statement

Not applicable.

Informed Consent Statement

Not applicable.

Acknowledgments

The authors are thankfully acknowledging the ICAR-Sugarcane Breeding Institute, Coimbatore-641007, India for providing the necessary support to the study.

Conflicts of Interest

The authors declare no conflict of interest.

References

  1. Ladeiro, B. Saline Agriculture in the 21st Century: Using Salt Contaminated Resources to Cope Food Requirements. J. Bot. 2012, 2012, 310705. [Google Scholar] [CrossRef]
  2. Latef, A.A.H.A.; Omer, A.M.; Badawy, A.A.; Osman, M.S.; Ragaey, M.M. Strategy of Salt Tolerance and Interactive Impact of Azotobacter Chroococcum and/or Alcaligenes Faecalis Inoculation on Canola (Brassica napus L.) Plants Grown in Saline Soil. Plants 2021, 10, 110. [Google Scholar] [CrossRef] [PubMed]
  3. Omer, A.M.; Osman, M.S.; Badawy, A.A. Inoculation with Azospirillum Brasilense and/or Pseudomonas Geniculata Reinforces Flax (Linum usitatissimum) Growth by Improving Physiological Activities under Saline Soil Conditions. Bot. Stud. 2022, 63, 15. [Google Scholar] [CrossRef] [PubMed]
  4. Mahajan, S.; Tuteja, N. Cold, Salinity and Drought Stresses: An Overview. Arch. Biochem. Biophys. 2005, 444, 139–158. [Google Scholar] [CrossRef]
  5. Tuteja, N. Mechanisms of High Salinity Tolerance in Plants. Methods Enzymol. 2007, 428, 419–438. [Google Scholar] [CrossRef]
  6. Li, C.; Lei, J.; Zhao, Y.; Xu, X.; Li, S. Effect of Saline Water Irrigation on Soil Development and Plant Growth in the Taklimakan Desert Highway Shelterbelt. Soil Tillage Res. 2015, 146, 99–107. [Google Scholar] [CrossRef]
  7. IISR. ICAR-Indian Institute of Sugarcane Research Vision 2050; Indian Council of Agriculture Research: New Delhi, India, 2015. Available online: https://iisr.icar.gov.in/iisr/download/publications/iisrvision2050.pdf (accessed on 19 March 2023).
  8. Jain, R. India’s Green Push for Second-Generation Bioethanol. Available online: https://www.im4change.org/latest-news-updates/india-s-green-push-for-second-generation-bioethanol-rahul-jain.html (accessed on 19 March 2023).
  9. Sun, B.; Liu, G.L.; Phan, T.T.; Yang, L.T.; Li, Y.R.; Xing, Y.X. Effects of Cold Stress on Root Growth and Physiological Metabolisms in Seedlings of Different Sugarcane Varieties. Sugar Tech. 2017, 19, 165–175. [Google Scholar] [CrossRef]
  10. FAOSTAT. Crops and Livestock Products, Food and Agriculture Organization of the United Nations. Available online: https://fenix.fao.org/faostat/internal/en/#data/QCL (accessed on 19 March 2023).
  11. Wahid, A. Analysis of Toxic and Osmotic Effects of Sodium Chloride on Leaf Growth and Economic Yield of Sugarcane. Bot. Bull. Acad. Sin. 2004, 45, 133–141. [Google Scholar]
  12. Saxena, P.; Srivastava, R.P.; Sharma, M.L. Studies on Salinity Stress Tolerance in Sugarcane Varieties. Sugar Tech. 2010, 12, 59–63. [Google Scholar] [CrossRef]
  13. Wahid, A.; Rao, A.-U.-R.; Rasul, E. Field Crops Research Identification of Salt Tolerance Traits in Sugarcane Lines. Field Crop. Res. 1997, 54, 9–17. [Google Scholar] [CrossRef]
  14. Mangrauthia, S.K.; Bhogireddy, S.; Agarwal, S.; Prasanth, V.V.; Voleti, S.R.; Neelamraju, S.; Subrahmanyam, D. Genome-Wide Changes in MicroRNA Expression during Short and Prolonged Heat Stress and Recovery in Contrasting Rice Cultivars. J. Exp. Bot. 2017, 68, 2399–2412. [Google Scholar] [CrossRef] [PubMed]
  15. Shalata, A.; Tal, M. The Effect of Salt Stress on Lipid Peroxidation and Antioxidants in the Leaf of the Cultivated Tomato and Its Wild Salt-Tolerant Relative Lycopersicon Pennellii. Physiol. Plant. 1998, 104, 169–174. [Google Scholar] [CrossRef]
  16. Bor, M.; Özdemir, F.; Türkan, I. The Effect of Salt Stress on Lipid Peroxidation and Antioxidants in Leaves of Sugar Beet Beta Vulgaris L. and Wild Beet Beta Maritima L. Plant Sci. 2003, 164, 77–84. [Google Scholar] [CrossRef]
  17. Sekmen, A.H.; Türkan, I.; Takio, S. Differential Responses of Antioxidative Enzymes and Lipid Peroxidation to Salt Stress in Salt-Tolerant Plantago Maritima and Salt-Sensitive Plantago Media. Physiol. Plant. 2007, 131, 399–411. [Google Scholar] [CrossRef] [PubMed]
  18. Shabala, S.; Pottosin, I. Regulation of Potassium Transport in Plants under Hostile Conditions: Implications for Abiotic and Biotic Stress Tolerance. Physiol. Plant. 2014, 151, 257–279. [Google Scholar] [CrossRef] [PubMed]
  19. Gupta, B.; Huang, B. Mechanism of Salinity Tolerance in Plants: Physiological, Biochemical, and Molecular Characterization. Int. J. Genom. 2014, 2014, 701596. [Google Scholar] [CrossRef]
  20. Ji, H.; Pardo, J.M.; Batelli, G.; Van Oosten, M.J.; Bressan, R.A.; Li, X. The Salt Overly Sensitive (SOS) Pathway: Established and Emerging Roles. Mol. Plant 2013, 6, 275–286. [Google Scholar] [CrossRef]
  21. Welker, C.A.D.; McKain, M.R.; Vorontsova, M.S.; Peichoto, M.C.; Kellogg, E.A. Plastome Phylogenomics of Sugarcane and Relatives Confirms the Segregation of the Genus Tripidium (Poaceae: Andropogoneae). Taxon 2019, 68, 246–267. [Google Scholar] [CrossRef]
  22. NCBI-Taxonomy-Browser. Taxonomy Browser-Tripidium Arundinaceum. Available online: https://www.ncbi.nlm.nih.gov/Taxonomy/Browser/wwwtax.cgi?id=50346 (accessed on 19 March 2023).
  23. Augustine, S.M.; Cherian, A.V.; Syamaladevi, D.P.; Subramonian, N. Erianthus Arundinaceus HSP70 (EaHSP70) Acts as a Key Regulator in the Formation of Anisotropic Interdigitation in Sugarcane (Saccharum spp. Hybrid) in Response to Drought Stress. Plant Cell Physiol. 2015, 56, 2368–2380. [Google Scholar] [CrossRef]
  24. Augustine, S.M.; Ashwin Narayan, J.; Syamaladevi, D.P.; Appunu, C.; Chakravarthi, M.; Ravichandran, V.; Tuteja, N.; Subramonian, N. Introduction of Pea DNA Helicase 45 into Sugarcane (Saccharum spp. Hybrid) Enhances Cell Membrane Thermostability and Upregulation of Stress-Responsive Genes Leads to Abiotic Stress Tolerance. Mol. Biotechnol. 2015, 57, 475–488. [Google Scholar] [CrossRef]
  25. Augustine, S.M.; Narayan, J.A.; Syamaladevi, D.P.; Appunu, C.; Chakravarthi, M.; Ravichandran, V.; Tuteja, N.; Subramonian, N. Overexpression of EaDREB2 and Pyramiding of EaDREB2 with the Pea DNA Helicase Gene (PDH45) Enhance Drought and Salinity Tolerance in Sugarcane (Saccharum spp. Hybrid). Plant Cell Rep. 2015, 34, 247–263. [Google Scholar] [CrossRef] [PubMed]
  26. Augustine, S.M.; Narayan, J.A.; Syamaladevi, D.P.; Appunu, C.; Chakravarthi, M.; Ravichandran, V.; Subramonian, N. Erianthus Arundinaceus HSP70 (EaHSP70) Overexpression Increases Drought and Salinity Tolerance in Sugarcane (Saccharum spp. Hybrid). Plant Sci. 2015, 232, 23–34. [Google Scholar] [CrossRef] [PubMed]
  27. Wang, W.; Li, R.; Wang, H.; Qi, B.; Jiang, X.; Zhu, Q.; Cai, D.; Tang, X.; Zhao, Q. Sweetcane (Erianthus arundinaceus) as a Native Bioenergy Crop with Environmental Remediation Potential in Southern China: A Review. GCB Bioenergy 2019, 11, 1012–1025. [Google Scholar] [CrossRef]
  28. Mohanan, M.V.; Pushpanathan, A.; Padmanabhan, S.; Sasikumar, T.; Jayanarayanan, A.N.; Selvarajan, D.; Ramalingam, S.; Ram, B.; Chinnaswamy, A. Overexpression of Glyoxalase III Gene in Transgenic Sugarcane Confers Enhanced Performance under Salinity Stress. J. Plant Res. 2021, 134, 1083–1094. [Google Scholar] [CrossRef] [PubMed]
  29. Peter, S.C.; Murugan, N.; Mohanan, M.V.; Sasikumar, S.P.T.; Selvarajan, D.; Jayanarayanan, A.N.; Shivalingamurthy, S.G.; Chennappa, M.; Ramanathan, V.; Govindakurup, H.; et al. Isolation, Characterization and Expression Analysis of Stress Responsive Plant Nuclear Transcriptional Factor Subunit (NF-YB2) from Commercial Saccharum Hybrid and Wild Relative Erianthus arundinaceus. 3 Biotech 2020, 10, 304. [Google Scholar] [CrossRef] [PubMed]
  30. Pachakkil, B.; Terajima, Y.; Ohmido, N.; Ebina, M.; Irei, S.; Hayashi, H.; Takagi, H. Cytogenetic and Agronomic Characterization of Intergeneric Hybrids between Saccharum spp. Hybrid and Erianthus arundinaceus. Sci. Rep. 2019, 9, 1748. [Google Scholar] [CrossRef]
  31. Nair, N.V. Sugarcane Breeding Institute, Coimbatore: A Perspective. Sugar Tech. 2008, 10, 285–292. [Google Scholar] [CrossRef]
  32. Snecdecor, G.W.; Cochran, W.G. Statistical Methods, 8th ed.; Iowa State University Press: Ames, IA, USA, 1989; ISBN 978-0-813-81561-9. [Google Scholar]
  33. Lichtenthaler, H.K.; Wellburn, A.R. Determination of Total Carotenoids and Chlorophylls a and b of Leaf Extracts in Different Solvents. Biochem. Soc. Trans. 1983, 11, 591–592. [Google Scholar] [CrossRef]
  34. Bates, L.S.; Waldren, R.P.; Teare, I.D. Rapid Determination of Free Proline for Water-Stress Studies. Plant Soil 1973, 39, 205–207. [Google Scholar] [CrossRef]
  35. Bradford, M.M. A Rapid and Sensitive Method for the Quantitation of Microgram Quantities of Protein Utilizing the Principle of Protein-Dye Binding. Anal. Biochem. 1976, 72, 248–254. [Google Scholar] [CrossRef]
  36. Boaretto, L.F.; Carvalho, G.; Borgo, L.; Creste, S.; Landell, M.G.A.; Mazzafera, P.; Azevedo, R.A. Water Stress Reveals Differential Antioxidant Responses of Tolerant and Non-Tolerant Sugarcane Genotypes. Plant Physiol. Biochem. 2014, 74, 165–175. [Google Scholar] [CrossRef] [PubMed]
  37. Beauchamp, C.; Fridovich, I. Superoxide Dismutase: Improved Assays and an Assay Applicable to Acrylamide Gels. Anal. Biochem. 1971, 44, 276–287. [Google Scholar] [CrossRef] [PubMed]
  38. Madamanchi, N.R.; Donahue, J.L.; Cramer, C.L.; Alscher, R.G.; Pedersen, K. Differential Response of Cu, Zn Superoxide Dismutases in Two Pea Cultivars during a Short-Term Exposure to Sulfur Dioxide. Plant Mol. Biol. 1994, 26, 95–103. [Google Scholar] [CrossRef] [PubMed]
  39. Castillo, F.J.; Penel, C.; Greppin, H. Peroxidase Release Induced by Ozone in Sedum Album Leaves. Plant Physiol. 1984, 74, 846–851. [Google Scholar] [CrossRef]
  40. Heath, R.L.; Packer, L. Photoperoxidation in Isolated Chloroplasts. I. Kinetics and Stoichiometry of Fatty Acid Peroxidation. Arch. Biochem. Biophys. 1968, 125, 189–198. [Google Scholar] [CrossRef]
  41. Sayyad-Amin, P.; Jahansooz, M.R.; Borzouei, A.; Ajili, F. Changes in Photosynthetic Pigments and Chlorophyll-a Fluorescence Attributes of Sweet-Forage and Grain Sorghum Cultivars under Salt Stress. J. Biol. Phys. 2016, 42, 601–620. [Google Scholar] [CrossRef]
  42. Soltys-Kalina, D.; Plich, J.; Strzelczyk-Żyta, D.; Śliwka, J.; Marczewski, W. The Effect of Drought Stress on the Leaf Relative Water Content and Tuber Yield of a Half-Sib Family of ‘Katahdin’-Derived Potato Cultivars. Breed. Sci. 2016, 66, 328–331. [Google Scholar] [CrossRef] [PubMed]
  43. Tanentzap, F.M.; Stempel, A.; Ryser, P. Reliability of Leaf Relative Water Content (RWC) Measurements after Storage: Consequences for in Situ Measurements. Botany 2015, 93, 535–541. [Google Scholar] [CrossRef]
  44. Hayat, S.; Hayat, Q.; Alyemeni, M.N.; Wani, A.S.; Pichtel, J.; Ahmad, A. Role of Proline under Changing Environments: A Review. Plant Signal. Behav. 2012, 7, 1456–1466. [Google Scholar] [CrossRef]
  45. Hebat-Allah, A.H.; Shifaa, O.A.; Sahar, K.M.K.; Fatma, M.E.; Ali, B. Grain-Priming with L-Arginine Improves the Growth Drought Stress. Plants 2022, 11, 1219. [Google Scholar] [CrossRef]
  46. Kosová, K.; Prášil, I.T.; Vítámvás, P. Protein Contribution to Plant Salinity Response and Tolerance Acquisition. Int. J. Mol. Sci. 2013, 14, 6757–6789. [Google Scholar] [CrossRef] [PubMed]
  47. Bowler, C.; Van Montagu, M.; Inzé, D. Superoxide Dismutase and Stress Tolerance. Annu. Rev. Plant Physiol. Plant Mol. Biol. 1992, 43, 83–116. [Google Scholar] [CrossRef]
  48. Alscher, R.G.; Erturk, N.; Heath, L.S. Role of Superoxide Dismutases (SODs) in Controlling Oxidative Stress in Plants. J. Exp. Bot. 2002, 53, 1331–1341. [Google Scholar] [CrossRef]
  49. Huseynova, I.M.; Aliyeva, D.R.; Aliyev, J.A. Plant Responses to Stresses: Role of Ascorbate Peroxidase in the Antioxidant Protection. Genet. Mol. Biol. 2013, 4, 142–158. [Google Scholar] [CrossRef]
  50. Attia, M.S.; Hashem, A.H.; Badawy, A.A.; Abdelaziz, A.M. Biocontrol of Early Blight Disease of Eggplant Using Endophytic Aspergillus Terreus: Improving Plant Immunological, Physiological and Antifungal Activities. Bot. Stud. 2022, 63, 26. [Google Scholar] [CrossRef] [PubMed]
  51. Repetto, M.; Semprine, J.; Boveris, A. Lipid Peroxidation: Chemical Mechanism, Biological Implications and Analytical Determination. In Lipid Peroxidation; Catala, A., Ed.; IntechOpen: London, UK, 2012; pp. 3–30. ISBN 978-953-51-0716-3. [Google Scholar]
  52. Gandonou, C.B.; Errabii, T.; Abrini, J.; Idaomar, M.; Senhaji, N.S. Selection of Callus Cultures of Sugarcane (Saccharum sp.) Tolerant to NaCl and Their Response to Salt Stress. Plant Cell Tissue Organ Cult. 2006, 87, 9–16. [Google Scholar] [CrossRef]
  53. Chiconato, D.A.; da Silveira Sousa Junior, G.; dos Santos, D.M.M.; Munns, R. Adaptation of Sugarcane Plants to Saline Soil. Environ. Exp. Bot. 2019, 162, 201–211. [Google Scholar] [CrossRef]
  54. Xu, Q.; Krishnan, S.; Merewitz, E.; Xu, J.; Huang, B. Gibberellin-Regulation and Genetic Variations in Leaf Elongation for Tall Fescue in Association with Differential Gene Expression Controlling Cell Expansion. Sci. Rep. 2016, 6, 30258. [Google Scholar] [CrossRef]
  55. Neves-Piestun, B.G.; Bernstein, N. Salinity-Induced Inhibition of Leaf Elongation in Maize Is Not Mediated by Changes in Cell Wall Acidification Capacity. Plant Physiol. 2001, 125, 1419–1428. [Google Scholar] [CrossRef]
  56. Fricke, W.; Peters, W.S. The Biophysics of Leaf Growth in Salt-Stressed Barley. A Study at the Cell Level. Plant Physiol. 2002, 129, 374–388. [Google Scholar] [CrossRef]
  57. Jaleel, C.A.; Sankar, B.; Sridharan, R.; Panneerselvam, R. Soil Salinity Alters Growth, Chlorophyll Content, and Secondary Metabolite Accumulation in Catharanthus Roseus. Turk. J. Biol. 2008, 32, 79–83. [Google Scholar]
  58. Cramer, G.R. Differential Effects of Salinity on Leaf Elongation Kinetics of Three Grass Species. Plant Soil 2003, 253, 233–244. [Google Scholar] [CrossRef]
  59. Cramer, G.R.; Bowman, D.C. Short-Term Leaf Elongation Kinetics of Maize in Response to Salinity Are Independent of the Root. Plant Physiol. 1991, 253, 233–244. [Google Scholar] [CrossRef] [PubMed]
  60. Bernstein, N.; Silk, W.; Lauchli, A. Growth and Development of Sorghum Leaves under Conditions of NaCl Stress. Planta 1993, 191, 433–439. [Google Scholar] [CrossRef]
  61. Jamil, M.; Rehman, S.U.; Kui, J.L.; Jeong, M.K.; Kim, H.S.; Eui, S.R. Salinity Reduced Growth PS2 Photochemistry and Chlorophyll Content in Radish. Sci. Agric. 2007, 62, 111–118. [Google Scholar] [CrossRef]
  62. Rodrıguez, A.A.; Grunberg, K.A.; Taleisnik, E.L. Reactive Oxygen Species in the Elongation Zone of Maize Leaves Are Necessary for Leaf Extension. J. Plant Physiol. 2002, 129, 1627–1632. [Google Scholar] [CrossRef]
  63. Rodrıguez, A.A.; Lascano, H.R.; Bustos, D.; Taleisnik, E. Salinity-Induced Decrease in NADPH Oxidase Activity in the Maize Leaf Blade Elongation Zone. J. Plant Physiol. 2007, 164, 223–230. [Google Scholar] [CrossRef]
  64. Ortega, L.; Fry, S.C.; Taleisnik, E. Why Are Chloris Gayana Leaves Shorter in Salt-Affected Plants? Analyses in the Elongation Zone. J. Exp. Bot. 2006, 57, 3945–3952. [Google Scholar] [CrossRef]
  65. de Lacerda, C.F.; Cambraia, J.; Oliva, M.A.; Ruiz, H.A.; Prisco, J.T. Solute Accumulation and Distribution during Shoot and Leaf Development in Two Sorghum Genotypes under Salt Stress. Environ. Exp. Bot. 2003, 49, 107–120. [Google Scholar] [CrossRef]
  66. Azooz, M.M.; Shaddad, M.A.; Abdel-Latef, A.A. Leaf Growth and K+/NA+ Ratio as an Indication of the Salt Tolerance of Three Sorghum Cultivars Grown under Salinity Stress and Iaa Treatment. Acta Agron. Hung. 2004, 52, 287–296. [Google Scholar] [CrossRef]
  67. Munns, R.; Tester, M. Mechanisms of Salinity Tolerance. Annu. Rev. Plant Biol. 2008, 59, 651–681. [Google Scholar] [CrossRef] [PubMed]
  68. Maathuis, F.J. Physiological Functions of Mineral Macronutrients. Curr. Opin. Plant Biol. 2009, 12, 250–258. [Google Scholar] [CrossRef] [PubMed]
  69. Wakeel, A. Potassium-Sodium Interactions in Soil and Plant under Saline-Sodic Conditions. J. Plant Nutr. Soil Sci. 2013, 176, 344–354. [Google Scholar] [CrossRef]
  70. Almeida, D.M.; Margarida Oliveira, M.; Saibo, N.J.M. Regulation of Na+and K+homeostasis in Plants: Towards Improved Salt Stress Tolerance in Crop Plants. Genet. Mol. Biol. 2017, 40, 326–345. [Google Scholar] [CrossRef]
  71. Cabot, C.; Sibole, J.V.; Barceló, J.; Poschenrieder, C. Lessons from Crop Plants Struggling with Salinity. Plant Sci. 2014, 226, 2–13. [Google Scholar] [CrossRef]
  72. Assaha, D.V.M.; Ueda, A.; Saneoka, H.; Al-Yahyai, R.; Yaish, M.W. The Role of Na+ and K+ Transporters in Salt Stress Adaptation in Glycophytes. Front. Physiol. 2017, 8, 509. [Google Scholar] [CrossRef]
  73. Muhammed, S.; Akbar, M.; Neue, H.U. Effect of Na/Ca and Na/K Ratios in Saline Culture Solution on the Growth and Mineral Nutrition of Rice (Oryza sativa L.). Plant Soil 1987, 104, 57–62. [Google Scholar] [CrossRef]
  74. Chhipa, B.R.; Lal, P. Na/K Ratios as the Basis of Salt Tolerance in Wheat. Aust. J. Agric. Res. 1995, 46, 533–539. [Google Scholar] [CrossRef]
  75. Lee, K.S.; Choi, W.Y.; Ko, J.C.; Kim, T.S.; Gregorio, G.B. Salinity Tolerance of Japonica and Indica Rice (Oryza sativa L.) at the Seedling Stage. Planta 2003, 216, 1043–1046. [Google Scholar] [CrossRef]
  76. Khan, M.A.; Gemenet, D.C.; Villordon, A. Root System Architecture and Abiotic Stress Tolerance: Current Knowledge in Root and Tuber Crops. Front. Plant Sci. 2016, 7, 1584. [Google Scholar] [CrossRef]
  77. Lynch, J. Root Architecture and Plant Productivity. Plant Physiol. 1995, 109, 7–13. [Google Scholar] [CrossRef] [PubMed]
  78. Rahneshan, Z.; Nasibi, F.; Moghadam, A.A. Effects of Salinity Stress on Some Growth, Physiological, Biochemical Parameters and Nutrients in Two Pistachio (Pistacia vera L.) Rootstocks. J. Plant Interact. 2018, 13, 73–82. [Google Scholar] [CrossRef]
  79. Hoque, M.I.U.; Uddin, M.N.; Fakir, M.S.A.; Rasel, M. Drought and Salinity Affect Leaf and Root Anatomical Structures in Three Maize Genotypes. J. Bangladesh Agric. Univ. 2018, 16, 47–55. [Google Scholar] [CrossRef]
  80. Demmig-Adams, B.; Gilmore, A.M.; Adams, W.W. In Vivo Functions of Carotenoids in Higher Plants. FASEB J. 1996, 10, 403–412. [Google Scholar] [CrossRef]
  81. Ladygin, V.G.; Shirshikova, G.N. The Current Concepts of Functional Role of Carotenoids in the Eukaryotic Chloroplasts. Zh. Obshch. Biol. 2006, 67, 163–189. [Google Scholar] [PubMed]
  82. Ivanov, L.A.; Ivanova, L.A.; Ronzhina, D.A.; Yudina, P.K. Changes in the Chlorophyll and Carotenoid Contents in the Leaves of Steppe Plants along a Latitudinal Gradient in South Ural. Russ. J. Plant Physiol. 2013, 60, 812–820. [Google Scholar] [CrossRef]
  83. Hardo Panintingjati Brotosudarmo, T.; Limantara, L.; Dwi Chandra, R. Heriyanto Chloroplast Pigments: Structure, Function, Assembly and Characterization. In Plant Growth and Regulation-Alterations to Sustain Unfavorable Conditions; Ratnadewi, D., Hamim, Eds.; IntechOpen: London, UK, 2018; pp. 1–111. ISBN 978-1-83881-786-2. [Google Scholar]
  84. Badawy, A.A.; Alotaibi, M.O.; Abdelaziz, A.M.; Osman, M.S.; Khalil, A.M.A.; Saleh, A.M.; Mohammed, A.E.; Hashem, A.H. Enhancement of Seawater Stress Tolerance in Barley by the Endophytic Fungus Aspergillus Ochraceus. Metabolites 2021, 11, 428. [Google Scholar] [CrossRef]
  85. Taïbi, K.; Taïbi, F.; Ait Abderrahim, L.; Ennajah, A.; Belkhodja, M.; Mulet, J.M. Effect of Salt Stress on Growth, Chlorophyll Content, Lipid Peroxidation and Antioxidant Defence Systems in Phaseolus vulgaris L. S. Afr. J. Bot. 2016, 105, 306–312. [Google Scholar] [CrossRef]
  86. Santos, C.V. Regulation of Chlorophyll Biosynthesis and Degradation by Salt Stress in Sunflower Leaves. Sci. Hortic. 2004, 103, 93–99. [Google Scholar] [CrossRef]
  87. Grzeszczuk, M.; Salachna, P.; Meller, E. Changes in Photosynthetic Pigments, Total Phenolic Content, and Antioxidant Activity of Salvia Coccinea Buc’hoz Ex Etl. Induced by Exogenous Salicylic Acid and Soil Salinity. Molecules 2018, 23, 1296. [Google Scholar] [CrossRef]
  88. Akcin, A.; Yalcin, E. Effect of Salinity Stress on Chlorophyll, Carotenoid Content, and Proline in Salicornia Prostrata Pall. and Suaeda prostrata Pall. subsp. Prostrata (Amaranthaceae). Rev. Bras. Bot. 2016, 39, 101–106. [Google Scholar] [CrossRef]
  89. Molazem, D.; Qurbanov, E.M.; Dunyamaliyev, S.A. Role of Proline, Na and Chlorophyll Content in Salt Tolerance of Corn (Zea mays L.). Am. J. Agric. Environ. Sci. 2010, 9, 319–324. [Google Scholar]
  90. Barrs, H.; Weatherley, P. A Re-Examination of the Relative Turgidity Technique for Estimating Water Deficits in Leaves. Aust. J. Biol. Sci. 1962, 15, 413–428. [Google Scholar] [CrossRef]
  91. Hand, M.J.; Taffouo, V.D.; Nouck, A.E.; Nyemene, K.P.J.; Tonfack, L.B.; Meguekam, T.L.; Youmbi, E. Effects of Salt Stress on Plant Growth, Nutrient Partitioning, Chlorophyll Content, Leaf Relative Water Content, Accumulation of Osmolytes and Antioxidant Compounds in Pepper (Capsicum annuum L.) Cultivars. Not. Bot. Horti Agrobot. Cluj-Napoca 2017, 45, 481–490. [Google Scholar] [CrossRef]
  92. Liang, X.; Zhang, L.; Natarajan, S.K.; Becker, D.F. Proline Mechanisms of Stress Survival. Antioxid. Redox Signal. 2013, 19, 998–1011. [Google Scholar] [CrossRef]
  93. Osman, M.S.; Badawy, A.A.; Osman, A.I.; Abdel Latef, A.A.H. Ameliorative Impact of an Extract of the Halophyte Arthrocnemum Macrostachyum on Growth and Biochemical Parameters of Soybean Under Salinity Stress. J. Plant Growth Regul. 2021, 40, 1245–1256. [Google Scholar] [CrossRef]
  94. Ashraf, M.; Foolad, M.R. Roles of Glycine Betaine and Proline in Improving Plant Abiotic Stress Resistance. Environ. Exp. Bot. 2007, 59, 206–216. [Google Scholar] [CrossRef]
  95. Gharsallah, C.; Fakhfakh, H.; Grubb, D.; Gorsane, F. Effect of Salt Stress on Ion Concentration, Proline Content, Antioxidant Enzyme Activities and Gene Expression in Tomato Cultivars. AoB Plants 2016, 8, plw055. [Google Scholar] [CrossRef]
  96. Ashraf, M.; Harris, P.J.C. Potential Biochemical Indicators of Salinity Tolerance in Plants. Plant Sci. 2004, 166, 3–16. [Google Scholar] [CrossRef]
  97. Amini, F.; Ehsanpour, A.A. Soluble Proteins, Proline, Carbohydrates and Na+/K+ Changes in Two Tomato (Lycopersicon Esculentum Mill) Cultivars under in Vitro Salt Stress. Am. J. Biochem. Biotechnol. 2005, 1, 212–216. [Google Scholar] [CrossRef]
  98. Arefian, M.; Vessal, S.; Malekzadeh-Shafaroudi, S.; Siddique, K.H.M.; Bagheri, A. Comparative Proteomics and Gene Expression Analyses Revealed Responsive Proteins and Mechanisms for Salt Tolerance in Chickpea Genotypes. BMC Plant Biol. 2019, 19, 300. [Google Scholar] [CrossRef] [PubMed]
  99. Xiong, J.; Sun, Y.; Yang, Q.; Tian, H.; Zhang, H.; Liu, Y.; Chen, M. Proteomic Analysis of Early Salt Stress Responsive Proteins in Alfalfa Roots and Shoots. Proteome Sci. 2017, 15, 19. [Google Scholar] [CrossRef] [PubMed]
  100. Passamani, L.Z.; Barbosa, R.R.; Reis, R.S.; Heringer, A.S.; Rangel, P.L.; Santa-Catarina, C.; Grativol, C.; Veiga, C.F.M.; Souza-Filho, G.A.; Silveira, V. Salt Stress Induces Changes in the Proteomic Profile of Micropropagated Sugarcane Shoots. PLoS ONE 2017, 12, e0176076. [Google Scholar] [CrossRef] [PubMed]
  101. Aghaei, K.; Ehsanpour, A.A.; Komatsu, S. Proteome Analysis of Potato under Salt Stress. J. Proteome Res. 2008, 7, 4858–4868. [Google Scholar] [CrossRef] [PubMed]
  102. Ayala-Astorga, G.I.; Alcaraz-Meléndez, L. Salinity Effects on Protein Content, Lipid Peroxidation, Pigments, and Proline in Paulownia Imperialis (Siebold & Zuccarini) and Paulownia Fortunei (Seemann & Hemsley) Grown in Vitro. Electron. J. Biotechnol. 2010, 13, 13–14. [Google Scholar] [CrossRef]
  103. Amin, M.A.; Ismail, M.A.; Badawy, A.A.; Awad, M.A. Improve the Growth Performance of Helianthus annuus L. and Control of Cutworm Agrotis Ipsilon. Catalysts 2021, 11, 1551. [Google Scholar] [CrossRef]
  104. Lascano, H.R.; Antonicelli, G.E.; Luna, C.M.; Melchiorre, M.N.; Gómez, L.D.; Racca, R.W.; Trippi, V.S.; Casano, L.M. Antioxidant System Response of Different Wheat Cultivars under Drought: Field and in Vitro Studies. Aust. J. Plant Physiol. 2001, 28, 1095–1102. [Google Scholar] [CrossRef]
  105. Wu, G.Q.; Zhang, L.N.; Wang, Y.Y. Response of Growth and Antioxidant Enzymes to Osmotic Stress in Two Different Wheat (Triticum Aestivum L.) Cultivars Seedlings. Plant Soil Environ. 2012, 58, 534–539. [Google Scholar] [CrossRef]
  106. Leonowicz, G.; Trzebuniak, K.F.; Zimak-Piekarczyk, P.; Ślesak, I.; Mysliwa-Kurdziel, B. The Activity of Superoxide Dismutases (SODs) at the Early Stages of Wheat Deetiolation. PLoS ONE 2018, 13, e0194678. [Google Scholar] [CrossRef]
  107. Meloni, D.A.; Oliva, M.A.; Martinez, C.A.; Cambraia, J. Photosynthesis and Activity of Superoxide Dismutase, Peroxidase and Glutathione Reductase in Cotton under Salt Stress. Environ. Exp. Bot. 2003, 49, 69–76. [Google Scholar] [CrossRef]
  108. Song, F.; Yang, C.; Liu, X.; Li, G. Effect of Salt Stress on Activity of Superoxide Dismutase (SOD) in Ulmus pumila L. J. For. Res. 2006, 17, 13–16. [Google Scholar] [CrossRef]
  109. Eyidoǧan, F.; Öktem, H.A.; Yücel, M. Superoxide Dismutase Activity in Salt Stressed Wheat Seedlings. Acta Physiol. Plant. 2003, 25, 263–269. [Google Scholar] [CrossRef]
  110. Kim, K.Y.; Huh, G.H.; Lee, H.S.; Kwon, S.Y.; Hur, Y.; Kwak, S.S. Molecular Characterization of CDNAs for Two Anionic Peroxidases from Suspension Cultures of Sweet Potato. Mol. Gen. Genet. 1999, 261, 941–947. [Google Scholar] [CrossRef]
  111. Almagro, L.; Gómez Ros, L.V.; Belchi-Navarro, S.; Bru, R.; Ros Barceló, A.; Pedreño, M.A. Class III Peroxidases in Plant Defence Reactions. J. Exp. Bot. 2009, 60, 377–390. [Google Scholar] [CrossRef] [PubMed]
  112. Asada, K. Ascorbate Peroxidase—A Hydrogen Peroxide-scavenging Enzyme in Plants. Physiol. Plant. 1992, 85, 235–241. [Google Scholar] [CrossRef]
  113. Pujari, D.S.; Chanda, S.V. Effect of Salinity Stress on Growth, Peroxidase and IAA Oxidase Activities in Vigna Seedlings. Acta Physiol. Plant. 2002, 24, 435–439. [Google Scholar] [CrossRef]
  114. Jakovljević, D.Z.; Topuzović, M.D.; Stanković, M.S.; Bojović, B.M. Changes in Antioxidant Enzyme Activity in Response to Salinity-Induced Oxidative Stress during Early Growth of Sweet Basil. Hortic. Environ. Biotechnol. 2017, 58, 240–246. [Google Scholar] [CrossRef]
  115. Ayala, A.; Muñoz, M.F.; Argüelles, S. Lipid Peroxidation: Production, Metabolism, and Signaling Mechanisms of Malondialdehyde and 4-Hydroxy-2-Nonenal. Oxid. Med. Cell. Longev. 2014, 2014, 360438. [Google Scholar] [CrossRef]
  116. Schmidt, A.; Kunert, K.J. Lipid Peroxidation in Higher Plants. Plant Physiol. 1986, 82, 700–702. [Google Scholar] [CrossRef]
  117. De Azevedo Neto, A.D.; Prisco, J.T.; Enéas-Filho, J.; De Abreu, C.E.B.; Gomes-Filho, E. Effect of Salt Stress on Antioxidative Enzymes and Lipid Peroxidation in Leaves and Roots of Salt-Tolerant and Salt-Sensitive Maize Genotypes. Environ. Exp. Bot. 2006, 56, 87–94. [Google Scholar] [CrossRef]
Figure 1. Responses of T. arundinaceum germplasm accessions IND99-907, IND07-1136, IK76-48, and IND07-1134 in comparison with sugarcane salt-sensitive genotype Co 97010 under 16 days of salt stress (175 mM) at the germination stage under Control (C) and 175 mM salinity stress (S). (a) Comparison of the growth of shoots and roots biomass and the number of roots of salt-sensitive Co 97010 and IND99-907; (b) comparison of shoot and root growth and the number of roots of salt-sensitive Co 97010 and IND01-1136; (c) comparison of shoot and root growth and the number of roots of salt-sensitive Co 97010 and IK76-48; and (d) comparison of shoot and root growth and the number of roots of salt-sensitive Co 97010 and IND01-1134.
Sustainability 15 06962 g001
Figure 2. Performance of T. arundinaceum accessions under different levels of salinity stress for young leaf elongation. (a) Co 97010; (b) IND99-907; (c) IND01-1134; (d) IND01-1136; (e) IK76-48; (f) Co 86032; (g) Bethuadahari.
Sustainability 15 06962 g002
Figure 3. Microscopic root images of all genotypes under various levels of salinity stress.
Sustainability 15 06962 g003aSustainability 15 06962 g003bSustainability 15 06962 g003cSustainability 15 06962 g003d
Figure 4. Effects of salinity stress on chlorophyll a, chlorophyll b, and carotenoids (mg g FW−1) at various levels of salinity stress in T. arundinaceum genotypes: (a) chlorophyll a, (b) chlorophyll b, and (c) carotenoids.
Sustainability 15 06962 g004aSustainability 15 06962 g004b
Figure 5. Changes in the relative water content (%) in T. arundinaceum under various levels of salinity stress.
Sustainability 15 06962 g005
Figure 6. Effect of salinity stress on proline accumulation in T. arundinaceum genotypes.
Sustainability 15 06962 g006
Figure 7. Effect of salinity stress on the protein content in all of the genotypes.
Sustainability 15 06962 g007
Figure 8. Effects of salinity stress on superoxide dismutase in T. arundinaceum genotypes.
Sustainability 15 06962 g008
Figure 9. Changes in the peroxidase activity under various levels of salinity stress in T. arundinaceum genotypes.
Sustainability 15 06962 g009
Figure 10. Effects of salinity stress on lipid peroxidation in all of the genotypes.
Sustainability 15 06962 g010
Table 1. List of T. arundinaceum clones selected for salt tolerance studies.
S. NoCloneAltitude (ft)LocationDistrict/State
1IND99-88010EswaramangalamMalappuram, Kerala, India
2.IND99-8840PonnaniMalappuram, Kerala, India
3.IND99-8950KottapuramErnakulam, Kerala, India
4.IND99-90710PadiyattuKadavuErnakulam, Kerala, India
5.IND01-113415TarapurJagatsingpur, Orissa, India
6.IND01-113615KandadhruJagatsingpur, Orissa, India
7.IND03-12535CFO NalleBetapurMiddle Andaman, India
8.IND03-125520PhoolathalaMiddle Andaman, India
9.IND03-126210TirurSouth Andaman, India
10IND02-120810YethakotaEast Godavari, Andhra Pradesh, India
11.IND02-126020MilderaKatchalNicobar Islands, India
12.IND10-1591-South 24 ParaganasWest Bengal, India
13EaLakshadweep LakshadweepLakshadweep, Islands
14Ea A & N Andaman & NicobarAndaman & Nicobar
15IK76-48
16Bethuadahari BethuadahariNadia, West Bengal, India
Table 2. Performance of T. arundinaceum accessions for 14 days after salinity stress (175 mM) during the germination stage.
EntriesRoots StatusShoot LengthLeaf LengthRoot NumberRoot Length
CSR (%)CSR (%)CSR (%)CSR (%)
IND99-880Dead4.932.9340.6119.7512.5036.718.330.0010015.250.00100
IND99-884Dead3.501.2564.2914.257.7545.615.671.0082.3535.332.3393.40
IND99-907Alive6.004.0029.1729.6715.1748.888.336.0028.0032.0011.5064.06
IND01-1134Alive4.254.005.8819.5014.9223.509.006.3329.6333.3316.6750.00
IND01-1136Alive5.003.5030.0022.6711.4249.638.502.6768.6327.3323.3314.63
IND02-1208Dead5.503.2540.9128.3317.2539.126.674.3335.0034.0021.0038.24
IND02-1253Dead6.754.0040.7421.679.0958.079.671.0089.6624.3314.6739.73
IND02-1255Dead9.332.5073.2131.0015.5849.738.330.00100.0024.670.00100
IND10-1591Dead7.506.0020.0030.6718.0941.0310.001.6783.3331.002.0093.55
BethuadahariAlive6.334.6626.3810.338.7315.4911.668.0031.3912.6612.005.21
IK76-48Alive4.253.2523.5316.679.8440.996.671.0085.0029.3313.6753.41
Co 97010Dead10.134.6354.3221.756.7568.9724.003.6784.7029.006.0079.31
CD at 5% significance for genotypes 1.9790.7051.0730.53
CD at 5% significance for treatments 0.8080.2880.4380.28
Table 3. Response of T. arundinaceum accessions for accumulation of sodium and potassium under different levels of salinity stress.
GenotypesNa (mg/g of Dry Sample)K (mg/g of Dry Sample)Na/K Ratio (mg/g of Dry Sample)
CT1T2T3T4CT1T2T3T4CT1T2T3T4
IK76-485.598.8614.3715.1915.7413.6716.4416.7116.0914.340.410.540.860.941.10
Bethuadahari9.7416.4414.2020.5422.0414.7822.549.3211.6710.470.660.731.521.762.11
IND01-11364.7810.3516.6015.9112.8712.9923.7616.3117.998.510.370.441.020.881.51
IND99-9078.768.8216.9525.0419.0641.7934.0531.6323.7218.790.210.260.541.061.01
IND01-11349.318.9614.4417.1317.5413.6713.3514.249.6810.660.680.671.011.771.65
Co 860326.4212.4616.9419.6419.7719.5418.1416.1413.143.790.330.691.051.495.22
Co 9701010.0115.0823.9618.7418.9426.4721.3317.9111.767.880.380.711.341.592.40
CD (5% level of significance) GSG × S GSG × S GSG × S
1.721.303.43 3.27ns6.54 0.34ns0.68
C: Control, T1: 25 mM, T2: 75 mM, T3: 125 mM & T4: 175 mM.
Table 4. Estimates of sodium and potassium by the ICP-OES method at 175 mM and their ratios (Na/K) at the 15th day after salinity stress in the formative phase.
GenotypesSodiumCalciumMagnesiumPotassium
SCSCSCSC
(i) Elemental composition (mg g−1 of dry samples estimated by ICP-OES)
Co 9701021.057.5212.449.222.182.032.764.00
IND01-113622.528.2315.4012.204.313.473.764.18
IND99-90721.0714.9710.129.042.263.549.6519.96
(ii) Cation/K ratio by ICP-OES method
Co 970107.641.884.522.300.790.51
IND01-11365.991.974.102.921.150.83
IND99-9072.180.751.050.450.230.18
(iii) Cation/K ration by SEM-EDX method
Co 970101.50.83.241.060.330.71
IND01-11361.210.791.191.230.520.58
IND99-9070.641.030.000.870.181.17
Disclaimer/Publisher’s Note: The statements, opinions and data contained in all publications are solely those of the individual author(s) and contributor(s) and not of MDPI and/or the editor(s). MDPI and/or the editor(s) disclaim responsibility for any injury to people or property resulting from any ideas, methods, instructions or products referred to in the content.

