Article

A Study on the Measurement of Comparative Advantage of Land Use Efficiency, Spatiotemporal Heterogeneity and Its Influencing Factors—An Empirical Test from the Panel Data of China’s Provincial Sub-Industry Types

1
College of Economics and Management, Anhui Agricultural University, Hefei 230036, China
2
Anhui Provincial Institute of Land and Spatial Planning, Hefei 230601, China
3
Key Laboratory of Cultivated Land Conservation and Ecological Restoration, Ministry of Natural Resources, Hefei 230601, China
*
Authors to whom correspondence should be addressed.
Sustainability 2023, 15(9), 7048; https://doi.org/10.3390/su15097048
Submission received: 22 February 2023 / Revised: 9 April 2023 / Accepted: 20 April 2023 / Published: 23 April 2023

Abstract

:
The comparative advantage of land use efficiency can provide effective support for upgrading the industrial structure and optimizing the allocation of land resources. According to the agricultural industry and non-agricultural industry, the evaluation index system of land use efficiency is constructed by difference. By using China’s provincial panel data in 2010, 2015 and 2019 as an empirical test and comprehensively employing the comparative advantage model, GIS spatial analysis model, geographical weighted regression model and other algorithms, the land use efficiency and the comparative advantage were measured and evaluated to explore the evolution of spatial and temporal patterns and identify the influencing factors. The results showed the following: (1) The overall efficiency of agricultural land grew steadily, with regional differences transforming from expanding to narrowing, forming a gradually decreasing overall trend from the southeast coast to the northwest inland, and from the eastern plain to the western plateau. The overall efficiency of non-agricultural land was generally low, presenting an overall growth trend, and regional differences were progressively expanding, still showing a gradually decreasing trend in the eastern, central and western regions. (2) The overall comparative advantage of agricultural land efficiency showed a gradual decline trend, and the differences between regions were further narrowed. The high-value regions were still concentrated in the regions with superior agricultural resource endowment and showed a dominant advantage of the agricultural industry. The overall comparative advantage of non-agricultural land efficiency showed an increasing trend. The high-value areas were concentrated in urban agglomeration, metropolitan areas and other areas with high non-agricultural land efficiency, as well as the vast remote areas such as the northwest and southwest where the agricultural land efficiency was extremely low and the comparative advantage of non-agricultural land efficiency improved. (3) The spatial concentration of the comparative advantage of agricultural land and non-agricultural land efficiency was not obvious, which indicates that the comparative advantage of industrial land in China has not yet formed a trend of agglomeration development, but there were dense and obvious high-high agglomeration areas or low–low agglomeration areas in some local regions. (4) Significant regional differences were found to exist in the impact of various factors on the comparative advantages of agricultural land efficiency and non-agricultural land efficiency. The comparative advantage of land use efficiency can be relied on to promote the optimization and adjustment of industrial structure and guide the efficient allocation of land resources.

1. Introduction

China’s economy, shifting from a stage of high-speed development to a stage of high-quality development, is in a critical period of reconstructing urban and rural forms, optimizing industrial structure and transforming growth drivers [1]. The 20th CPC National Congress report made it clear that it is particularly important to promote urban–rural integration and coordinated development among regions, and to coordinate industrial restructuring. In the process of changing the development concept, it may further lead to the deterioration of the ecological environment, excessive and extensive use of natural resources, especially the low efficiency and even imbalance of land use caused by the blind occupation of land resources, and the type mismatch and spatial dislocation of land resources will occur from time to time, which has widely concerned many scholars [2,3]. At the same time, agricultural land is occupied by non-agricultural construction, which may lead to the occupation of agricultural land space, especially high-quality agricultural land resources, and the reduction in agricultural land will certainly threaten food security [4,5]. China has been paying continuous attention to problems such as the “non-agricultural”, “non-grain” and extensive utilization of cultivated land [6]. Governments at all levels have reached a consensus and adopted the strictest control over the use of territorial space, and have strictly implemented the balanced system of cultivated land occupation and supplementation and the balanced system of cultivated land in–out [7]. However, in the process of policy implementation, regional differences such as resource endowment and economic and social development have not been fully reflected, leading to the deviation between policy implementation effects and policy expectations, and the contradiction between farmland protection and non-agricultural construction is still prominent in some regions [8]. The fundamental reason for this phenomenon lies in the neglect of the spatial non-equilibrium characteristics such as resource endowment, economic development and industrial base. Further studies are needed to optimize the allocation of land resources in different regions and different industrial sectors. How to coordinate the relationship between industrial structure optimization and the improvement of land use efficiency has become a critical and difficult problem for academic research as well as management departments.
Under the condition of a market economy, resources are attracted to efficiency, and the allocation of land resources between different industries is subject to the efficiency standard [9]. Therefore, as long as there are differences in land use efficiency in different regions and different industries, there will be comparative advantages and internal impetus for industrial structure adjustment and land use efficiency improvement. Land use efficiency refers to the total output of labor capital invested in regional land and resources consumed, which not only covers quantifiable social and economic value, but also includes in-depth ecological and environmental value, comprehensively representing the value of land resource development and utilization and ecological protection [10]. China is a vast country with obvious differences in natural resources, geographical location, development level and ecological environment endowment. According to the comparative advantages of land use efficiency, the quantity, scale and spatial layout of industrial land should be rationally arranged to optimize the allocation of land resources in the whole region and maximize the land use efficiency and welfare.
The application of the theory of comparative advantage plays an important guiding role in solving the rational allocation of land resources [11]. It is worth mentioning that by considering the regional imbalance of a social economy, industrial structure and natural resource endowment, and allocating land resources among different regions according to the principle of comparative advantage of land use efficiency, the implementation effectiveness of policies such as “non-agricultural” and “non-grain” policies of cultivated land can be improved more effectively. Throughout the current research trends, there are abundant research results in industrial selection [12], international trade [13] and production layout [14] using the theory of comparative advantage. It is rare to allocate land resources according to comparative advantage [15], and even rarer to study by industrial type. It is precisely the measurement of comparative advantage of land use efficiency from the perspective of industrial types that can guide the adjustment of industrial structure and optimize the allocation of land resources. At present, the existing research lacking in quantitative empirical studies, or simply focused on comparative advantages of land use without considering industrial classification or output efficiency, has a limited guiding effect on the rational allocation of land resources and the spatial layout of industrial land. This study, based on two dimensions of agricultural industry and non-agricultural industry, takes account of the dual practical needs of optimal allocation of land resources and adjustment of industrial structure. Employing the land use efficiency as the criterion, using China’s provincial panel data as the research sample to construct the land use efficiency evaluation index system by industry type and comprehensively applying the model algorithms of comparative advantage, GIS spatial analysis and geographical weighted regression, the paper classically measures the land use efficiency and its comparative advantage, further explores the evolution of a spatial-temporal pattern and identifies its influencing factors. The research results are expected to provide theoretical support and practical reference for the improvement of land use efficiency and industrial structure optimization from “dilemma” to “win-win”.

2. Theoretical Basis Analysis

2.1. Basic Conditions for the Theory Application

The prerequisite for the sustainable use of natural resources is the sustainable use of land resources, which is also the key basis for social and economic development [16]. Land use types and the land use efficiency are affected by natural and geographical factors, and they are also closely related to social economy [17]. The rational allocation of land resources, realizing intensive land use and improving land use efficiency are an important way to alleviate the contradiction between land supply and demand [18]. Similarly, all human activities can be referred to as industrial development. Likewise, many human activities are closely related to industrial development, and the driving force for industrial structure adjustment depends on the relative abundance of labor, capital and natural resources [19]. Land resources are the carrier of industrial development. To ensure the demand of land use and its spatial layout, the key is to reasonably optimize the allocation of land resources between industrial types and industrial departments and maximize the efficiency of land use. Focusing on improving the social and economic efficiency of land use has led to the deterioration of the ecological environment for some provinces in China; the sustainable social and economic efficiency has also been negatively affected and the overall coordination of land use efficiency has been poor [20]. The reason behind this is that the government departments blindly pursue economic efficiency or have the wrong market orientation, not fully considering the imbalance of the regional socio-economic foundation and natural location, that is, land resources are not reasonably allocated [21] according to the principle of comparative advantage of efficiency. Comparative advantage is the basis for the regional division of labor and interregional trade. All regions should vigorously develop industries with comparative advantages and abandon industries without comparative advantages, gradually improving the efficiency of resource allocation [9], which is the technical difficulty to be solved by this research. From the perspective of macro overall strategy, with the spatial differentiation of land use efficiency and its advantages to be explored and differentiated land use policies to be formulated scientifically, regional land use will be planned as a whole and full play will be given to the comparative advantages of land use efficiency, which will provide a basic basis for overall regional development.

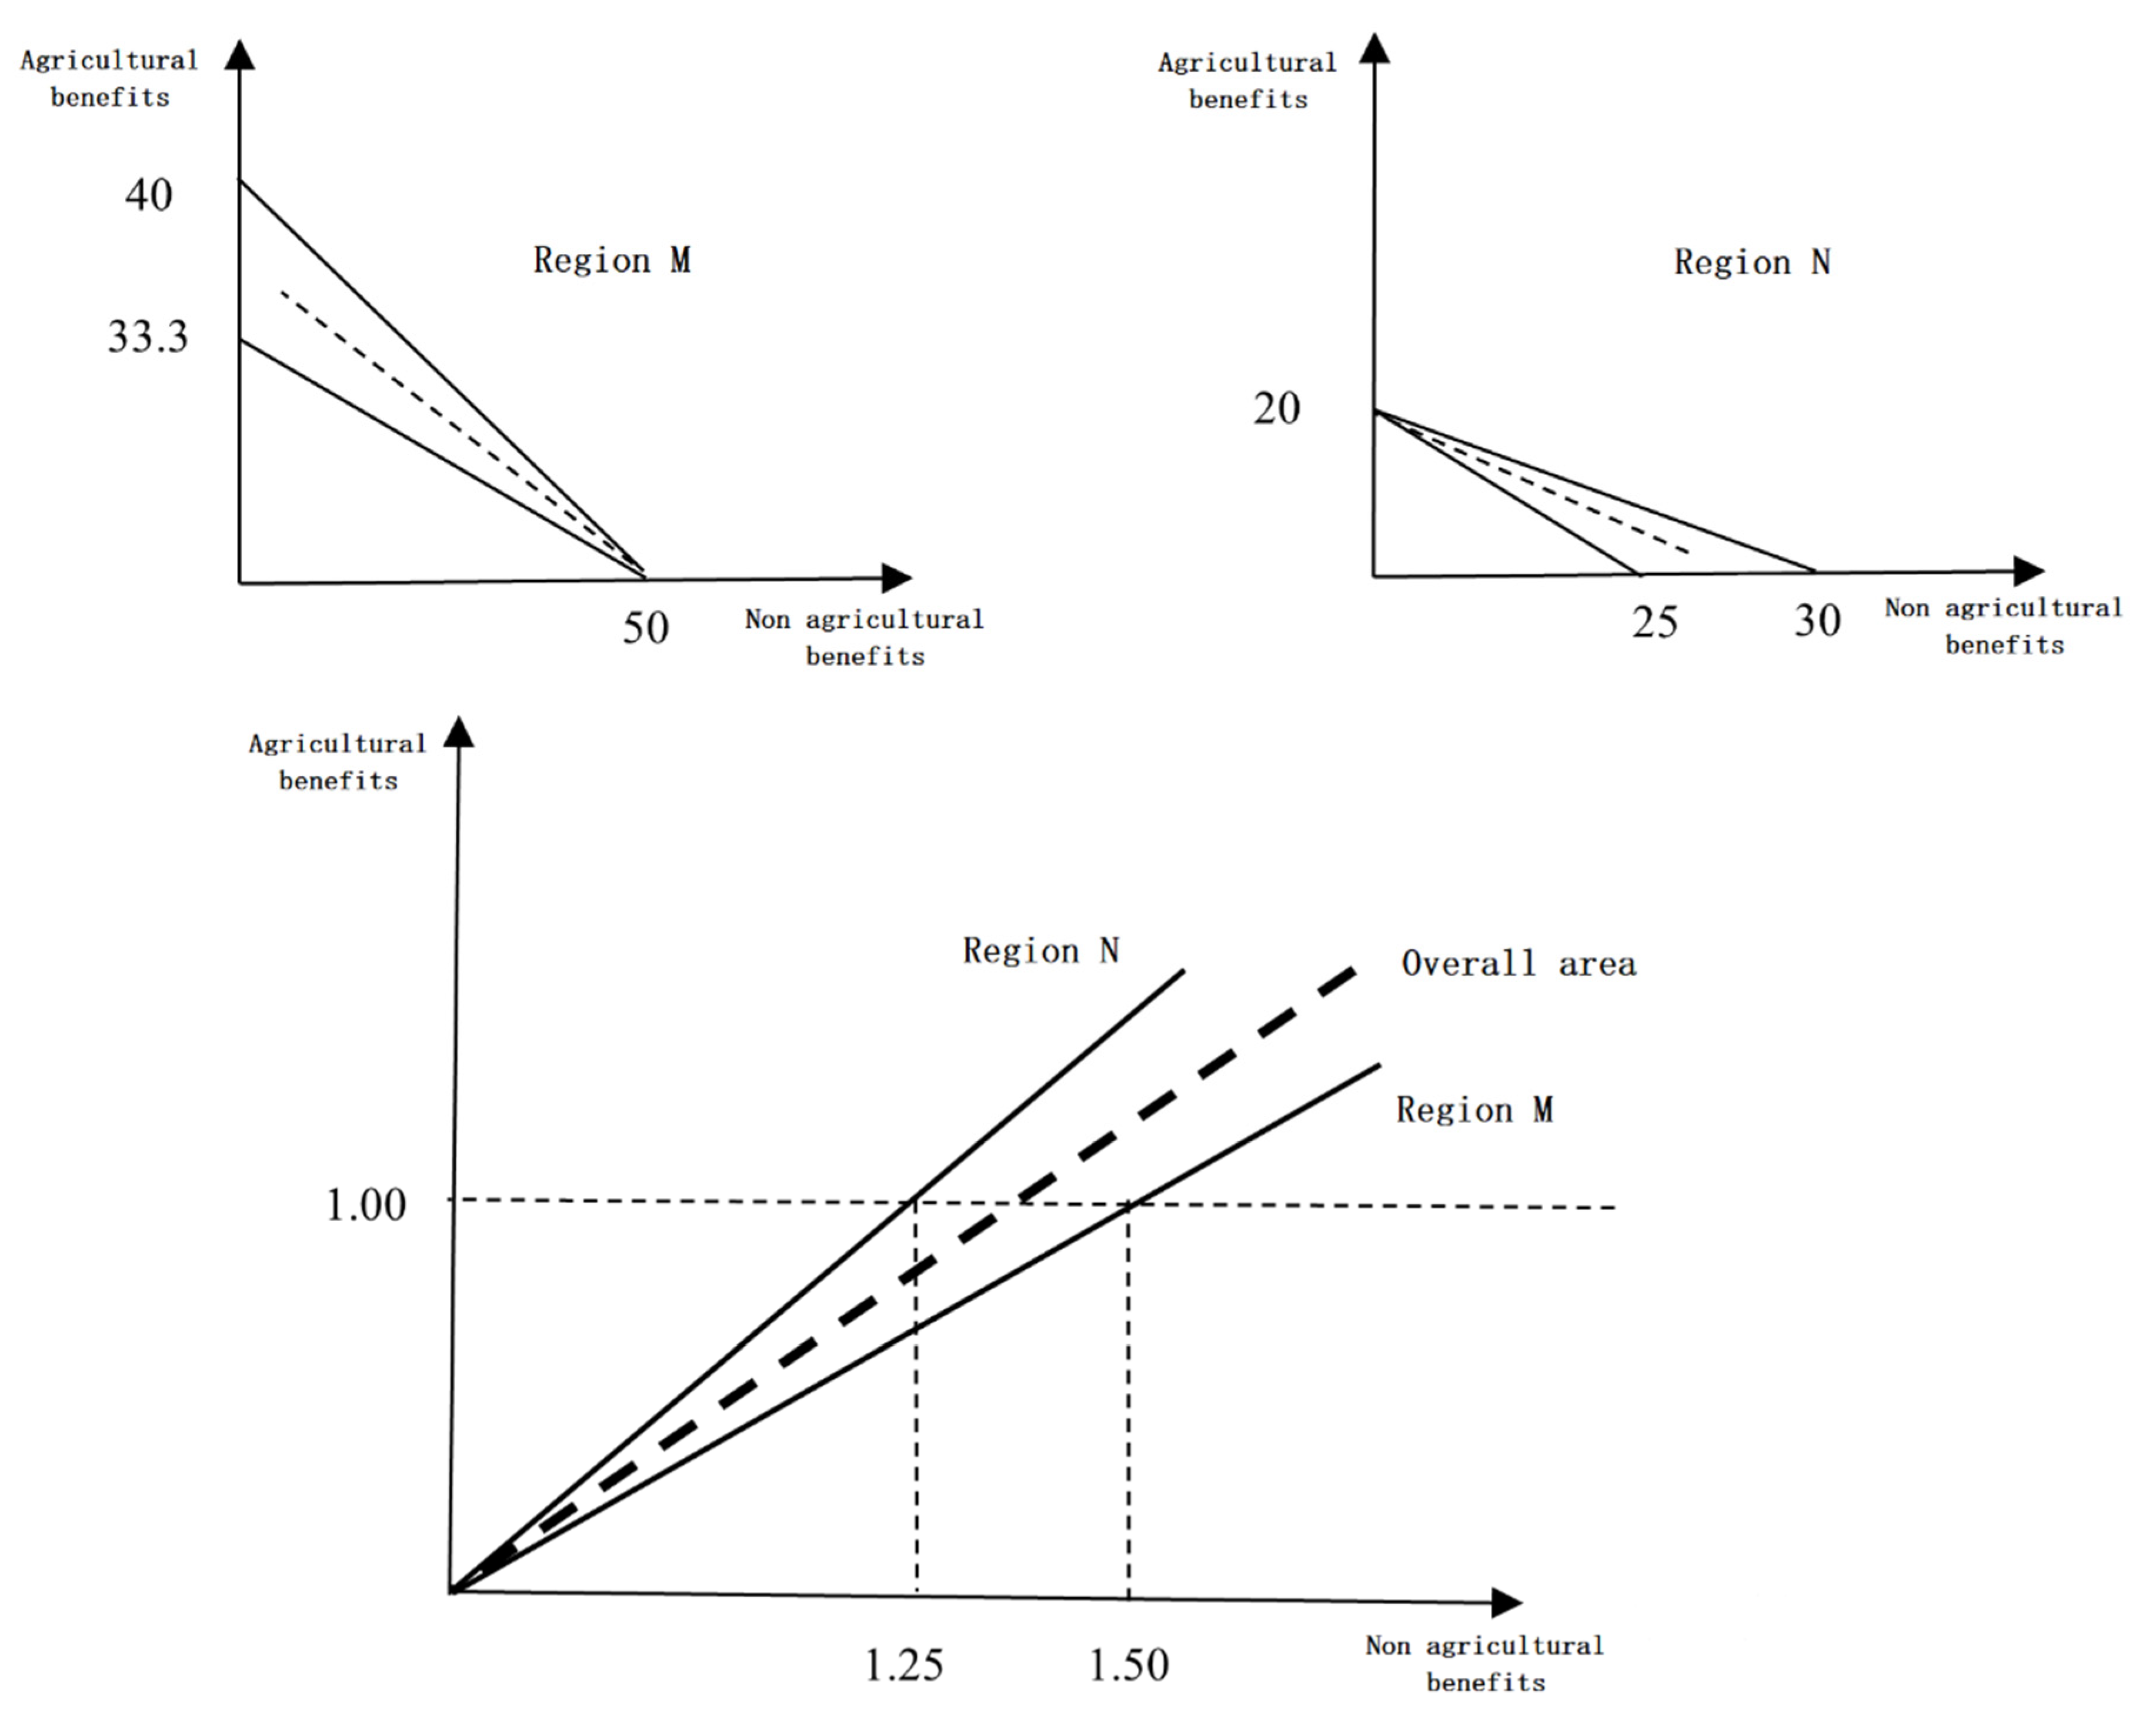
2.2. Deduction of Theoretical Hypothesis

The research on the application of comparative advantage theory applied to production layout and resource allocation is relatively mature, including the qualitative analysis [22,23] and quantitative measurement of regional comparative advantage in various fields [24,25], which have obtained certain theoretical guidance and practical application. The research is relatively rare in the field with regard to applying the comparative advantage theory to the analysis of land use efficiency and guiding the industrial structure adjustment by the dominance degree of comparative advantage. Considering the requirements for land use control in China where strict control should be exercised over the conversion of agricultural land to non-agricultural land and the protection of agricultural land resources is highlighted, the industrial types should be divided into agricultural and non-agricultural sectors. If land resources are allocated according to the comparative advantage of land use efficiency, the adjustment of efficiency value will occur as follows. Specifically, it is assumed that there are two regions (M and N) with homogeneous land resources, and there are only two industrial sectors, namely, the agricultural sector and the non-agricultural sector. The agricultural sector operates the agricultural land and produces agricultural land efficiency (AB), and the non-agricultural sector operates the secondary and tertiary industries to occupy land and produce non-agricultural land efficiency (NAB). Similarly, it is assumed that other production costs are the same except for land resources. Both regions, M and N, have 100 hectares of land resources (Table 1); the production of 1 unit of AB or NAB in region M consumes less land than that of region N, indicating that region M is higher than region N in agricultural production and non-agricultural production. In other words, the efficiency of land use efficiency of region M is significantly higher than that of region N, which has obvious absolute advantage. If the land resources are not allocated according to comparative advantages, the production possibility curves for region M and region N are shown in Figure 1.
The exchange ratios of agricultural efficiency and non-agricultural efficiency in region M and region N are 1/3:1/2 (2:3) and 1/5:1/4 (4:5), respectively. The ratio of land cost of region M and region N in agricultural efficiency production is 3:5, and the ratio of land cost in non-agricultural efficiency production is 2:4 (1:2). According to the comparative advantage analysis, region M has a comparative advantage in the production of non-agricultural efficiency while region N has a comparative advantage in the production of agricultural efficiency. Assuming that region M specializes in producing non-agricultural efficiency and obtains agricultural efficiency according to the exchange proportion of region N, similarly, region N specially produces the agricultural efficiency and obtains non-agricultural efficiency according to the exchange proportion of region M; the 50 units of non-agricultural efficiency produced by region M with 100 hectares are in exchange for 40 units of agricultural efficiency produced by region N, which is 50 × 4/5 = 40; the 20 units of agricultural efficiency produced by 100 hectares in region N are exchanged for 30 units of the non-agricultural efficiency produced by region M, which is 20 × 3/2 = 30. Therefore, production with special advantages can push the edge of production possibility to move outward, but from the practical level, the agricultural and non-agricultural industrial land cannot be completely converted. Through mutual exchange, the ratio of agricultural efficiency and non-agricultural efficiency of region M and region N is between 5:4 and 3:2 (1.25 to 1.5), and the total welfare of land use tends to maximize (Figure 2).
Judging from the above graphic reasoning and combing analysis results, the maximum regional flow of land use efficiency can maximize the efficiency of land resource spatial allocation under limited conditions, so as to further realize the optimal scheme of the overall benefit of land resources. However, limited by the fixed spatial location of land resources, the optimal use of land resources in the region through industrial layout can reflect the advantages of land resources and obtain the external scale effect of industrial agglomeration. Therefore, with the help of the comparative advantage of industrial land use efficiency, it is possible to reasonably plan the land scale demand and spatial layout of land use in different industries and departments so as to achieve the allocation of production factors and industrial structure adjustment of land use efficiency between different regions and promote the development and utilization of regional land resources to maximize the overall welfare.

3. Model Algorithms and Data Sources

3.1. Land Use Efficiency Evaluation Model

The TOPSIS principle optimizes the evaluation object by calculating the relative distance ranking between the alternative scheme and the ideal solution and the negative ideal solution, which has been widely used in the science and technology of system engineering decision analysis [26,27]. In this paper, in order to ensure that the evaluation results are objective and scientific, the entropy method is employed to determine the weight of evaluation indicators to improve the traditional TOPSIS and the efficiency of agricultural land and non-agricultural land are measured, respectively. The entropy method is used to determine the weight of indicators, but due to space limitations, the specific formula will not be repeated here.
➀ Data standardization. The extreme value standardization method is used to standardize the evaluation index data to determine the position of the actual value of the evaluation index in the index weight, and the entropy method is directly used to determine the standardization results.
➁ Build decision matrix. Index weight vector Wj determined by entropy method, weighted normalized decision matrix X = (X, ij)m×n is obtained by multiplying each row of matrix R with its corresponding weight
X = [ X 11 X 12 X 1 n X 21 X 22 X 2 n X m 1 X m 2 X m n ] = [ r 11 w 1 r 12 w 1 r 1 n w 1 r 21 w 2 r 22 w 2 r 2 n w 2 r m 1 w m r m 2 w m r m n w m ]
③ Determine positive and negative ideal solutions. X+ represents the most preferred scheme (positive ideal solution) while X represents the least preferred scheme (negative ideal solution), then there are
X + = { max 1 i m v i j | i = 1 , 2 , , m } = { X 1 + , X 2 + , , X m + }
X = { min 1 i m v i j | i = 1 , 2 , , m } = { X 1 , X 2 , , X m }
④ Calculate the distance. Calculate the distance D+ from the evaluation vector of each evaluation object to the positive ideal solution and the distance D to the negative ideal solution
D i + = i = 1 m ( X i j X i + ) 2
D i = i = 1 m ( X i j X i ) 2
Xij is the weighted normalized value of the j-th index of the i-th evaluation object; Xi+ and Xi are the most preferred value and the least preferred value of the i-th evaluation object in the evaluation object system, respectively.
⑤ Calculate the closeness Ci between the evaluation object and the optimal scheme.
C i = D i D i + D i +
where the greater Ci is, the closer the land use efficiency of the i-th evaluation object is to the optimal level. The value of closeness Ci is between 0 and 1. When Ci = 1, the land use efficiency level is the highest; when Ci = 0, the level of land use efficiency is the lowest.

3.2. Comparative Advantage Model

According to the analysis of the applicable hypothesis of the comparative advantage theory, agricultural land use benefit (AB) and non-agricultural land benefit (NAB), based on the agricultural sector and non-agricultural sector, respectively, can be used in the comparative advantage model of land use efficiency, which is basically consistent with Ricardo’s idea of using labor productivity to measure comparative advantage [28]. Therefore, the agricultural land benefit (AB) and non-agricultural land benefit (NAB) are summarized and sorted out, and the comparative advantage value of land use benefit is calculated according to the ratio between the two. The specific formula is as follows:
A B a g r i c u l t u r e   i = A B i N A B i
N A B N o n   a g r i c u l t u r a l   i = N A B i A B i
A B a g r i c u l t u r e   i × N A B N o n   a g r i c u l t u r a l   i = 1
In the formula, ABagricultural i is the comparative advantage value of the agricultural land efficiency relative to the non-agricultural land efficiency in i province, NABnon-agricultural i is the comparative advantage value of the non-agricultural land efficiency relative to the agricultural land efficiency in i province. ABi and NABi, respectively, represent the agricultural land efficiency value and the non-agricultural land efficiency value in i province; ABagricultural i and NABnon-agricultural i are reciprocal to each other, forming a standard inverse proportional function of Formula (9). The larger the ABagricultural i value, the smaller the NABnon agricultural i value, and vice versa (Figure 3).

3.3. Spatial Analysis Model of Comparative Advantage of Land Use Efficiency

(1) Global spatial autocorrelation (GSA)
Moran’s I, Getis’g and Gear’s C are all index methods of describing global autocorrelation. Among them, Moran’s I is less vulnerable to deviation from normal distribution and is more widely used.
I = M i = 1 m j = 1 m W i j × i = 1 m j = 1 m W i j ( x i - x ¯ ) ( x j - x ¯ ) i = 1 m ( x i - x ¯ ) 2
where M and m are the total number of evaluation objects, xi is the observed value and x ¯ is the average value of xi. Wij is the connection relationship between the i-th and j-th points of the evaluation object. Distance, area, accessibility, etc., can also be employed to express the construction of the spatial connection matrix, which is generally dominated by symmetric matrix, where Wij = 0. Moran’s I value is between −1 and 1. If the value is greater than 0, it is positively correlated; if it is less than 0, it is negatively correlated. The larger the absolute value is, the stronger the spatial correlation, which is further divided into strong aggregation or difference. Additionally, the smaller the absolute value is, the weaker the spatial correlation. If the value tends to 0, it means that there is no agglomeration in the space and a random distribution is achieved.
(2) Local spatial autocorrelation (LISA)
Local spatial autocorrelation can make up for the disadvantage that global autocorrelation can only reflect the overall situation and reflect local regional differences. Therefore, local Moran’s I is used to represent the local spatial correlation. The specific calculation formula is as follows:
I i = x i - x ¯ S 2 j = 1 m W i j ( x j - x ¯ )
S 2 = 1 m i = 1 m ( x i - x ¯ ) 2
where Wij is the same as the above formula. Two spatial evaluation units are adjacent, Wij is 1, and if not, Wij is 0. If Moran’s I is greater than 0, it indicates that there is agglomeration (high value or low value) in the regional space with similar evaluation values; If Moran’s I index is less than 0, it indicates that there is agglomeration (low–high or high–low) in areas with different evaluation values.
(3) Kernel density estimation
In order to judge the overall spatial distribution and trend evolution of the comparative advantage of industrial land efficiency, the kernel density estimation method, as a non-parametric estimation method, is an ideal method, which can avoid the subjectivity of the parametric model. The specific formula is as follows:
f m ( X ) = 1 m h i = 1 m K ( x i - x ¯ h )
where m is the total number of evaluation units, x ¯ is the average value of coupling coordination degree, K (xixh) is the kernel function and h is the bandwidth.

3.4. Identification Model of Influencing Factors of Comparative Advantage of Land Use Efficiency

Assuming that the observed values of a series of explanatory variables with i = 1, 2..., m, j = 1, 2..., n are {xij} and the observed values of a series of explained variables are {yj}, the classical global linear regression model is as follows.
y i = β 0 + j = 1 n x i j β j + ε i                               i = 1 , 2 , , m
where ε is the random error term of the whole regression model, satisfying the spherical disturbance assumption, and the regression coefficient β is assumed to be a constant. The classical ordinary least squares (OLS) method is generally used to estimate the model parameters βj.
The geographically weighted regression model is a relatively simple regression estimation technology, which extends the ordinary linear regression model. In the extended GWR model, the regression coefficient of a specific location i is no longer an assumed constant β0 obtained by using global information, but a variable βj obtained by local regression estimation using sub sample data information of adjacent observations and changing with local geographical location in space. The GWR model can be expressed as where the subscript j of coefficient βj represents parameter vector to be estimated associated with the observed value, and the meta function of geographical location (ui,vi). GWR can estimate the estimated value of k parameter vectors for each observation value, and ε is the random error of the i-th region, meeting the spherical disturbance assumptions of zero mean, same variance and mutual independence, etc.
y i = β 0 ( u i , v i ) + j = 1 k β k ( u i , v i ) x i j + ε i

3.5. Index System and Data Source of Land Use Efficiency Evaluation

(1) Evaluation index system of land use efficiency
With comprehensive reference to the existing relevant documents [29,30,31], based on the industrial classification system of the national economy, and combined with the rules of human production, life and ecological activities, the agricultural land benefit evaluation index system and non-agricultural land benefit evaluation index system are respectively constructed. Among them, the efficiency evaluation of agricultural land involve four indicators: the land average output value of primary industry, the average agricultural added value per land, the per capita disposable income of rural residents and the per capita consumption and expenditure of rural residents. The non-agricultural land efficiency evaluation is related to six indicators: the land average output value of secondary and tertiary industries, the non-agricultural level, the average wage of urban unit employees, the per capita consumption and expenditure of urban residents, the average local fiscal revenue and the greening coverage rate of built-up areas. By employing the entropy method, the information entropy, redundancy and weight of each evaluation index are determined respectively, Due to space constraints, there are no further details provided (Table 2).
(2) Explanation of data sources
Given that China’s socio-economic development has gradually shifted from high-speed development to high-quality development since 2010, the task of optimizing and adjusting the industrial structure and sustainable utilization of land resources is becoming increasingly challenging. The time range covers three periods in 2010, 2015 and 2019, and the spatial scale is 31 provincial administrative units in China (data missing, excluding Taiwan province). According to the evaluation indicators of land use efficiency, the data for this study cover land use data and socio-economic data. Land use data mainly come from the China Statistical Yearbook of Land and Resources, and the data for some years come from the summary data of land use change survey. According to the Classification of Land Use Status (GBT21010-2007), agricultural land includes cultivated land, garden land, forest land, grassland, rural roads, facility agricultural land and rural residential areas, and non-agricultural land includes transportation land (excluding rural roads), cities, towns, other independent construction land, salt fields and special land. The first output value per land and the agricultural added value per land are based on agricultural land while the second and third output value per land and the local fiscal revenue per land are based on non-agricultural land. The social and economic data are from the China Statistical Yearbook and the China Rural Statistical Yearbook, and the green coverage rate of the built-up area is from the China Urban Statistical Yearbook. With the help of ArcGIS10.2, GeoDa and other spatial data processing software, using the provincial administrative boundary as the basic spatial unit, and linking the non-spatial index data to the geospatial unit, the comparative advantage geospatial database of China’s land use efficiency is established, and a series of visualization results maps such as the spatial pattern map of land use efficiency and its comparative advantage, Moran’s I index, Moran scatter map, LISA and so on are the outputs.

4. Results and Analysis

4.1. Land Use Efficiency Analysis

From the analysis of the overall situation of agricultural land use efficiency (Table 3), the average values for the three periods in 2010, 2015 and 2019 were 0.1575, 0.3101 and 0.3461, respectively, showing a gradual growth trend. The difference between the maximum value and minimum value increased from 0.3862 in 2010 to 0.6974 in 2015, and then decreased to 0.6814 in 2019, indicating that the regional difference transformed from expansion to reduction. According to the analysis of regional differences, the eastern provinces, southeast coastal provinces and riverside provinces represented by Jiangsu, Shandong, Shanghai, Tianjin, Henan, Zhejiang and Hainan, etc., are in the high-value range for the three periods. The reasons behind this are as follows. First, China‘s territory is vast, resulting in the difference of regional natural conditions. Moreover, the special dependence of agricultural production on natural endowments, as well as the comprehensive effect of various factors such as the pull of agricultural product sales areas and input of agricultural production factors, the efficiency of which are transmitted to agricultural land, leads to inevitable regional differences. Most importantly, the unique agricultural resource endowment and its geographical location advantages, as well as the superimposed market demand pull, drive the economic efficiency of agricultural agglomeration to become increasingly prominent, so as to promote the gradual improvement of agricultural land efficiency through dynamic circulation. The low-value range of agricultural land efficiency involves regions with relatively scarce agricultural resource endowments such as Gansu, Xinjiang, Qinghai, Tibet and Inner Mongolia. In addition, the fragile human land relationship and extensive agricultural management further lead to the generally low value of agricultural land efficiency, which in turn indicates that there is a large space for the follow-up potential improvement of agricultural land efficiency.
According to the overall analysis of non-agricultural land efficiency in terms of time sequence (Table 3), the average values for the three periods in 2010, 2015 and 2019 were only 0.0269, 0.0602 and 0.0930, respectively, not reaching 0.1000, indicating that the overall efficiency was generally low. From the analysis of the difference between the maximum and minimum values, the difference values for the three periods were 0.2950, 0.6555 and 0.9715, respectively, indicating that the overall non-agricultural land efficiency was gradually improving, the regional differences showing a gradual widening trend. From the regional differences analysis, the change trend of the data in the three periods reflects that the efficiency of non-agricultural land shows obvious inertia characteristics. The greater the value the non-agricultural land efficiency is, the larger the change trend tends to be. The smaller the value the non-agricultural land efficiency is, the smaller the change trend tends to be. The higher value areas are concentrated in Shanghai, Zhejiang, Fujian, Hunan, Shandong and other eastern regions along the riverside and coastal areas with better industrial foundation development, as well as better and higher secondary and tertiary output value, financial payment, the capacity of absorbing employment and population agglomeration, forming a better combination of population, land, industry and other production factors, and leading to significantly higher efficiency of non-agricultural land. The lower regions are concentrated in Tibet, Xinjiang, Qinghai, Ningxia and other regions with a relatively weak industrial foundation, fragile ecological environment, limited land development space and relatively weak regional links. As a result, the attraction of production factors is far less than that of the high value area, leading to a generally lower efficiency of non-agricultural land.

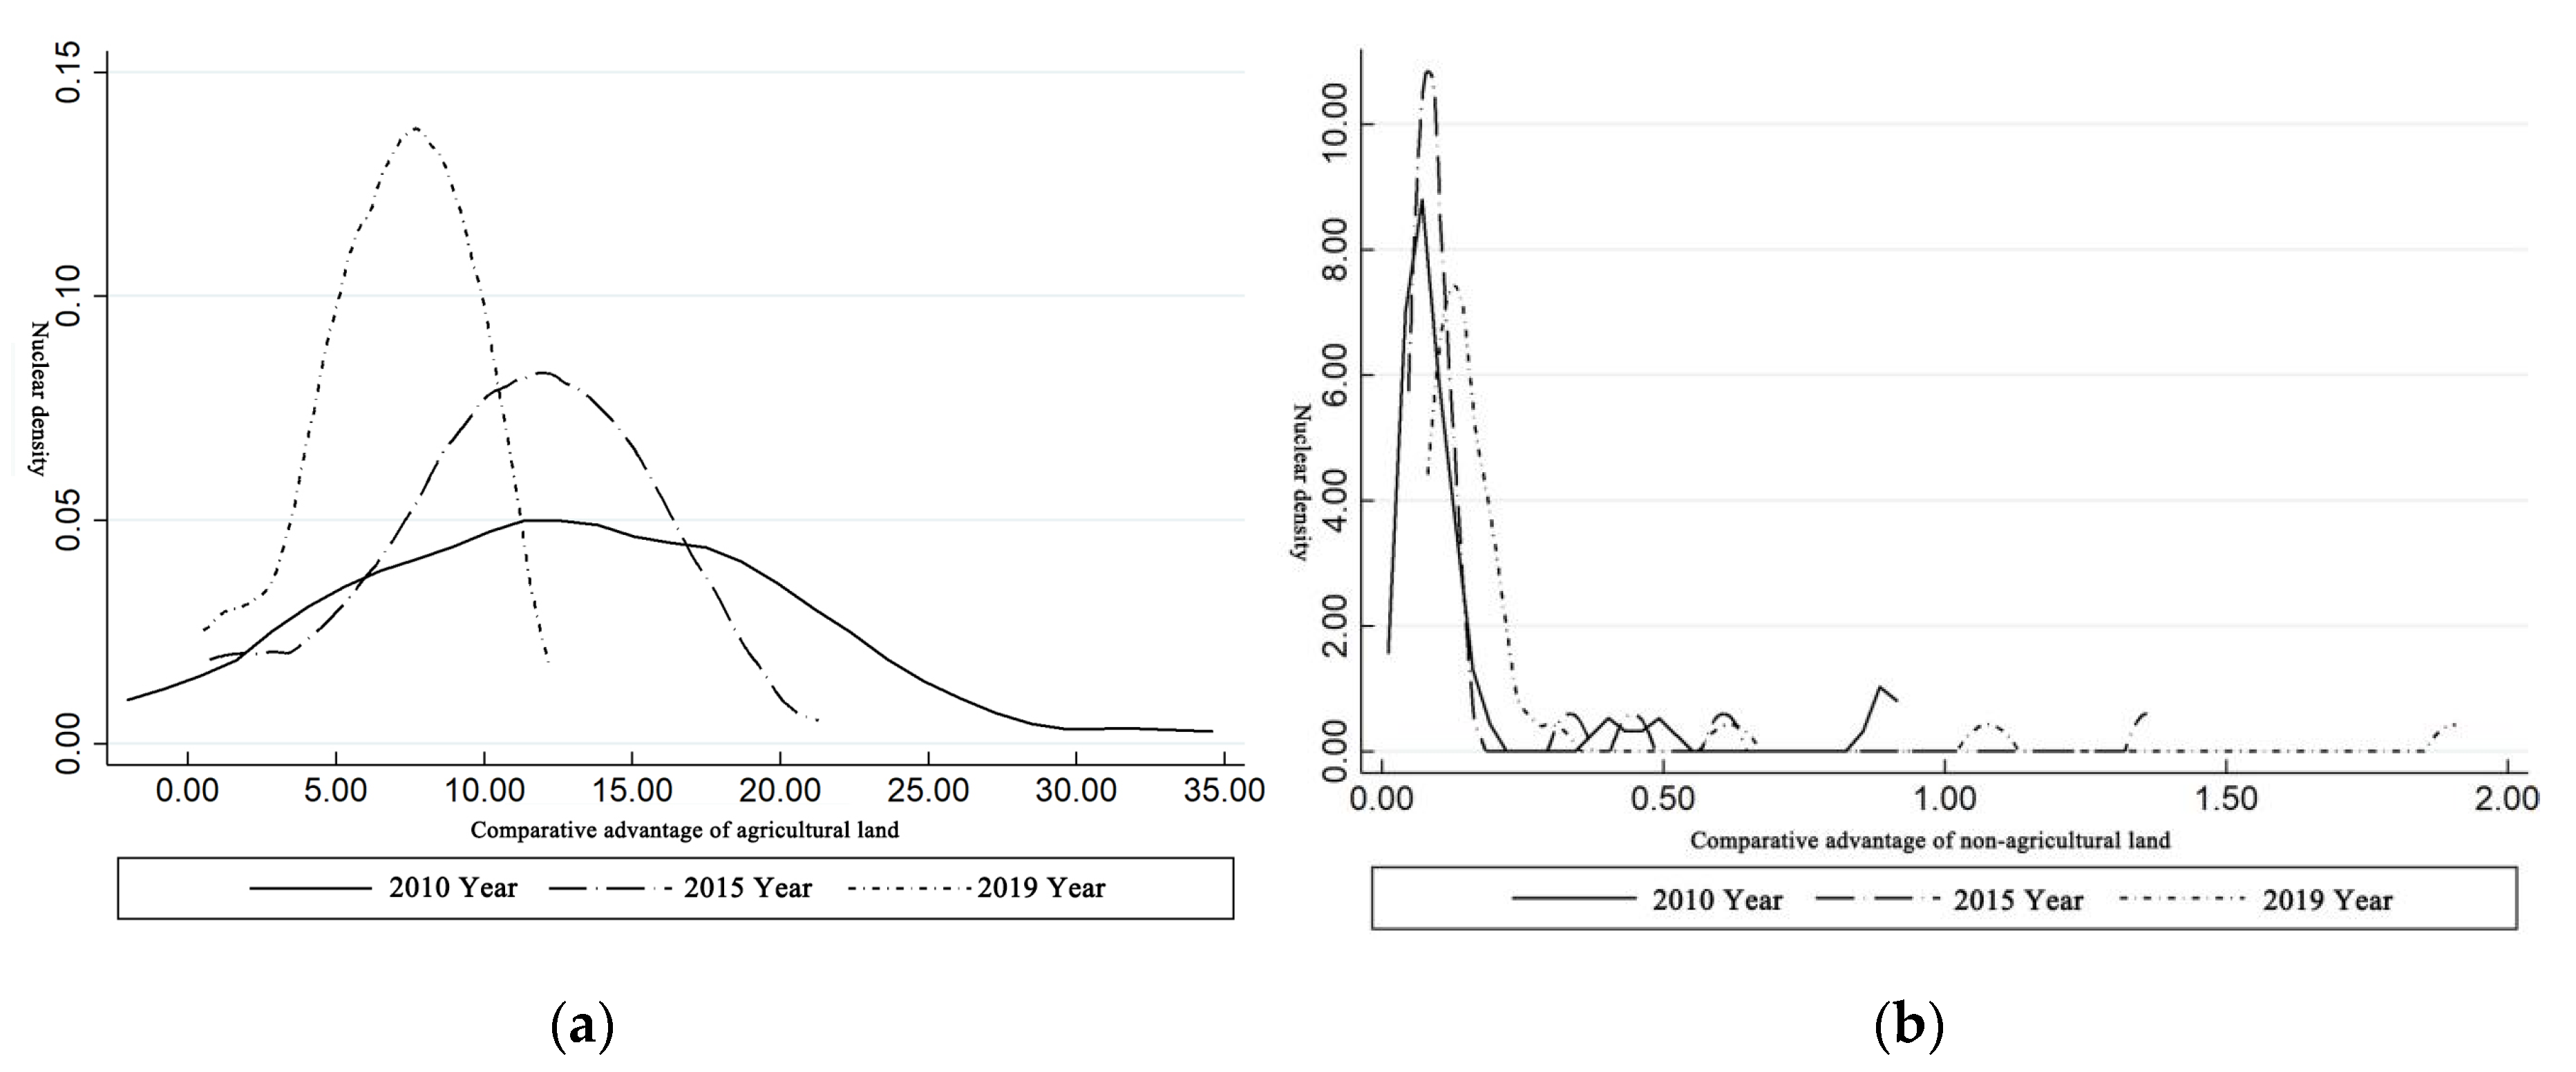
4.2. Comparative Advantage Analysis of Land Use Efficiency

From the analysis of the comparative advantage results for agricultural land efficiency (Table 4 and Figure 4), the average comparative advantages for agricultural land efficiency in the three periods were 12.9069, 10.9093 and 6.8673, respectively, showing a downward trend as a whole. The differences between the maximum value and minimum value were 30.3221, 20.5473 and 11.7079, respectively, indicating that the difference in agricultural efficiency between provinces and cities is further narrowing. From the analysis of spatial differences, Hebei, Henan, Hubei, Hunan, Guangxi and Hainan provinces are in the high-value range for comparative advantage of agricultural efficiency, and Anhui, Shandong, Fujian and Jiangxi are also relatively high. The above provinces and cities are in the forefront of comparative advantage, indicating that the regions with prominent comparative advantage of agricultural land are still concentrated in regions that rely on the advantage of agricultural resource endowment, such as the middle and lower reaches of the Yellow River plain, the middle and lower reaches of the Yangtze River plain and the central agricultural dominant areas, many of which have always been China’s grain production concentration areas and major export provinces. Shanghai, Tianjin, Beijing and Tibet are in the low-value range, and Guangdong, Xinjiang, Qinghai, Zhejiang, Inner Mongolia and Gansu are also relatively low. The above-mentioned provinces and cities are concentrated in urban agglomerations, metropolitan areas and other surrounding areas, where the non-agricultural land efficiency is very high, thereby lowering the comparative value of agricultural land efficiency. In typical northwest regions and areas with poor agricultural hydrothermal and climatic conditions, the level of agricultural production efficiency is generally low.
From the analysis of the comparative advantage results for non-agricultural land efficiency (Table 4 and Figure 4), the average comparative advantages of non-agricultural land efficiency in the three periods were 0.1573, 0.1654 and 0.2478 respectively, showing an overall upward trend. From the spatial distribution structure analysis, the values for Shanghai, Beijing, Tianjin, Tibet and Qinghai are all at a high level, indicating that the distribution of non-agricultural land with a high comparative advantage is concentrated in the metropolitan areas of the country, as well as in remote areas such as the northwest and southwest, where agricultural production efficiency is low. These areas should vigorously develop non-agricultural production advantages. It is suggested that the undertaking of industrial transfer should be encouraged and the advantages of local industrial development should be combined to appropriately develop non-agricultural production in remote areas in the central and western regions according to local conditions, so as to drive targeted poverty alleviation and the rational layout of China’s industrial space. The comparative values of Hebei, Henan, Hubei, Guangxi and Hainan are relatively low, which are the same for Hunan, Anhui, Fujian, Shandong and Heilongjiang provinces. The reason is that the efficiency of agricultural land is higher in these areas, which lowers the efficiency of non-agricultural land, and the original non-agricultural land efficiency level is never high. Through the adjustment, optimization and upgrading of the industrial structure, the efficiency of non-agricultural production and the competitiveness of products and services will be improved. The output of unit GDP as well as the construction of public infrastructure supporting industrial development should be increased, further improving the industrial structure system and dominant industries.

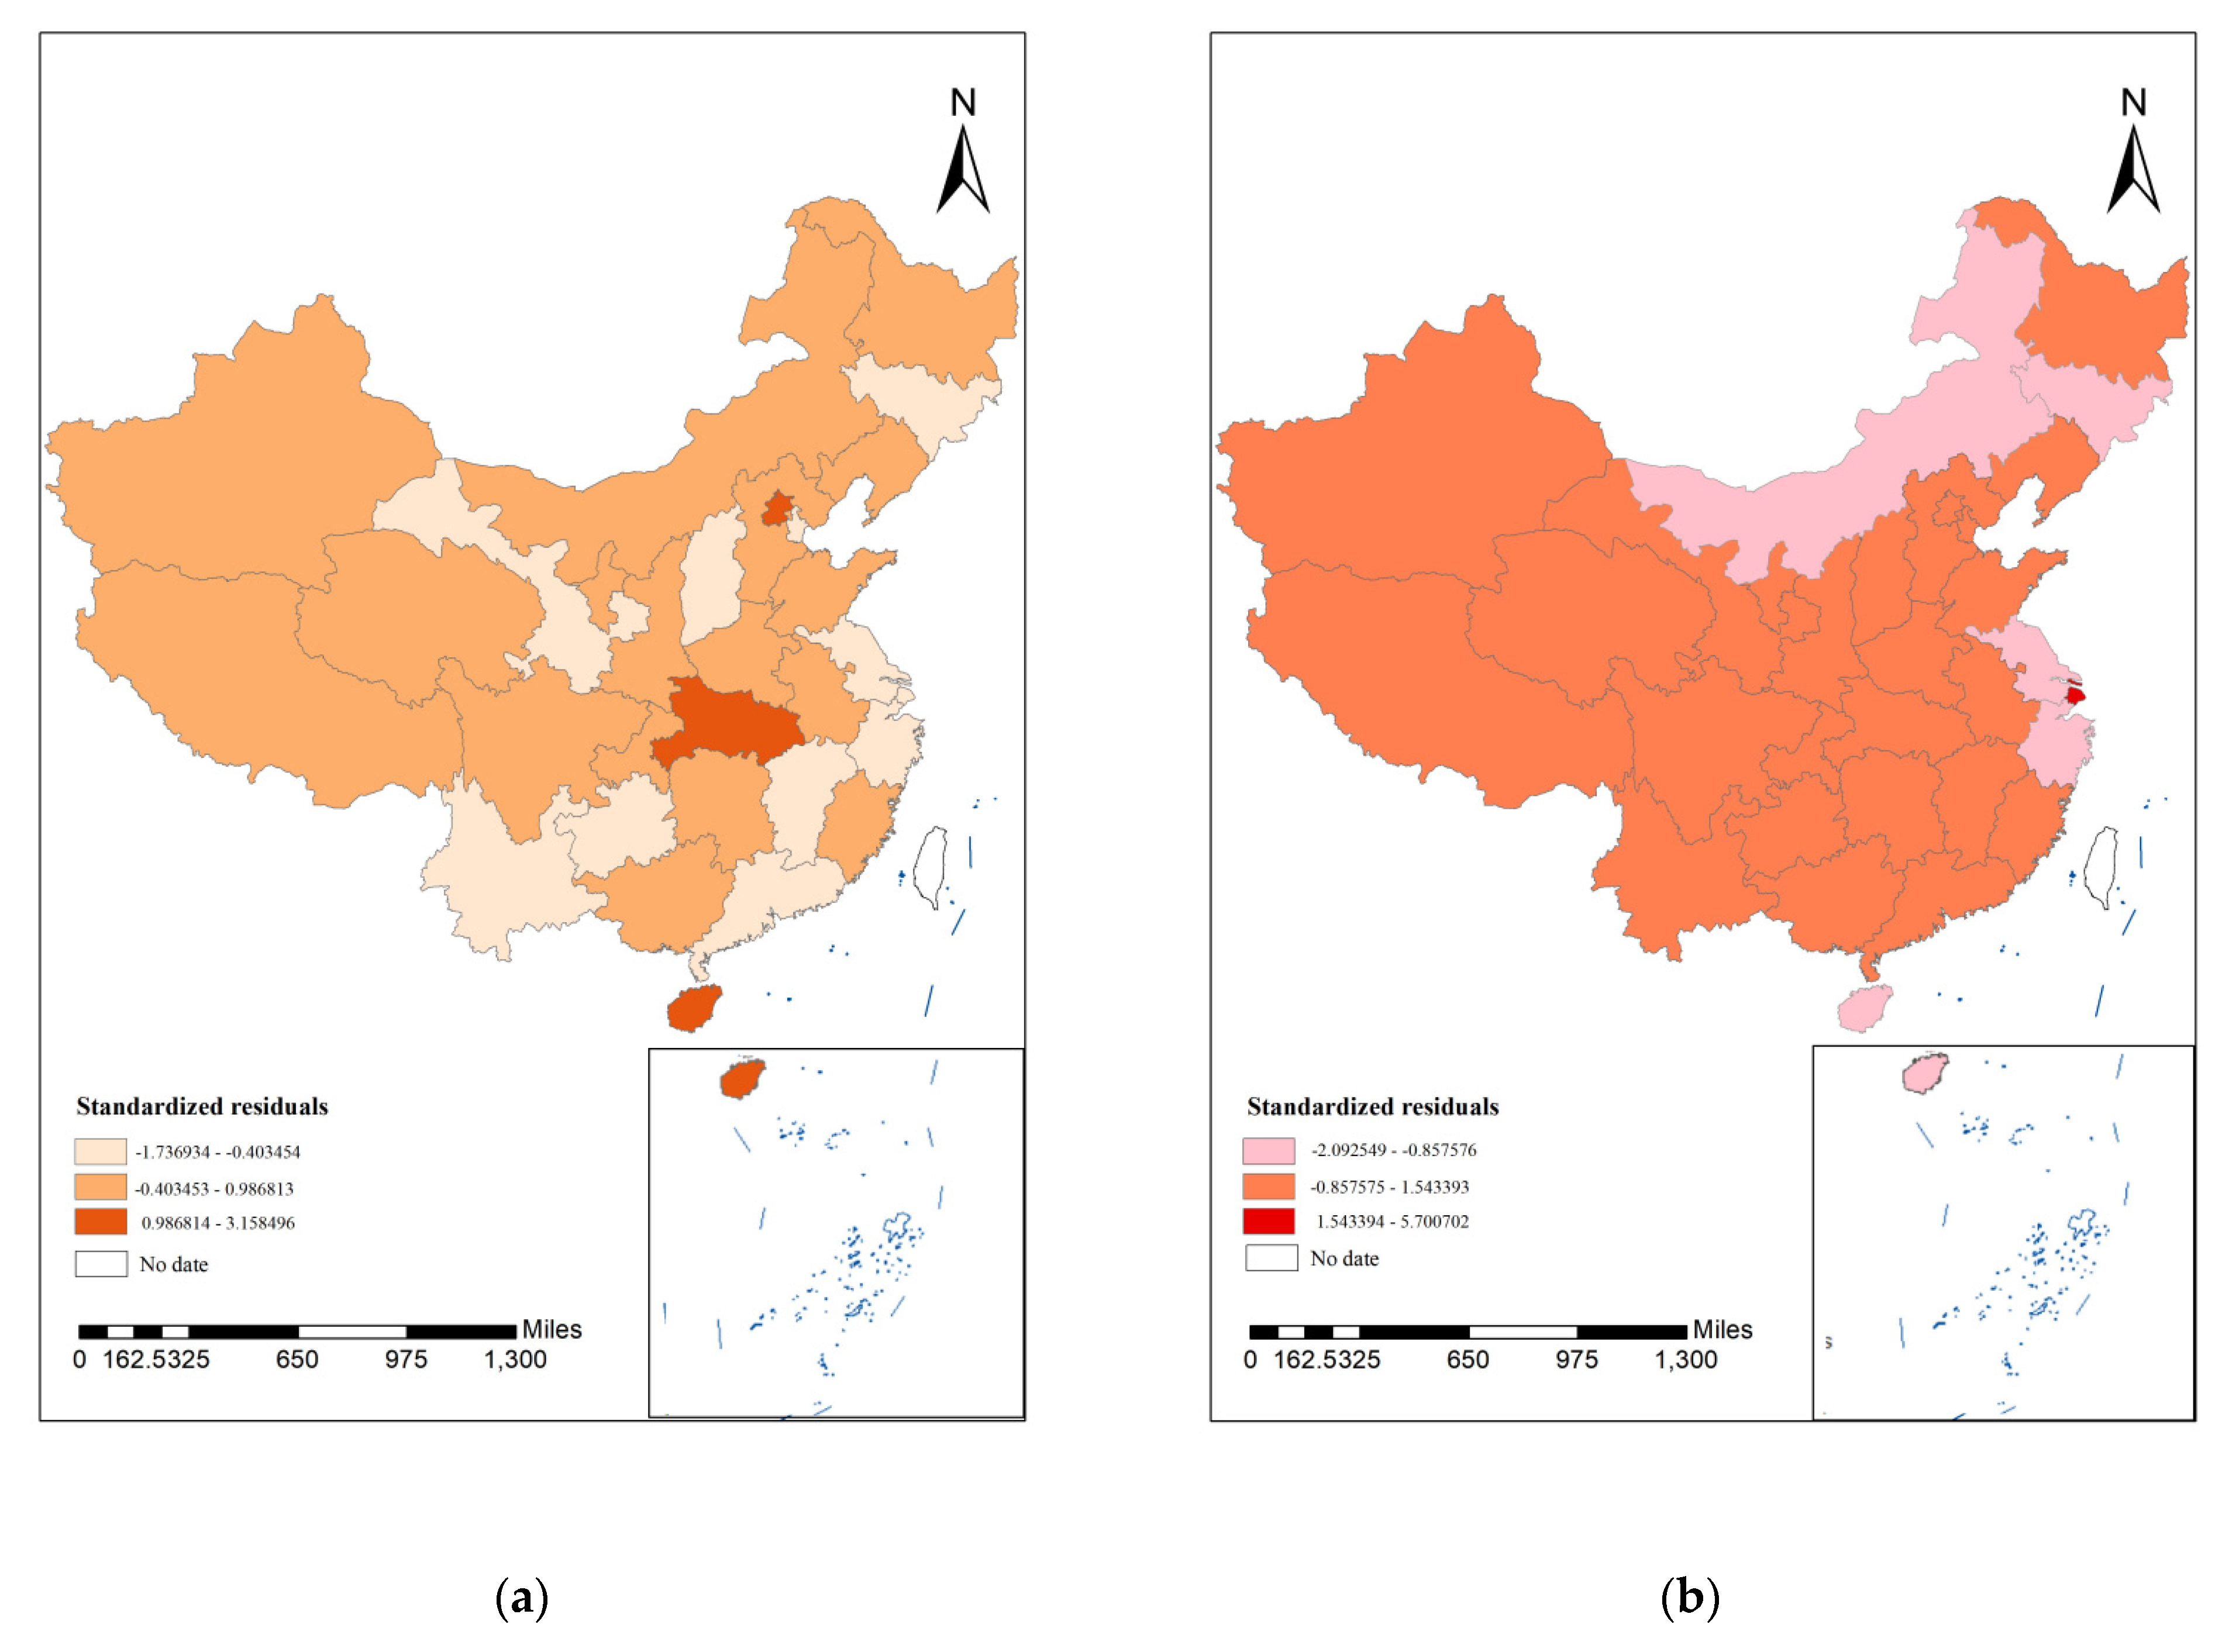
4.3. Spatial Analysis of Comparative Advantage of Land Use Efficiency

(1) Global spatial autocorrelation
From the analysis of the spatial scatter chart on the comparative advantage of China’s land use efficiency, the overall scatter unit of the comparative advantage of agricultural land efficiency and non-agricultural land efficiency was not significantly concentrated in the second and fourth quadrants, indicating that the comparative advantage of land use efficiency has not yet formed a hot trend of concentration or agglomeration development, and the advantages of agricultural resource concentration, radiation spillover efficiency of non-agricultural development and the scale agglomeration effect was not obvious either. The comparative advantage of agricultural land efficiency over non-agricultural land efficiency had a higher degree of global correlation, which is reflected in the significant proportion of units falling into the second quadrant and the fourth quadrant, and the most direct proof is that the Moran’s I index in 2010, 2015 and 2019 was 0.1849, 0.0941 and 0.0935, respectively, which were greater values than those for the non-agricultural land efficiency index, which were −0.0295, −0.0453 and −0.0483, respectively, further demonstrating that agricultural land development and utilization can take on a “planar” wide-area contiguous layout depending on agricultural natural resource endowment, and non-agricultural land development and utilization should focus on cultivating and forming a more centralized “point-like” spatial pattern. This conclusion is of great reference value for the delineation and development management of “three districts and three lines” of national space in the future (Figure 5).
In order to further verify the results for the analysis, after the test hypothesis of 999permuta-tions (Table 5), it is true that only the p-value value of agricultural land efficiency is relatively low, but still not reaching the 0.0010 test standard, which further verifies the data accuracy and reliability of the results.
(2) Local spatial autocorrelation
The global spatial autocorrelation Moran’s I index is a regional overall measurement index, only reflecting the average degree of spatial correlation between regions and surrounding areas. In order to comprehensively reflect the change trend of regional spatial differences, the local autocorrelation analysis method was also employed for analysis [32,33]. Using the comparative advantage of agricultural land efficiency and non-agricultural land efficiency as variable values, a series of Lisa significance maps were obtained by local spatial autocorrelation analysis of geo-da095i software (Figure 6). According to the Lisa map of local spatial autocorrelation, the high–high agglomeration areas of agricultural land efficiency are located in the Yangtze Huaihe plain and North China plain areas such as Hubei, Hunan, Guizhou and Guangxi, while the low–low agglomeration areas are located in Hanzhong and southwest Yunnan Guizhou plateau areas such as Shaanxi, Chongqing, Sichuan, Guizhou and Yunnan. The agglomeration characteristics for the comparative advantage of non-agricultural land efficiency are basically opposite to the comparative advantage of agricultural land efficiency, which also confirms the inverse relationship between the two described in the previous theory. Therefore, it can be seen from Table 5 that the Moran’s I index of global spatial autocorrelation of the comparative advantage of agricultural land efficiency is greater than 0, indicating that the comparative advantage of agricultural land efficiency has a certain degree of spatial positive correlation, while the Moran’s I index of global spatial autocorrelation of non-agricultural land efficiency is less than 0, suggesting that the comparative advantage of non-agricultural land efficiency has a certain degree of spatial negative correlation, but the p-value of the two has not passed the 0.0010 test standard, also showing that the degree of spatial autocorrelation of the comparative advantage of industrial land efficiency in China is not high. Still, the local spatial autocorrelation reveals that there are dense and obvious high–high agglomeration areas or low–low agglomeration areas in local areas, which can further display that the local spatial autocorrelation is the supplement and improvement of the global spatial autocorrelation.
(3) Kernel density analysis
From the regional analysis of kernel density curve and its enclosure, the comparative advantage curve of agricultural land efficiency in the three periods gradually moved to the right area with a high value, indicating that the overall level of comparative advantage of agricultural land efficiency gradually increased. The trend of the curve moving to the right area from 2015 to 2019 was not as obvious as that of the previous statistical period from 2010 to 2015, indicating that the improvement rate of comparative advantage is slowing down. The three curves for the comparative advantage of non-agricultural land efficiency showed a slight shift to the right as a whole, but the degree of movement was not obvious, indicating that the overall level of the comparative advantage of non-agricultural land efficiency increased slowly. From the analysis of curve shape, it is showed a “single peak” pattern in 2010, 2015 and 2019, the wave crest is convex with obvious single peak. The kernel density curve had obvious characteristics of single peak moving to the right and the wave crest moving to the right as a whole. Compared with the previous two statistics, in 2019, the wave width was further enlarged and increased to about 0.00 ~ 35.00, which clearly displays that the regional gap is widened as well as the overall level is significantly improved. In 2010, the comparative advantage of non-agricultural land efficiency showed a “three peaks” pattern, with the second wave peak adjacent to the third wave peak, and the corresponding comparative advantage value of non-agricultural land efficiency (about 0.40 and 0.50) is much higher than that of the first wave peak (about 0.25), indicating that some regions are concentrated at a high level, mainly in Beijing, Shanghai, Tianjin, Tibet and other provinces, where the comparative advantage of non-agricultural land efficiency is much higher than that of other regions, forming a small number of high-level concentration areas. In 2015 and 2019, the curve was “multi-peaked”, and the wave width did not shrink significantly, showing that the difference between the regions is still large (Figure 7).

4.4. Analysis of Influencing Factors of Comparative Advantage of Land Use Efficiency

Land use refers to the long-term or periodic management of land through various activities for social and economic purposes. Land use change is the most prominent landscape sign of the earth’s surface system, which can be divided into nature driving and human driving, reflected in the land use type, quantity, scale, structural proportion and spatial layout [34]. Similarly, the comparative advantage of land use efficiency is the result of the joint force of various natural and human factors, among which the former includes geographical location, topography and geomorphology, climate, hydrology and the process of surface transformation due to the formation of unique soil. The latter mainly includes human beings’ active natural transformation of nature to form a social system, characterized by industrial metabolism and land transformation. Tumer further divides it into a network of changes in population and income, technological changes, political and economic system changes and cultural changes [35]. Nature driving is an internal basic condition with a long action time and slow effect, while human driving is an external-inducing condition with a short action time and fast effect [36,37]. From the analysis of the characteristics of China’s industrial structure and land use change, the long-term overall change trend is stable, but since the reform and opening up, especially in the 21st century, due to the “two-wheel driving” of industrialization and urbanization, the industrial structure and land use have changed dramatically, resulting in great changes in land use type, scale and spatial layout, which further shows that human driving factors play a leading role [38,39]. In this paper, a total of 10 indicators involving 4 evaluation indicators of agricultural land use efficiency and 6 evaluation indicators of non-agricultural land efficiency have been used as independent variables, and the 5 indicators of first industry output value per land, per capita local fiscal expenditure, proportion of secondary vocational school and higher education, average altitude and total water resources have been matched with the evaluation space unit after removing collinear indicators through the ordinary least square method (OLS). The geographical weighted regression model (GWR) was employed to analyze the influencing factors of the advantage of industrial land efficiency. The results for the model show that the goodness of fit of the comparative advantage model of agricultural land efficiency and non-agricultural land efficiency were 0.7480 and 0.9155, respectively, and the AICC values were 136.9208 and −14.3009, respectively. The overall fitting effect is good (Table 6, Figure 8, Figure 9 and Figure 10).
(1) Analysis of influencing factors of agricultural land efficiency comparative advantage
From the perspective of land use output, the primary output value of land per capita, as an important indicator of agricultural land efficiency, is also a key indicator of comparative advantage degree of agricultural land efficiency, whose influencing degree has obvious spatial heterogeneity and hierarchy, showing a gradual decreasing trend from northwest and southwest to northeast. It demonstrates that the northwest, southwest and central regions have the potential to improve the primary output value of land per capita. From the perspective of land use input, the local fiscal expenditure is negatively correlated with the comparative advantage of agricultural land efficiency, that is, the more local fiscal expenditure per capita is, the weaker the comparative advantage of agricultural land efficiency. The most typical and the highest negative correlation is represented by the Beijing–Tianjin–Hebei region and the northeast, indicating that a large part of local government fiscal expenditure is more invested in the non-agricultural sectors and relatively less in the agricultural sectors. The future fiscal expenditure should be appropriately inclined to agricultural development. The proportion of secondary vocational education or above, also an important indicator of the input of agricultural development talents, is negatively correlated with the comparative advantage of agricultural land efficiency, especially in the southwest and central provinces, which indicates that the higher the education level is, the fewer the talents will be invested in the agricultural sector. The government should strengthen the policy preference for agricultural talents to improve the comparative advantage of agricultural land efficiency and coordinate with non-agricultural development. From the perspective of agricultural resource endowment, the average altitude has a negative correlation with the comparative advantage of agricultural land efficiency, especially in Inner Mongolia, Gansu and Ningxia. The regression coefficient of the average altitude between the eastern and central regions, as well as Tibet, Xinjiang, Yunnan and Northeast China is small, indicating that there are other natural factors influencing agricultural production. The total amount of water resources and the comparative advantage of agricultural land use efficiency present a positive regression coefficient, indicating that agricultural development is closely related to water resource conditions. The impact is greater in the northern and western regions while the impact is relatively small in the eastern coastal, southern and other areas with sufficient rainfall.
(2) Analysis of influencing factors of non-agricultural land efficiency comparative advantage
The primary output value of land per capita was not used as an output factor of non-agricultural land, showing no direct correlation with the comparative advantage of non-agricultural land efficiency. However, it has a positive correlation with agricultural land efficiency, resulting in a negative effect on the comparative advantage of non-agricultural land efficiency. The regression coefficient of the primary output value of land per capita is negative, which further confirms that the development of the secondary and tertiary industries should be guided to feed the development of agriculture in the future, which will promote the coordinated and integrated development of the primary, secondary and tertiary industries. The regression coefficients of per capita local fiscal expenditure and the comparative advantage of non-agricultural land efficiency are both positive, and the spatial pattern presents a relatively obvious three-tiered pattern in the east, central and west, which is exactly opposite to the comparative advantage of agricultural land efficiency, further indicating that a large part of local fiscal expenditure still serves the development of secondary and tertiary industries, but provides less support to agricultural production and has little impact. For the educational development level represented by the proportion of secondary vocational education or above, the regression coefficient of the central and western regions is positive while the regression coefficient of the central, northern and northeastern regions is all negative, which is due to the quantity of talents in non-agricultural sectors not only depending on the local education level, but is also influenced by the characteristics of the migration of talents in different places. In addition, natural endowment factors such as average altitude and total water resources have a negative influence on the comparative advantage of non-agricultural land efficiency. The eastern coastal and northeastern regions are more negatively influenced by the natural endowment factors while the central and western regions have a smaller negative influence, indicating that the comparative advantage of non-agricultural land efficiency should be impacted by other factors besides natural conditions, also showing that the comparative advantage of non-agricultural land efficiency does not only depend on the influence of natural factors.

5. Conclusions and Discussion

5.1. Discussion

Land use involves many factors such as land, capital, labor, management, location, system and policy. Each region has its own unique or comparative advantages in one or more of the above factors; if it can capture and identify its advantageous industries and implement them, it is bound to transform resource advantages into economic advantages [22,40]. The theory of comparative advantage plays an important theoretical guiding role. It is fundamental to determine the type, scale and mode of land use [9,11]. The optimal allocation of land resources between regions according to the principle of comparative advantage can make different regions obtain their own comparative efficiency and improve the overall welfare of regional land resource utilization. Land use efficiency is the best indicator for the comprehensive evaluation of land use effect, and land resources can be optimally allocated according to comparative advantages of land use efficiency [41]. Centering on the comparative advantage of land use efficiency, it is a worthy topic to study how to make full use of and enhance such comparative advantage and promote the development and utilization of comparative advantage resources. Therefore, by referring to the existing research basis such as land use efficiency, industrial structure and the use of comparative advantage, comprehensively applying model algorithms such as TOPSIS, GIS spatial analysis and geographically weighted regression, the theoretical analysis paradigm of comparative advantage was introduced to construct the evaluation index system of agricultural land efficiency and non-agricultural land efficiency. Based on the provincial panel data of China in 2010, 2015 and 2019, the land use efficiency and its comparative advantages were evaluated by industry types, and the influencing factors were further explored. This study has introduced the theory of comparative advantage, used land use efficiency as the research object, measured the comparative dominance of land use efficiency, and effectively guided the adjustment of industrial structure and the optimization of overall land use efficiency. Looking at the current research trends, the results of this study are relatively ideal with some theoretical innovation and practical value, which can effectively and accurately guide policy formulation such as improving land use efficiency and adjusting industrial structure.
It has been found there are obvious differences in the comparative advantage of land use efficiency among different regions in China, which also provides a complementary basis for optimizing the allocation of land resources and upgrading the differentiated industrial structure. This is consistent with the conclusions drawn from the existing studies on industrial development [42] and land use [43], but there are also different aspects, of which the most prominent is that in the process of formulating an industrial structure adjustment strategy, land use efficiency and regional comparative advantages are less considered, which is reflected in the lack of regional development differences in land use policy design. Based on the comparative advantages of land use, the implementation of the overall strategy for regional development, and a mechanism for coordinated regional development featuring complementary advantages and positive interactions, the regional comparative advantages will be brought into full play. This study, with comprehensive, and unique research value, differs from other research [44,45]. As an entry point, the breakthrough and decision-making basis for the national macro control of economical and intensive land use and the protection of cultivated land resources, land elements can be incorporated into the decision-making process of population, industry, land and ecological environment in a long period of development in the future, so as to maximize the overall welfare of regional land use and promote the high-quality development of a social economy.
With social and economic transformation and upgrading, the flow of production resources and industrial transfer between regions may be further accelerated, and even the reconstruction of urban and rural land space may be further accelerated. Due to the influence of the market mechanism, industrial development, infrastructure and unique geographical conditions, China’s non-agricultural industries will continue to concentrate in the eastern regions and large urban agglomerations in the present and future periods. The central and western regions, with relatively high non-agricultural land efficiency comparative advantages, supported by national financial transfer payments and preferential policies, should accelerate the transfer of industries and promote a balanced regional development. The central and northeastern regions, with relatively high agricultural land efficiency, should, under the conditions of following natural laws, accelerate the production layout of centralized agriculture as well as the realization of agricultural industrialization and modernization, actively promote the transformation of agricultural production facilities and basic supporting investment, give full play to the comparative advantages of agricultural land efficiency and maximize the land use efficiency of the whole region. Many scholars have obtained the above suggestions or conclusions from other perspectives [46]. This study, with the comparative advantage of land use efficiency as the criterion, conducted a relatively comprehensive and systematic study from the two dimensions of agriculture and non-agriculture.
From the perspective of non-agricultural land spatial layout, the layout of regional non-agricultural land space should be optimized with overall consideration by giving priority to efficiency. In the eastern coastal, riverside and other urban agglomerations, through fully considering the relatively high benefits and comparative advantages of non-agricultural land, improving the economical and intensive use of land, properly tilting the indicators of non-agricultural land, easing the land policy constraints such as “non-agricultural” and “non-grain” of cultivated land, especially the pressure on the protection of cultivated land and permanent basic farmland, the requirements for the delimitation and control of “three zones and three lines” of differentiated land space will be effectively implemented. In the western and northern regions with relatively high comparative advantages of non-agricultural land efficiency, developing non-agricultural production has more potential comparative advantages than agricultural production. Therefore, the proper layout of non-agricultural industries and the centralized promotion of urbanization can be carried out, which will be more conducive to the overall improvement of land use efficiency and promote the coordinated development of social economy in the western and northern regions. It also conforms to the western development strategy and alleviates the current imbalance and inadequacy of development.
From the perspective of spatial layout of agricultural land, total balance should be maintained, comparative advantages should be highlighted and contiguously advantageous agricultural areas should be appropriately expanded. The central region, Northeast China and other regions with high comparative advantages in agricultural land efficiency can be targeted, where the protection of cultivated land and permanent basic farmland should be appropriately increased, and government investment in agricultural infrastructure as well as agricultural production conditions, such as the construction of high-standard farmland and comprehensive land improvement in the whole region, should be expanded. In particular, for the vast areas such as the western and northern regions, due to the constraints of natural factors such as geography, climate, hydrology, the efficiency of agricultural land and its comparative advantages are low. In addition, due to the strict requirements of ecological environmental protection, partial improvement of agricultural production conditions and the corresponding development of agricultural types, it is recommended that large-scale comprehensive agricultural development should be avoided, and large-scale non-agricultural construction, development and utilization should not be carried out. Proper agricultural production or non-agricultural construction should only be carried out under the conditions that the ecological environment can bear. This conclusion may be different from other relevant research conclusions [47,48], which also reflects the unique perspective.
In conclusion, from the perspective of the agricultural industry and non-agricultural industry, this study conducted in-depth research on the comparative advantage of land use efficiency, which can provide a scientific decision-making basis for an industrial structure layout and the optimal allocation of land resources. However, there are also aspects for further research. First, from the macro level, the industry was only divided into agricultural industry and non-agricultural industry, without specification according to the industry classification of the national economy. The industry segmentation type can be deepened from the meso or even micro spatial scale in the next step. Second, from the two dimensions of agricultural industry and non-agricultural industry, the evaluation index system of land use efficiency and the influencing factors of comparative advantage of land use efficiency were constructed. The research conclusions are more in line with the objective reality. However, from the perspective of science, rationality as well as regional scale, it is suggested that future research should be combined with geospatial scale transformation and local differences to construct a more appropriate evaluation index system of land use efficiency and further deepen the theoretical exploration of the influencing factors of comparative advantage. It is worth mentioning that to explore the factors influencing the comparative advantage of land use efficiency, in addition to natural conditions, agricultural production dependence and market demand, importance should be attached to other factors such as policy support, agricultural technology progress and industrial structure adjustment to comprehensively explain the spatiotemporal heterogeneity characteristics.

5.2. Conclusions

(1) The efficiency of agricultural land is gradually increasing, and the differences among provinces in different periods range from expansion to contraction. Spatially, a hierarchical decreasing structure is formed from the southeast coast to the northwest inland, and from the eastern plain to the western plateau. The efficiency of non-agricultural land is gradually increasing, with an overall low efficiency value, and the differences between regions are expanding year by year, a gradual decline that is still shown in the spatial pattern of the eastern, central and western regions. It can be seen that the spatial layout of agricultural land efficiency and non-agricultural land efficiency presents synchronous changes. According to the gradual decline trend in the east, middle and west, it turns out that it is difficult to optimize the allocation of land resources by employing land use efficiency. It is precisely the comparative advantage of land use efficiency that can make up for this deficiency.
(2) The comparative advantage of agricultural land use efficiency shows a gradual downward trend and the difference between regions is further narrowing. The high-value regions are still concentrated in the areas with superior agricultural resource endowment and dominant agricultural industry advantages, such as the middle and lower reaches of the Yellow River plain region, the middle and lower reaches of the Yangtze River plain region and the central regions with dominant agricultural advantages, which are always the concentrated areas of grain production and the main provinces of grain output in China, serving as the important bases of China’s food security. It is recommended that these regions should be used as the distribution area of agricultural concentrated production in the future. In urban agglomeration, metropolitan areas and other surrounding areas, the agricultural land efficiency comparative advantage is relatively small and caused by the high non-agricultural land efficiency, and the vast northwest areas, due to the poor agricultural natural conditions, result in the smaller agricultural land efficiency comparative advantage. The overall comparative advantage of non-agricultural land efficiency showed an increasing trend. The high-value areas are concentrated in urban agglomeration, metropolitan areas and other areas with high non-agricultural land efficiency, as well as the vast remote areas such as northwest and southwest where the agricultural land efficiency is extremely low and in turn, the comparative advantage of non-agricultural land efficiency has been improved.
(3) From the perspective of global spatial correlation, the spatial agglomeration degree of the comparative advantage of agricultural land efficiency and non-agricultural land efficiency is not significant, indicating that the comparative advantage degree of land use efficiency has not formed a hot trend of centralized or concentrated development. However, the comparative advantage degree of agricultural land efficiency is higher than that of non-agricultural land efficiency, showing that agricultural development and utilization can be arranged in “planar” wide-area contiguous plots while non-agricultural land development and utilization may be more suitable for “point-like” centralized development. From the perspective of local spatial correlation, the spatial layout of the agricultural land efficiency comparative advantage is opposite to that of the non-agricultural land efficiency comparative advantage, which confirms and supplements the results of the global spatial correlation analysis. It can be seen that from the perspective of spatial differences, it is necessary and feasible to achieve a differentiated management of the optimal allocation of land resources and optimization and upgrading of the industrial structure.
(4) In the analysis of the influencing factors on the comparative advantage of land use efficiency, apart from the two factors of per capita local fiscal expenditure and the proportion of secondary vocational education and above, the influence of other factors on the comparative advantage of agricultural land use efficiency has obvious regional differences, restricted by natural resource endowment and the degree of agricultural development. The regression coefficients of each influencing factor show obvious hierarchical distribution characteristics in space. The influence of various factors on the comparative advantage of non-agricultural land efficiency shows a more obvious zonal spatial distribution law, and aside from the factor of per capita local fiscal expenditure, the regression coefficients of other factors are negative, indicating that the influence on the comparative advantage of non-agricultural land efficiency is more external and complex.

Author Contributions

Conceptualization, S.F., B.Y. and R.Y.; data curation, J.Y., Y.M. and J.C.; formal analysis, S.F. and R.Y.; investigation, X.X., Y.M. and B.Y.; methodology, S.F., B.Y. and Y.M.; project administration, S.F.; resources, X.X. and R.Y.; software, B.Y., J.Y., J.C. and Y.M.; validation, S.F.; writing—original draft, S.F. and B.Y.; writing—review and editing, S.F. All authors have read and agreed to the published version of the manuscript.

Funding

This research is supported by the natural science foundation of Anhui province, grant number 1908085QG310; Key research projects of humanities and social sciences in colleges and universities in Anhui province, grant number SK2021A0155; Anhui natural resources science and technology project, grant number 2022-K-6; The general project of National Natural Science Foundation of China, grant number 71873003; The prosperity and development philosophy and social science fund project of Anhui Agricultural University, grant number 2018zs12zd; the Anhui Agricultural University introducing the stable talents project, grant number yj2018-60; The national innovation and entrepreneurship training program for college students, grant number 202110364031; The Anhui College Students’ innovation and entrepreneurship training project, grant number S202010364063.

Institutional Review Board Statement

Not applicable.

Informed Consent Statement

Informed consent was obtained from all subjects involved in the study.

Data Availability Statement

All data generated or analyzed during this study are included in this published article.

Conflicts of Interest

The authors declare no conflict of interest.

References

  1. Tang, Y.K.; Yang, Y.F.; Xu, H. The Impact of China Carbon Emission Trading System on Land Use Transition: A Macroscopic Economic Perspective. Land 2021, 11, 41. [Google Scholar] [CrossRef]
  2. Shao, S.; Fan, M.T.; Yang, L.L. Economic Restructuring, Green Technology Progress and China’s Low-carbon Transformation and Development: An Empirical Examination Based on the Perspective of Overall Technology Frontier and Spatial Spillover Effect. Manag. World 2022, 38, 46–69. [Google Scholar]
  3. He, L.; Wang, B.P.; Xu, W.T.; Cui, Q.; Chen, H. Could China’s long-term low-carbon energy transformation achieve the double dividend effect for the economy and environment. Environ. Sci. Pollut. Res. Int. 2021, 29, 20128–20144. [Google Scholar] [CrossRef]
  4. Liang, X.Y.; Jin, X.B.; Sun, R.; Hang, B.; Ren, J.; Zhou, Y.K. Elastic space for cultivated land conservation in China under the constraints of the bottom line of multi-scenario food security. Acta Geogr. Sin. 2022, 77, 697–713. [Google Scholar]
  5. Cao, Y.; Li, G.Y.; Wang, J.Y.; Fang, X.Q.; Sun, K.Y. Systematic cognition and research framework of non-food cultivated land: From food security to multidimensional security. China Land Sci. 2022, 36, 1–12. [Google Scholar]
  6. Huang, Z.H.; Li, Y.Y.; Mao, X.H. The current situation and countermeasures of “non-agriculture” and “non-grain” of cultivated land in China. JAC Forum 2022, 4, 13–21. [Google Scholar]
  7. Tang, H.Z.; Sang, L.L.; Yun, W.J. China’s arable land to supplement balance policy implementation dilemma and scientific and technological innovation direction. Proc. Chin. Acad. Sci. 2020, 5, 637–644. [Google Scholar]
  8. Tang, M.; Shao, L. Arable land protection policy and local government land transfer behavior. J. Financ. Econ. 2022, 48, 123–137. [Google Scholar]
  9. Jiang, K.H.; Chen, J.L.; Chen, W. Comparative Advantage Theory and Regional Land Resource Allocation: A Case Study of Jiangsu Province. China Rural. Econ. 2004, 12, 16–21. [Google Scholar]
  10. Zhu, Z.; Zhang, L.; Ye, X.W.; Zhang, Y. Comprehensive efficiency evaluation of land use based on TOPSIS method. Econ. Geogr. 2012, 32, 139–144. [Google Scholar]
  11. Gu, X.; Qu, F.T.; Fu, G.H. China’s comparative advantages in land use and regional industrial restructuring. China Land Sci. 2009, 23, 61–65. [Google Scholar]
  12. Li, Y.; Sun, Z.G.; Liu, E.Y.; Shao, C.X. Spatial-temporal evolution analysis of regional breeding structure in China based on the theory of comparative advantage. J. Nat. Resour. 2021, 36, 1149–1162. [Google Scholar]
  13. Edjah, B.K.T.; Wu, J.P.; Tian, J.J. Research on the Comparative Advantage and Complementarity of China–Ghana Agricultural Product Trade. Sustainability 2022, 14, 13136. [Google Scholar] [CrossRef]
  14. Deng, X.G.; Cao, H. Industrial Upgrading Path Selection: Following or Deviating from Comparative Advantage: An Empirical Analysis Based on Product Space Structure. China Ind. Econ. 2016, 2, 52–67. [Google Scholar]
  15. Wang, B.X.; Zhou, Y.C. Research on land resource allocation efficiency in Zhejiang Province based on comparative advantages. Econ. Geogr. 2017, 7, 185–190. [Google Scholar]
  16. Bi, B.D. Land Economics, 4th ed.; China Renmin University Press: Beijing, China, 2002. [Google Scholar]
  17. Jiang, Z.D. Territorial allocation and layout strategy of land use in China. China Agric. Resour. Zoning 2004, 1, 8–11. [Google Scholar]
  18. Shi, J.; Huang, Z.J.; He, C.F.; Wang, W.K. Comprehensive evaluation of land use efficiency in urban agglomerations in China. Econ. Geogr. 2013, 33, 76–81. [Google Scholar]
  19. Lin, Y.F. New Structural Economics–Restructuring the Framework of Development Economics. Econ. (Q.) 2011, 10, 1–32. [Google Scholar]
  20. Qiu, J.D.; Zhao, J.F.; Wu, J.S. Measurement of regional land use efficiency level in China based on coupling relationship. Chin. Resour. Environ. 2012, 22, 103–110. [Google Scholar]
  21. Zhao, T.; Chen, Z. Comparative Advantage and Industrial Policy Effect: Regional Differences and Institutional Causes. Soc. Sci. Dig. 2020, 19, 777–796. [Google Scholar]
  22. Wang, J.G.; Yang, L.Z.; Ma, Y.J. Comparative Advantage and Land Use: A Case Study of Southern Jiangsu. Soil 2002, 4, 185–190. [Google Scholar]
  23. Research Group of the Investment Research Institute of the National Planning Commission; the Regional Institute of Renmin University of China. Research on China’s Regional Comparative Advantage. Manag. World 2001, 2, 45–55. [Google Scholar]
  24. Li, Z.Q.; Li, X.Y.; Wang, J.X. The Causes of Spatial Mismatch between Food Production and Water Resources: Based on the Theory of Comparative Advantage. J. China Agric. Univ. 2022, 27, 12–29. [Google Scholar]
  25. Lin, Y.F.; Fu, C.H. Comparative Advantage and Competitive Advantage: A Perspective from New Structural Economics. Econ. Res. Stream 2022, 57, 23–33. [Google Scholar]
  26. Wang, M.T.; Ye, C.M.; Zhang, D.K. Evaluation of Green Manufacturing Level in China’s Provincial Administrative Regions Based on Combination Weighting Method and TOPSIS. Sustainability 2022, 14, 13690. [Google Scholar] [CrossRef]
  27. Xu, M.; Xu, J.; Wang, Y.S.; Tang, J.; Wu, B.; Xie, Y.J. Construction safety evaluation of TOPSIS metro station based on CRITIC method. J. Nat. Disasters 2022, 31, 157–166. [Google Scholar]
  28. Stiglitz, E. Economics, 2nd ed.; China Renmin University Press: Beijing, China, 2000. [Google Scholar]
  29. Li, D.C.; Fan, K.K.; Lu, J.Q.; Wu, S.; Xie, X.W. Research on Spatio-Temporal Pattern Evolution and the Coupling Coordination Relationship of Land-Use efficiency from a Low-Carbon Perspective: A Case Study of Fujian Province. Land 2022, 11, 1498. [Google Scholar] [CrossRef]
  30. Sun, H.Y.; Cheng, L.L.; Li, Z.; Wang, Q.Y.; Teng, J.H. A land-use efficiency evaluation system with case study verification. PLoS ONE 2022, 17, e0271557. [Google Scholar]
  31. Fan, S.P.; Liu, Y.Z.; Cheng, J.M.; Ding, Z.; Zhang, B.E. The degree of response of land use efficiency to industrial structure upgrading in the transition period and its impact mechanism. Chin. J. Soil Sci. 2021, 52, 1034–1041. [Google Scholar]
  32. Su, H.; Chen, Y.M.; Tan, H.Y.; Zhou, A.N.; Chen, G.D.; Chen, Y.J. Estimating Regional PM2.5 Concentrations in China Using a Global-Local Regression Model Considering Global Spatial Autocorrelation and Local Spatial Heterogeneity. Remote Sens. 2022, 14, 4545. [Google Scholar] [CrossRef]
  33. Getis, A.; Ord, J.K. The analysis of spatial association by use of distance statistics. Geogr. Anal. 1992, 24, 189–206. [Google Scholar] [CrossRef]
  34. Fan, S.P.; Liu, Y.Z.; Cheng, C.K.; Zhang, H.M.; Zhong, T.Y. Measurement and comprehensive judgment of land use efficiency in Chaohu Basin. Soil 2017, 49, 838–845. [Google Scholar]
  35. Turner, B.L., II; Clark, W.C.; Kates, R.W.; Richards, J.F.; Mathews, J.T.; Meyer, W.B. The Earth as Transformed by Human Action: Global and Regional Changes in the Biosphere over the Past 300 Years; Cambridge University Press: Cambridge, UK; New York, NY, USA, 1990. [Google Scholar]
  36. Gao, S.; Li, Z.; Chen, M.Y.; Lin, P.R.; Hong, Z.; Allen, D.; Neeson, T.; Hong, Y. Spatiotemporal variability of global river extent and the natural driving factors revealed by decades of Landsat observations, GRACE gravimetry observations, and land surface model simulations. Remote Sens. Environ. 2021, 267, 112725. [Google Scholar] [CrossRef]
  37. Bănăduc, D.; Marić, S.; Cianfaglione, K.; Afanasyev, S.; Somogyi, D.; Nyeste, K.; Antal, L.; Koščo, J.; Ćaleta, M.; Wanzenböck, J.; et al. Steppingstone Wetlands, Last Sanctuaries for European Mudminnow: How Can the Human Impact, Climate Change, and Non-Native Species Drive a Fish to the Edge of Extinction. Sustainability 2022, 14, 13493. [Google Scholar] [CrossRef]
  38. Xie, C.Y.; Hu, H.H. Land Resource Allocation and Urban Innovation in China: Mechanism Discussion and Empirical Evidence. China Ind. Econ. 2020, 12, 83–101. [Google Scholar]
  39. Liu, J.Y.; Kuang, W.H.; Zhang, Z.X.; Xu, X.L.; Qi, Y.W.; Ning, J.; Zhou, W.C.; Zhang, S.W.; Li, R.D.; Yan, C.Z.; et al. The basic characteristics and spatial pattern of land use change in China since the 80s of the 20th centuries. J. Geogr. Sci. 2014, 24, 195–210. [Google Scholar] [CrossRef]
  40. Li, L.X.; Shen, G.J. Economic Development Zones, Regional Comparative Advantages and Industrial Structure Adjustment. Econ. (Q.) 2015, 14, 885–910. [Google Scholar]
  41. Zhu, W.J.; Sun, H. Spatiotemporal evolution and driving force of urban land use efficiency in Jiangsu Province. China Land Sci. 2019, 33, 103–112. [Google Scholar]
  42. Xiang, S.L.; Tian, R.Z. Biased Technological Progress and Dynamic Comparative Advantage: Theory and Chinese Industry Experience. Econ. Rev. 2020, 5, 44–62. [Google Scholar]
  43. Liu, J.Y.; Ning, J.; Kuang, W.H.; Xu, X.L.; Zhang, S.W.; Yan, C.Z.; Li, R.D.; Wu, S.X.; Hu, Y.F.; Du, G.M.; et al. Spatial-temporal pattern and new characteristics of land use change in China from 2010 to 2015. Acta Geogr. Sin. 2018, 73, 789–802. [Google Scholar]
  44. Ji, X.M.; Wang, K.; Ji, T.; Zhang, Y.H. Coupling Analysis of Urban Land Use efficiency: A Case Study of Xiamen City. Land 2020, 9, 155. [Google Scholar] [CrossRef]
  45. Xia, H.; Yuan, S.F.; Yang, L.X. Research on the spatial pattern evolution and driving factors of land economic efficiency in Zhejiang County. Resour. Environ. Yangtze Basin 2017, 26, 341–349. [Google Scholar]
  46. Wang, K.; Tang, Y.K.; Chen, Y.Z.; Shang, L.W.; Ji, X.M.; Yao, M.C.; Wang, P. The Coupling and Coordinated Development from Urban Land Using efficiency and Urbanization Level: Case Study from Fujian Province (China). Int. J. Environ. Res. Public Health 2020, 17, 5647. [Google Scholar] [CrossRef]
  47. Liao, J.; Peng, X.; Wang, Q.; Jian, P.; Wu, Q. Study on the coupling and coordination relationship of urban land use efficiency in urban agglomeration on the west coast of Taiwan Strait. World Reg. Stud. 2021, 30, 556–566. [Google Scholar]
  48. Hu, Y.; Qiao, W.; Wan, Y.; He, T.; Chai, Y.; Bi, Y. Comprehensive Evaluation and Spatial Distinction of Land Use efficiency in County Area of Jiangsu Province. Econ. Geogr. 2020, 40, 186–195. [Google Scholar]
Figure 1. Land production possibility curve in different regions.
Sustainability 15 07048 g001
Figure 2. The production possibility curve of different regions under the comparative advantage.
Sustainability 15 07048 g002
Figure 3. Inverse function of comparative advantage degree of industrial land use.
Sustainability 15 07048 g003
Figure 4. Spatial pattern of comparative advantage of industrial land efficiency in China.
Sustainability 15 07048 g004
Figure 5. Moran scatter diagram of global spatial autocorrelation of comparative advantage of China’s industrial land efficiency. (a) Comparative advantages of agricultural land efficiency (2010). (b) Comparative advantages of agricultural land efficiency (2015). (c) Comparative advantages of agricultural land efficiency (2019). (d) Comparative advantages of non-agricultural land efficiency (2010). (e) Comparative advantages of non-agricultural land efficiency (2015). (f) Comparative advantages of non-agricultural land efficiency (2019).
Sustainability 15 07048 g005aSustainability 15 07048 g005b
Figure 6. LISA map of local spatial autocorrelation of China’s industrial land efficiency comparative advantage.
Sustainability 15 07048 g006aSustainability 15 07048 g006b
Figure 7. Kernel density estimation curve of comparative advantage of industrial land efficiency in China. (a) Comparative advantages of agricultural land efficiency. (b) Comparative advantages of non-agricultural land efficiency.
Sustainability 15 07048 g007
Figure 8. Spatial layout of standard residuals in the GWR model. (a) Comparative advantage of agricultural land efficiency. (b) Comparative advantage of non-agricultural land efficiency.
Sustainability 15 07048 g008
Figure 9. Spatial layout of regression coefficients in GWR model for comparative advantage of agricultural land efficiency. (a) Regression coefficient of the first industry output value per land. (b) Regression coefficient of local fiscal expenditure per capita. (c) Proportion of secondary vocational education or above is the regression coefficient. (d) Average altitude. (e) Total water resources.
Sustainability 15 07048 g009
Figure 10. Spatial layout of regression coefficients in GWR models for comparative advantages of non-agricultural land efficiency. (a) Regression coefficient of the first industry output value per land. (b) Regression coefficient of local fiscal expenditure per capita. (c) Regression coefficient of the proportion of secondary vocational education or above. (d) Average altitude. (e) Total water resources.
Sustainability 15 07048 g010
Table 1. Cost of land production in sectors of different regions.
Product (Efficiency)Area MArea N
1 unit AB3 hectares5 hectares
1 unit NAB2 hectares4 hectares
Table 2. Evaluation index system and weight of land use efficiency by industrial type.
Total Target LayerSub-Target LayerIndicator LayerInformation Entropy ejRedundancy djWeight wj
Land use efficiency Evaluation (IB)Efficiency evaluation of Agricultural land
(IB agriculture)
Land average output value of primary industry (IB agriculture 1)0.93610.06390.2513
Average agricultural added value (IB agriculture 2)0.93470.06530.257
Per capita disposable income of rural residents (IB agriculture 3)0.94190.05810.2288
Per capita consumption and expenditure of rural residents (IB agriculture 4)0.93320.06680.2629
Efficiency evaluation of non- agricultural land
(IB non agricultural)
Land average output value of secondary and tertiary industries (IB non-agricultural 1)0.73880.26120.3590
Non-agricultural level (IB non agricultural 2)0.98090.01910.0262
Average wage of employees in urban units (IB non-agricultural 3)0.93030.06970.0958
Per capita consumption expenditure of urban residents (IB non agricultural 4)0.9370.0630.0866
Average local fiscal revenue (IB non agricultural 5)0.69870.30130.4143
Greening coverage rate of built-up area (IB non agricultural 6)0.98680.01320.0181
Table 3. The efficiency value of China’s provincial industrial land.
Evaluation UnitEfficiency Evaluation of Agricultural Land
(IB agriculture)
Efficiency Evaluation of Non-Agricultural Land
(IB non agricultural)
2010 Year2015 Year2019 Year2010 Year2015 Year2019 Year
Beijing0.25190.40430.35390.12360.24560.3810
Tianjin0.23710.47010.37360.09590.20960.2310
Hebei0.21630.38710.42250.01130.02420.0443
Shanxi0.06940.18420.20150.00780.01850.0353
Inner Mongolia0.04970.19120.16270.00680.01750.0260
Liaoning0.19180.38180.33170.01580.02810.0401
Jilin0.10310.21520.18610.00630.01550.0267
Heilongjiang0.06940.19150.19320.00480.01240.0217
Shanghai0.33340.49120.52070.29690.66790.9932
Jiangsu0.39540.77750.80320.04480.09740.1443
Zhejiang0.27300.48180.57840.03180.05730.0950
Anhui0.19830.33260.43210.01010.02320.0490
Fujian0.20430.38730.51280.01440.03110.0529
Jiangxi0.12420.24800.27900.00690.01760.0357
Shandong0.35740.58950.64450.02630.05030.0701
Henan0.30230.45600.51960.01370.02740.0551
Hubei0.19060.35400.45990.00940.02330.0449
Hunan0.17920.32400.35130.00820.02090.0393
Guangdong0.21920.40190.52030.03150.05790.0942
Guangxi0.11430.23470.29030.00510.01470.0289
Hainan0.23870.43850.53490.00760.02060.0437
Chongqing0.13550.28070.42760.01300.03050.0546
Sichuan0.09520.21490.27400.00550.01740.0313
Guizhou0.05700.20860.26010.00340.01650.0342
Yunnan0.05030.15280.18720.00330.01360.0292
Tibet0.00920.08010.12310.00820.02680.0366
Shaanxi0.08000.18310.22120.00690.01780.0320
Gansu0.02520.11680.12520.00200.01320.0262
Qinghai0.02380.13120.12180.00410.01610.0277
Ningxia0.05780.17220.18240.00630.01820.0340
Xinjiang0.02800.13070.13460.00320.01610.0261
Maximum0.39540.77750.80320.29690.66790.9932
Minimum0.00920.08010.12180.00200.01240.0217
Average0.15750.31010.34610.02690.06020.0930
Table 4. Comparative advantage value of provincial industrial land efficiency in China.
RegionComparative Advantage Value of Agricultural Land Efficiency (AB agricultural i)Comparative Advantage Value of Non-Agricultural Land Efficiency (NAB non agricultural i)
2010 Year2015 Year2019 Year2010 Year2015 Year2019 Year
Beijing2.03741.64610.92870.49080.60751.0768
Tianjin2.47262.24241.61720.40440.44590.6183
Hebei19.149016.01809.54310.05220.06240.1048
Shanxi8.86879.96595.70630.11280.10030.1752
Inner Mongolia7.337110.92826.25040.13630.09150.1600
Liaoning12.169113.59498.27590.08220.07360.1208
Jilin16.337813.88836.96530.06120.07200.1436
Heilongjiang14.425315.38878.90920.06930.06500.1122
Shanghai1.12300.73540.52420.89051.35981.9075
Jiangsu8.82047.98215.56690.11340.12530.1796
Zhejiang8.59558.40476.08930.11630.11900.1642
Anhui19.675714.31648.82720.05080.06980.1133
Fujian14.183912.44929.70060.07050.08030.1031
Jiangxi17.977114.12167.81100.05560.07080.1280
Shandong13.565611.71769.20020.07370.08530.1087
Henan22.067016.65589.43500.04530.06000.1060
Hubei20.251115.215810.24490.04940.06570.0976
Hunan21.737015.47598.93060.04600.06460.1120
Guangdong6.94786.93785.52370.14390.14410.1810
Guangxi22.386015.978310.03420.04470.06260.0997
Hainan31.440421.282712.23220.03180.04700.0818
Chongqing10.46409.20827.83210.09560.10860.1277
Sichuan17.374412.33938.74370.05760.08100.1144
Guizhou16.642112.64397.60250.06010.07910.1315
Yunnan15.056111.24196.40650.06640.08900.1561
Tibet1.11832.99213.36710.89420.33420.2970
Shaanxi11.520410.27426.90830.08680.09730.1448
Gansu12.73588.84404.78590.07850.11310.2089
Qinghai5.79648.12934.40320.17250.12300.2271
Ningxia9.19759.47145.36470.10870.10560.1864
Xinjiang8.64278.09855.15550.11570.12350.1940
Maximum31.440421.282712.23220.89421.35981.9075
Minimum1.11830.73540.52420.03180.04700.0818
Average12.906910.90936.86730.15730.16540.2478
Table 5. The Stochastic sequence hypothesis test results for the global spatial autocorrelation of the comparative advantage of China’s industrial land efficiency.
TypeYearMoran’s IE[I]Meansdz-Valuep-Value
Efficiency of agricultural land20100.1849−0.0333−0.03330.10582.06180.0310
20150.0941−0.0333−0.03590.10541.23380.1160
20190.0935−0.0333−0.03520.10431.23260.1140
Non-agricultural land efficiency2010−0.0295−0.0333−0.03200.09540.02640.4130
2015−0.0453−0.0333−0.03440.0697−0.15600.4810
2019−0.0483−0.0333−0.03490.0737−0.18100.4570
Table 6. GWR model parameter estimation and test results.
Model-Related ParametersComparative Advantage of Agricultural Land EfficiencyComparative Advantage of Non-Agricultural Land Efficiency
Residual squares59.11380.3322
Effective number9.967812.4431
Sigma1.67650.1338
AICC136.9208−14.3009
R20.74800.9155
R2Adjusted0.64050.8634
Disclaimer/Publisher’s Note: The statements, opinions and data contained in all publications are solely those of the individual author(s) and contributor(s) and not of MDPI and/or the editor(s). MDPI and/or the editor(s) disclaim responsibility for any injury to people or property resulting from any ideas, methods, instructions or products referred to in the content.

