Article

From Hazardous Chrysotile and Polyamide Wastes into Sustainable Serpentine/Polyamide Nanocomposite Membrane: Fabrication, Characterization, and Environmental Application

by
Amal H. El Maghrabi
1,2,
Mohmmed M. El-Rabiee
1,
Bahaa S. Metwally
2,3,
Mostafa A. Masoud
2,*,
Mohamed H. Abdelaziz
2,
Petros Petrounias
4,
Nikolaos Koukouzas
4 and
Ahmed M. Zayed
2,*
1
Chemistry Department, Faculty of Science, Fayoum University, Fayoum 63514, Egypt
2
Applied Mineralogy and Water Research Lab (AMWRL), Geology Department, Faculty of Science, Beni-Suef University, Beni Suef 62521, Egypt
3
Textile Technology Department, Faculty of Technology and Education, Beni-Suef University, Beni Suef 62521, Egypt
4
Chemical Process & Energy Resources Institute, Centre for Research & Technology Hellas (CERTH), 15125 Athens, Greece
*
Authors to whom correspondence should be addressed.
Sustainability 2023, 15(9), 7060; https://doi.org/10.3390/su15097060
Submission received: 1 March 2023 / Revised: 11 April 2023 / Accepted: 18 April 2023 / Published: 23 April 2023

Abstract

:
Sustainable serpentine/polyamide nanocomposite (SP/PAM) was fabricated using malicious mining (serpentine chrysotile, SP Ctl) and industrial (polyamide, PA6) wastes via the electro-spinning technique. Before fabrication, the fibrous nature of Ctl was demolished through intensive grinding into nano-fractions. The successful impregnation of Ctl within PA6 via the electro-spinning technique at fixed ratios of precursor raw materials in the dissolving agent (7.5/92.5% SP/PA wt/wt solid/solid) created an internal network structure within the polymer fibers by molecular self-assembly. SP/PAM showcased its prowess in tackling the remediation of diverse dyes and Fe(III) from synthetic solutions in a batch system. Based on correlation coefficient outcomes (R2 ≈ 0.999), the pseudo-second-order equation justified the sorption data in an adequate way for all contaminants. In addition, intra-particle diffusion was not the only driving factor in the sorption process. Similarly, the Langmuir equation with maximum removal capacity (qmax) 5.97, 4.33, and 5.36 mg/g for MO, MB, and Fe(Ⅲ), respectively, defined the sorption data better than Freundlich.

1. Introduction

The basis for sustainable development in any civilization is energy supply, drinkable-water availability, raw-material depletion, and environmental protection. The most common challenging environmental problem that faces the globe today is the pollution of water, which leads to a shortage of clean water. By 2025, more than half of the world people will suffer from this problem [1]. This is accounted for by the ever-increasing and flourishing of industrial sectors in several countries producing organic and toxic water contaminants. Organic dyes are employed in numerous sectors, such as cosmetics, food processing, pharmaceuticals, paper, leather, textiles, and plastics [2]. Most of these dye pollutants are not only non-biodegradable but also have several malignant health issues such as cancer and/or mutagenesis [3]. Methyl orange (MO) anionic water-soluble azo-dye is a poisonous and cancer-causing substance that is commonly used in the majority of the aforementioned sectors [4]. Because of their stronger bonds, azo-dyes are non-degradable by standard treatment methods [5]. The cationic methylene blue (MB) is a cationic colorant from the phenothiazines family; it is a tricyclic phenothiazine, soluble in water and some organic solvents. Over the years, it has been used as a treatment for malaria, methemoglobinemia, among other pathologies with a formula of (C16H18ClN3S), which is a typical thiazine dye contaminant that is broadly applied for dyeing purposes, contributing to some devastating effects on both humans and marine life [6]. The ecosystem of water and underground aquifers, as well as human health, could be greatly endangered by the discharge of such dye effluents [7]. Moreover, contamination by heavy metals is the biggest problem facing the world community, even at the lowest concentrations. One such metal that occurs naturally in water is iron. It is the second predominating crustal element [8]. Consequently, for sustainability, the remediation of dyes and heavy metals from the aquatic systems utilizing innovative eco-friendly methods became a prerequisite. Currently, many purification technologies are used to solve this issue, such as photocatalytic degradation, chemical precipitation, biological oxidation, aeration, wetland treatment, bioremediation, Vyredox technology, and adsorption approach [9]. Despite the recorded efficiency of some of these approaches, chemical precipitation, and biological oxidation, all have drawbacks from an economic and environmental standpoint. This is a result of the inexcusable utilization of non-replenished and rather costly resources in pollution control applications. The photocatalytic degradation approach, on the other hand, has relatively modest flow rates that directly reduce dye removal [10]. Although aeration, wetland treatment, and Vyredox technology, as common methods for iron removal, had some merits including a simple operation, no use of chemicals, and low cost, they had an important demerit on the level of efficiency [11]. In contrast, due to low processing costs, ease of handling, flexibility, high efficiency, and simplicity of design, adsorption is a fashionable equilibrium separation technique for heavy metal and dye removal [12]. Numerous studies on effective nano-adsorbents have been conducted including nanoparticles [13], nanotubes [14], nanofiber [2], and nanocomposites [15]. Nanocomposites, incorporating nano-adsorbent and polymeric nanofiber, can avoid such problems when the use of these catalytic materials can help to improve the efficiency of diverse processes, as well as their economy, and even contribute to reducing the generation of waste and pollutants. Electro-spinning, as a low-cost and very simple technique, is the most applied approach in fabricating organic and inorganic nanofibers due to the high surface area, high porosity, superior permeability, excellent mechanical features, manageability, and unique physical characteristics [16]. Serpentinite, the ultramafic rock that is mainly composed of serpentine (SP) polymorphs (antigorite, chrysotile, and lizardite with chemistry Mg3Si2O5(OH)4 but variable crystalline structures), is the alteration product of magnesium-rich silicates such as dunite, peridotite, and pyroxenite via serpentinization processes [17]. Serpentinization is the most important alteration process to occur in ultramafic rocks, which accompanies the formation of the ocean floor [18]. In this process, olivine and pyroxene transform into serpentine, a laminate soft mineral which belongs to the phyllosilicate subclass of minerals and forms smooth surfaces [19]. Serpentinite dominantly consists of serpentine with inconsequential magnetite (Mag) and dolomite (Dol). Generally, serpentine polymorphs are distinguished by the existence of many OH groups that justify their unique surface charge and classify them as good adsorbents [20]. The fibrous nature of the chrysotile (Ctl) polymorph contributed to its categorization as one of the strongest, most flexible, and most heat-resistant fibers [21]. However, the release of such fiber during the mining process may cause asbestosis and lung cancer. Hence, such fibrous structure must be destroyed before any water treatment application below the limits defining the hazard fibers [22].
On the other hand, large amounts of non-biodegradable textile wastes are generated annually during the production or disposal of their products after utilization. Among the synthetic wastes, polyamides (PA), polyamide 6, and polyamide 6.6 are the most common. PA as a semi-crystalline structure has superior chemical resistance, as well as great thermal and mechanical futures [23]. Different fibrous composite membranes were created using polyamide (PA) as base layers together with a variety of materials, such as zeolite, fresh basalt, weathered basalt, carbon nanotubes, graphene oxide, etc. [5,24]. The present work aims to sustainably remediate dye (MB and MO) and heavy metal (FeⅢ) contaminants from aqueous solutions using innovative serpentine/polyamide membrane (SP/PAM) composite fabricated grounding on mining (Ctl as hydrophilic part) and industrial (PA6 as hydrophobic part) wastes via electro-spinning technique. Furthermore, the impact of several experimental parameters including pH, initial concentration, retention time, and dose on the remediation efficiency of the addressed contaminants by fabricated membrane composite was inspected.

2. Materials and Methods

2.1. Materials

Serpentinite representative samples, natural mining waste, were collected from the huge reserves at Wadi Atalla area, Eastern Desert, Egypt. In addition, industrial waste of polyamide (PA6) was delivered from Salamtext Factory, Egypt. Dissolving agent (formic acid 90%) was purchased from BDH Chemicals, Poole, Dorset, England. Dyes (MO and MB) and ferric chloride hexahydrate (FeCl36H2O) were delivered from Fluka, Zürich, Switzerland.

2.2. Preparation of the Collected Raw Materials

2.2.1. Preparation of Natural Mining Waste

A representative sample (about 500 g) from the collected serpentinites as mine wastes was intensively washed with distilled water (DW) to discard any deleterious materials such as clay or dust. After oven-drying at 105 °C overnight, a grinding process using a laboratory ball mill (RETSCH PM 100/Retsch GmbH, Hann, Germany) was conducted for two portions of the prepared sample for about ½ h and 50 h at 450 rpm to get the desired Ctl micro- and nano-size, respectively. The grinding to nano-size was a necessity to overcome the malignant fibrous nature of the addressed Ctl mineral.

2.2.2. Preparation of Industrial Wastes

PA fiber waste that was delivered from Salamtext Factory, Egypt, was washed using a 1 solution of a nonionic detergent (1 g/L) for 20 min/80 °C, soaked pervasively with DW to discard any surface impurities before the air-drying step.

2.3. Fabrication of Serpentine/Polyamide Nanofiber Membrane (SP/PAM)

A specified dose of the prepared nano-sized chrysotile (Ctl) was delicately blended with formic acid (90%) and stirred using a hotplate magnetic stirrer, until complete homogenization at ambient temperature. Subsequently, a selected mass of PA waste was added to the previous mixture to get a uniform semi-viscous solution. The introduction of Ctl into formic acid solution prior to PA waste was conducted deliberately to avoid the Ctl agglomeration by the dissolved PA, as well as to get a solution with consistent viscosity. The concentration of the dissolved PA waste in formic acid was selected to achieve a ratio of 21% PA to 79% formic acid by weight, while the ratio of SP to PA was 7.5% to 92.5% by weight. The applied PA ratio, 21%, was designated following the protocol reported by [2]. The resulting polymeric/SP mixture was carefully transferred into a 10 mL plastic syringe with a metallic tip, ready to be spun using a mono-channel programmable syringe pump (NE-4000, New Era Pump Systems Inc, Farmingdale, NY, USA) (Figure 1). This advanced system involved a positively charged syringe needle and a negatively charged metallic collector. The prepared solution, with a fixed 7.5% SP concentration from the PA ratio in formic acid, was then fabricated by the electro-spinning process at a collecting distance of 15 cm, a flow rate of 1 mL/h, and at a specific electric field of 20 kV by the means of a high-voltage power supply (HVA b2 Electronics, Bergheim, Germany). The selection of these experimental parameters for SP/PAM fabrication was grounded upon the outcomes of unpresented data at which the production of such membrane composite was optimized. Finally, to maintain a consistent thickness for the fabricated SP/PAMs, the spinning process was carried out without interruption for approximately six hours at room temperature.

2.4. Characterizations of Raw Materials and the Fabricated SP/PAM

The several thin sections from the collected serpentinite samples were prepared for examination via an optical microscope (LV100POL/eclipse, Nikon, Tokyo, Japan) supplied with a camera to identify their mineralogical and textural characteristics. Meanwhile, XRF analysis was employed to identify the geochemical composition (major, minor, and some trace elements) of the prepared SP (Ctl) powder in micro-size (<100 µm) using an X-ray fluorescence (XRF) spectrometer (Connolly, 2005/PANalytical, Almelo, The Netherlands).
Additionally, the SP (Ctl) and PA were investigated by XRD (Philips diffractometer, APD-3720, using Cu Kα radiation which functioned at 40 kV and 20 mA in the 2θ range of 5°–80°, at a 5°/min scanning speed), SEM (JSM-6700F, JEOL, Tokyo, Japan, working distance: 11.1–12.2 mm and energy beam: 20–30 kV), and FE-SEM (Sigma 500VP/CARL ZEISS AG, Jena, Germany), FT-IR (Bruker Spectrometer, Billerica, MA, USA, FTIR-2000 in the range of 400–4000 cm−1) techniques to characterize their mineral phases, morphological properties, and the distinguishing functional groups, respectively. The SBET surface area of Ctl in both sizes and PA, after vacuum degassing at 100 °C/2 h, was determined by Nova 2000 analyzer (Quantachrome, Boynton Beach, FL, USA) to remove the adsorbed contaminants from the sample’s surfaces and pores. The Brunauer–Emmett–Teller equation [25] was employed to estimate SBET, while the Barrett–Joyner–Halenda (BJH) formula [26] was applied to calculate the average pore diameter (Dp) and the total pore volume (Vt) of the regarded samples.
Furthermore, characterizations with several techniques (XRD, SEM, and FT-IR) were conducted for the prepared SP/PAM to identify its crystalline phases, morphological properties, and distinguishing functional groups, respectively. Moreover, the geometrical parameters (SBET, Vt, and Dp) of vacuum-degassed membrane composite at 100 °C/2 h were investigated. To investigate some mechanical properties of the prepared SP/PAMs, a Triton DMA device (DMA 2000, Freiberg, Germany) was employed to execute DMA (dynamic mechanical analysis) at a fixed frequency of 1 Hz, a temperature range of 25 to 150 °C, and a rate of heating of 5 °C/min, whereas the preload and strain amplitudes were 1 N and 0.1%, respectively. To verify the obtained results, the executed examinations were performed in triplicate, then the average was taken.

2.5. Batch System Studies Using Aqueous Solutions

To gauge the uptake efficiency of the prepared SP/PAM composite for different dyes and heavy metals that could be encountered in several industrial wastewaters, the anionic methyl orange (MO) and cationic methylene blue (MB) dyes, as well as Fe(Ⅲ) heavy metal, were selected to be remediated by the prepared composite in a batch system.
To achieve this goal, stock solutions (1000 mg/L) of both MO and MB were prepared separately via 1000 mg dissolution in 1000 mL of distilled water (DW). For the kinetic and equilibrium investigations, the desired initial concentrations of these contaminants were prepared by DW dilution of their stock solutions. In addition, stock solution (1000 mg/L) of Fe(Ⅲ) was prepared by liquefying 4.83 g of ferric chloride hexahydrate (FeCl36H2O) in 1000 mL of DW, from which the desired initial Fe concentrations were prepared using DW. To verify the obtained results, all the experiments were performed at ambient temperature in triplicate, then the results were averaged.

2.5.1. Effect of pH, SP/PAM Dose, Initial Concentration, and Contact Time

To evaluate the efficiency of the prepared SP/PAM composite in removing the selected dyes (MO and MB) and heavy metal (FeⅢ) from synthetic solutions, the effect of several equilibrium tests was executed: pH (3.0–10.0, 5.0–10.0, and 2.0–7.0 for MO, MB, and Fe(Ⅲ), respectively), contact time (5–240 min), applied SP/PAM dose (10–35 mg and 20–70 mg for dyes and Fe, respectively), and finally the initial concentrations (10–35 mg/L and 1–9 mg/L for dyes and Fe(Ⅲ), respectively), maintaining the other experimental parameters constant. The pH of the utilized solutions was adjusted using either 0.01 M NaOH or 0.01 M HCl and was measured using a portable pH meter (Hanna, HI 9025). The prevailing experimental conditions during the conduction of each of the previously mentioned experimental parameters were compiled and illustrated in Table 1. The remaining dye concentration in the permeate solutions after centrifuging for 15 min at 10,000 rpm (Mikro 120/Hettich/UK) was determined using a single beam DR 6000 spectrophotometer at 𝜆max = 468 and 665 nm for MO and MB, respectively, whereas the residual Fe(Ⅲ) concentration was determined using the ICP-MS technique. Additionally, to determine the qe (mg/g) of the addressed contaminants and the uptake efficiency of the regarded composite ( R %) at equilibrium, Equations (1) and (2), respectively, were employed (Table 2).

2.5.2. Isotherm and Kinetic Studies

For isotherm studies, fixed masses (25 mg) of the SP/PAM composite were discretely mixed with 25 mL of MB and MO, as well as 50 mL of Fe(Ⅲ) solution with variable initial concentrations ranging from 10–35 mg/L and 1–9 mg/L for dyes and Fe(Ⅲ), respectively, under intensive shaking (200 rpm) for 15, 60, and 120 min and pH values of 3.0, 9.0, and 5.0 for MO, MB, and Fe(Ⅲ), respectively (Table 1). At equilibrium, the qe (mg/g) of the addressed contaminants was calculated using Equation (1) (Table 2).
For kinetic studies, identical masses (25 mg) of the prepared composite were separately added to 25 mL of MO and MO, as well as 50 mL of Fe(Ⅲ) solution with constant initial concentrations (25 and 3 mg/L for dyes and Fe(Ⅲ), respectively) for different contact times (5–240 min) with vigorous shaking at 200 rpm/1 h and pH values of 3.0, 9.0, and 5.0 for MO, MB, and Fe(Ⅲ), respectively (Table 1). The qt (mg/g) of the studied contaminants and R % were estimated by Equations (2) and (3), respectively (Table 2).

3. Results and Discussion

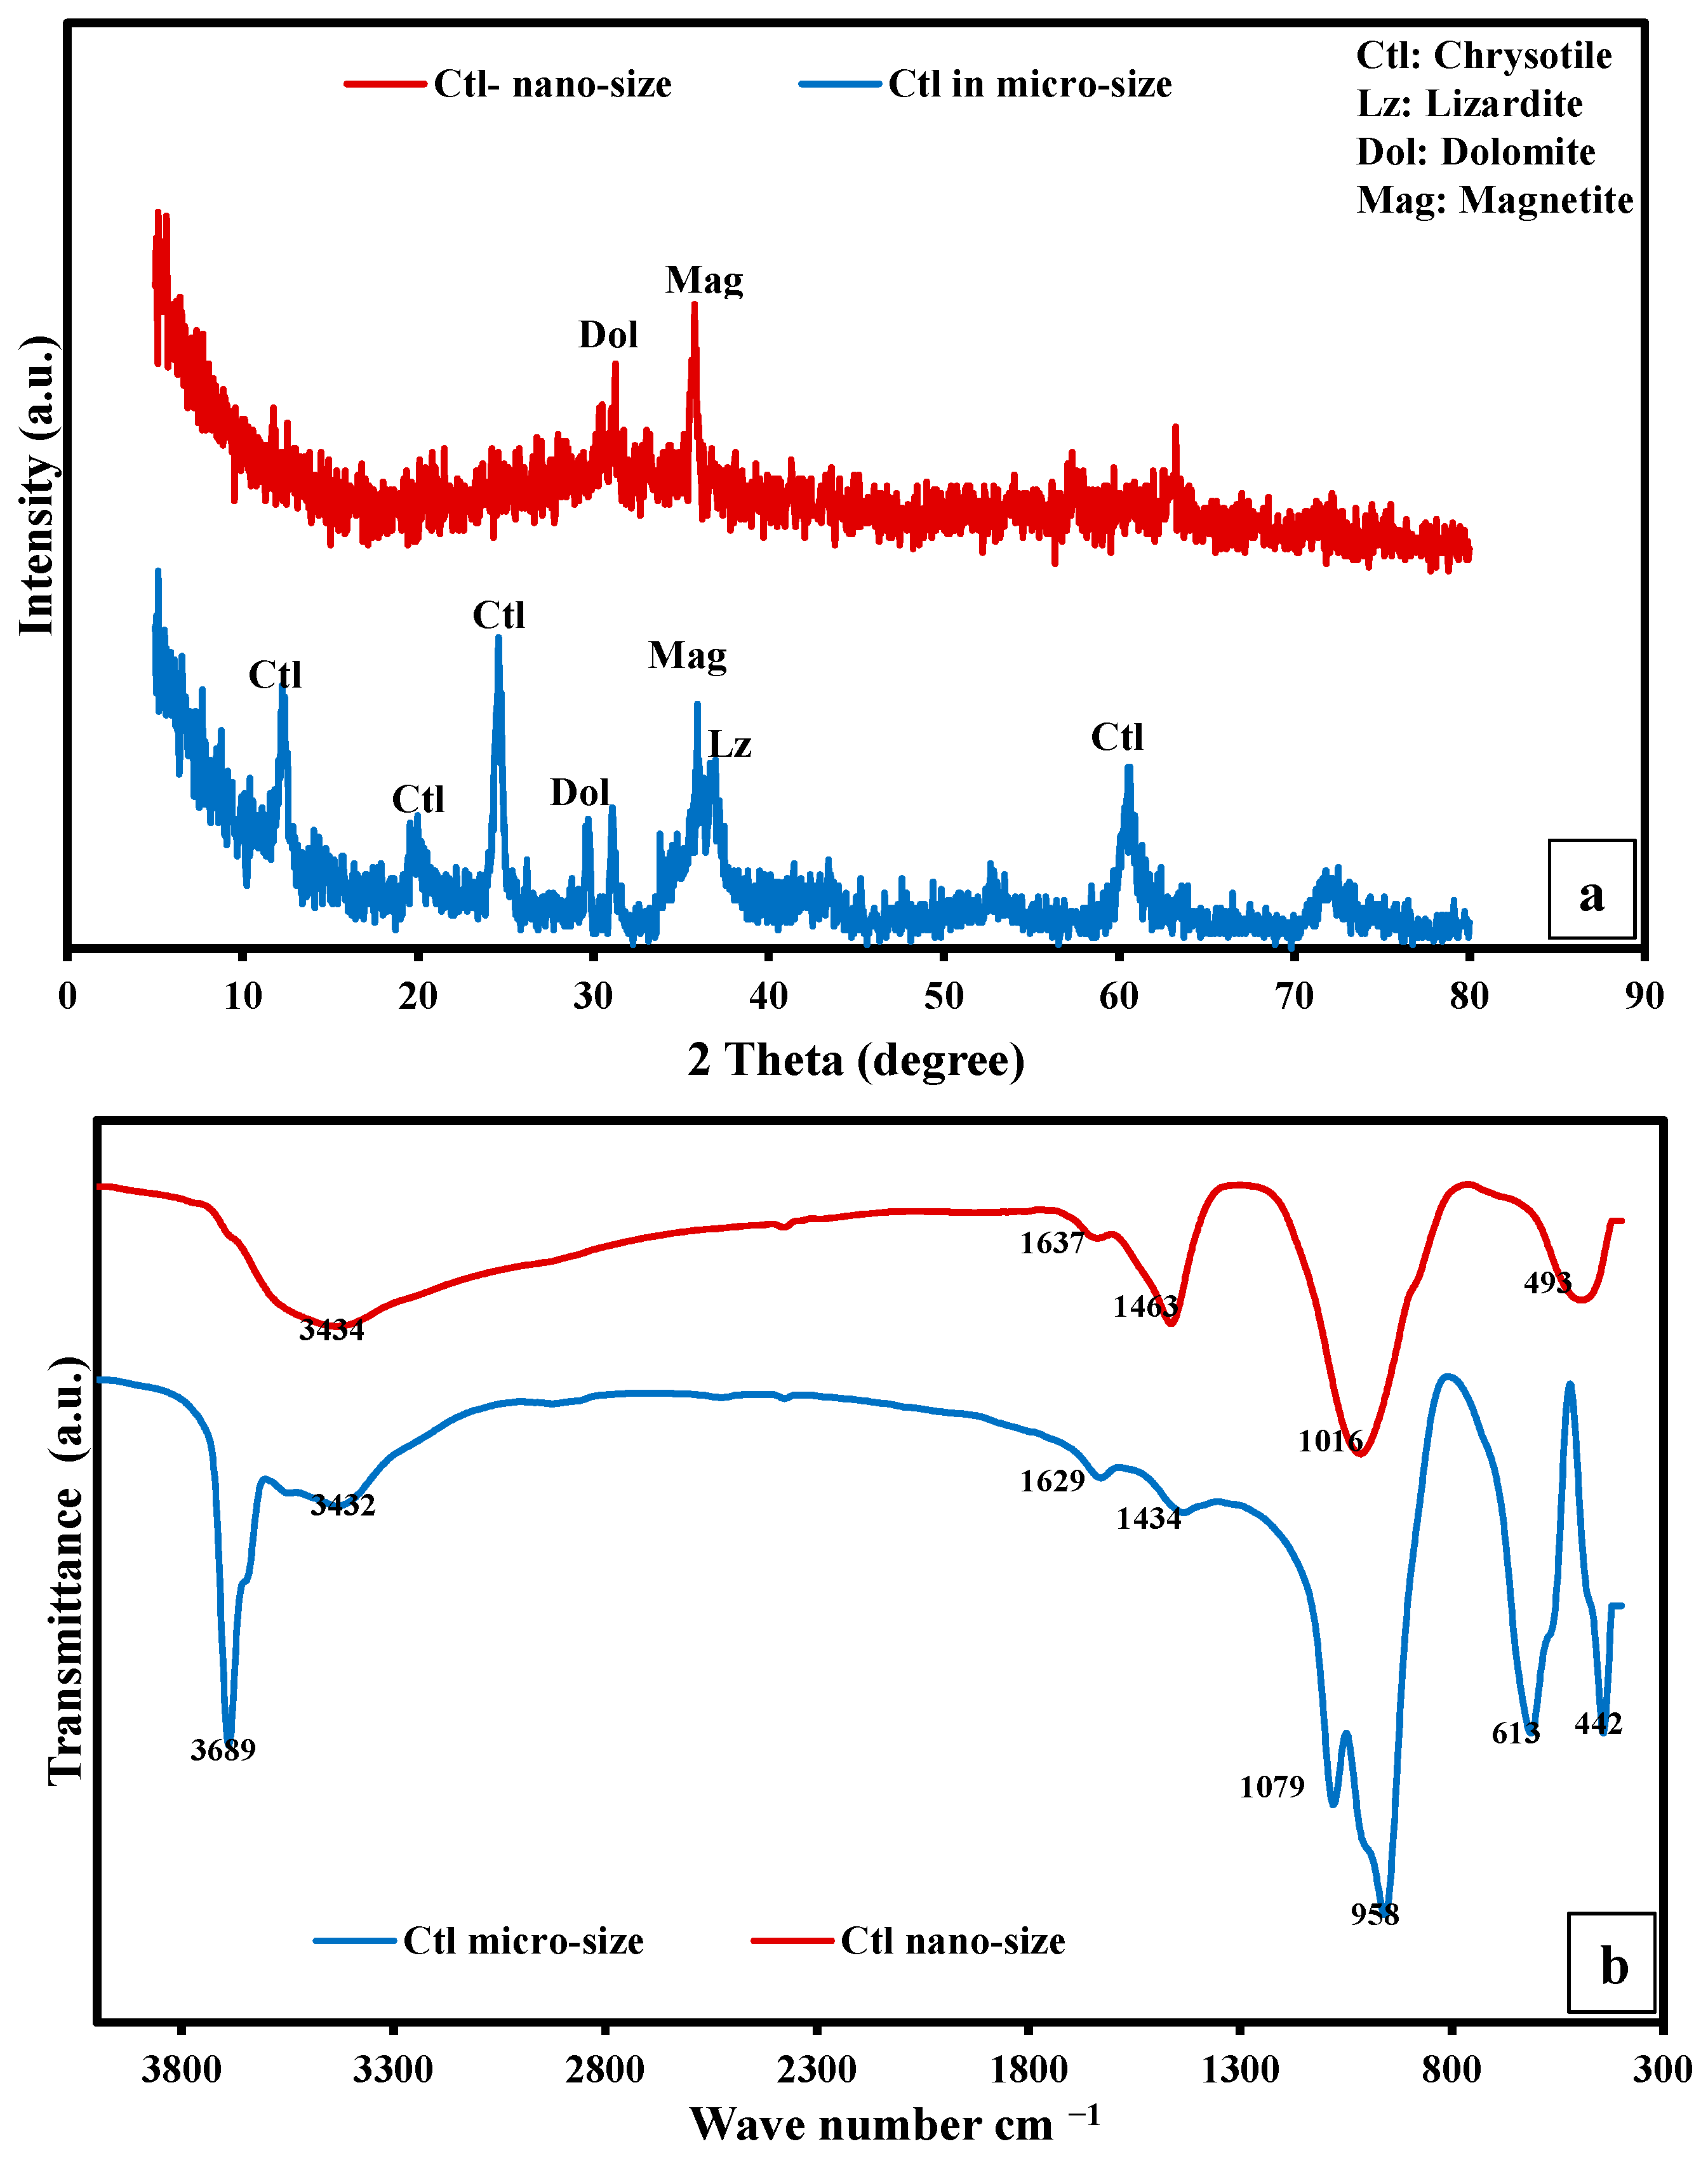
3.1. Characterization of Raw Materials

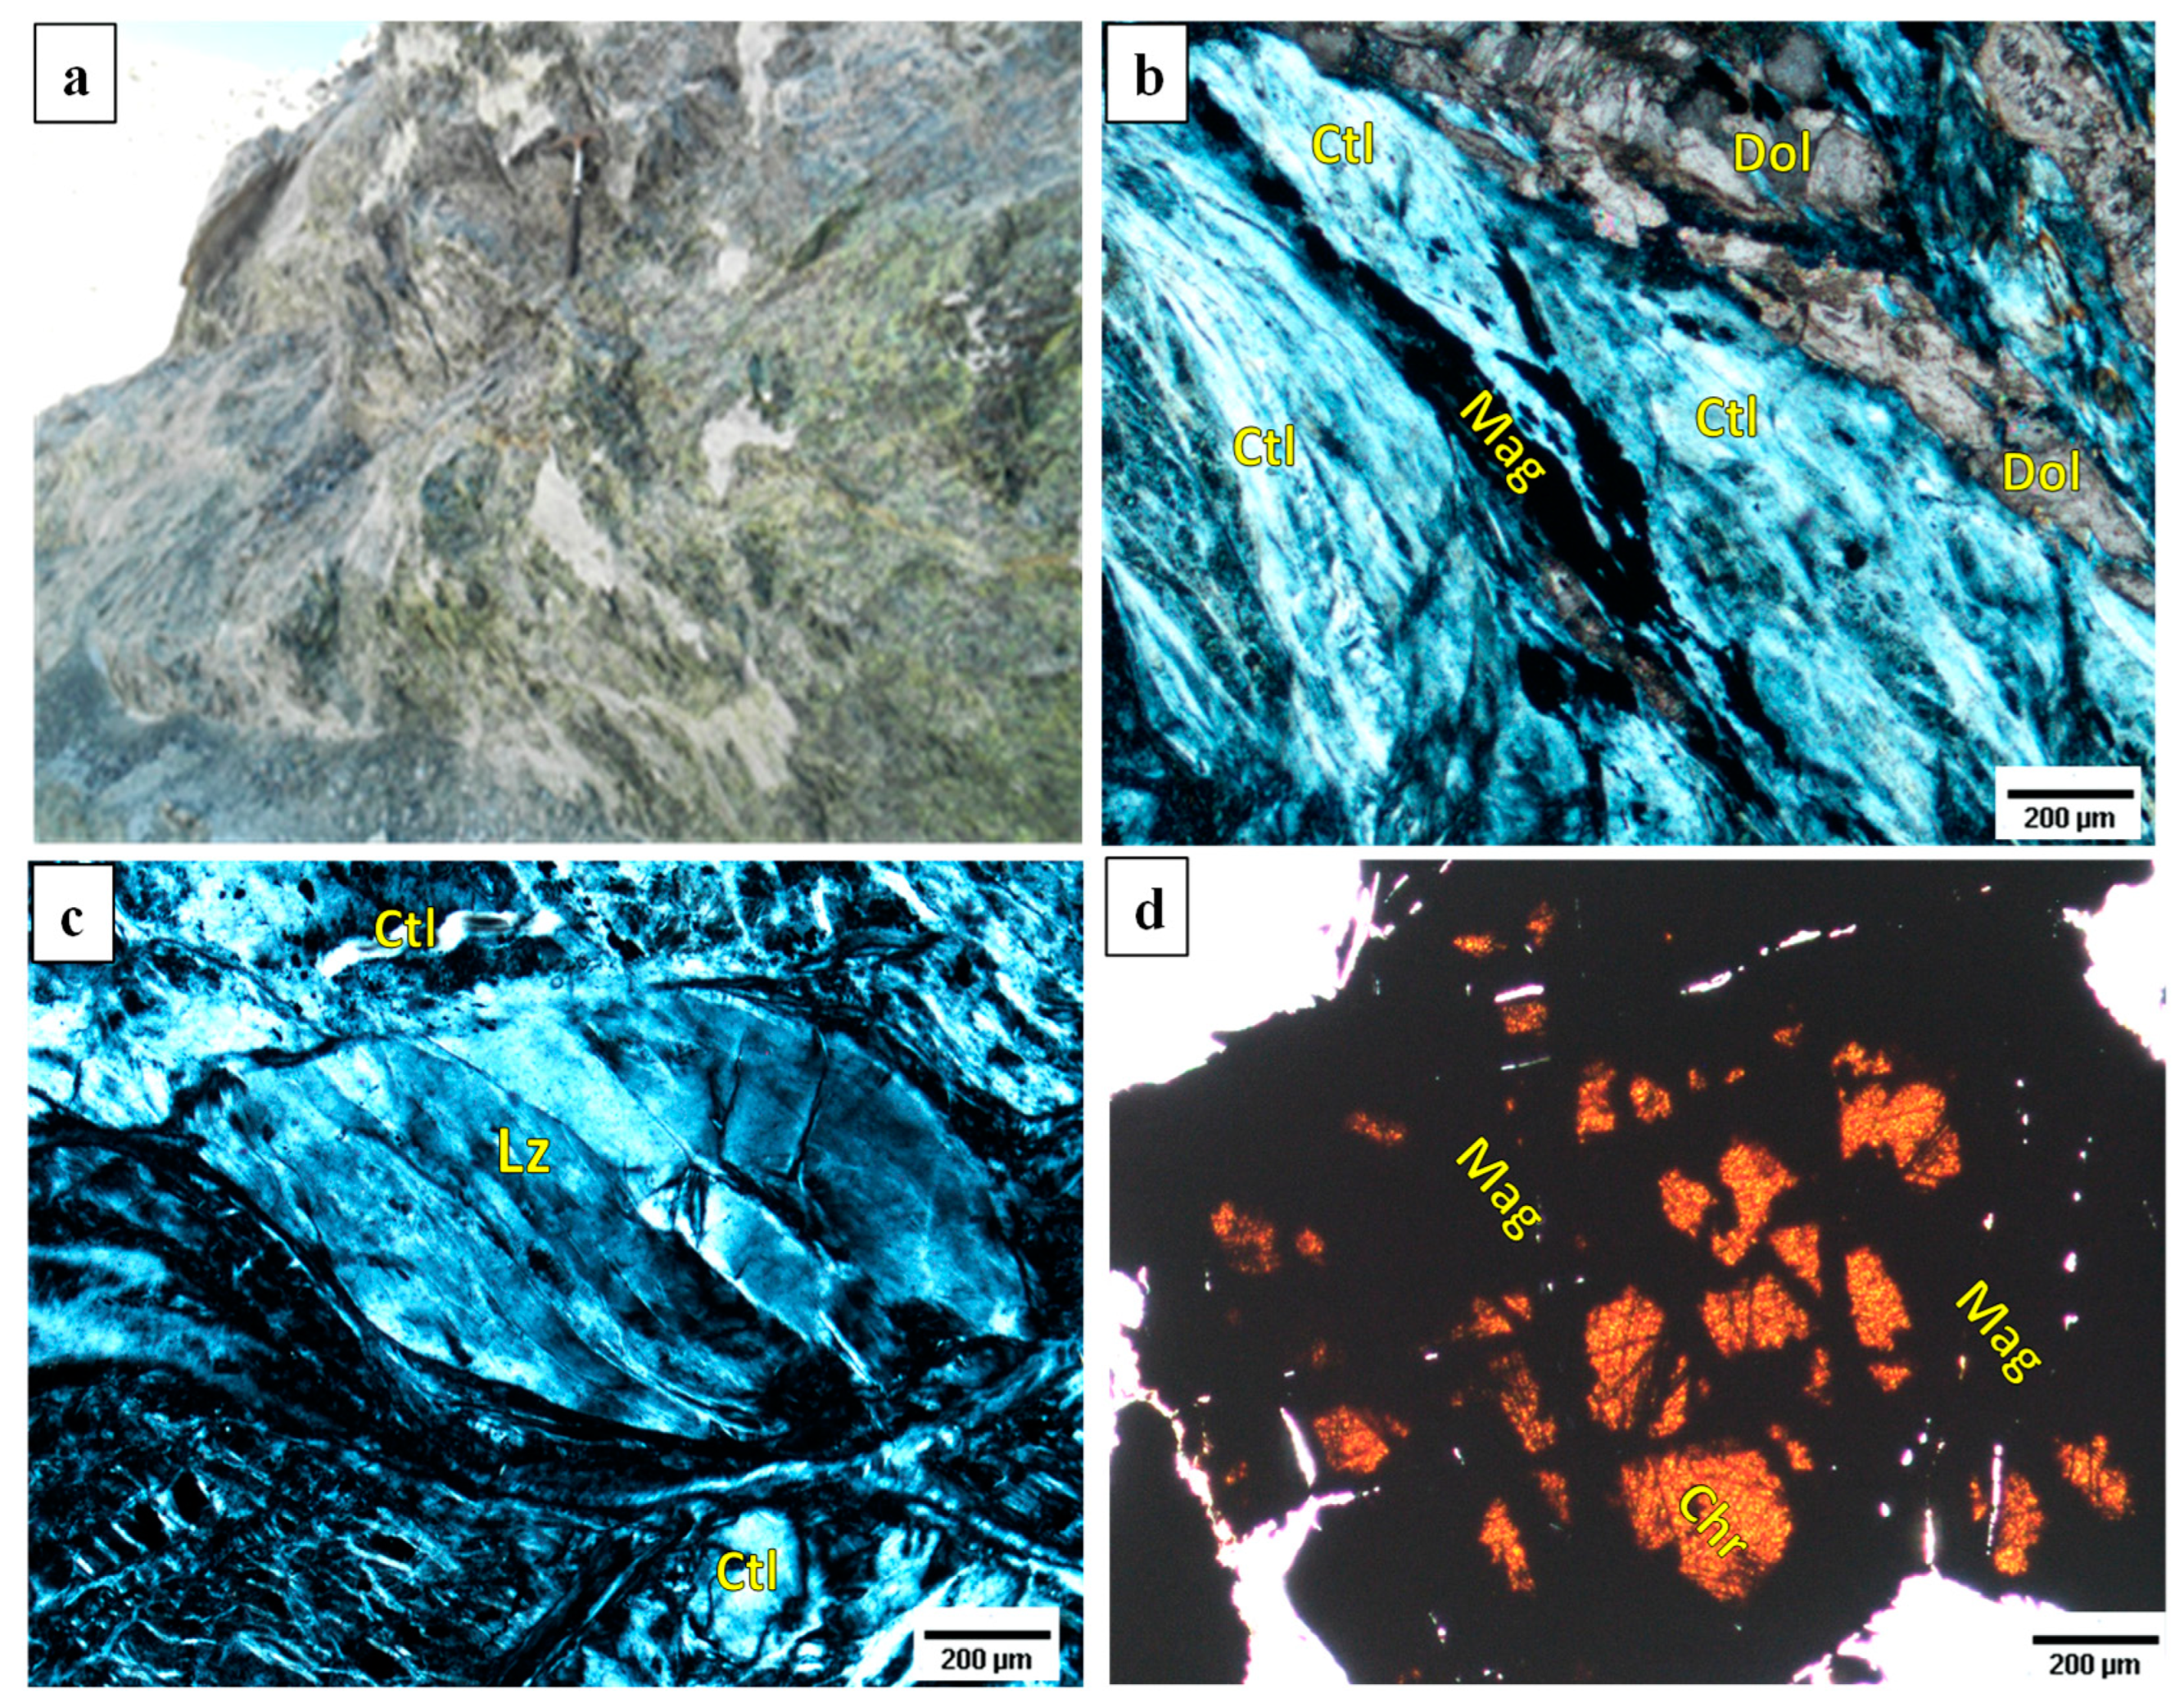
Characterization of Natural Mining Waste

The microscopic investigations for some of the collected representative serpentinites (Figure 2a) by a polarizing light microscope (Nikon) in both PPL and CPL (Figure 2b–d) showed that chrysotile (Ctl) is the dominant serpentine phase in Wadi Atalla serpentinites with a reasonable occurrence of dolomite (Dol) and a minor presence of magnetite (Mag) and lizardite (Lz). The predominance of Ctl, which is marked by folded and sheared fibers, over the other serpentine polymorphs (Lz) indicates a high degree of the experienced serpentinization processes [17,27,28,29,30]. Magnetite (Mag) is also the product of hydrothermal alteration of the harzburgite. The content of Dol and Mag in the investigated serpentinites was mainly governed by hydrothermal solutions intensity that associated the experienced serpentinization process [31] and/or rodingitization process, and hence the degree of Fe leaching and serpentinite carbonization in the form of Mag and Dol, respectively. The occurrence of fractured magnetite (Figure 2b) can be interpreted in accordance with Fe oxidation in the olivine mineral of the parent ultramafic from which such serpentinites were derived [30]. In addition, very minor relics of fresh chromite (Chr) were also observed (Figure 2d) in the center of magnetite, indicating the secondary origin of the latter at expense of the former during the experienced serpentinization processes [30].
According to ASTM E1621 [32], the chemical compositions of nine powdered SP samples (<100 µm) were investigated using the XRF technique, and the average result was compiled in Table 3. Matching with ASTM D7348 [33], LOI (loss on ignition wt. %) of the regarded SP sample was calculated corresponding to the current equation:
L O I % = ( W W d W h ) W × 100
where W (g) is the dry sample weight in air, Wd (g) is the oven-dried weight of the sample, and Wh (g) is the weight of residual ash after heating the sample for 3 h at 950 °C.
SP is marked by a high percentage of MgO (37.72%) and SiO2 (35.61%), which characterize the serpentine as magnesium silicate minerals. The existence of CaO (2.65%) is correlated to the incorporated dolomite (Figure 2b), whereas the apparent occurrence of Fe2O3 (6.12%) can be ascribed to the oxidation of Fe-olivine and alteration of chromite that occur as surviving relics of the parent rock (ultramafic complex) as discussed above. The high value of LOI wt.% in Ctl SP (16.5%) is not only correlated to the structural water but also to its carbonate content [30].
XRD were conducted for the powder of both SP samples (i.e., micro- and nano-size samples) via an X-ray diffractometer. Matching with polarizing microscope data (Figure 2b,c), XRD (Figure 3a) exposed that Ctl, is the predominant phase in the investigated serpentinites. Moreover, Lz, Dol, and Mag occur as minor phases. On the other hand, the grinding process of the fibrous Ctl almost obliterated its crystalline nature except for some minor peaks that reflect the presence of some persistent Dol and Mag phases (Figure 3b). This was assured by the huge noise displayed by the XRD pattern of the grind Ctl for 50 h/450 rpm as discussed before.
SEM investigations revealed that micro-size chrysotile has a distinguishing smooth fibrous habit (Figure 4a). The serpentinization accompanying shearing phases has a clear effect on their surface smoothness. Samples with high serpentinization result in a smooth and vitreous surface texture. With decreasing serpentinization, the surface of rock particles appears rougher. In addition to their malignant impact, such smooth fibers of chrysotile can diminish its spinning process with PA6 during the fabrication of the SP/PAM. Therefore, this fibrous nature was destroyed through intensive grinding using a laboratory ball mill (Figure 4b), matching with the XRD findings.
The BET surface area of both micro- and nano-size Ctl revealed that the micro-Ctl displayed approximately low BET surface area (24.48 m2/g). This surface area was noticeably further reduced to 9.52 m2/g after the intensive grinding process that was required to destroy the fibrous nature of the raw Ctl. This reduction can be ascribed to the agglomeration of the ground Ctl particles in accordance with the hydrous nature of SP. This surface area reduction was accompanied by a reduction in Vt to 0.088 cm3/g compared to micro-size one (0.103 cm3/g). Conversely, the Dp of the nano-size fraction was raised to 36.83 nm compared to the micro-size Ctl that displayed 16.88 nm. This increase could be attributed to the demolition of the walls of fine pores of Ctl with intensive grinding.
The shape of the N2 isotherm of the Ctl in both sizes displayed the typical type III isotherm with H3 hysteresis loop of the IUPAC classification (Figure 4c) [34].
Therefore, no discernible monolayer formation was attained; the interactions between adsorbent and adsorbate are approximately fragile. Furthermore, the adsorbed molecules were clustered around the favorable active centers upon nonporous or macro-porous solids [34]. In addition, the approximately broad hysteresis loops, especially in Ctl in micro-size, signify the domination of mesopores in the investigated samples. Furthermore, the failure to attain equilibrium (i.e., plateau stage) by any of the investigated Ctl, reflects the wide range of the incorporated pore diameters [35].
Owing to the domination of the applied industrial PA6 waste upon the applied components for the fabrication of SP/PAM, its characteristics will be discussed in comparison with their derivative composite hereunder to reveal their similarities and contradictions.

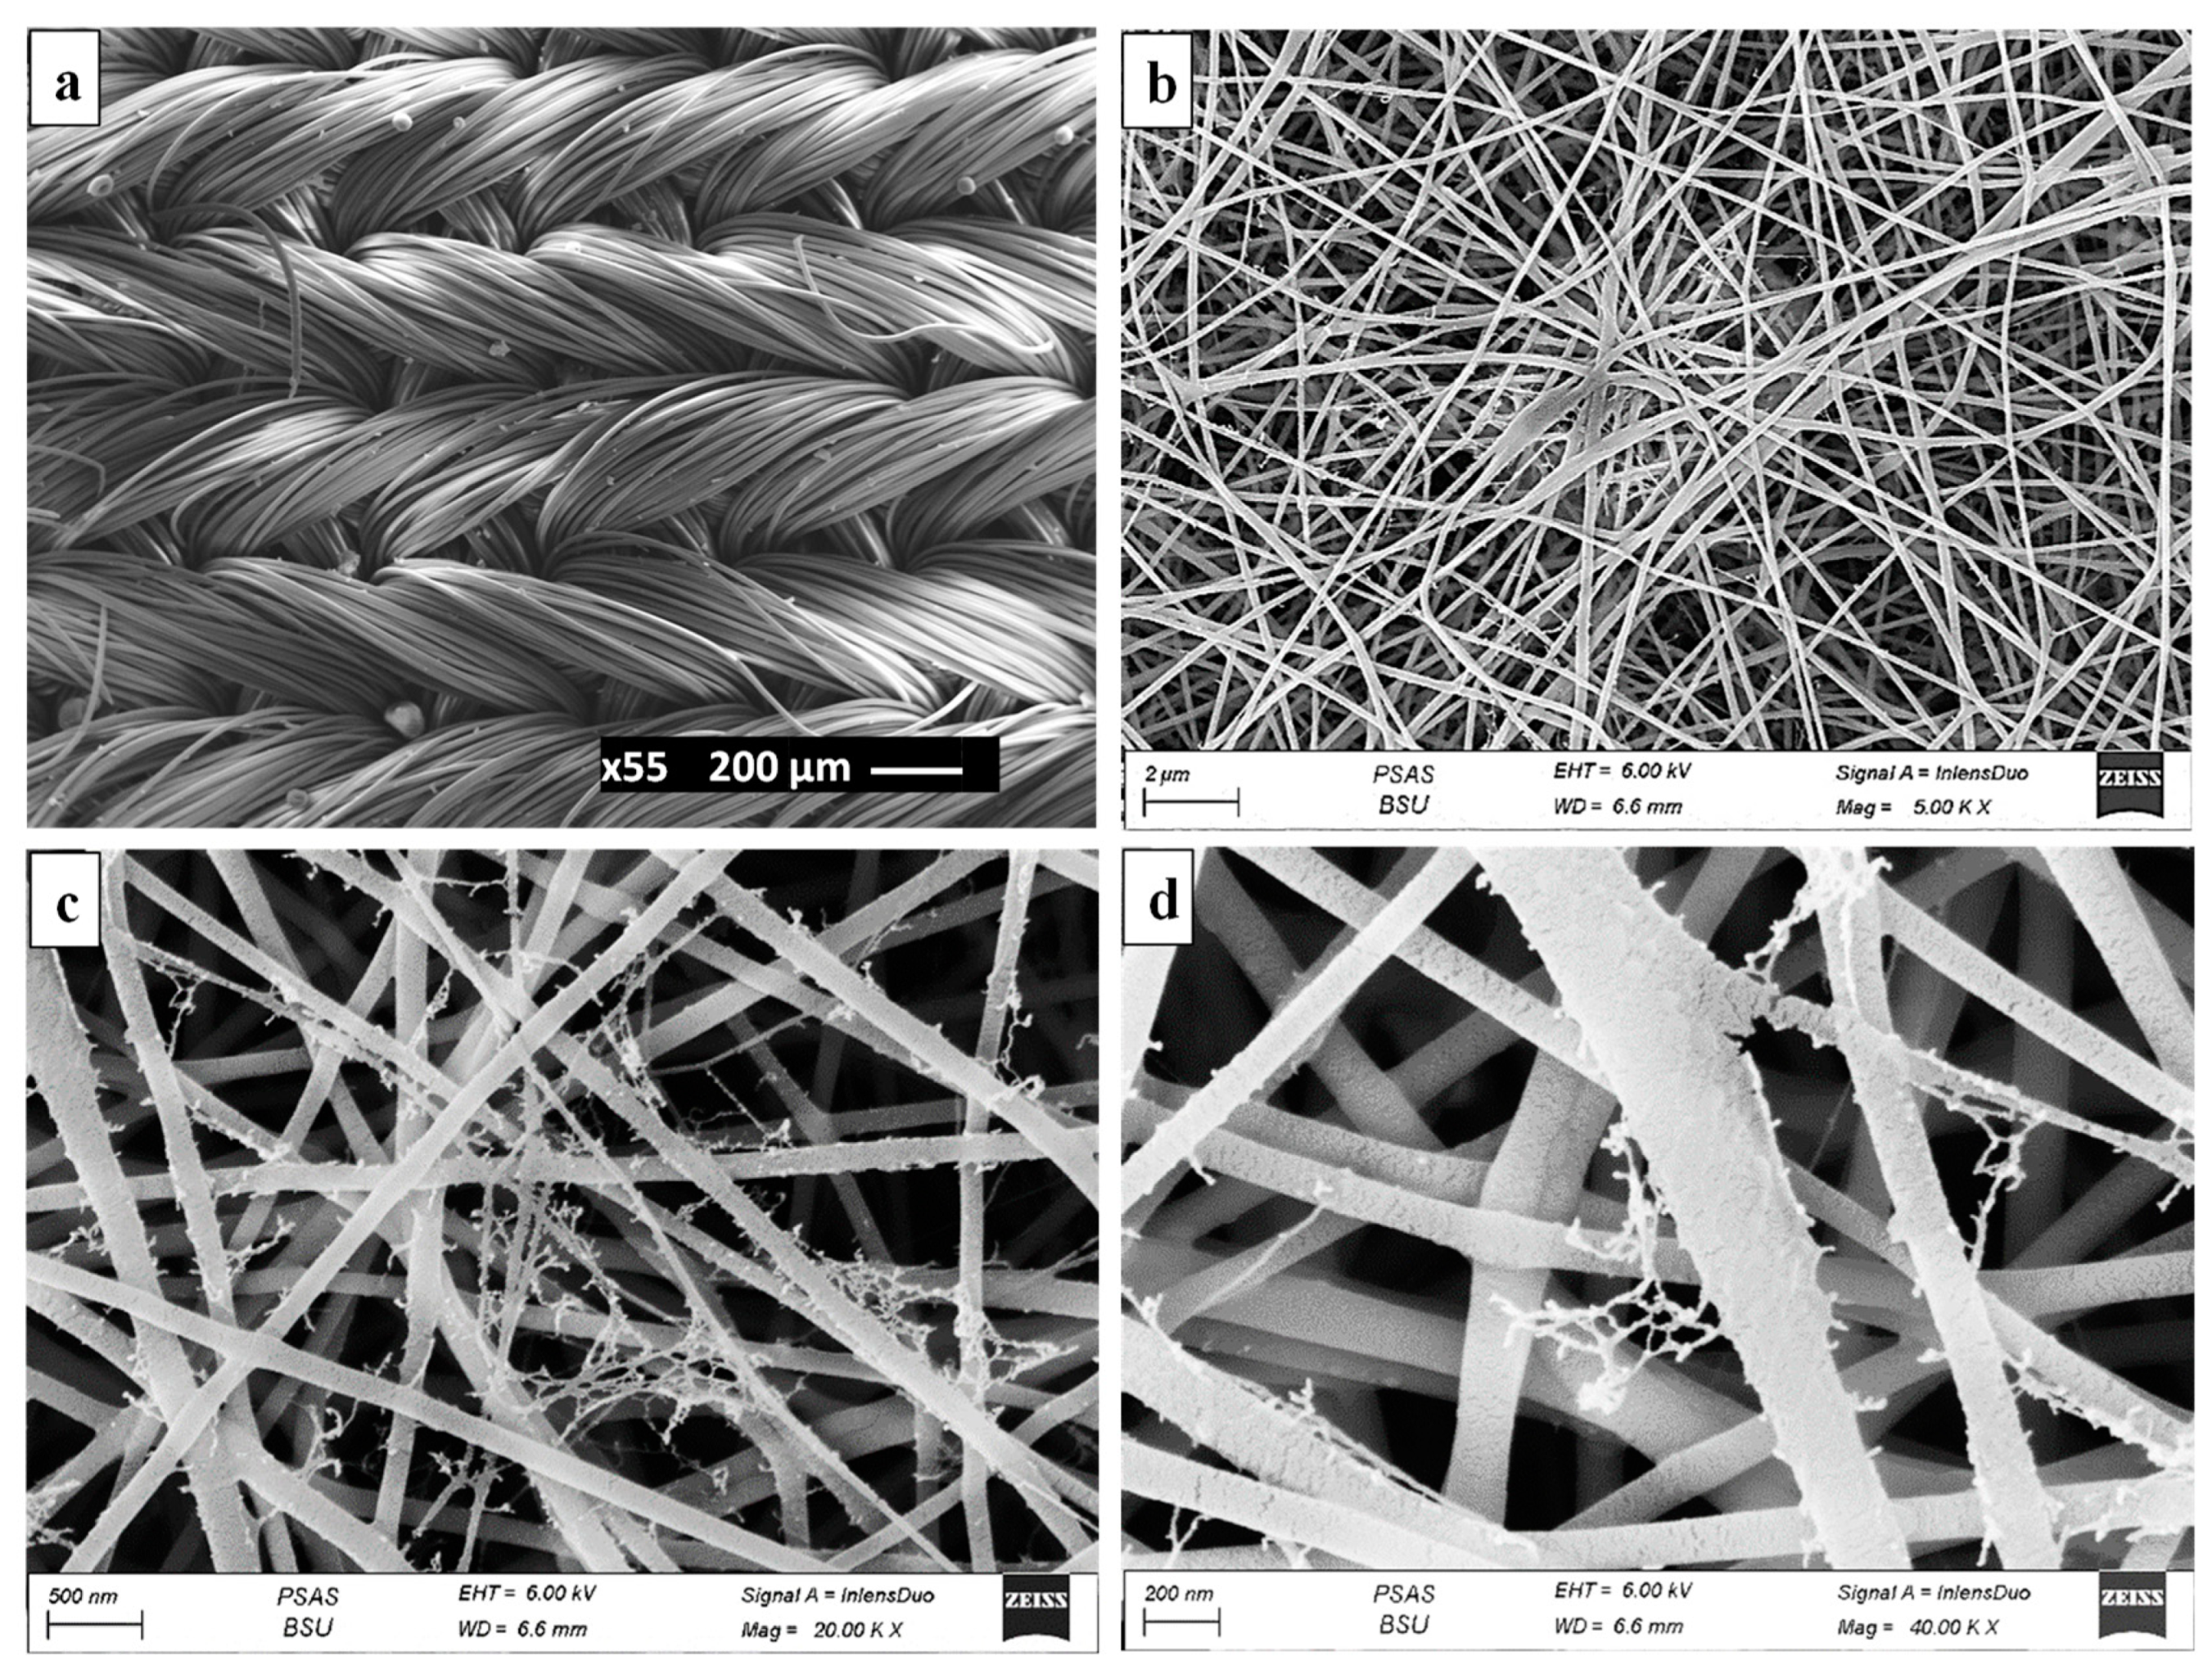
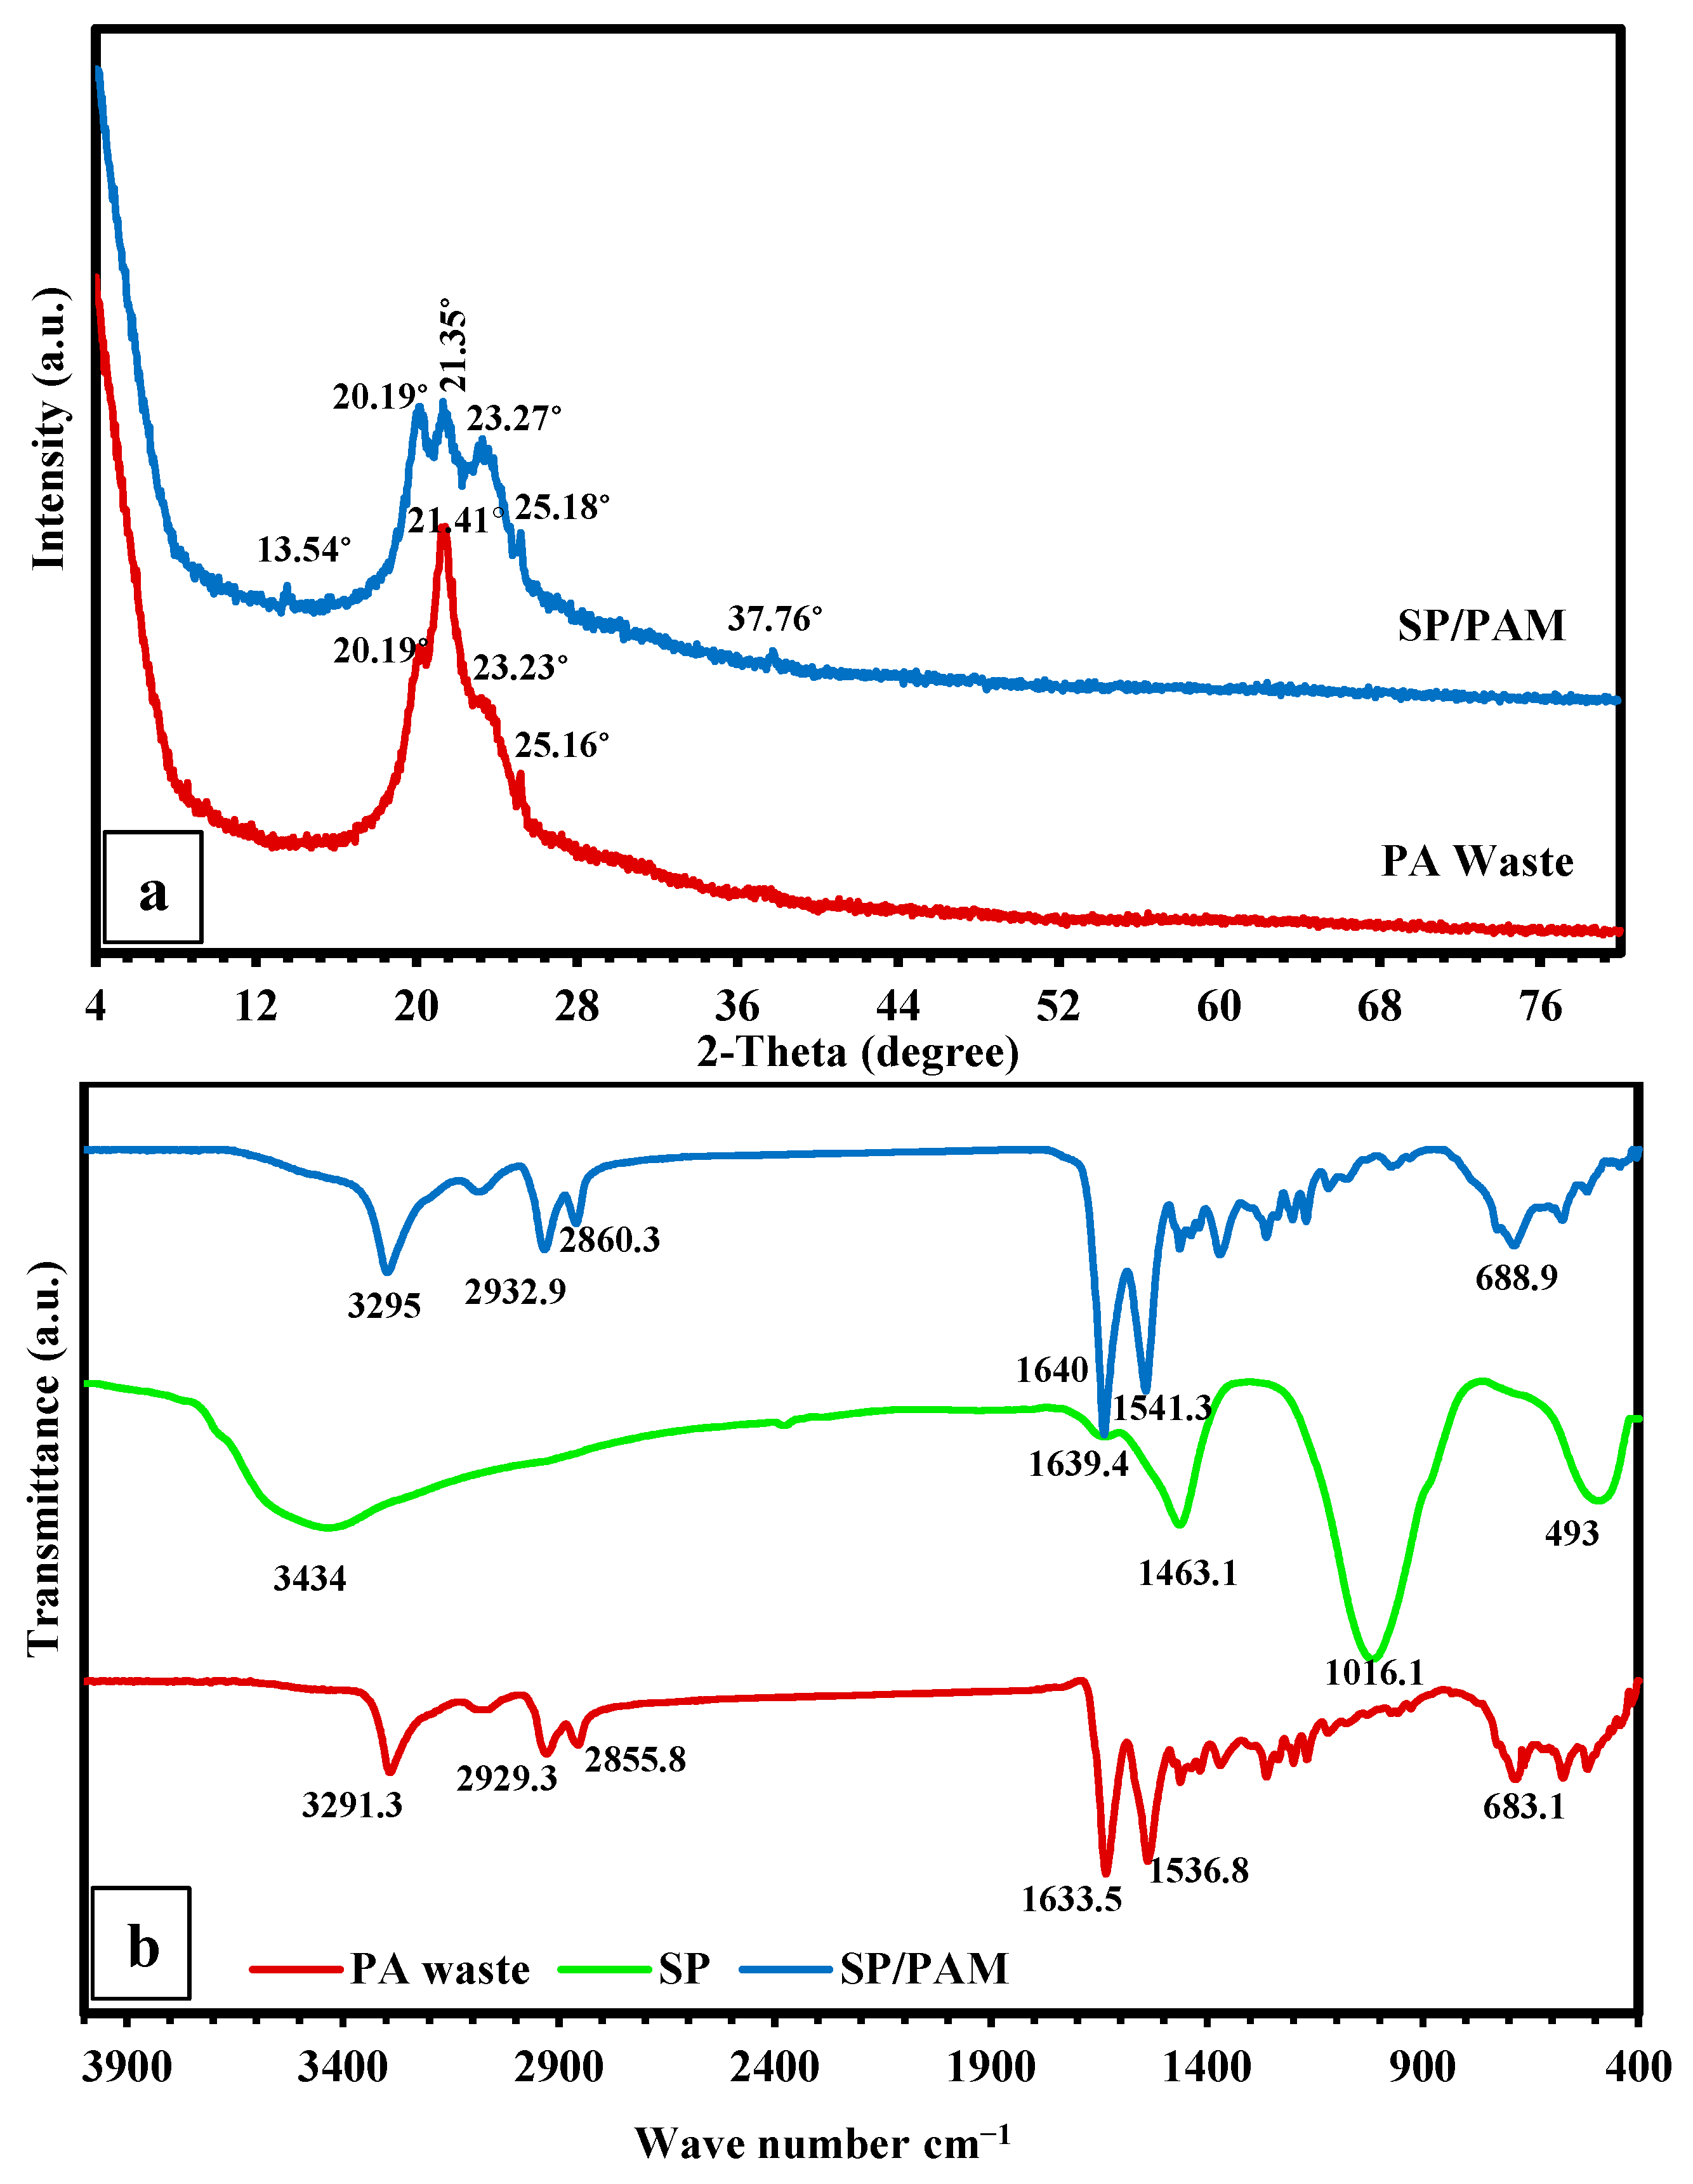
3.2. Characterization of the Fabricated SP/PAM and the Precursor PA6

SEM study revealed that the washed PA6 waste is composed of whipped/woven homogenous fibers with a maximum fiber diameter <20 µm (Figure 5a). In addition, the SEM investigations showed that fabricated SP/PAM is marked by thin fiber diameter and smooth homogenous morphology (Figure 5b–d). This could be attributed to the high amount of solvent evaporation/low rate of deposition in accordance with the adequate spinning distance, applied electric field, tolerable viscosity, and rate of spinning (i.e., jet has sufficient time for elongation/splitting before solidification) [36]. Therefore, the ejected jets from the Taylor cone split in an appropriate manner, so they reach the target in form of thin diameter fibers [37]. Such adequate splitting can be ascribed to the intensive columbic repulsive forces on the jet surfaces that overcome their counterparts surface tension and viscoelastic ones [36]. Moreover, the fabricated membrane is distinguished with well-arranged intra-pore spidery networks of nano-fiberoly that occur as nano-extrusions out of thicker fiber that act as substrates for these extrusions (Figure 5c,d). This could be correlated to SP concentration in the polymer solution (i.e., 7.5%) that led to entanglements between the chains of polymer to make a complete stable jet.
The XRD patterns of the investigated industrial wastes (Figure 6a) revealed the typical pattern of the PA6 (nylon 6) as assured by the coexistence of α (monoclinic) and γ (pseudo-hexagonal) polymorphs at 2θ ≃ 20.19° and 23.23°, as well as 21.4°1, respectively [38]. This indicates that such PA has experienced hydrogen bonding in both parallel and anti-parallel chain arrangements for the amide groups during the polymerization process, producing γ and α polymorph phases [39]. Regarding the XRD pattern of the SP/PAM compared to its parental PA6, it was clear that the incorporation of SP chrysotile during the electro-spinning process at the designated experimental parameters was accompanied by an obvious regression in crystallinity to the limit that the peak characterizing γ (2θ ≃ 21.35°) phases that was obviously reduced in intensity compared to the PA6 (Figure 6). On the other hand, those peaks that reflect the presence of α phase (2θ ≃ 20.19 and 23.27°) were approximately improved compared to those of the precursor PA6, indicating that the spinning process enforced the crystallization of the more thermally stable α than γ phase [40]. However, the overall crystallinity reduction with electro-spinning could be correlated with amorphous SP chrysotile that was observed in form of nano-fiberoly intra-pore spidery networks as was displayed by the SEM results. Furthermore, the ascendency of α and the dwarfism of the γ-phase can be ascribed to the rate of solvent evaporation that drives toward the crystallization of α phase, the thermodynamically stable, at the expense of γ one [40]. Meanwhile, the minor peak at 2θ ≃ 37.76° in the membrane, could be assigned to the relic magnetite impurities that are genetically related to SP chrysotile [17].
FT-IR investigation displayed that the principal groups of the addressed PA6 waste are 3291.3, 2929.3, 2855.8, 1633.5, 1536.8, 1460, 1373, 1261, 683.1, and 573 cm1 (Figure 6b). The FT-IR spectra revealed that the absorption bands at 3291.3 cm1 were correlated to the stretching vibration mode of N–H group [41]. Furthermore, the C–H symmetric stretching bands from methylene segments were observed at absorption bands of 2929.3 and 2855.8 cm−1 [41]. In addition, the band at 1633.5 cm−1 was ascribed to the C=O group in stretching vibration mode [42]. Whereas the N–H deformation was recorded at 1536.8 cm−1 [41]. Similarly, the band at 1460 cm1 was assigned to CH2 scissoring vibration [43], while the C-N axial deformation was noticed at 1373 cm−1 [44]. Furthermore, the coupling vibration of C–N–H group was observed at the 1261 cm−1 band. Furthermore, the amide V mode and amide VI mode were recorded at 683.1 and 573 cm−1, respectively [43].
The comparison of the SP/PAM composite spectra with those of its precursor materials (SP and PA6) (Figure 6b) revealed that the prepared composite maintained the fingerprint functional groups of the precursor materials, with noticeable privilege of those of PA over those groups of SP (i.e., a limited signature from the parental SP). However, the intensity of these groups was obviously amplified and slightly shifted in the frequencies to a higher frequency zone, indicating the chemical bonding (H-bond) between SP and PA during the spinning process as was assured by the high power of fiber elongation [45] that was discussed in the SEM section.
Matching with PA6, the shape of the N2 adsorption/desorption isotherm of the SP/PAM composite (Figure 7a) displayed the typical isotherm of type III with hysteresis loop H3 based on the IUPAC classification [34]. In addition, the approximately broad hysteresis loops, especially in the PA waste, signify the domination of mesopores in the PA and the fabricated SP/PAMs. Furthermore, the failure to attain equilibrium (i.e., plateau stage) by any of the fabricated membranes or PA waste reflects the wide range of the incorporated pore diameters [35]. Similarly, the geometrical parameters of the PA waste and the fabricated SP/PAM (SBET, Vt and Dp) were tabulated in Table 4. However, the average pore diameter (Dp) of the fabricated SP/PAM and the PA waste is about 1.9 nm Table 4. This denotes that PA and their fabricated membrane derivative are mesoporous with a poly-modal pore distribution [46]. Furthermore, the noticeable reduction in SBET and Vt of the fabricated SP/PAM (Table 4) compared to the PA6 can be ascribed to the semi-blocking of the porous structure of this membrane by the well-developed nano-fiberoly intra-pore spidery networks as was assured by SEM (Figure 5c,d).
DMA was employed for the deduction of Tg (glass transition temperature), loss modulus (E″), storage module (E′), and dissipation mechanical loss factor (tan δ = E″/E′) of the fabricated SP/PAM and its precursor, PA waste. E′ values present data about the stored energy in the addressed materials during deformation stresses and illustrate their rigidity, whereas the E″ identifies their viscous properties [47].
The tensile storage modulus (E′) curves (Figure 7b) of the investigated SP/PAM and PA6 that are constructed as a temperature function that ranges from 25 to 150 °C are built from three different segments [48]. The glassy zone (high-modularity segment with very restricted mobility), transition zone (segment with a sharp decline in the E′ value with temperature evolution because of dissipation of energy, which involves the mutual movements of the polymeric chains) and rubber region (flow region) with higher chain mobility (i.e., segment with viscous polymeric chains flow). The E′ values in both glass (25 °C) and rubber regions (100 °C) of the investigated membrane and the precursor PA6 are compiled in Table 5. Additionally, the curves displaying tan δ for all the investigated materials are depicted in Figure 7c, and their glass transition temperature, Tg (deduced via the α relaxation of the Tan δ plots), is presented in Table 5; height and position of tan δ’s peak can also be taken as an indication on the properties and structure of the investigated objects [48].
Contrary to the rubbery region, the value of E′ modulus was improved in the glassy region for the SP/PAM compared to the PA6 (Figure 7a and Table 5). Therefore, the degree of crosslinking decline among the precursor materials (SP and PA) and stiffness/rigidity was gradually decreased due to chain diffusion [48]. However, the steep decline of E′ modulus in the transition zone with temperature could be correlated with the polymeric chains motion, so energy dissipation occurs [49]. In addition, the tan δ curves displayed that relaxation peaks emerged at 70.52 and 75.13 °C for the PA6 and SP/PAM6, respectively (Figure 7b and Table 3). The development of Tg to a higher temperature signifies higher thermostability and growing restriction of the chain mobility as a consequence of the higher cross-linking degree between the SP and PA6 through intermolecular hydrogen bonding within their derivative membranes [48]. This was assured with the prevalence of the thermally stable α than γ phase in the XRD pattern of the membrane.

3.3. Batch System Experiments Using Aqueous Solutions
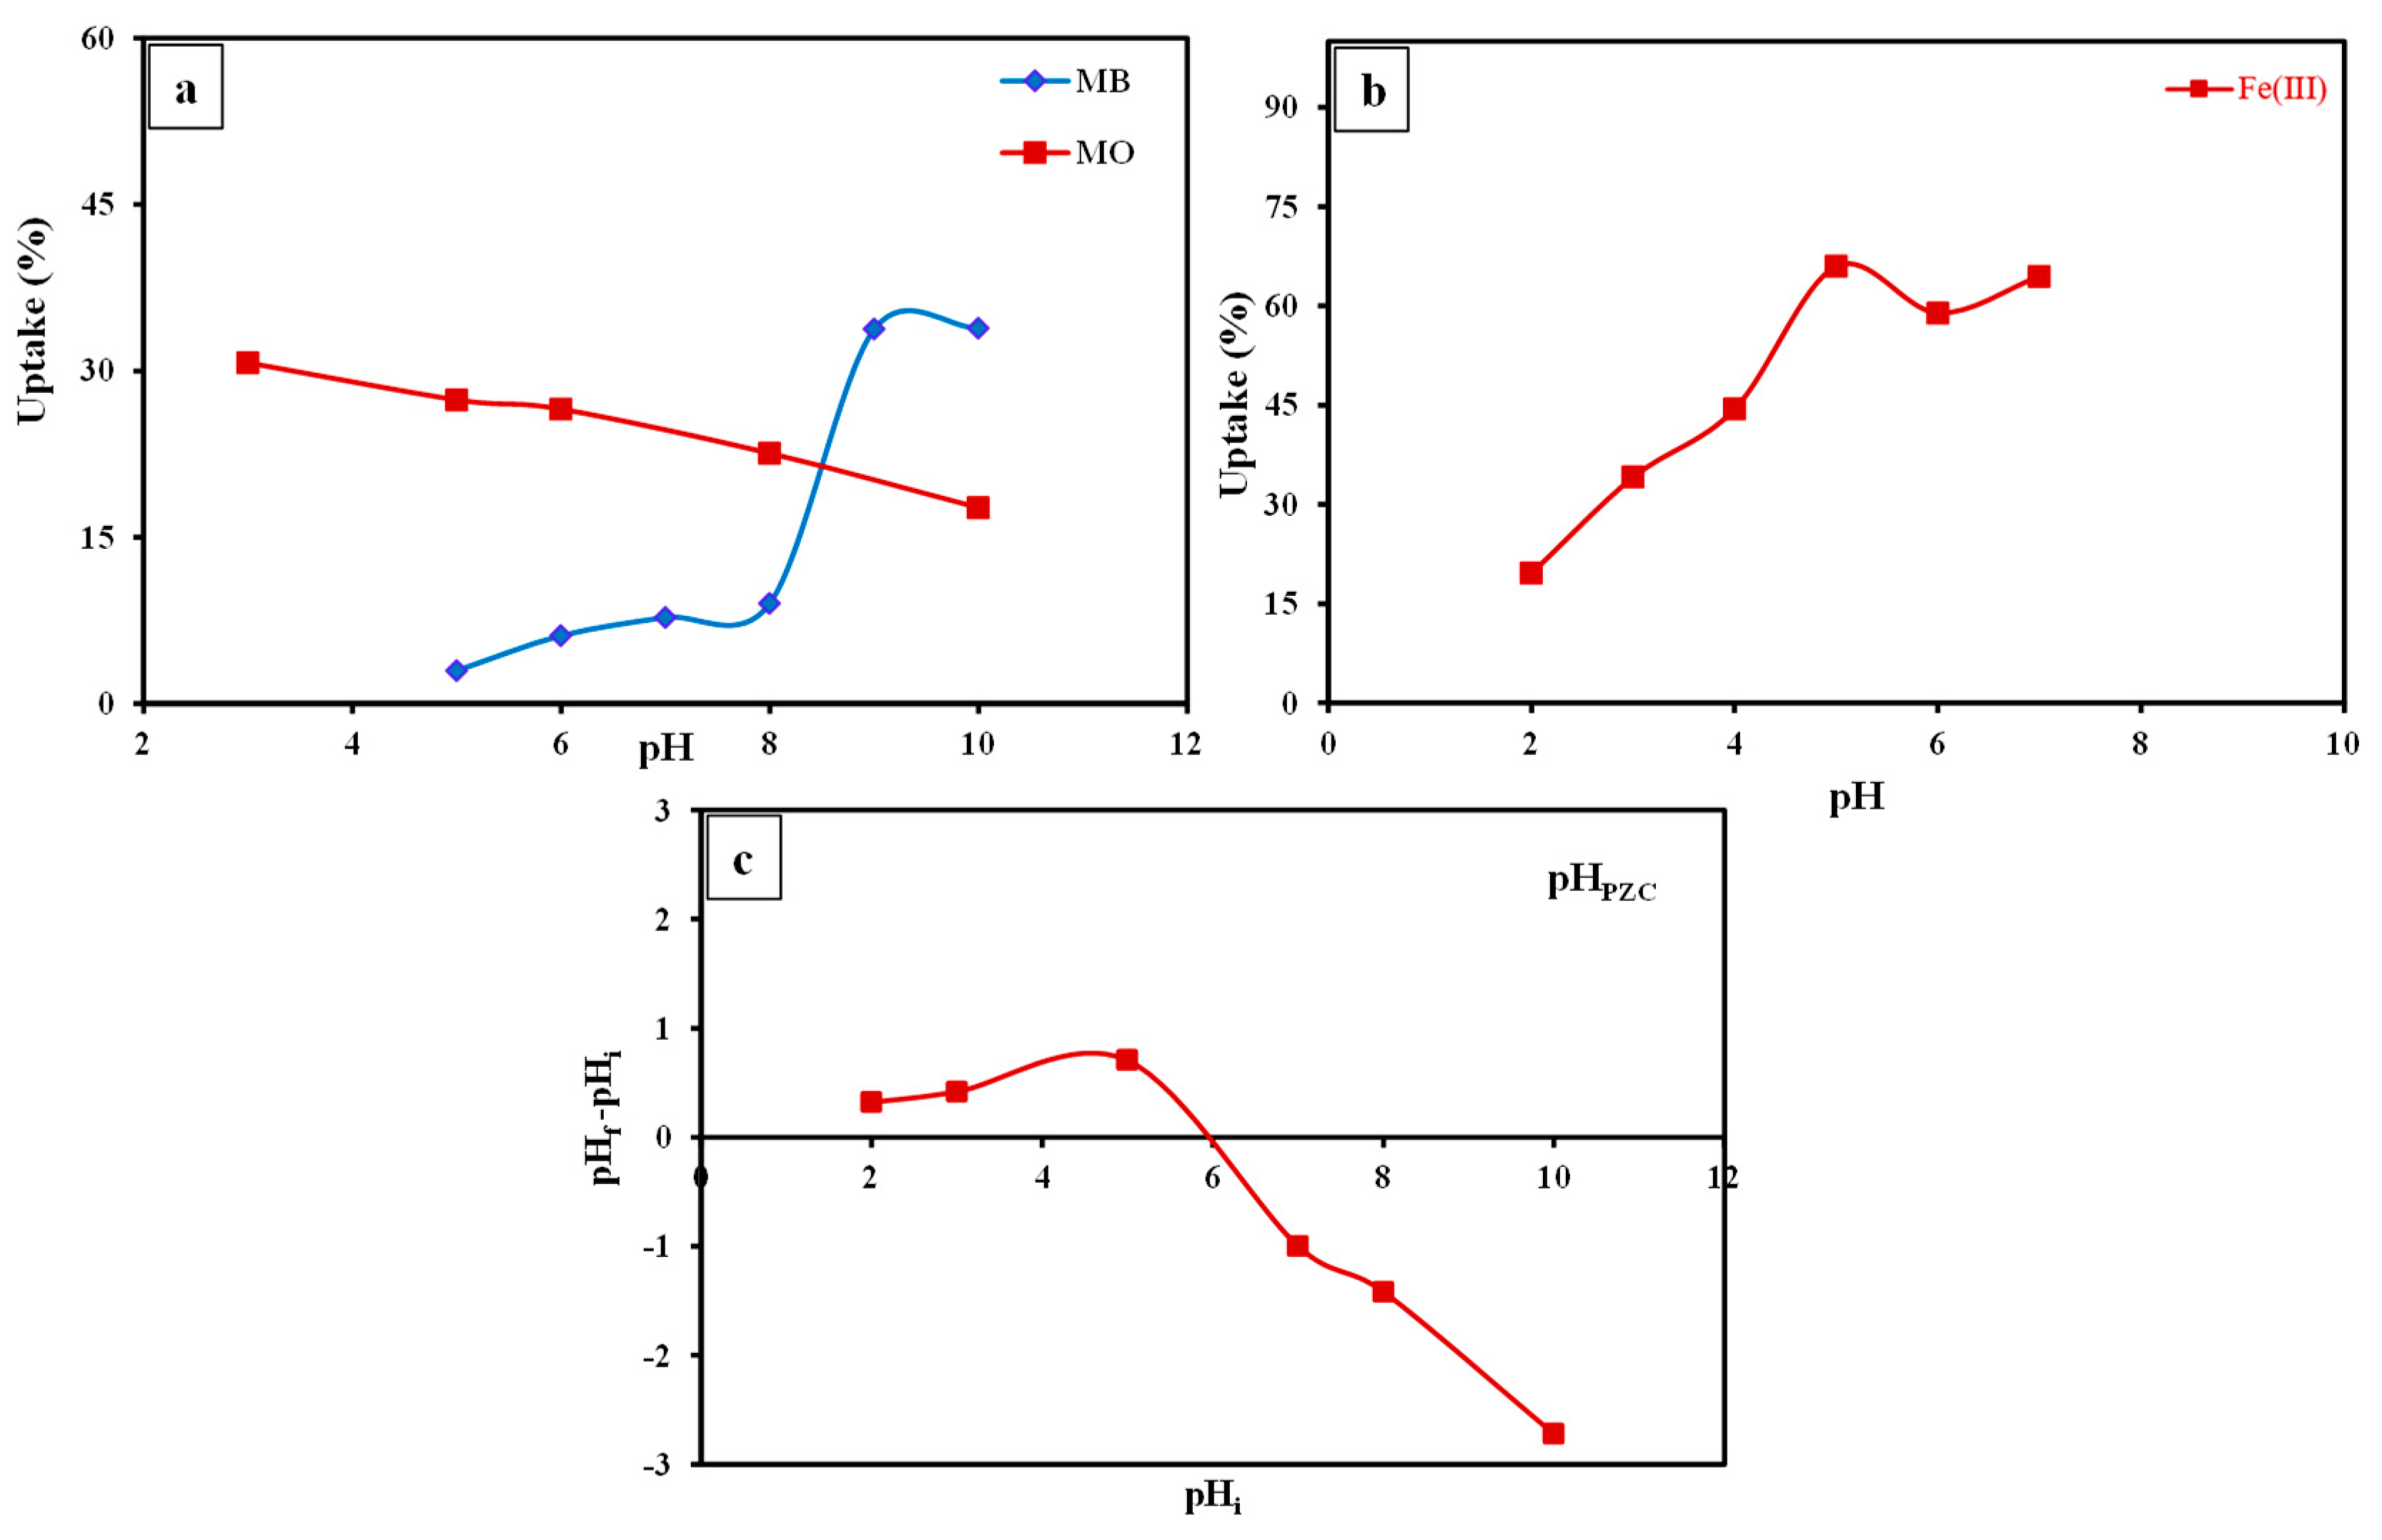
3.3.1. Effect of pH

The MO remediation by the fabricated SP/PAM was found to be a pH-controlled procedure. At an acidic medium, pH 3.0, the R% of MO (>30%) by the addressed composite was attained (Figure 8a), matching with previously reported data [50]. Above pH 3.0, sorption of MO was slightly reduced, with special emphasis under alkaline medium in agreement with pHPZC, the zero charge point of pHPZC = 5.9 of the SP/PAM that was estimated following the methodology cited by [51]. The pHPZC outcomes (Figure 8c) revealed that the fabricated composite surface has a positive charge below pH 5.9 and vice versa. Besides the high ionization grade of MO (pKa = 3.46) [52] in association with the protonation of the SP/PAM surface [53] at pH 3.0, the non-hydrophobic sorption driving forces (i.e., electrostatic attraction) between the binding sites (O- and N- bearing functional groups) of the investigated composite and the negatively charged sulfonate group (-SO3−) of MO ions were intensively triggered through hydrogen bridge ligands. In opposition, the OH- progressive increase in the solution with increasing pH beyond 3.0, coupled with the de-protonation of composite surface, prompted the repulsive interaction for MO ions [6,54]. Consequently, MO uptake was reduced. So, pH 3.0 was nominated for the subsequent experiments.
In the same manner, MB uptake from aqueous solution by the studied SP/PAM composite is a pH-controlled process (Figure 8a); the R % (>33%) was achieved at pH 9.0, matching with several reported data [55]. Beyond pH 9.0, MB removal capacity was slightly improved (33.8%). On the other hand, at low pH values of 5.0–6.0, the removal capacity (R%) of MB was noticeably decreased in accordance with the repulsive forces among +ve sites of SP/PAM composite and the +ve MB ions [55]. This repulsive behavior was a consequence of the severe competition among H+ and MB ions in solution for occupying the available binding sites on the surface of SP/PAM nanocomposite. However, in accordance with the amplified affinity of H+ over MB ions, such competition contributed to the protonation process that caused the SP/PAM to have a positively charged surface below pH 5.9 as was evident from the outcomes of the pHPZC and thus increased its repulsive power for the MB molecules [6]. On the contrary, the de-protonation process of the composite surface at pH > pHPZC, improved the MB sorption; the equilibrium was attained at pH 9.0, achieving the maximum removal capacity [56]. Thus, pH 9.0 was selected for conducting further experimental work.
Similarly, Fe(Ⅲ) uptake from aqueous by the studied SP/PAM composite was also a pH-controlled process (Figure 8b); the removal capacity (R %) was improved from 19 to 64.5% via raising the applied pH from 2.0 to 7.0, respectively keeping the other experimental parameters fixed (Table 1, Figure 8b). At pH 2.0–4.0, the prevalence of H protons in the solution contributed to protonation process of the composite surface matching with the pHPZC (5.9) result (Figure 8c). Such protonation process had motivated the repulsive interaction for Fe ions by the protonated binding positions on the surface of the composite [57]. Therefore, the recorded removal capacity of Fe(Ⅲ) was approximately low (R% = 19–44% at pH 2.0–40, respectively). However, chelation (chemical complexation) with the composite active sites (e.g., O- and N-bearing groups) is the probable driving mechanism for Fe(Ⅲ) sorption at such acidic media [58]. Meanwhile, at pH 5.0, the R% (≈66%) of Fe(Ⅲ) by the prepared composite was attained. This could be attributed to the coupling of the chelation (complexation) mechanism with the promoted electrostatic attraction for Fe(Ⅲ) ions as a consequence of the decline in the number of protonated O- and N-bearing groups on the composite surface. However, electrostatic attraction, as well as precipitation of Fe(Ⅲ) as Fe(OH)3, could be the main driving forces for the achieved R% beyond pHPZC (59 and 64.5% at pH 6.0 and 7.0, respectively) [59]. Thus, pH 5.0 was designated for conducting further experimental work to avoid Fe(Ⅲ) precipitation as Fe(OH)3.

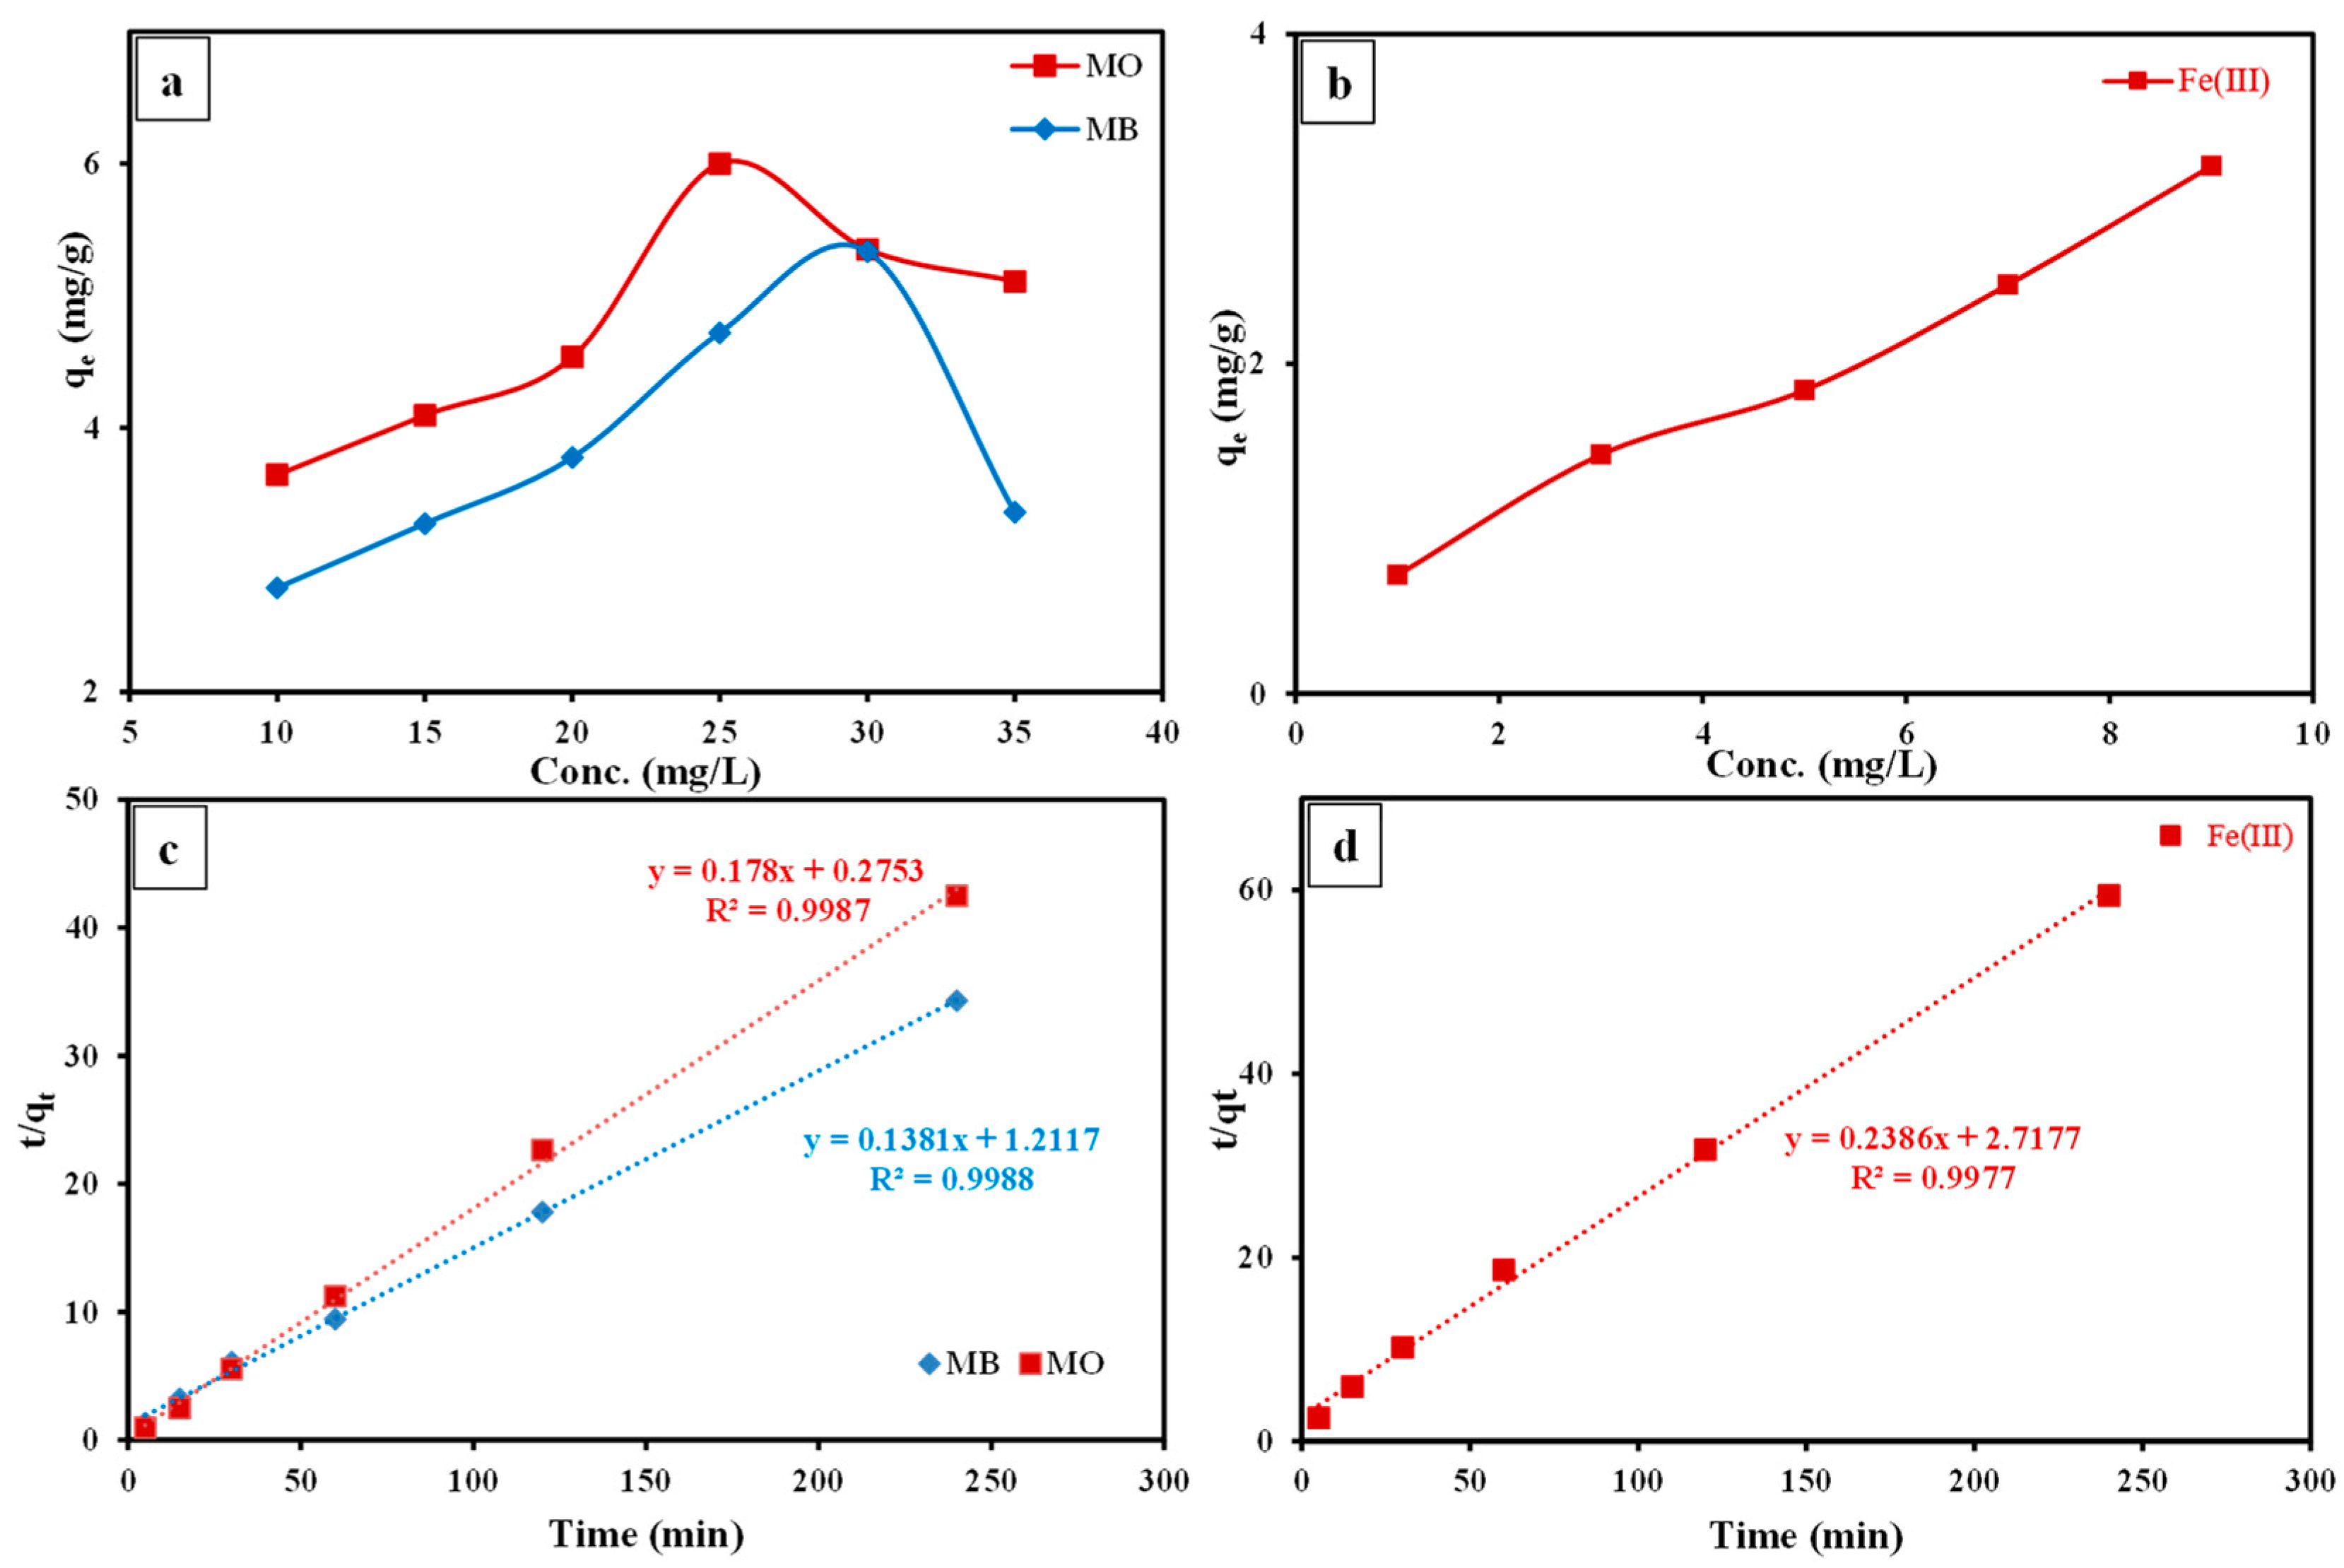
3.3.2. Effect of Contact Time

Retention time tests displayed that the MO and MB sorption by the fabricated SP/PAM was a time-operated procedure as depicted in Figure 9a. This was affirmed by the sonic MO and MB sorption at interval from 5 to 15 min (qt ≈ 5.3–6 mg/g and 3.8–4.7 mg/g, respectively). The very fast sorption rates of MO and MB by SP/PAM at this time interval could be tied with the accessibility of various active locations on the composite surface with a larger affinity toward MO and MB ions [6,53]. Beyond 15 min of retention time for MO, there was a noticeable reduction in the sorbed amount of the regarded dye by the investigated composite (qt ≈ 5.3 mg/g). This could be justified by the desorption process of the physically sorbed MO ions, beyond the estimated equilibrium time with shaking, indicating the instability of the physically adsorbed dye by SP/PAM [60]. Conversely, beyond 15 min, the MB sorption by the prepared composite was improved until equilibrium at 60 min (qt ≈ 6.35 mg/g). Above 60 min, appreciable improvement in the adsorbed MO (qt ≈ 3.5 mg/g) was not recorded. Therefore, 15 and 60 min were assigned as retention times to conduct the subsequent experimental work for MO and MB, respectively.
In addition, the retention time experiments that were conducted following the protocol reported in Table 1 demonstrated that the sorption of Fe(Ⅲ) by the fabricated SP/PAM was a time-reliant process (Figure 9a). This was evident from the rapid sorption of Fe(Ⅲ) at time interval from 5 to 30 min (qt ≈ 1.98–2.94 mg/g, respectively). The fast sorption rate of Fe(Ⅲ) by SP/PAM during this stage (i.e., 5–30 min) could be attributed to the availability of various active locations on the composite surface [61]. Beyond 30 min, the sorption of Fe(Ⅲ) by the addressed composite was decelerated until the equilibrium stage at 120 min (qt ≈ 3.8 mg/g). Further extension for the applied retention time beyond 120 min has no appreciable impact on Fe(Ⅲ) sorption by the SP/PAM composite (qt ≈ 4 mg/g at 240 min). This could be ascribed to the inaccessibility of vacant binding sites on the composite surface [62]. Therefore, 120 min was adopted as retention time for conducting the subsequent experimental work.

3.3.3. Effect of Adsorbent Dose

The influence of SP/PAM dose (10 to 35 mg) on R% of MO and MB from standard solutions with fixed concentration (25 mg/L) is illustrated in Figure 9b. The R% of MO and MB by the SP/PAM was improved from 19.88 to 41.95% and from 10.17 to 17.94% with enhancing the dose from 10 to 35 mg, correspondingly. This realistic improvement in the removal capacity of the investigated dyes was correlated to the increase in the available binding sites on the composite surface [6,63]. Similarly, the impact of SP/PAM dose (20 to 70 mg) on the R% of Fe(Ⅲ) from standard solution with fixed initial concentration (3 mg/L), keeping the other experimental parameters constant (Table 1), is depicted in Figure 9b. The removal capacity of Fe(Ⅲ) by the SP/PAM increased from 27 to 67.7% with the increase in the dose from 20 to 70 mg, respectively. This was interrelated with the progressive increment of the accessible active groups on the composite surface [62]. The sorption of both dyes onto the SP/PAM composite was primarily driven by the captivating force of electrostatic attraction, as the positively and negatively charged iso-energetic sites on the composite surface effectively attracted the dye ions. On the other hand, the sorption of Fe(III) was controlled by a combination of chelation and electrostatic attraction, suggesting a more complex interaction mechanism. The chelation process, which involves the formation of chemical bonds between the composite surface and Fe(III) ions, coupled with the electrostatic attraction, played a crucial role in the overall sorption behavior of Fe(III).

3.3.4. Effect of Initial Concentration

The impact of the initial MO and MB concentration (10–35 mg/L) was separately depicted in Figure 10a. The development of MO and MB initial concentrations from 10 to 25 mg/L and 10 to 30 mg/L was coupled with an improvement in the adsorbed qe (mg/g) of the addressed dyes from 3.6 to 6 mg/g and 2.8–5.3 mg/g, respectively (Figure 10a). This enhancement could be attributed to the amplifying collision among MO and MB ions with the active locations of the prepared composite in contemporaneous with raising the initial concentration, indicating that mass gradient is the leading power for the dye ions onto the SP/PAM surface [57]. On the contrary, beyond 25 and 30 mg/L of MO and MB, respectively, noticeable reductions in the adsorbed amounts (qe, mg/g) of the addressed dyes were observed. These reductions could be attributed to the progressive development of hydration shells around the dye molecules in association with increasing their initial concentration in the solution, magnifying the repulsive force with the surface of the composite due to the hydrophobicity of the prepared composite gained from the parental polyamide 6 (i.e., very poor wettability) [64]. Knowing that hydrophobic objects have little or no tendency to adsorb water and water tends to “bead” on their surfaces (i.e., discrete droplets), this is in accordance with the low surface tension values of these hydrophobic materials and the lack of active groups on their surfaces for the formation of “hydrogen bonds” with such hydrated molecules. On the contrary, the hydrophilic nature of SP (the minor component in the composite) [65], its high surface tension, and numerous active sites, facilitate the formation of “hydrogen bonds” with such hydrated dye molecules, explaining the sorption process at these high concentrations, even if it was limited.
Additionally, the effect of the applied initial concentration of Fe(Ⅲ) was investigated minutely, keeping the other experimental parameters fixed (Table 1, Figure 10b). The increase in concentrations from 1 to 9 mg/L was accompanied by an increase in the adsorbed amount (qe, mg/g) from 0.72 to 3.2 mg/g (Figure 10b). This increment was attributed to the cumulative collision among the v ions with increasing the initial concentration of Fe(Ⅲ), driving them toward the vacant active sites on the composite surface [58].

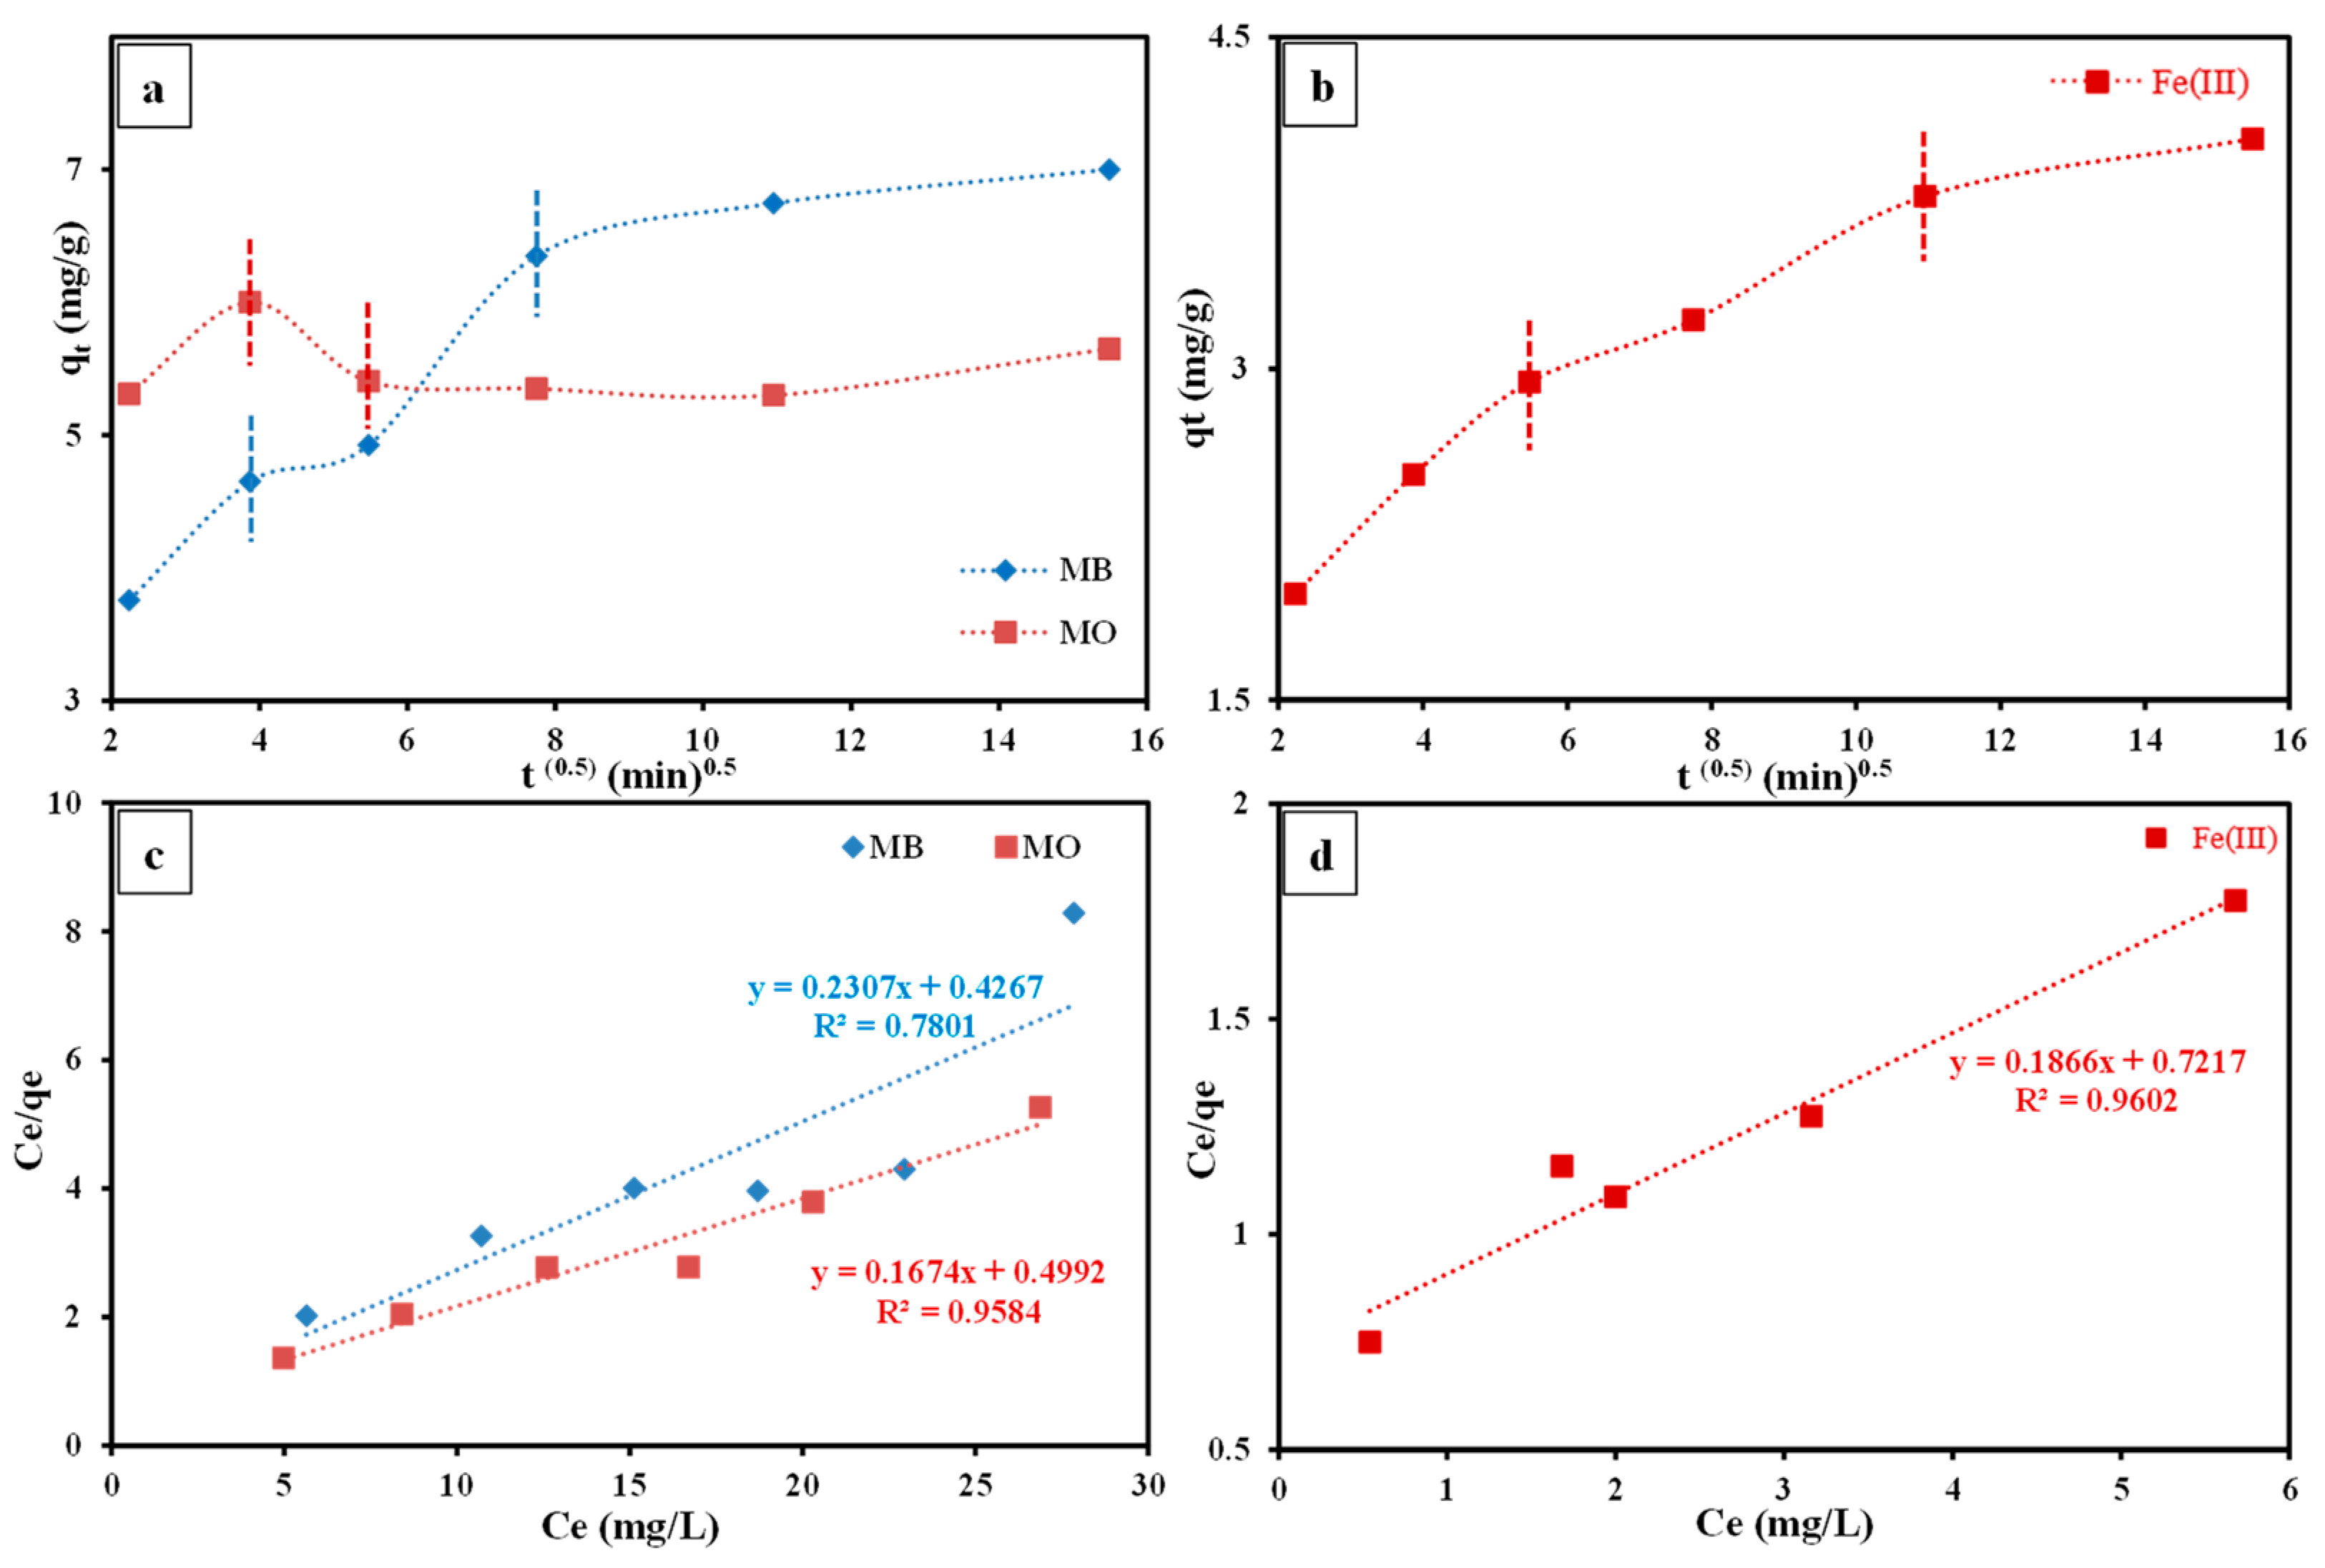
3.3.5. Kinetic Studies

The kinetics of MB, MO, and Fe(Ⅲ) sorption by SP/PAM were investigated using the linear form of the PSO (pseudo-second-order) and IPD “inter-particle diffusion” equations (Table 6) [66]. In addition, the derived parameters from these equations were calculated and tabulated in Table 7.
The MO and MB ions sorption by the regarded SP/PAM was well explained by the PSO model (Figure 10c). This signifies that the potential rate-governing step of their removal was chemisorption [70], as assured by the obtained determination coefficients (R2 = 0.999). Similarly, the approximate agreement among the theoretical (qecal = 7.24 and 5.62 mg/g, for MB and MO, respectively) and the experimental qe (qeexp. = 6.35 and 6 mg/g, respectively) ratifies the well-fitting of the PSO for explaining the regarded dye sorption process of the investigated dyes (Table 7). Similarly, the Fe(Ⅲ) sorption by SP/PAM was adequately described by the PSO equation (Figure 10d), as was evident from the high determination coefficient (R2 = 0.998) [58], as well as the approximate match between the experimental (qeexp. = 3.78 mg/g) and the theoretical qe (qecal = 4.2 mg/g) (Table 7).
Furthermore, the graphical presentations of the IPD equation [67] for MO, MB, and Fe(Ⅱ) separately displayed multi-segmental plots that emanated away from the original point (Figure 11a,b). These plots signify that the sorption of such contaminants by the prepared SP/PAM was described by several diffusion mechanisms involving the intra-particle one [57,71].
The steep segment (first phase) of the multi-segmental plots for all the investigated dyes and Fe(Ⅲ) (Figure 11a,b) confirm that exterior mass transfer or diffusion along the boundary layer is the driving power of these contaminants’ sorption by the SP/PAM [57]. This was followed by a gentle-slope segment (second phase) for MB and Fe(Ⅲ), indicating that the sorption of their ions by SP/PAM is gradual (i.e., the diffusion of MB and Fe(Ⅲ) ions from the exterior surface of the SP/PAM into pore-wall interstices and/or pores was a slow process). This indicates that IPD was the motivating mechanism in this segment [54]. Therefore, the second segments of MB and Fe(Ⅲ) sorption by SP/PAM were used to estimate the IPD parameters [72], as summarized in Table 6. Conversely, the gently inclined second segment of the MO plot designates that desorption of such dye ions out from SP/PAM pores was a slow process. Finally, the plateau segments (third phase) for MO and Fe(Ⅲ) sorption by SP/PAM express equilibrium state attainment [63], whereas the third plateau segment of MO IPD plot implies that the desorption of MO ions was approximately constant whatever the applied retention time (Figure 11a).

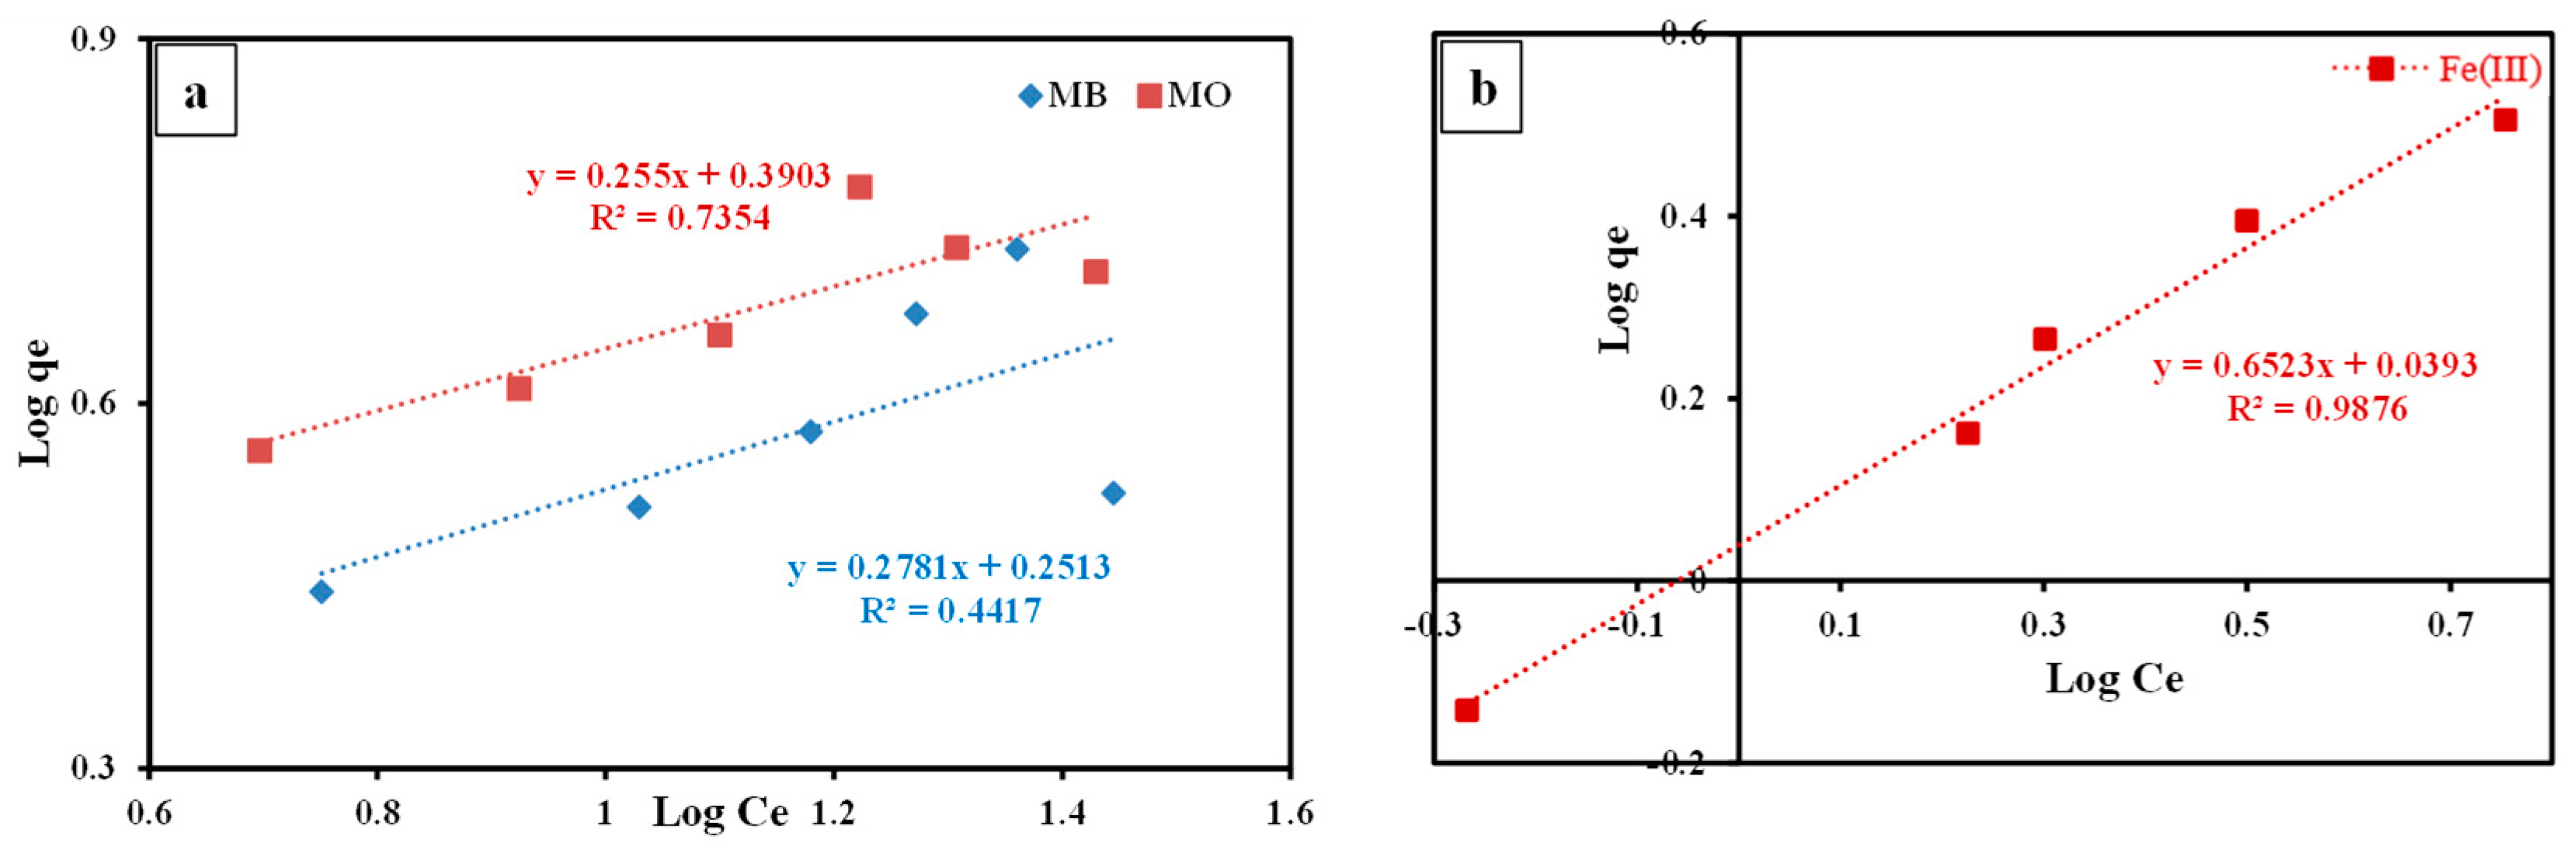
3.3.6. Isotherm Studies

Isotherm studies are crucial in understanding the adsorption behavior of contaminants onto the SP/PAM composite. In this study, two commonly used isotherm models, the Langmuir and Freundlich equations, were employed to analyze the sorption data and evaluate the affinity of the SP/PAM composite towards the investigated contaminants, including MO, MB, and Fe(III). These models offer a glimpse into the complex interplay between the adsorbent and the adsorbate molecules, shedding light on the surface affinity and binding characteristics of the composite for the addressed contaminants. The parameters estimated from the linear equations of these models (Table 6) [68,69] are compiled in Table 8. The Langmuir isotherm model, on the other hand, assumes a homogeneous sorption process, where only a monolayer of adsorbate molecules is formed on the surface of the adsorbent [72]. The Langmuir constant, b, reflects the energy of adsorption, with higher values indicating a stronger binding affinity between the adsorbate and the composite surface. Additionally, the Freundlich isotherm model assumes a heterogeneous sorption process, where multiple layers of adsorbate molecules are formed on the surface of the adsorbent [72]. This can be likened to the free movement of adsorbate molecules and their interaction with various binding sites on the composite surface. The Freundlich constant, KF, represents the adsorption capacity of the composite, indicating how much adsorbate can be accommodated on the surface. The Freundlich exponent, n, reflects the intensity of adsorption, with higher values indicating a stronger affinity between the adsorbate and the composite surface. By analyzing the parameters estimated from the Freundlich and Langmuir models, a deeper understanding of the sorption behavior of the investigated contaminants onto the SP/PAM composite can be obtained. The results can reveal important information, such as the maximum adsorption capacity, intensity of adsorption, and energy of adsorption, which can be crucial in optimizing the design and application of the SP/PAM composite for environmental remediation. These models provide a valuable framework for comprehending the intricate interaction between the adsorbent and the adsorbate at the molecular level, adding depth and richness to the understanding of the sorption process in the SP/PAM composite system.
The graphical presentation of Ce/qe vs. Ce and log qe vs. log Ce for the Langmuir and Freundlich equations, respectively, was used to determine these models’ parameters (Figure 12a,b).
The outcomes of the correlation coefficients (R2) of the employed equations (Table 8) indicate that the Langmuir equation provided a better fit for the sorption data of the addressed dyes (MO and MB) onto the SP/PAM composite compared to the Freundlich equation (Langmuir R2 = 0.958 and 0.780 for MO and MB, respectively). Conversely, the Freundlich equation was found to better describe the sorption data of Fe(III) onto the SP/PAM composite compared to the Langmuir equation (Freundlich R2 = 0.988). This suggests that the adsorbed dye ions on the surface of the SP/PAM composite formed homogenous monolayers, utilizing the negatively and positively charged iso-energetic active sites for MO and MB, respectively [73]. On the other hand, the adsorbed ions of Fe(III) formed multiple heterogeneous layers over the SP/PAM surface, indicating the integration of various mechanisms during the sorption process, including cation exchange, complexation, and electrostatic attraction. Furthermore, the discrepancy in qmax (maximum adsorption capacity) between MO and MB ions in favor of former (5.97 mg/g and 4.33 mg/g, respectively) suggests that the negative binding sites on the composite surface played a more significant role in the sorption of MO compared to positive sites toward MB [74]. Additionally, the prepared SP/PAM composite displayed acceptable sorption capacity for Fe(II), with a satisfactory maximum removal capacity (qmax = 5.36 mg/g), even though the fabrication target was not for a batch system. These findings provide valuable insights into the sorption behavior and mechanisms of the investigated contaminants onto the SP/PAM composite, enhancing our understanding of the composite’s performance in environmental remediation applications.

4. Conclusions

The hazardous impact of the useless huge accumulations of both SP Ctl and PA6 as mining and industrial wastes, respectively, was eliminated and their add value was maximized through their application in the fabrication of sustainable SP/PAM nanocomposite via the electro-spinning technique.
(a)
The successful impregnation of SP Ctl within PA6 via the electro-spinning technique created an internal network structure within the polymer fibers by molecular self-assembly, producing intermitted charge upon the surface and hence multiplying the sorption capacity of the produced hybrid nanocomposite.
(b)
The hybrid, hydrophilic, and hydrophobic nature that was gained from the precursor SP Ctl and PA6 wastes, respectively, nominated the fabricated nanofibrous membrane composite as a promising adsorbent for various sorts of water contaminants with adequate removal efficiency.
(c)
The remediation of MO and MB and Fe(III) by the fabricated SP/PAM nanocomposite was a pH- and time-reliant procedure and their R% was attained at pH 3.0, 9.0, and 5.0, as well as 15, 60, and 120 min as retention time, respectively.
(d)
The PSO equation illustrated the kinetic of the sorption procedure of the regarded contaminants by the prepared nanocomposite in an adequate manner as was assured by the high R2 (≈0.999) and the close matching among the values of both experimental and theoretical qe.
(e)
The IPD multi-linearity specified that intra-particle diffusion is one of the driving stages in the sorption of the regarded contaminants by the investigated nanocomposite in collaboration with several styles of diffusion.
(f)
In accordance with the R2 results, the sorption data of the investigated dyes and Fe(Ⅲ) by the studied nanocomposite was explained well by the Langmuir equation compared to the Freundlich equation, indicating mono-layer sorption of these contaminants by the O2- and N2-holding sites on the composite surface.
(g)
Electrostatic attraction was the driving mechanism for sorption of both dyes by the iso-energetic sites of the SP/PAM, whereas the coupling between chelation and electrostatic attraction was the controlling mechanisms for Fe(Ⅲ) sorption.
(h)
Finally, the fabricated SP/PAM nanocomposite can be classified as sustainable adsorbent with adequate efficiency for dyes and heavy metals.

Author Contributions

A.H.E.M.: methodology and visualization. M.M.E.-R.: supervision and investigation. B.S.M.: conceptualization, investigation, methodology, validation, and writing—original draft. M.A.M.: conceptualization, methodology, and writing—review and editing. P.P.: writing—review and editing. M.H.A.: methodology and investigation. N.K.: writing—review and editing. A.M.Z.: conceptualization, investigation, data curation, validation, supervision, and writing—review and editing. All authors have read and agreed to the published version of the manuscript.

Funding

The paper is based upon work supported by Science, Technology & Innovation Funding Authority (STDF), Call No. 9/Technology Development Grants (STDF-TDG)/Development & Innovation Grants under grant number 43310.

Institutional Review Board Statement

Not applicable.

Informed Consent Statement

Not applicable.

Data Availability Statement

The authors confirm that the data used to support the findings of this study are available within the article.

Conflicts of Interest

The authors declare no conflict of interest.

References

  1. Homaeigohar, S.; Elbahri, M. Nanocomposite Electrospun Nanofiber Membranes for Environmental Remediation. Materials 2014, 7, 1017–1045. [Google Scholar] [CrossRef] [PubMed]
  2. Metwally, B.S.; El-Sayed, A.A.; Radwan, E.K.; Hamouda, A.S.; El-Sheikh, M.; Salama, M. Fabrication, characterization, and dye adsorption capability of recycled modified polyamide nanofibers. Egypt. J. Chem. 2018, 61, 867–882. [Google Scholar] [CrossRef]
  3. Manzoor, J.; Sharma, M. Impact of Textile Dyes on Human Health and Environment. In Impact of Textile Dyes on Public Health and the Environment; Wani, K.A., Jangid, N.K., Bhat, A.R., Eds.; IGI Global: Hershey, PA, USA, 2020; pp. 162–169. [Google Scholar] [CrossRef]
  4. Bai, L.; Wang, S.; Wang, Z.; Hong, E.; Wang, Y.; Xia, C.; Wang, B. Kinetics and mechanism of photocatalytic degradation of methyl orange in water by mesoporous Nd-TiO2-SBA-15 nanocatalyst. Environ. Pollut. 2019, 248, 516–525. [Google Scholar] [CrossRef] [PubMed]
  5. El-Sheikh, M.N.; Metwally, B.S.; Mubarak, M.F.; Ahmed, H.A.; Abdel Moghny, T.; Zayed, A.M. Fabrication of electrospun polyamide–weathered basalt nano-composite as a non-conventional membrane for basic and acid dye removal. Polym. Bull. 2022. [Google Scholar] [CrossRef]
  6. Zayed, A.M.; Fathy, M.; Sillanpää, M.; Abdel Wahed, M.S.M. Talc-graphite schist as a natural organo-mineral complex for methylene blue remediation: Kinetic and isotherm study. SN Appl. Sci. 2020, 2, 740. [Google Scholar] [CrossRef]
  7. Islam, T.; Repon, M.R.; Islam, T.; Sarwar, Z.; Rahman, M.M. Impact of textile dyes on health and ecosystem: A review of structure, causes, and potential solutions. Environ. Sci. Pollut. Res. 2023, 30, 9207–9242. [Google Scholar] [CrossRef] [PubMed]
  8. Silver, J. Chemistry of Iron; Springer: Dordrecht, The Netherlands, 1993. [Google Scholar]
  9. Tagyan, A.I.; Yasser, M.M.; Mousa, A.M.; Alkhalifah, D.H.M.; Hozzein, W.N.; Marzouk, M.A. A Feasibility Study on the Recall of Metallophilic Fungi from Fe(III)-Contaminated Soil and Evaluating Their Mycoremediation Capacity: Experimental and Theoretical Study. J. Fungi 2023, 9, 382. [Google Scholar] [CrossRef]
  10. Saud, P.S.; Pant, B.; Ghouri, Z.K.; Panthi, G.; Park, S.-J.; Han, W.; Park, M.; Kim, H.-Y. Synthesis and characterization of photocatalytic and antibacterial PAN/Ag2CO3 composite nanofibers by ion exchange method. Fibers Polym. 2015, 16, 1336–1342. [Google Scholar] [CrossRef]
  11. Khatri, N.; Tyagi, S.; Rawtani, D. Recent strategies for the removal of iron from water: A review. J. Water Process Eng. 2017, 19, 291–304. [Google Scholar] [CrossRef]
  12. Siyal, A.A.; Shamsuddin, M.R.; Khan, M.I.; Rabat, N.E.; Zulfiqar, M.; Man, Z.; Siame, J.; Azizli, K.A. A review on geopolymers as emerging materials for the adsorption of heavy metals and dyes. J. Environ. Manag. 2018, 224, 327–339. [Google Scholar] [CrossRef]
  13. Jin, L.; Zhao, X.; Qian, X.; Dong, M. Nickel nanoparticles encapsulated in porous carbon and carbon nanotube hybrids from bimetallic metal-organic-frameworks for highly efficient adsorption of dyes. J. Colloid Interface Sci. 2018, 509, 245–253. [Google Scholar] [CrossRef] [PubMed]
  14. Dutta, A.K.; Ghorai, U.K.; Chattopadhyay, K.K.; Banerjee, D. Removal of textile dyes by carbon nanotubes: A comparison between adsorption and UV assisted photocatalysis. Phys. E Low Dimens. Syst. Nanostruct. 2018, 99, 6–15. [Google Scholar] [CrossRef]
  15. Abdulhameed, A.S.; Mohammad, A.-T.; Jawad, A.H. Application of response surface methodology for enhanced synthesis of chitosan tripolyphosphate/TiO2 nanocomposite and adsorption of reactive orange 16 dye. J. Clean. Prod. 2019, 232, 43–56. [Google Scholar] [CrossRef]
  16. Hosseini Ravandi, S.A.; Sadrjahani, M.; Valipouri, A.; Dabirian, F.; Ko, F.K. Recently developed electrospinning methods: A review. Text. Res. J. 2022, 92, 5130–5145. [Google Scholar] [CrossRef]
  17. Masoud, M.A.; Rashad, A.M.; Sakr, K.; Shahien, M.G.; Zayed, A.M. Possibility of using different types of Egyptian serpentine as fine and coarse aggregates for concrete production. Mater. Struct. 2020, 53, 87. [Google Scholar] [CrossRef]
  18. Deschamps, F.; Godard, M.; Guillot, S.; Hattori, K. Geochemistry of subduction zone serpentinites: A review. Lithos 2013, 178, 96–127. [Google Scholar] [CrossRef]
  19. Evans, B.W. Control of the Products of Serpentinization by the Fe2+Mg−1 Exchange Potential of Olivine and Orthopyroxene. J. Petrol. 2008, 49, 1873–1887. [Google Scholar] [CrossRef]
  20. Momčilović, M.Z.; Ranđelović, M.S.; Purenović, M.M.; Đorđević, J.S.; Onjia, A.; Matović, B. Morpho-structural, adsorption and electrochemical characteristics of serpentinite. Sep. Purif. Technol. 2016, 163, 72–78. [Google Scholar] [CrossRef]
  21. Belluso, E.; Cavallo, A.; Halterman, D. Crystal habit of mineral fibres. Miner. Fibres Cryst. Chem. Chem. Phys. Prop. Biol. Interact. Toxic. 2017, 18, 65–110. [Google Scholar] [CrossRef]
  22. World Health Organization. Reference methods for measuring airborne man-made mineral fibres (MMMF). In Environmental Health (WHO-EURO); World Health Organization, Regional Office for Europe: Copenhagen, Denmark, 1985. [Google Scholar]
  23. Herzog, B.; Kohan, M.I.; Mestemacher, S.A.; Pagilagan, R.U.; Redmond, K. Polyamides. In Ullmann’s Encyclopedia of Industrial Chemistry; Wiley-VCH: Weinheim, Germany, 2013. [Google Scholar] [CrossRef]
  24. Saleh, M.; Demir, D.; Ozay, Y.; Yalvac, M.; Bolgen, N.; Dizge, N. Fabrication of basalt embedded composite fiber membrane using electrospinning method and response surface methodology. J. Appl. Polym. Sci. 2021, 138, 50599. [Google Scholar] [CrossRef]
  25. Brunauer, S.; Emmett, P.H.; Teller, E. Adsorption of Gases in Multimolecular Layers. J. Am. Chem. Soc. 1938, 60, 309–319. [Google Scholar] [CrossRef]
  26. Barrett, E.P.; Joyner, L.G.; Halenda, P.P. The Determination of Pore Volume and Area Distributions in Porous Substances. I. Computations from Nitrogen Isotherms. J. Am. Chem. Soc. 1951, 73, 373–380. [Google Scholar] [CrossRef]
  27. Masoud, M.A.; El-Khayatt, A.M.; Kansouh, W.A.; Sakr, K.; Shahien, M.G.; Zayed, A.M. Insights into the effect of the mineralogical composition of serpentine aggregates on the radiation attenuation properties of their concretes. Constr. Build. Mater. 2020, 263, 120141. [Google Scholar] [CrossRef]
  28. Zayed, A.M.; Masoud, M.A.; Shahien, M.G.; Gökçe, H.S.; Sakr, K.; Kansouh, W.A.; El-Khayatt, A.M. Physical, mechanical, and radiation attenuation properties of serpentine concrete containing boric acid. Constr. Build. Mater. 2021, 272, 121641. [Google Scholar] [CrossRef]
  29. Zayed, A.M.; Masoud, M.A.; Rashad, A.M.; El-Khayatt, A.M.; Sakr, K.; Kansouh, W.A.; Shahien, M.G. Influence of heavyweight aggregates on the physico-mechanical and radiation attenuation properties of serpentine-based concrete. Constr. Build. Mater. 2020, 260, 120473. [Google Scholar] [CrossRef]
  30. Masoud, M.A.; El-Khayatt, A.M.; Shahien, M.G.; Bakhit, B.R.; Suliman, I.I.; Zayed, A.M. Radiation Attenuation Assessment of Serpentinite Rocks from a Geological Perspective. Toxics 2022, 10, 697. [Google Scholar] [CrossRef]
  31. Gahlan, H.A.; Arai, S.; Almadani, S.A. Petrogenesis of carbonated meta-ultramafic lenses from the Neoproterozoic Heiani ophiolite, South Eastern Desert, Egypt: A natural analogue to CO2 sequestration. J. Afr. Earth Sci. 2015, 102, 102–115. [Google Scholar] [CrossRef]
  32. ASTM E1621; Standard Guide for Elemental Analysis by Wavelength Dispersive X-Ray Fluorescence Spectrometry. ASTM International: West Conshohocken, PA, USA, 2013.
  33. ASTM D7348; Standard Test Methods for Loss on Ignition (LOI) of Solid Combustion Residues. ASTM International: West Conshohocken, PA, USA, 2008.
  34. Thommes, M.; Kaneko, K.; Neimark, A.V.; Olivier, J.P.; Rodriguez-Reinoso, F.; Rouquerol, J.; Sing, K.S.W. Physisorption of gases, with special reference to the evaluation of surface area and pore size distribution (IUPAC Technical Report). Pure Appl. Chem. 2015, 87, 1051–1069. [Google Scholar] [CrossRef]
  35. Mastalerz, M.; He, L.; Melnichenko, Y.B.; Rupp, J.A. Porosity of Coal and Shale: Insights from Gas Adsorption and SANS/USANS Techniques. Energy Fuels 2012, 26, 5109–5120. [Google Scholar] [CrossRef]
  36. Liao, Y.; Loh, C.-H.; Tian, M.; Wang, R.; Fane, A.G. Progress in electrospun polymeric nanofibrous membranes for water treatment: Fabrication, modification and applications. Prog. Polym. Sci. 2018, 77, 69–94. [Google Scholar] [CrossRef]
  37. Wang, T.; Kumar, S. Electrospinning of polyacrylonitrile nanofibers. J. Appl. Polym. Sci. 2006, 102, 1023–1029. [Google Scholar] [CrossRef]
  38. Vasanthan, N.; Salem, D.R. FTIR spectroscopic characterization of structural changes in polyamide-6 fibers during annealing and drawing. J. Polym. Sci. Part B Polym. Phys. 2001, 39, 536–547. [Google Scholar] [CrossRef]
  39. Xu, J.-R.; Ren, X.-K.; Yang, T.; Jiang, X.-Q.; Chang, W.-Y.; Yang, S.; Stroeks, A.; Chen, E.-Q. Revisiting the Thermal Transition of β-Form Polyamide-6: Evolution of Structure and Morphology in Uniaxially Stretched Films. Macromolecules 2018, 51, 137–150. [Google Scholar] [CrossRef]
  40. Tsou, S.-Y.; Lin, H.-S.; Wang, C. Studies on the electrospun Nylon 6 nanofibers from polyelectrolyte solutions: 1. Effects of solution concentration and temperature. Polymer 2011, 52, 3127–3136. [Google Scholar] [CrossRef]
  41. Liu, K.; Li, Y.; Tao, L.; Xiao, R. Preparation and characterization of polyamide 6 fibre based on a phosphorus-containing flame retardant. RSC Adv. 2018, 8, 9261–9271. [Google Scholar] [CrossRef] [PubMed]
  42. Ogunsona, E.O.; Misra, M.; Mohanty, A.K. Sustainable biocomposites from biobased polyamide 6,10 and biocarbon from pyrolyzed miscanthus fibers. J. Appl. Polym. Sci. 2017, 134. [Google Scholar] [CrossRef]
  43. Wan, J.; Bu, Z.-Y.; Li, C.; Fan, H.; Li, B.-G. Preparation, melting, glass relaxation and nonisothermal crystallization kinetics of a novel dendritic nylon-11. Thermochim. Acta 2011, 524, 117–127. [Google Scholar] [CrossRef]
  44. Hanno, I.; Anselmi, C.; Bouchemal, K. Polyamide Nanocapsules and Nano-emulsions Containing Parsol® MCX and Parsol® 1789: In Vitro Release, Ex Vivo Skin Penetration and Photo-Stability Studies. Pharm. Res. 2012, 29, 559–573. [Google Scholar] [CrossRef]
  45. Nugraha, A.S.; Chou, C.C.; Yu, P.H.; Lin, K.-L. Effects of applied voltage on the morphology and phases of electrospun poly(vinylidene difluoride) nanofibers. Polym. Int. 2022, 71, 1176–1183. [Google Scholar] [CrossRef]
  46. Abubakar, M.; Mohd Noor, S.F.B.; Ahmad, N. Effect of milling time on the performance of ceramic membrane from ball clay for the treatment of nickel plating wastewater. J. Aust. Ceram. Soc. 2019, 55, 667–679. [Google Scholar] [CrossRef]
  47. Ahmed, R.M.; Atta, M.M.; Taha, E.O. Optical spectroscopy, thermal analysis, and dynamic mechanical properties of graphene nano-platelets reinforced polyvinylchloride. J. Mater. Sci. Mater. Electron. 2021, 32, 22699–22717. [Google Scholar] [CrossRef]
  48. Selim, H.; Elshypany, R.; El-Bahy, S.M.; Mubarak, M.F.; Taha, E.O. Fabrication of electro spun nylon6.12/chitosan @PES nanofibrous UF membrane towards dyes rejection from synthetic wastewater. Polym. Bull. 2022, 80, 977–999. [Google Scholar] [CrossRef]
  49. Arigbabowo, O.K.; Tate, J.S. Additive manufacturing of polyamide nanocomposites for electrostatic charge dissipation applications. Mater. Sci. Eng. B 2021, 271, 115251. [Google Scholar] [CrossRef]
  50. Subbaiah, M.V.; Kim, D.-S. Adsorption of methyl orange from aqueous solution by aminated pumpkin seed powder: Kinetics, isotherms, and thermodynamic studies. Ecotoxicol. Environ. Saf. 2016, 128, 109–117. [Google Scholar] [CrossRef] [PubMed]
  51. Singh, D.; Verma, S.; Gautam, R.K.; Krishna, V. Copper adsorption onto synthesized nitrilotriacetic acid functionalized Fe3O4 nanoparticles: Kinetic, equilibrium and thermodynamic studies. J. Environ. Chem. Eng. 2015, 3, 2161–2171. [Google Scholar] [CrossRef]
  52. Asuha, S.; Zhou, X.G.; Zhao, S. Adsorption of methyl orange and Cr(VI) on mesoporous TiO2 prepared by hydrothermal method. J. Hazard. Mater. 2010, 181, 204–210. [Google Scholar] [CrossRef] [PubMed]
  53. Saleh, T.A.; Al-Saadi, A.A.; Gupta, V.K. Carbonaceous adsorbent prepared from waste tires: Experimental and computational evaluations of organic dye methyl orange. J. Mol. Liq. 2014, 191, 85–91. [Google Scholar] [CrossRef]
  54. Zayed, A.M.; Abdel Wahed, M.S.M.; Mohamed, E.A.; Sillanpää, M. Insights on the role of organic matters of some Egyptian clays in methyl orange adsorption: Isotherm and kinetic studies. Appl. Clay Sci. 2018, 166, 49–60. [Google Scholar] [CrossRef]
  55. Zhang, G.; Liu, H.; Liu, R.; Qu, J. Removal of phosphate from water by a Fe–Mn binary oxide adsorbent. J. Colloid Interface Sci. 2009, 335, 168–174. [Google Scholar] [CrossRef] [PubMed]
  56. Sharma, P.; Kaur, R.; Baskar, C.; Chung, W.-J. Removal of methylene blue from aqueous waste using rice husk and rice husk ash. Desalination 2010, 259, 249–257. [Google Scholar] [CrossRef]
  57. Dai, H.; Chen, Y.; Ma, L.; Zhang, Y.; Cui, B. Direct regeneration of hydrogels based on lemon peel and its isolated microcrystalline cellulose: Characterization and application for methylene blue adsorption. Int. J. Biol. Macromol. 2021, 191, 129–138. [Google Scholar] [CrossRef] [PubMed]
  58. Guan, X.; Yuan, X.; Zhao, Y.; Bai, J.; Li, Y.; Cao, Y.; Chen, Y.; Xiong, T. Adsorption behaviors and mechanisms of Fe/Mg layered double hydroxide loaded on bentonite on Cd (II) and Pb (II) removal. J. Colloid Interface Sci. 2022, 612, 572–583. [Google Scholar] [CrossRef]
  59. Kasim, N.; Mahmoudi, E.; Mohammad, A.W.; Abdullah, S.R.S.T. Influence of feed concentration and pH on iron and manganese rejection via nanohybrid polysulfone/Ag-GO ultrafiltration membrane. Desalination Water Treat. 2017, 61, 29–41. [Google Scholar] [CrossRef]
  60. Kurniawati, D.; Bahrizal; Sari, T.K.; Adella, F.; Sy, S. Effect of Contact Time Adsorption of Rhodamine B, Methyl Orange and Methylene Blue Colours on Langsat Shell with Batch Methods. J. Phys. Conf. Ser. 2021, 1788, 012008. [Google Scholar] [CrossRef]
  61. Mzinyane, N.N.; Ofomaja, A.E.; Naidoo, E.B. Synthesis of poly (hydroxamic acid) ligand for removal of Cu (II) and Fe (II) ions in a single component aqueous solution. S. Afr. J. Chem. Eng. 2021, 35, 137–152. [Google Scholar] [CrossRef]
  62. Bankole, M.T.; Abdulkareem, A.S.; Mohammed, I.A.; Ochigbo, S.S.; Tijani, J.O.; Abubakre, O.K.; Roos, W.D. Selected Heavy Metals Removal From Electroplating Wastewater by Purified and Polyhydroxylbutyrate Functionalized Carbon Nanotubes Adsorbents. Sci. Rep. 2019, 9, 4475. [Google Scholar] [CrossRef]
  63. Mohamed, F.M.; Li, Z.; Zayed, A.M. Carbon nanotube impregnated anthracite (An/CNT) as a superior sorbent for azo dye removal. RSC Adv. 2020, 10, 25586–25601. [Google Scholar] [CrossRef]
  64. Petzold, G.; Schwarz, S.; Dutschk, V. Polyelectrolyte-surfactant complexes and their influence on the wettability of different polymer surfaces. Colloid. Polym. Sci. 2014, 292, 2197–2205. [Google Scholar] [CrossRef]
  65. Feng, B.; Lu, Y.; Feng, Q.; Zhang, M.; Gu, Y. Talc–serpentine interactions and implications for talc depression. Miner. Eng. 2012, 32, 68–73. [Google Scholar] [CrossRef]
  66. Ho, Y.S.; McKay, G. Pseudo-second order model for sorption processes. Process Biochem. 1999, 34, 451–465. [Google Scholar] [CrossRef]
  67. Weber, W.; Morris, J. Advances in water pollution research. In Proceedings of the First International Conference on Water Pollution Research, London, UK, 3–7 September 1962; p. 231. [Google Scholar]
  68. Langmuir, I. The adsorption of gases on plane surfaces of glass, mica and platinum. J. Am. Chem. Soc. 1918, 40, 1361–1403. [Google Scholar] [CrossRef]
  69. Freundlich, H. Over the adsorption in solution. J. Phys. Chem 1906, 57, 1100–1107. [Google Scholar]
  70. Jawad, A.H.; Ismail, K.; Ishak, M.A.M.; Wilson, L.D. Conversion of Malaysian low-rank coal to mesoporous activated carbon: Structure characterization and adsorption properties. Chin. J. Chem. Eng. 2019, 27, 1716–1727. [Google Scholar] [CrossRef]
  71. Selim, A.Q.; Mohamed, E.A.; Seliem, M.K.; Zayed, A.M. Synthesis of sole cancrinite phase from raw muscovite: Characterization and optimization. J. Alloys Compd. 2018, 762, 653–667. [Google Scholar] [CrossRef]
  72. Chen, S.; Zhang, J.; Zhang, C.; Yue, Q.; Li, Y.; Li, C. Equilibrium and kinetic studies of methyl orange and methyl violet adsorption on activated carbon derived from Phragmites australis. Desalination 2010, 252, 149–156. [Google Scholar] [CrossRef]
  73. Jawad, A.H.; Mamat, N.F.H.; Hameed, B.H.; Ismail, K. Biofilm of cross-linked Chitosan-Ethylene Glycol Diglycidyl Ether for removal of Reactive Red 120 and Methyl Orange: Adsorption and mechanism studies. J. Environ. Chem. Eng. 2019, 7, 102965. [Google Scholar] [CrossRef]
  74. Cunha, M.R.; Lima, E.C.; Lima, D.R.; da Silva, R.S.; Thue, P.S.; Seliem, M.K.; Sher, F.; dos Reis, G.S.; Larsson, S.H. Removal of captopril pharmaceutical from synthetic pharmaceutical-industry wastewaters: Use of activated carbon derived from Butia catarinensis. J. Environ. Chem. Eng. 2020, 8, 104506. [Google Scholar] [CrossRef]
Figure 1. Sketch summarizing the steps of the spinning process of SP/PAM via programmable syringe pump and high-voltage power supply.
Sustainability 15 07060 g001
Figure 2. Field photo showing greenish grey Ctl serpentinites at Wadi Atalla area (a); CPL photomicrographs showing the mineral composition of Wadi Atalla serpentinites: Ctl, Mag, Dol, and Lz (b,c); fractured magnetite of Wadi Atalla serpentinites with relics of fresh chromite (Chr) in the center (d).
Sustainability 15 07060 g002
Figure 3. Representative XRD patterns of Ctl at both micro- and nano-sizes (a); FT-IR spectra of Ctl in both micro- and nano-sizes (b).
Sustainability 15 07060 g003
Figure 4. SEM images showing: Ctl in micro-size with fibrous morphology (a); Ctl in nano-size with agglomerated granular nature (b); nitrogen adsorption–desorption isotherms of Ctl in both micro- and nano-sizes (c).
Sustainability 15 07060 g004
Figure 5. SEM images showing the morphology and microroughness of precursor PA waste (a) in comparison with the electro-spun nanofiber SP/PAM at different magnifications (bd).
Sustainability 15 07060 g005
Figure 6. XRD patterns of PA waste in comparison with the fabricated SP/PAM composite (a); FT-IR spectra of SP/PAM composite in comparison with the parental raw materials (SP and PA waste) (b).
Sustainability 15 07060 g006
Figure 7. Nitrogen adsorption–desorption isotherms of precursor PA waste in comparison with the fabricated SP/PAM composite (a); DMA results showing: (b) the variation of tensile storage modulus (E′); (c) the damping parameter (tan δ) with temperature for PA waste in comparison with the fabricated SP/PAM composite.
Sustainability 15 07060 g007
Figure 8. Effect of pH on MB, MO, and Fe(ⅡI) uptake by the prepared SP/PAM composite (a,b); zero charge point of the prepared SP/PAM composite (c).
Sustainability 15 07060 g008
Figure 9. Effect of retention time on MB, MO, and Fe(Ⅲ) sorption by SP/PAM composite (a); effect of SP/PAM dose on MB, MO, and Fe(Ⅲ) uptake (b).
Sustainability 15 07060 g009
Figure 10. Effect of initial concentration on MB, MO, and Fe(Ⅲ) sorption by SP/PAM composite (a,b) linear plots of a pseudo-second-order kinetic model for MB, MO, and Fe(Ⅲ) sorption by SP/PAM composite (c,d).
Sustainability 15 07060 g010
Figure 11. Linear plots of intra-particle diffusion kinetic model for MB, MO, and Fe(Ⅲ) sorption by SP/PAM composite (a,b) isotherm linear plots of Langmuir for MB, MO, and Fe(ⅡI) sorption by SP/PAM composite (c,d).
Sustainability 15 07060 g011
Figure 12. (a,b) Isotherm linear plots of Freundlich for MB, MO, and Fe(Ⅲ) sorption by SP/PAM composite.
Sustainability 15 07060 g012
Table 1. The applied experimental parameters and the prevailing conditions during the conduction of the MO, MB, and Fe(Ⅲ) sorption experiments using SP/PAM composite.
ParameterConditionsOther Parameters
pHMO-35681025 mg/L initial concentration for MO and MB and 3 mg/L for Fe(Ⅲ), 25 mg dose, 200 rpm/60 min (speed/contact time), 25 and 50 mL solution for dyes and Fe(Ⅲ), respectively.
MB5678910
Fe(Ⅲ)234567
Dose (mg)MO and
MB
101520253035pH (3.0, 9.0, and 5.0) for MO, MB, and Fe(Ⅲ), respectively, 25 mg/L initial concentration of MO and MB and 3 mg/L for Fe(Ⅲ), 200 rpm/15, 60 and 120 min (speed/contact time) for MO, MB, and Fe(Ⅲ), respectively, 25 and 50 mL solution for dyes and Fe, respectively.
Fe(Ⅲ)203040506070
Contact time (min)MO, MB,
and Fe(Ⅲ)
5153060120240pH (3.0, 9.0, and 5.0) for MO, MB, and Fe(Ⅲ), respectively, 25 mg/L initial concentration of MO and MB and 3.0 mg/L for Fe(Ⅲ), 25 mg dose, 200 rpm as a shaking speed, 25 and 50 mL solution for dyes and Fe(Ⅲ), respectively.
Initial dye concentration
(mg/L)
MO and MB101520253035pH (3.0, 9.0, and 5.0) for MO, MB, and Fe(Ⅲ), respectively, 25 mg dose, 200 rpm/15, 60 and 120 min (speed/contact time) for MO, MB, and Fe(Ⅲ), respectively, 25 and 50 mL solution for dyes and Fe(Ⅲ), respectively.
Table 2. Equilibrium and kinetic equations that express the sorption of MO, MB, and Fe(Ⅲ) by SP/PAM composite.
Equation No.Linear FormParameters
(1) q e = V ( C i C f ) m qe (mg/g): adsorbed amount of MO, MB, and Fe(Ⅲ) at equilibrium.
Ci: the initial MO, MB, and Fe(Ⅲ) concentration in solutions (mg/L).
Cf: the concentration of MO, MB, and Fe(IⅡ) at equilibrium (mg/L).
V: the volume of MO, MB, and Fe(Ⅲ) solutions (mL).
m: the mass of adsorbents (mg).
(2) R % = ( C i C t ) C i × 100 R%: removal efficiency of MO, MB, and Fe(Ⅲ) by addressed adsorbent.
Ci: the initial MO, MB, and Fe(Ⅲ) concentration in solutions (mg/L).
Ct: the concentration of MO, MB, and Fe(Ⅲ) (mg/L) at time t.
(3) q t = V ( C i C t ) m qt (mg/g): adsorbed amount of MO, MB, and Fe(Ⅲ) at time t.
Ci: the initial MO, MB, and Fe(Ⅲ) concentration in solutions (mg/L).
Ct: the concentration of MO, MB, and Fe(Ⅲ) (mg/L) at time t.
V: the volume of MO, MB, and Fe(Ⅲ) solutions (mL).
m: the mass of adsorbents (mg).
Table 3. XRF analyses showing the average composition of the regarded serpentinite chrysotile.
Composition (wt. %)Chrysotile
(Average Ratios)
SiO235.61
MgO37.72
Fe2O36.12
CaO2.65
SO30.14
K2O0.47
Na2O0.22
TiO20.01
P2O50.12
Cl0.05
Cr2O30.12
NiO0.24
Co3O40.013
SrO0.005
V2O50.002
ZnO0.003
L.O.I16.50
Total99.99
Table 4. Textural parameters of fabricated SP/PAM composite obtained from the N2 adsorption/desorption isotherm in comparison with PA6 waste.
ParameterSurface Area
(SBET, m2/g)
Total Pore Volume
(Vt, cm3/g)
Average Pore Diameter
(Dp, nm)
PA waste2875.265.061.93
SP/PAM209.790.381.93
Table 5. DMA data for the precursor PA waste compared to those of the fabricated SP/PAM composite.
Storage Modulus (MPa)Glass Transition Temperature
(Tg, °C)
(Glassy Region)
at 25 °C
(Rubbery Region)
at 100 °C
PA waste100.2435.5870.52
SP/PAM117.2730.8275.13
Table 6. Sorption kinetics and isotherm models for MO, MB, and Fe(ⅡI) sorption by SP/PAM composite.
Kinetic/Isotherm ModelLinear FormParametersRef.
Pseudo-second-order t q t = 1 k 2 q e 2 + t q e qt (mg/g): removed amount of MO, MB, and Fe(ⅡI) at time t.
qe (mg/g): equilibrium adsorption uptake.
k2 (g/mg min): rate constant of the second-order adsorption.
qe(calc.) = 1/slope
k2 = (slope)2/intercept
[66]
Intra-particle diffusion q t = k p   t 1 / 2 + C qt (mg/g): removed amount of MO, MB, and Fe(ⅡI) at time t.
Kp (mg/g min0.5): intra-particle diffusion rate constant.
C (mg/g): intercept of the line which reflects the thickness of the boundary layer.
kp = slope
C = intercept
[67]
Langmuir C e q e = 1 q max   b + C e q max C e (mg/L): equilibrium concentration of the resting MO, MB, and Fe(IⅡ) in the solution.
q e     (mg/g): removed amount of MO, MB, and Fe(IⅡ) at equilibrium.
q max   (mg/g): maximum adsorption capacity.
b (L/mg): Langmuir constant.
qmax = 1/slope
b = slope/intercept
[68]
Freundlich log q e = log K F + 1 n log C e C e (mg/L): equilibrium concentration of the resting MO, MB, and Fe(ⅡI) in the solution.
q e     (mg/g): removed amount of MO, MB, and Fe(IⅡ) at equilibrium.
K F (mg/g)*L/mg)(1/n): MO, MB, and Fe(ⅡI) adsorption capacity.
n: heterogeneity factor.
kF = 10intercept
1/n = slope
[69]
Table 7. The kinetic parameters of the MO, MB, and Fe(Ⅲ) sorption by SP/PAM composite.
AdsorbentContaminantInitial Concentration
(mg/L)
qe(exp.)
(mg/g)
Kinetic Model
Pseudo-Second-OrderIntra-Particle Diffusion
ParametersParameters
SP/PAMk2
(g/mg min)
qe (Calc.)
(mg/g)
R2Kp
(mg/g min0.5)
C
(mg/g)
R2
MO2560.1155.620.999---
MB256.350.0167.240.9990.4522.740.927
Fe(Ⅲ)33.780.0214.20.9980.1771.890.955
Table 8. The isotherm parameters of the MO, MB, and Fe(Ⅲ) sorption by SP/PAM composite.
AdsorbentContaminantInitial Concentration
(mg/L)
Isotherm Model
LangmuirFreundlich
ParametersParameters
SP/PAMqmax
(mg/g)
b
(L/mg)
R21/nKF
(mg/g)*L/mg)(1/n)
R2
MO 10–35 5.970.3350.9580.2552.460.735
MB4.330.5410.7800.2781.780.442
Fe(Ⅲ)1–95.360.2590.9600.6521.090.988
Disclaimer/Publisher’s Note: The statements, opinions and data contained in all publications are solely those of the individual author(s) and contributor(s) and not of MDPI and/or the editor(s). MDPI and/or the editor(s) disclaim responsibility for any injury to people or property resulting from any ideas, methods, instructions or products referred to in the content.

