Abstract
As a susceptible demographic, elderly individuals are more prone to risks during sudden disasters. With the exacerbation of aging, new challenges arise for urban disaster reduction and prevention. To address this, the key is to establish a community-scale resilience assessment framework based on the aging background and to summarize factors that influence the resilience level of communities. This approach is a crucial step towards seeking urban disaster prevention and reduction from the bottom up, and serves as an important link to enhance the capacity of urban disaster reduction. This paper explores community resilience evaluation indicators under the background of aging, builds a community resilience evaluation index system based on the Pressure–State–Response, uses the entropy weight method to weigh the indicators, and carries out a resilience evaluation of 507 communities in the main urban area of Changchun. The empirical results indicate significant spatial differentiation of community resilience in the main urban area of Changchun. Moreover, the regional development is unbalanced, showing a spatial distribution pattern of weakness in the middle and strength in the periphery. The ring road network highlights the difference between the new and old urban areas. The high contribution indexes of community resilience in the main urban area of Changchun were concentrated on disaster relief materials input, community self-rescue ability, and disaster cognition ability. Finally, strategies to improve community resilience are proposed from the perspectives of stress, state, and response, emphasizing community residents’ participation, conducting disaster prevention and reduction training, and improving community response-ability.
1. Introduction
In 2020, the percentage of the global population aged 65 and above reached 9.40%, and it is projected to increase to 16% by 2050 [1]. As the world’s population ages, the vulnerability of the elderly during disasters has become increasingly apparent [2]. Older individuals are more susceptible to disasters due to their poor health, limited mobility, longer response times, and inadequate knowledge of emergency response, regardless of age structure [3,4]. For instance, during the COVID-19 outbreak, the case fatality rate for COVID-19 patients was significantly associated with age [5]. Similarly, when Typhoon Haiyan struck the Philippines in 2013, the elderly accounted for 40% of deaths despite representing only 7% of the population [6]. In China, the aging phenomenon is more pronounced, with the elderly population aged 65 years and above reaching 190 million, accounting for approximately 13.50% of the total population as of 1 November 2020 [7]. From 2021 to 2050, China will enter a phase of accelerated aging, which will not only significantly impact social and economic operations but also make it more challenging for cities to withstand natural disasters, public health events, and emergency management. The community, as the most fundamental organization of the social emergency response system, bears the critical responsibility of coping with various disaster events [8,9]. Therefore, the study of community resilience at the spatial scale of the community has become the forefront of research on urban sustainable development [10]. Community resilience and barrier factor identification are effective tools for risk management. Through risk assessment, high-risk areas can be identified, and the use of barrier factor diagnosis can be differentiated to propose effective methods of risk prevention, control, and management.
Resilience usually refers to the ability to absorb stress, recover, and learn from a disaster [11,12]. Community resilience as a branch of resilience is in line with resilience, highlighting the central position of “people” in community development [13]. Some progress has been made in assessing the level of community resilience to disasters. “The PEOPLE Resilience Framework” and The Localized Disaster-Resilience Index, designed from the perspective of community components [14,15], take into account the contributions of external factors to community resilience. Some scholars have focused on the community itself, emphasizing the ability of families, community capital, and external forces to work together in response to disasters. Cutter’s design of the Disaster Resilience of Place (DROP) framework first conceptualized the dynamic and spatiotemporal contingency of the disaster recovery process and later created the Baseline Resilience Indicators for Communities (BRIC) model with flexible and replicable indicators [16,17]. Arbon has developed the Community Disaster Resilience Scorecard (CDRS) to measure community resilience [18]. Yi and Zhang assessed community resilience during the COVID-19 pandemic through robustness, readiness, resource and social capital attributes, and government response [19]. However, the existing assessments overemphasize the dominant role of external managers and neglect the role of community residents’ participation and cooperation in community disaster prevention. Intra-community strength remains the core mechanism by which community resilience reduces the impact of disasters and enhances recovery [20]. Therefore, in the process of community resilience assessment, more attention should be paid to the role of residents’ participation and collaboration [21].
As the focus of community resilience research has shifted, older populations have also come to the forefront of attention. Some studies, while not directly examining aging, have often taken it into account in their assessments [19,22]. Pendergrast believes that village home-based care organizations improve the resilience of the elderly to disasters [4]; Susan studies the needs of the elderly [23]. From the perspective of the elderly, Szewranski combined flood risk to study the vulnerability of communities [24]. However, these studies mostly focused on the field of medicine and public health, and few focused on the community resilience of vulnerable groups such as the elderly and the disabled. Therefore, the model framework and measurement analysis for the elderly and other vulnerable groups need to be further discussed.
“Pressure-state-response” (PSR) has been proposed and applied to ecological security [25], environmental carrying capacity studies [26], and other fields. In recent years, it has been gradually extended to urban risk assessment and resilience research. In 2021, Ruan established a system of urban resilience indicators with a coupled PSR model and resilience process [27]. Chen evaluated urban infrastructure resilience using the PSR model [28]. Therefore, this paper starts from the connotation of RSR, dismantles the complex process of community resilience, introduces the PSR model, and sorts out the pressure, state, and feedback of communities in the face of risk, which provides support for this paper to build the community resilience evaluation system. This study establishes an assessment of community resilience in the context of aging, with the aim of providing a foundation for relevant departments to scientifically tailor disaster reduction policies and plans. The primary contributions of this paper are as follows:
- The concept of resilience is integrated with the PSR model to build a community resilience assessment framework in the aging context.
- The entropy weight method determines the weights of different community indicators and conducts empirical analysis.
- The resulting analysis of the ring road network is not confined to the traditional administrative region.
- Barriers are identified, and recommendations are provided to enhance community resilience.
2. Materials and Methods
2.1. Research Framework
To investigate the level of community resilience in the context of aging and identify the barriers to community development, this study was conducted in four stages. First, the PSR model is used to clarify the interrelationships among the components of community resilience, and then the impact of aging on community resilience is explained. Secondly, based on the actual situation of the city, an evaluation index system of community resilience in the main urban area under the background of aging was constructed from three dimensions of PSR. Thirdly, the comprehensive development index was utilized to measure the community resilience level of the main urban area of Changchun, and the obstacle degree model was employed to analyze the restrictive effect of each index on the community resilience development of the main urban area. Finally, in conjunction with the research findings, this paper provides policy recommendations for community emergency management and risk control in the main urban area of Changchun. The overall research framework is illustrated in Figure 1.
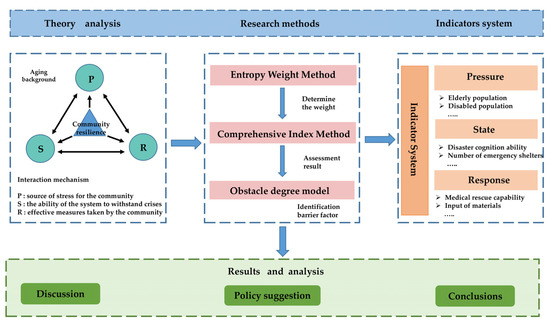
Figure 1.
Research frame diagram. (Note: The content of the omitted symbols are specific indicators, and the detailed indicators are in Table 1).
Community resilience can be viewed as the capacity of a system to adapt and continuously change in response to external risks and pressure shocks [29,30]. This process can be divided into different stages, in which the community experiences external risks and pressure shocks, maintains its own state stability, and responds quickly. Based on this understanding, the resilience process is divided into three stages: before, during, and after [27,31]. The before stage represents the community’s exposure to external risks and stress, the during stage is the community’s use of its own state to maintain stability after a stressful shock, and the after is the community’s reliance on community capital to respond quickly and learn from the disaster; which, are correlated with the three aspects of pressure, state, and response in the PSR model. In the context of the deepening of the aging trend, the change in population structure has a negative impact and brings about significant impacts. Aging increases the pressure of risk on communities, disrupts the state of the community, and reduces the response-ability of the community. When affected by internal aging and external interference, the community first relies on its daily running state. In this stage, the community is in a passive state, mainly relying on its own system elements to absorb the disturbance pressure, and then feedback the pressure information to the next stage. After that, the community enters the response stage, taking the initiative to take emergency measures to reduce the impact of risk. The community response includes internal members’ response, efficacy of the execution, and self-organization ability. The responsiveness of the community helps to restore the state of the community, brings positive feedback to the stressors of the community, and uses the self-learning ability to promote the community to restore the original level and achieve a higher level. The PSR model reflects the cause-and-effect relationship of community resilience from three different and interrelated perspectives, explaining the whole process and stages of resilience. Based on the above research mechanism, this study divides the three stages of community resilience into stress-level resilience, state-level resilience, and response-level resilience (Figure 2).
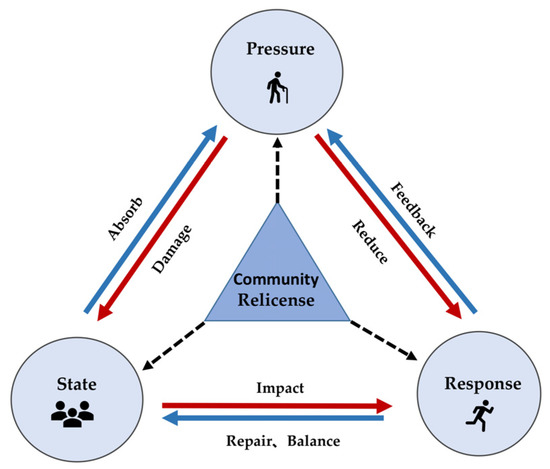
Figure 2.
Mechanisms of community resilience in the context of aging.
2.2. Index System Construction and Weights
The commonly used evaluation index system is generally categorized into three levels: target level, criterion level, and index level [27,28]. The target level index refers to the purpose of conducting the evaluation and serves as a research direction. The target level indicator of this paper is “Community Resilience “. The criterion level index is the evaluation criterion involved in achieving the goal. The criterion level index includes pressure layer resilience grade (P), state layer resilience grade (S), and response layer resilience grade (R). The resilience of each dimension is divided into five grades: high, medium-high, medium, medium-low, and low. Among them:
Pressure-level resilience represents the source of stress faced by communities in the process of disaster occurrence and development from a sociodemographic. Demographic profiles, such as age and gender composition, are crucial factors affecting the resilience of communities. Individuals with specific needs, such as the disabled and the elderly, require more specialized care, assistance during disasters, safe evacuation, and community recovery phases [32]. The index of the proportion of the population over 60 years old, population under 14 years old, and people with disabilities in the community population was utilized to identify lists of people with special needs to measure the pressure on the community (Table 1).

Table 1.
Community resilience evaluation indexes and weight values.
State-level resilience, the current state of the community, characterizes the capacity within the system to resist a crisis and the stability and change in the state of the system under stress. The number of emergency shelters and the number of people they hold will affect the size of the community’s ability to resist disasters [33]. Disaster cognitive ability will directly affect resident judgment and identification of risks and influence system stability [34,35]. The more disaster preparedness training activities are held and the more disaster preparedness training activities are attended, the greater the community’s disaster preparedness awareness and capability will be [36] (Table 1).
Response-level resilience refers to the effective measures and responses taken by communities during the occurrence and development of disasters. The response process includes three aspects: early warning, recovery, and learning to adapt. In terms of early warning, the fluency of disaster information warning methods and the number of informants directly reflect the magnitude of early warning information dissemination capacity [21]. In terms of post-disaster reconstruction, the input of emergency supplies, and the number of community health service stations are important forces that contribute to post-disaster community reconstruction and recovery. In terms of learning adaptation, the number of volunteers reflects the community’s ability to help itself; the active participation of volunteers in community post-disaster reconstruction organizations not only helps the community rebuild, but also allows the community to learn from the disaster and improve its ability to resist disaster risks [35] (Table 1).
2.3. Research Method
2.3.1. Entropy Weight Method
Entropy weight refers to the concept of “entropy” in information theory. The basic idea is to determine the importance of each evaluation index through information entropy. The smaller the information entropy reflected by the evaluation index, the more information it provides, and the greater the weight. When the values of various evaluation indexes are determined, the entropy weight can reflect the information contained in each index of the community and solve the problem of index quantification [37,38,39]. Specific steps are as follows:
Index standardization represents the community index in row and column :
Calculate the proportion of the th index of the th evaluation object:
Calculate the information entropy of the index:
The index entropy weight is:
2.3.2. Composite Index Method
In order to reflect the level of community resilience, the evaluation scores of individual indicators and the comprehensive scores of community resilience were calculated by linear weighting method according to the weights of various indicators [40,41]. The formula is as follows:
The community resilience index of Changchun’s main urban area calculated by this method ranges from 0 to 1, and the closer the value is to 1, the higher the community resilience level is. The natural breakpoint method was used to grade the indexes, which were divided into five grades: High, Medium-high (Med-H), Medium, Medium-low (Med-L), and low.
2.3.3. Obstacle Degree Model
In assessing regional resilience, it is not only necessary to measure it. Another more practical issue is to understand the barriers that affect the development of each region [42,43]. The obstacle degree model was used to diagnose the main factors that restrict the coordinated development of the study area [44], so as to provide a basis for improving community disaster reduction capacity. Obstacle degree analysis is carried out on three indexes, namely factor contribution degree, index deviation degree and obstacle degree, and the formula:
where, is the weight of the ith index layer; is the index deviation degree; is the standardized value of a single index; is the degree of handicap, which refers to the impact of a single index on community resilience.
2.4. Study Area
Changchun is a city situated in the hinterland of the Northeast Plain of China, located in the middle latitudes of the Northern Hemisphere, with a geographical position of 124°18′ E–127°05′ E, 43°05′ N–45°15′ N. As a regional central city in Northeast Asia and an important node city of “One Belt and One Road”, Changchun is adjacent to Songyuan City in the northwest, Jilin City in the east, and Siping City in the south. The jurisdiction covers a total of 11 counties and districts (Figure 3a): Nanguan District (NG), Kuancheng District (KC), Chaoyang District (CY), Erdao District (ED), Lvyuan District (LY), Shuangyang District (SY), Jiutai District (JT), Yushu City (YS), Nangan County (NA), Dehui City (DH), and Gongzhuling City (GZL). Changchun is the capital city of Jilin Province. In 2020, the GDP of Changchun accounted for 53.99% of the province, ranking first in the country, and becoming an important growth pole in the economic development of the province. According to the 7th census data released by Changchun Municipal Bureau of Statistics, in 2020, the city’s permanent resident population was 9,066,906, and the elderly population aged 60 years or above was more than 1.89 million, accounting for 20.85% of the city population. The aging problem is severe.
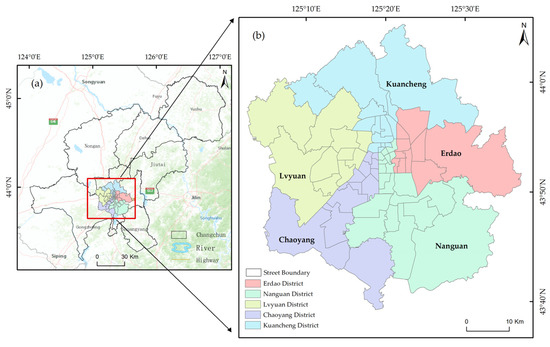
Figure 3.
Location map of Changchun City, China: (a) Changchun city administrative map; (b) the main urban area of Changchun.
The central urban area of Changchun is a core area with frequent commercial activities, a convenient transportation environment, a high level of social and economic development, and a dense population, covering a total area of 609 km2. The research area is determined based on the scope of the central urban area as defined in the Overall Urban Planning of Changchun (2011–2020), which consists of KC District, ED District, NG District, CY District, and LY District (Figure 3b).
2.5. Data Source
Considering the evolutionary trend of urban living space showing circle expansion, the article adds a ring road analysis [45]. The ring road network of Changchun city includes the First Ring Road (1RD), Second Ring Road (2RD), Third Ring Road (3RD), Fourth Ring Road (4RD), and the Ring Road (RE). 1RD is the core area of the city, which is the location of the provincial government and various government agencies; 2RD is mainly distributed within the commercial area of Changchun; 3RD is distributed with the old industrial bases of the city in addition to the commercial distribution; 4RD and be- yond are the new development areas of the city.
The Changchun vector boundary data were obtained from the national geographic information resources directory service system (https://www.webmap.cn/main, accessed on 20 October 2022); the township streets vector boundary data were obtained from the map world (https://www.tianditu.gov.cn/, accessed on 10 November 2022); community data come from Amap (https://ditu.amap.com/, accessed on 18 November 2022), and specific indicators come from the collection. The elderly population data of Changchun City were sourced from the Wind database and the sixth and seventh census data of Changchun City. The center city scale reference related literature was obtained from the overall planning of Changchun City [46], 2011–2020 “(http://www.ccghzg.com/info/1086/1720.htm, accessed on 25 November 2022). The data of the ring road network were obtained from the OpenStreetMap data-sharing platform on 18 October 2022.
After data preprocessing, the data obtained through the OpenStreetMap streets range were combined with the Changchun loop (https://baijiahao.baidu.com/s?id=1641911219263811650&wfr=spider&for=pc, accessed on 27 November 2022) to extract the main road. The ring road network of Changchun was finally obtained, including the 1st ring road (1RD), 2nd ring road (2RD), 3rd ring road (3RD), 4th ring road (4RD), and Ring-around expressway (RE). The city was divided into six regions within the 1RD, 1RD to the 2RD, 2RD to the 3RD, 3RD to the 4RD, 4RD to the RE, and the outer area of the city (Figure 4a).
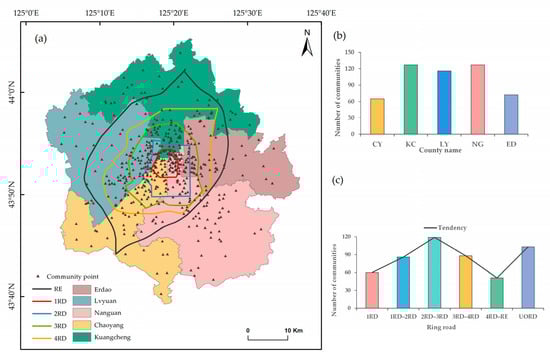
Figure 4.
Distribution and statistics of community settlements and ring roads in Changchun: (a) distribution of community points and road networks in Changchun; (b) number of communities by the administrative district; (c) number of communities by ring road.
There are a total of 507 communities in the main urban area of Changchun, which are distributed in each administrative region, showing the “characteristics of gathering inside and dispersive outside”. According to administrative statistics, communities in Changchun are concentrated in NG District, KC District, and LY District (Figure 4b). According to the statistics of the ring road, it can be found that the number of communities gradually increases from the 1RD to the 3RD, the number of communities from the 3RD to the RE, and then the number of communities outside the city increases (Figure 4c). The population distribution of Changchun is consistent with the distribution characteristics of the number of communities (Figure 3a). The population within the 3RD accounts for more than 50%. In order to facilitate research and highlight problems, we define the old urban area within the 3RD as Changchun, and the new urban area outside the RE as Changchun.
Changchun’s population aging trend is serious; the number of the elderly population increased sharply. In terms of administrative area, in 2010, the highest proportion of the elderly population over 65 years old in Changchun was 8.92% in Chaoyang District, 8.87% in LY District, 7.77% in KC District, and 11.67% in ED District. As of 2020, the top three aging levels in the main urban areas of Changchun are CY District with 20.74% aging, NG District with 15.6% aging, and LY District with 15.35% aging. This indicates that the elderly population in Changchun has nearly doubled in 10 years, and the aging situation is grim. According to the current rate, it is expected that by 2030, the population age of Changchun will show an inverted pyramid shape, and the aging degree will reach its peak, accounting for 30% (Figure 5b).
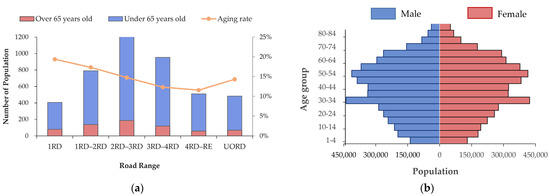
Figure 5.
Population distribution map of Changchun: (a) population loop distribution map of Changchun; (b) population age structure map.
The population aging in Changchun city displays a distinct circular distribution feature, with the aging rate following a “center-edge” distribution pattern (Figure 5a). The old urban areas within the 1RD and 2RD are the locations of numerous government and cultural institutions. Under the planned economic system, numerous unit residential areas have been formed, which have high accessibility and convenient living service facilities, fully satisfying the elderly’s nearby service requirements. This has resulted in the concentration of the elderly population, with a high proportion of the elderly population [47]. The industrial structure distribution in the 3RD and 4RD is dominated by the secondary industry, represented by automobiles, the high-tech industry, represented by software technology, and the living service industry, which attracts a large number of working-age individuals to reside there. Therefore, the proportion of the elderly population decreases. The development zone represented by Jingyue Street in NG District, located on the city’s periphery, boasts a favorable ecological environment, attracting the middle and high-income classes of the city to work and reside there [48], while the elderly choose to spend their leisure time there. Due to the new urban area’s short construction time, its distance from the traditional core areas of the city, and the small population, the absolute number of the elderly population has decreased but the relative proportion has increased.
3. Results
3.1. Overall Results of Community Resilience
Finding out the resilience level of urban communities under the background of aging is a prerequisite and an important means to improve the capacity of community disaster reduction. The purpose of this section is to use the data from this survey to assess community resilience levels and provide city managers with an inventory of community resilience levels.
Community resilience (CR), pressure resilience (PR), state resilience (SR) and response resilience (RR) were calculated according to Formulas (1)–(7). Firstly, it was calculated at the county-district scale that the horizontal differentiation of resilience was obvious. Among the five districts and counties in the main urban area of Changchun, ED District had the lowest community resilience, while NG District had the highest community resilience (Figure 6a). As a whole, the pressure resilience of Changchun is the lowest, indicating that all districts and counties in Changchun are facing greater pressure of aging population and the great obstacle force of vulnerable groups, so it is necessary to pay attention to the problem of aging. The response resilience of ED district was the lowest, indicating that the community self-rescue ability and disaster information acceptance ability of ED District were lower than the average level of the whole city, which was in urgent need of improvement (Figure 6b).
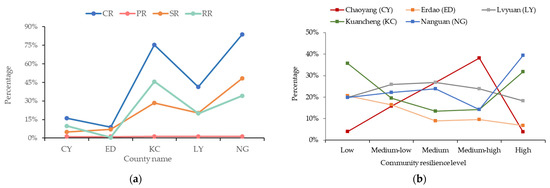
Figure 6.
Community resilience in the main urban area of Changchun city: (a) hierarchical sub-community resilience (left), (b) statistical community resilience by district (right) ((a) illustrates the different levels of resilience in each administrative region, (b) indicates the percentage of community resilience per district and county under different levels).
The natural breakpoint method was utilized to categorize resilience into five grades, namely low, medium, high, and very high. The findings indicate that the distribution of community resilience levels in the primary urban area of Changchun exhibits an imbalanced trend with spatial heterogeneity. Overall, the community resilience levels fluctuate with the distance from the city center, displaying a “low-high-low” distribution pattern. The high- and low-level communities are staggered within the city, and the middle level is attached to the high-level resilience communities. The majority of low-grade communities are situated in the old neighborhoods inside the city, while most high-grade communities are located in the periphery of the city, concentrated in the southern part of the primary urban area. The community resilience of the central urban area is lower than that of the outer urban area, highlighting the gap between the new and old urban areas (Figure 7a).
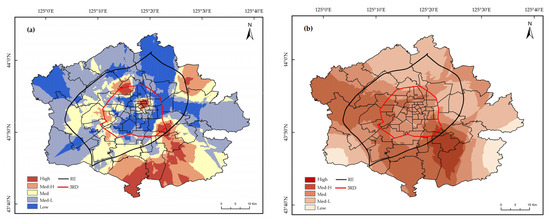
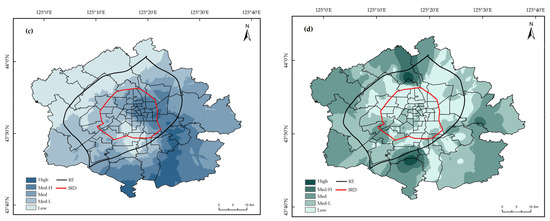
Figure 7.
Community resilience map of the main urban area of Changchun city: (a) Overall resilience, (b) pressure layer resilience, (c) state layer resilience, (d) response layer resilience. (Distribution of community resilience in different layers expressed using kriging interpolation).
Based on the classification of evaluation results, the resilience levels of the 507 communities in the primary urban area of Changchun were mainly distributed in medium, medium-low, and low, accounting for 75.35%, and 126 low-grade communities, accounting for 24.85%, mainly distributed in 45 KC District and 26 ED District. The proportion of high-grade communities is 20.51%, and the number of high-grade communities is the highest in NG District, including 16 streets such as Mingzhu Street, Silicon Valley Street, Shuangde Street, Linhe Street, Yongxing Street, Xinli Town, Yudan Town, and Yongchun Street, accounting for 40.56%. Most of these streets are concentrated in scientific research institutions and colleges and universities. Community residents within the scope are intellectuals and high net-worth income groups, with advantages in community disaster cognition ability, development and learning of disaster prevention training, and information transmission patency (Figure 7b).
For older adults and children, who are at both ends of the age spectrum, there is a negative correlation with community resilience, with older adults and children being less able to help themselves when a disaster occurs. The stress resilience index is used to measure the internal demographic stress resilience faced by communities when disasters strike. The results show that the pressure resilience index of the primary urban area of Changchun is in the middle (31.76%) and high (38.46%) level on the whole (Figure 7b), but its absolute value is far lower than state resilience and response resilience (Figure 6). State resilience describes the ability of communities to resist crises and the state of systems under stress. The results showed that the state resilience grade in the primary urban area of Changchun was generally in the low and medium-low grades, accounting for 34.72% and 27.42% (Figure 7c). Response resilience describes the effective measures communities take when disasters occur and how they respond. The results show that the distribution of response resilience among different grades in Changchun is balanced, and the proportion of each grade is between 19.92% and 20.12% (Figure 7d).
3.2. Community Resilience Loop Analysis
The subdivision statistics of the total number of 507 communities within the study area were conducted across 6 zones: inner ring 1, Ring 1 to Ring 2, Ring 2 to Ring 3, Ring 3 to Ring 4, Ring 4 to Ring highway, and outer ring road. The findings revealed that the middle and low grades, as well as low, middle, and high grades, were commensurate with the population proportion, signifying that these three grades were closely linked with the population distribution. The lower grade of community resilience had a fluctuating trend with regard to the distance from downtown. As the community’s distance from downtown within the 3RD increased, the proportion of low grade also increased, peaking at 30.19% within the third Ring Road. Conversely, the lower-grade community outside the third Ring Road decreased with the distance from downtown, dropping from 30.19% to 9.52%. The low-level community resilience was classified using the 3RD as the reference line, showing differentiated distribution characteristics. The trend of change in the proportion of middle- and low-grade and middle-grade of community resilience was similar to the population distribution characteristics. It exhibited an upward trend within the 3RD, dropping to its nadir (Figure 8a).
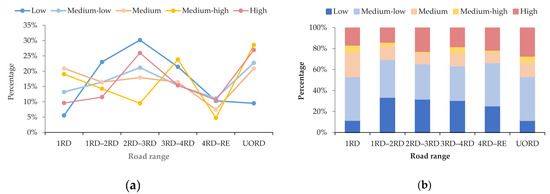
Figure 8.
The proportion of community resilience by the ring road: (a) the proportions of communities with different resilience grades among the 507 communities in Changchun city; (b) the proportions of communities with different resilience grades within each ring road. ((a) Overall distribution of each grade in the ring road; (b) shows the calculation of the percentage of each level within the ring road).
To account for the effect of the number of communities in the region, the proportion within the ring road region was computed. The results of cross-sectional comparisons revealed that the fluctuation range of low-medium and medium-high resilience grade communities in each region was small, while the proportion of low-high resilience grade communities varied significantly. The proportion of low-grade resilient communities reached a nadir in the inner and outer rings of the city, which was nearly twice that of the highest at 33.72%. The proportion of high-grade community resilience continued to increase from the 1RD to the city periphery (Figure 8a).
The proportion of resilient communities gradually increased within the third Ring Road, reached its lowest point in 4RD-RE, and then continued to rise, in accordance with the population distribution characteristics. The distribution characteristics of low, middle-low, and high-grade resilience communities differ from those of the population. Unlike the other four grades, the resilience ratio of low-grade communities did not decrease in 3RD-RE but showed an upward trend, indicating that the 4RD, as the transition zone of the inner and outer rings, still lags behind the new urban area. The high-grade ratio continued to increase from the 1RD to the UORD, highlighting the difference between the old and new urban areas (Figure 8b).
The proportion of medium and high-grade resilience communities in the stress resilience index gradually increased within the third Ring Road, reached its lowest point in 4RD-RE, and then continued to rise, consistent with the population distribution characteristics. The distribution characteristics of low, middle-low, and high-grade resilience communities differ from those of the population. Unlike the other four grades, the resilience ratio of low-grade communities did not decrease in 3RD-RE but showed an upward trend, indicating that the 4RD, as the transition zone of the inner and outer rings, still lags behind the new urban area. The high-grade ratio continued to increase from the 1RD to the UORD, highlighting the difference between the old and new urban areas (Figure 9).
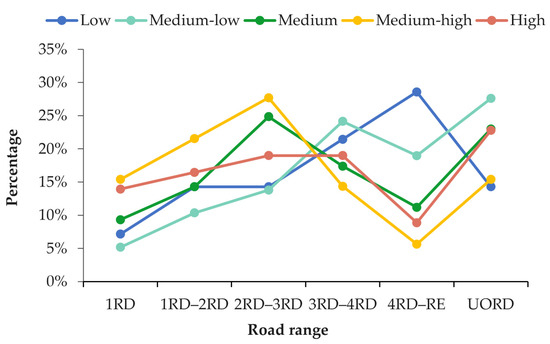
Figure 9.
Ring road distribution: pressure layer community resilience. (Percentage distribution of the five classes of pressure layer communities in different Ring Roads).
The distribution of low, middle, and high levels of community resilience is consistent with the population distribution characteristics, except for the 1RD where the distribution of middle and high-level resilience communities differs from that of the population. Among them, the middle and high-level communities are concentrated in Guilin Street, Hongqi Street, Qinghe Street, Yongchang Street, Minkang Street, Chongqing Street, and other streets that form the core business district of Jilin Province. These areas have undergone disaster prevention and emergency training activities, which were more effective than in other regions. Thus, the proportion of middle- and high-grade communities in the first ring road was higher than that in other ring roads (Figure 10).
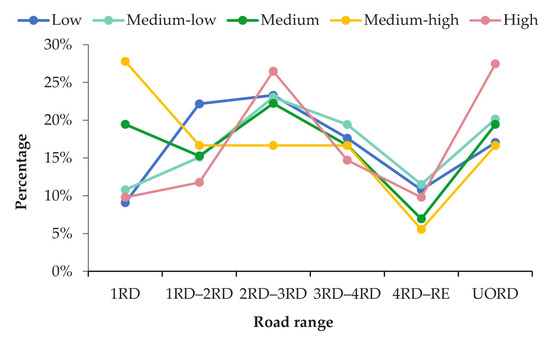
Figure 10.
Ring road distribution: state layer community resilience. (Percentage distribution of the five classes of state layer communities in different Ring Roads).
The distribution of low and middle-grade response resilience is balanced within each ring road layer, while the proportion of high-grade community resilience gradually increases from the 1RD to the UORD, reaching up to 46.53% outside the outer ring. The proportion of middle and high grades in the 1RD and the UORD reaches its maximum values of 21.78% and 25.78%, respectively. Among them, high-grade communities in the first ring road are mainly concentrated in Guilin Street, Hongqi Street, Qinghe Street, Chongqing Street, and other well-known core business districts. These communities have sufficient disaster prevention and emergency reserves. Many colleges and universities have moved to the new urban areas in the outer ring road [48], where the social and cultural environment is superior, and high-income people reside. They still have advantages in terms of material input and community volunteers, thus forming the high-grade resilient communities in the outer ring road that account for the largest proportion and have the advantages of material and personnel (Figure 11).
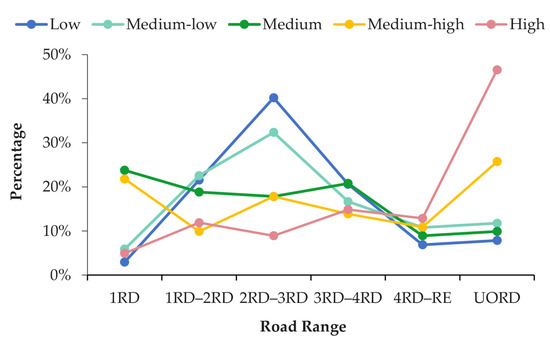
Figure 11.
Ring road distribution: response layer community resilience. (Percentage distribution of the five classes of response layer communities in different Ring Roads).
3.3. Formatting of Mathematical Components
The obstacle degree model is often used to identify the obstacle factors affecting the development of things [42,43]. This study computes the frequency of occurrence of obstacle degree factors based on the degree of obstruction and selects the top five factors. The top five hindrances in 507 communities in the primary urban area of Changchun were subjected to frequency statistics to identify the primary factors impeding community resilience. Among these, material input ranked first 489 times, accounting for 96.45%, which is the primary obstacle affecting the development of community resilience in the primary urban area of Changchun (Figure 12).
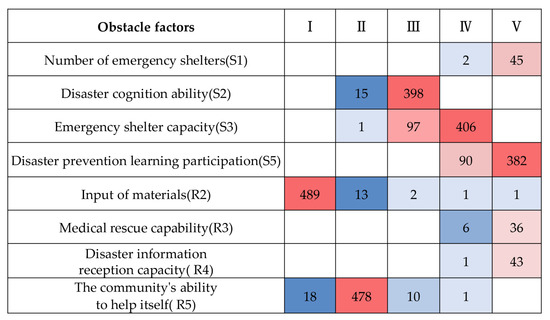
Figure 12.
Identification of community resilience barriers in Changchun (frequency statistics for the top five barrier factors for each community, with red representing high and light blue representing low).
In contrast, emergency shelter capacity, risk identification ability, emergency shelter capacity, and disaster prevention learning participation occurred 406, 398, and 382 times (Figure 12), respectively. In terms of the number of administrative regions, NG District, CY District, KC District, and LY District exhibited the highest degree of tolerance for obstacles related to community volunteers, material input, and emergency shelter, while ED District had the highest degree of obstacles related to material input, community volunteers, and participation in disaster prevention learning. ED District had a lower degree of obstacles related to emergency shelter capacity than the other four districts, indicating that the region places great importance on the construction of emergency shelters (Figure 13).
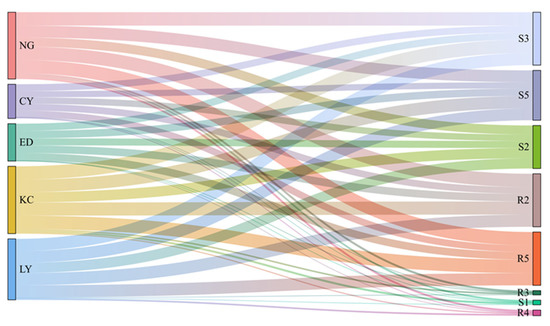
Figure 13.
Community resilience obstacle degree identification in the main urban area of Changchun (taking the district as the unit, the obstacle factors were ranked statistically; the thicker the line, the higher the degree of influence).
4. Discussion and Suggestions
Community resilience assessment and barrier factor diagnosis play an important role in emergency management and risk prevention in cities. Previous studies have conducted integrated resilience assessments from ecological, economic, organizational, and capital resilience perspectives, while less attention has been paid to the aging phenomenon within communities. In Section 3, the article discusses the spatial distribution of community pressure-level resilience, state-level resilience, response-level resilience, and integrated community resilience, as well as the identification of barrier factors. The findings revealed that the absolute value of stress-level resilience was the lowest (Figure 6a), and in terms of the distribution of overall community resilience levels in Changchun, communities with medium, medium-low, and low resilience are the most widely distributed, accounting for 75.35% (Figure 6b). Changchun has the lowest stress-level resilience level, indicating that the demographic shift brought about by aging has a negative impact on the resilience level of Changchun, and the government and related departments need to pay attention to the aging issue. In the barrier degree analysis, material input is the primary barrier degree factor, followed by volunteer indicators, risk identification capability, emergency shelter capacity, and disaster prevention learning participation (Figure 12). It shows that material input is an effective way to improve community resilience at this stage, while volunteer participation, emergency shelter capacity, risk identification ability, and disaster prevention learning participation should not be neglected as well.
Changchun should accord top priority to strengthening community emergency material reserves and establishing exclusive material warehouses in the community to store emergency kits, fire tools, warning lights, and other tools. Community residents should be encouraged to build household reserves and enhance their capacity to cope with disasters. The community volunteer index ranked second with 478 occurrences. As a secondary obstacle, it indicates that most communities in the primary urban area of Changchun not only lack “materials” but also lack a “sense of ownership”. To cultivate the internal strength of communities, community residents, as the main body of community emergency management, should actively participate in volunteer activities and leverage their own talents and technical advantages to participate in community emergency management.
Systematic intervention strategies are formulated for resilient communities from three aspects: stress resilience, state resilience, and response resilience, so as to reduce the harm of sudden disasters to urban systems and improve the self-adjustment ability of communities at the grassroots level. The key points and optimization strategies of the main urban area of Changchun are as follows:
In terms of the emergency plan and emergency response mechanism, communities should establish a perfect disaster emergency plan, including an emergency response process, emergency materials reserve and distribution, emergency rescue team formation and training, etc. At the same time, communities should strengthen communication and coordination with relevant departments and form a joint prevention and control emergency response mechanism to ensure timely and effective response and disposal when disasters occur.
To improve the emergency awareness and response capabilities of community residents, community organizations should disseminate disaster risk knowledge to residents. Communities can conduct emergency drills and organize emergency rescue training to improve residents’ emergency skills and response capabilities. Form a communication mechanism between community organizations and residents and organize community activities as a way to strengthen the interaction and cooperation between community organizations and residents to form a joint force to deal with disasters.
Improve community infrastructure. First, the construction of community health service stations, clinics, and other basic medical security facilities can improve the comprehensive level of health services for community residents. Second, rebuild and expand community emergency supplies reserves. At present, the reserves are usually prepared by the government, and most of the reserves are for flood control and other natural disasters. For public health materials, the reserves are insufficient, and communities should enrich the types of emergency materials in the post-epidemic era.
5. Conclusions
Changchun, as a representative city in the northeast region, is in the accelerated aging area of China, so studying its community resilience in the context of aging has special and representative characteristics. This study aims to establish a community resilience assessment system in the context of aging in order to evaluate community resilience and identify major barriers. From the above study, we conclude that (1) the spatial characteristics of community resilience in the main urban area of Changchun are clearly distributed, showing a significantly higher spatial characteristic in the southeast than in the north. (2) Using the analysis of the ring road network, we found that the low grade increases in the third ring with an increasing pattern, and the difference in community resilience between the old and new urban areas is significant. (3) Although the barrier factors vary among communities, material input is the primary barrier degree factor.
This article assesses 507 communities in the main urban area of Changchun City with the value of guiding practical applications and helping decision-makers to specify differentiated enhancement strategies for each community in a scientific manner. The assessment system is constructed to provide a reference to other developing countries in Northeast Asia that are also in aging areas. In addition, in the subsequent resilience assessment, the evolutionary trend of urban residential space showing circle expansion can be considered, and loop analysis can be added to help identify the distribution characteristics of various community resilience levels and provide a risk map for urban emergency management. However, the study is limited by the difficulties in obtaining community information, such as the lack of data on annual household income, the number of medical visits for the elderly, and other relevant indicators in the past years which cannot further understand the spatial and temporal evolution of community resilience in Changchun, and its results possess certain limitations.
Communities are in the process of continuous development and change, and in the context of the deepening aging crisis in the future and the gradually obvious residential differentiation in urban communities, it is important to update the research indicators, adjust the research methods, and develop a dynamic resilience map. In turn, we can propose targeted resilience measures, formulate forward-looking and differentiated policies, improve urban risk prevention and control mechanisms, and build sustainable cities.
Author Contributions
Conceptualization, formal analysis, and methodology, W.Z. and J.W.; investigation and resources, J.Z., S.C., S.T., G.W. and Y.X.; writing—original draft preparation, W.Z.; writing—review and editing, J.W. All authors have read and agreed to the published version of the manuscript.
Funding
The authors gratefully acknowledge the support provided by the Natural Disaster Risk Census Project in Jilin province (JLSZC202002826).
Institutional Review Board Statement
Not applicable.
Informed Consent Statement
Informed consent was obtained from all subjects involved in the study.
Data Availability Statement
Not applicable.
Conflicts of Interest
The authors declare no conflict of interest.
References
- World Population Prospects. 2022. Available online: https://www.un.org/development/desa/pd/ (accessed on 13 July 2022).
- Salvati, P.; Petrucci, O.; Rossi, M.; Bianchi, C.; Pasqua, A.A.; Guzzetti, F. Gender, age and circumstances analysis of flood and landslide fatalities in Italy. Sci. Total Environ. 2018, 610, 867–879. [Google Scholar] [CrossRef] [PubMed]
- Cohen, D.; Krajewski, A. Interdisciplinary Geriatric Resilience Interventions an Urgent Research Priority. Top. Geriatr. Rehabil. 2014, 30, 199–206. [Google Scholar] [CrossRef]
- Pendergrast, C.; Belza, B.; Bostrom, A.; Errett, N. Examining the role of ageing-in-place organisations in building older adults’ disaster resilience. Ageing Soc. 2021, 41, 2888–2913. [Google Scholar] [CrossRef]
- Esmaeili, E.D.; Fakhari, A.; Naghili, B.; Khodamoradi, F.; Azizi, H. Case fatality and mortality rates, socio-demographic profile, and clinical features of COVID-19 in the elderly population: A population-based registry study in Iran. J. Med. Virol. 2022, 94, 2126–2132. [Google Scholar] [CrossRef]
- Kwan, C.; Walsh, C.A. Seniors’ disaster resilience: A scoping review of the literature. Int. J. Disaster Risk Reduct. 2017, 25, 259–273. [Google Scholar] [CrossRef]
- Jiang, Q.B.; Feng, Q.S. Aging and health in China. Front. Public Health 2022, 10, 998769. [Google Scholar] [CrossRef]
- Aldrich, D.P.; Meyer, M.A. Social Capital and Community Resilience. Am. Behav. Sci. 2015, 59, 254–269. [Google Scholar] [CrossRef]
- Jovita, H.D.; Nashir, H.; Mutiarin, D.; Moner, Y.; Nurmandi, A. Social capital and disasters: How does social capital shape post-disaster conditions in the Philippines? J. Hum. Behav. Soc. Environ. 2019, 29, 519–534. [Google Scholar] [CrossRef]
- Cutter, S.L.; Burton, C.G.; Emrich, C.T. Disaster Resilience Indicators for Benchmarking Baseline Conditions. J. Homel. Secur. Emerg. Manag. 2010, 7. [Google Scholar] [CrossRef]
- Walker, B.; Hollin, C.S.; Carpenter, S.R.; Kinzig, A. Resilience, adaptability and transformability in social-ecological systems. Ecol. Soc. 2004, 9. [Google Scholar] [CrossRef]
- Alexander, D.E. Resilience and disaster risk reduction: An etymological journey. Nat. Hazards Earth Syst. Sci. 2013, 13, 2707–2716. [Google Scholar] [CrossRef]
- Pfefferbaum, B.; Van Horn, R.L.; Pfefferbaum, R.L. A Conceptual Framework to Enhance Community Resilience Using Social Capital. Clin. Soc. Work J. 2017, 45, 102–110. [Google Scholar] [CrossRef]
- Orencio, P.M.; Fujii, M. A localized disaster-resilience index to assess coastal communities based on an analytic hierarchy process (AHP). Int. J. Disaster Risk Reduct. 2013, 3, 62–75. [Google Scholar] [CrossRef]
- Peng, C.; Guo, Z.; Peng, Z. Research Progress on the Theory and Practice of Foreign Community Resilience. Urban Plan. Int. 2017, 32, 60–66. [Google Scholar] [CrossRef]
- Cutter, S.L.; Barnes, L.; Berry, M.; Burton, C.; Evans, E.; Tate, E.; Webb, J. A place-based model for understanding community resilience to natural disasters. Glob. Environ. Change-Hum. Policy Dimens. 2008, 18, 598–606. [Google Scholar] [CrossRef]
- Cutter, S.L.; Ash, K.D.; Emrich, C.T. The geographies of community disaster resilience. Glob. Environ. Change-Hum. Policy Dimens. 2014, 29, 65–77. [Google Scholar] [CrossRef]
- Arbon, P. Developing a model and tool to measure community disaster resilience. Aust. J. Emerg. Manag. 2014, 29, 12–16. [Google Scholar]
- Yi, F.X.; Woo, J.J.; Zhang, Q. Community Resilience and COVID-19: A Fuzzy-Set Qualitative Comparative Analysis of Resilience Attributes in 16 Countries. Int. J. Environ. Res. Public Health 2023, 20, 474. [Google Scholar] [CrossRef] [PubMed]
- Mayer, B. A Review of the Literature on Community Resilience and Disaster Recovery. Curr. Environ. Health Rep. 2019, 6, 167–173. [Google Scholar] [CrossRef]
- Islam, R.; Walkerden, G. How bonding and bridging networks contribute to disaster resilience and recovery on the Bangladeshi coast. Int. J. Disaster Risk Reduct. 2014, 10, 281–291. [Google Scholar] [CrossRef]
- Cutter, S.L. The landscape of disaster resilience indicators in the USA. Nat. Hazards 2016, 80, 741–758. [Google Scholar] [CrossRef]
- Smith, S.M.; Tremethick, M.J.; Johnson, P.; Gorski, J. Disaster planning and response: Considering the needs of the frail elderly. Int. J. Emerg. Manag. 2009, 6, 1–13. [Google Scholar] [CrossRef]
- Szewranski, S.; Swiader, M.; Kazak, J.K.; Tokarczyk-Dorociak, K.; van Hoof, J. Socio-Environmental Vulnerability Mapping for Environmental and Flood Resilience Assessment: The Case of Ageing and Poverty in the City of Wrocaw, Poland. Integr. Environ. Assess. Manag. 2018, 14, 592–597. [Google Scholar] [CrossRef]
- Lai, S.; Sha, J.; Eladawy, A.; Li, X.; Wang, J.; Kurbanov, E.; Lina, Z.; Wu, L.; Han, R.; Su, Y.-C. Evaluation of ecological security and ecological maintenance based on pressure-state-response (PSR) model, case study: Fuzhou Human and Ecological Risk Assessment: An Analysis of the Impacts of the Human and Ecological Risk Assessment on the Environment. Hum. Ecol. Risk Assess. Int. J. 2022, 28, 734–761. [Google Scholar] [CrossRef]
- Das, S.; Pradhan, B.; Shit, P.; Alamri, A. Assessment of Wetland Ecosystem Health Using the Pressure- State-Response (PSR) Model: A Case Study of Mursidabad District of West Bengal (India). Sustainability 2020, 12, 5932. [Google Scholar] [CrossRef]
- Ruan, J.E.; Chen, Y.B.; Yang, Z.W. Assessment of temporal and spatial progress of urban resilience in Guangzhou under rainstorm scenarios. Int. J. Disaster Risk Reduct. 2021, 66, 102578. [Google Scholar] [CrossRef]
- Chen, M.; Jiang, Y.; Wang, E.D.; Wang, Y.; Zhang, J. Measuring Urban Infrastructure Resilience via Pressure-State-Response Framework in Four Chinese Municipalities. Appl. Sci. 2022, 12, 2819. [Google Scholar] [CrossRef]
- Norris, F.H.; Stevens, S.P.; Pfefferbaum, B.; Wyche, K.F.; Pfefferbaum, R.L. Community resilience as a metaphor, theory, set of capacities, and strategy for disaster readiness. Am. J. Community Psychol. 2008, 41, 127–150. [Google Scholar] [CrossRef] [PubMed]
- Castleden, M.; McKee, M.; Murray, V.; Leonardi, G. Resilience thinking in health protection. J. Public Health 2011, 33, 369–377. [Google Scholar] [CrossRef] [PubMed]
- Ji, J.; Chen, J.F. Urban flood resilience assessment using RAGA-PP and KL-TOPSIS model based on PSR framework: A case study of Jiangsu province, China. Water Sci. Technol. 2022, 86, 3264–3280. [Google Scholar] [CrossRef]
- Frazier, T.G.; Thompson, C.M.; Dezzani, R.J.; Butsick, D. Spatial and temporal quantification of resilience at the community scale. Appl. Geogr. 2013, 42, 95–107. [Google Scholar] [CrossRef]
- Chen, W.; Zhai, G.; Fan, C.; Jin, W.; Xie, Y. A planning framework based on system theory and GIS for urban emergency shelter system: A case of Guangzhou, China. Hum. Ecol. Risk Assess. Int. J. 2016, 23, 441–456. [Google Scholar] [CrossRef]
- Armijos, M.T.; Phillips, J.; Wilkinson, E.; Barclay, J.; Hicks, A.; Palacios, P.; Mothes, P.; Stone, J. Adapting to changes in volcanic behaviour: Formal and informal interactions for enhanced risk management at Tungurahua Volcano, Ecuador. Glob. Environ. Change-Hum. Policy Dimens. 2017, 45, 217–226. [Google Scholar] [CrossRef]
- Yoon, D.K.; Kang, J.E.; Brody, S.D. A measurement of community disaster resilience in Korea. J. Environ. Plan. Manag. 2016, 59, 436–460. [Google Scholar] [CrossRef]
- Pfefferbaum, R.L.; Pfefferbaum, B.; Van Horn, R.L.; Klomp, R.W.; Norris, F.H.; Reissman, D.B. The Communities Advancing Resilience Toolkit (CART): An Intervention to Build Community Resilience to Disasters. J. Public Health Manag. Pract. 2013, 19, 250–258. [Google Scholar] [CrossRef]
- Deng, G.; Si, J.; Zhao, X.; Han, Q.; Chen, H. Evaluation of Community Disaster Resilience (CDR): Taking Luoyang Community as an Example. Math. Probl. Eng. 2022, 2022, 5177379. [Google Scholar] [CrossRef]
- Yang, M.; Jiao, M.; Zhang, J. Spatio-Temporal Analysis and Influencing Factors of Rural Resilience from the Perspective of Sustainable Rural Development. Int. J. Environ. Res. Public Health 2022, 19, 12294. [Google Scholar] [CrossRef]
- Wang, Y. Comprehensive Evaluation of Community Public-Health-Safety Resilience Based on Entropy-TOPSIS Method. MEDS Public Health Prev. Med. 2022, 2. [Google Scholar]
- Peng, K.; He, X.; Xu, C. Coupling Coordination Relationship and Dynamic Response between Urbanization and Urban Resilience: Case of Yangtze River Delta. Sustainability 2023, 15, 2702. [Google Scholar] [CrossRef]
- Zhou, R.; Yu, Y.; Wu, B.; Luo, X. Quantitative evaluation of urban resilience in underdeveloped regions: A study of cities along the Sichuan-Tibet Railway in China. Front. Environ. Sci. 2023, 11, 148. [Google Scholar] [CrossRef]
- Chen, N.; Guo, H.; Xiang, H. Evaluation of urban resilience level and analysis of obstacle factors: A case study of Hunan Province, China. Front. Earth Sci. 2023, 10, 1033441. [Google Scholar] [CrossRef]
- Zhao, R.; Fang, C.; Liu, J.; Zhang, L. The evaluation and obstacle analysis of urban resilience from the multidimensional perspective in Chinese cities. Sustain. Cities Soc. 2022, 86, 104160. [Google Scholar] [CrossRef]
- Chen, Y.; Liu, S.; Ma, W.; Zhou, Q. Assessment of the Carrying Capacity and Suitability of Spatial Resources and the Environment and Diagnosis of Obstacle Factors in the Yellow River Basin. Int. J. Environ. Res. Public Health 2023, 20, 3496. [Google Scholar] [CrossRef]
- Zhao, O.; Wang, X.; Wang, S. Study on spatial differentiation of housing price distribution and its influencing factors in Chang Chun. Hum. Geogr. 2019, 34, 97–105+125. [Google Scholar]
- Shen, Q.; Li, C.; Liu, Q. Urban Spatial Structure by Service Facilities Distribution: A Case in Main Districts of Changchun. Econ. Geogr. 2017, 37, 129–135. [Google Scholar]
- Tian, J.L.Y.; Wang, B.; Wang, S. The study for the distribution of aged population and the coordination with pension service facilities: A case study of Changchun City. J. Northeast Norm. Univ. (Nat. Sci. Ed.) 2018, 50, 124–132. [Google Scholar]
- Zheng, Y.W.R.; Gan, J. Research on Differential Characteristics and Dynamic Mechanism of Changchun Living Space. Resour. Dev. Mark. 2016, 32, 327–332. [Google Scholar]


Disclaimer/Publisher’s Note: The statements, opinions and data contained in all publications are solely those of the individual author(s) and contributor(s) and not of MDPI and/or the editor(s). MDPI and/or the editor(s) disclaim responsibility for any injury to people or property resulting from any ideas, methods, instructions or products referred to in the content. |
© 2023 by the authors. Licensee MDPI, Basel, Switzerland. This article is an open access article distributed under the terms and conditions of the Creative Commons Attribution (CC BY) license (https://creativecommons.org/licenses/by/4.0/).