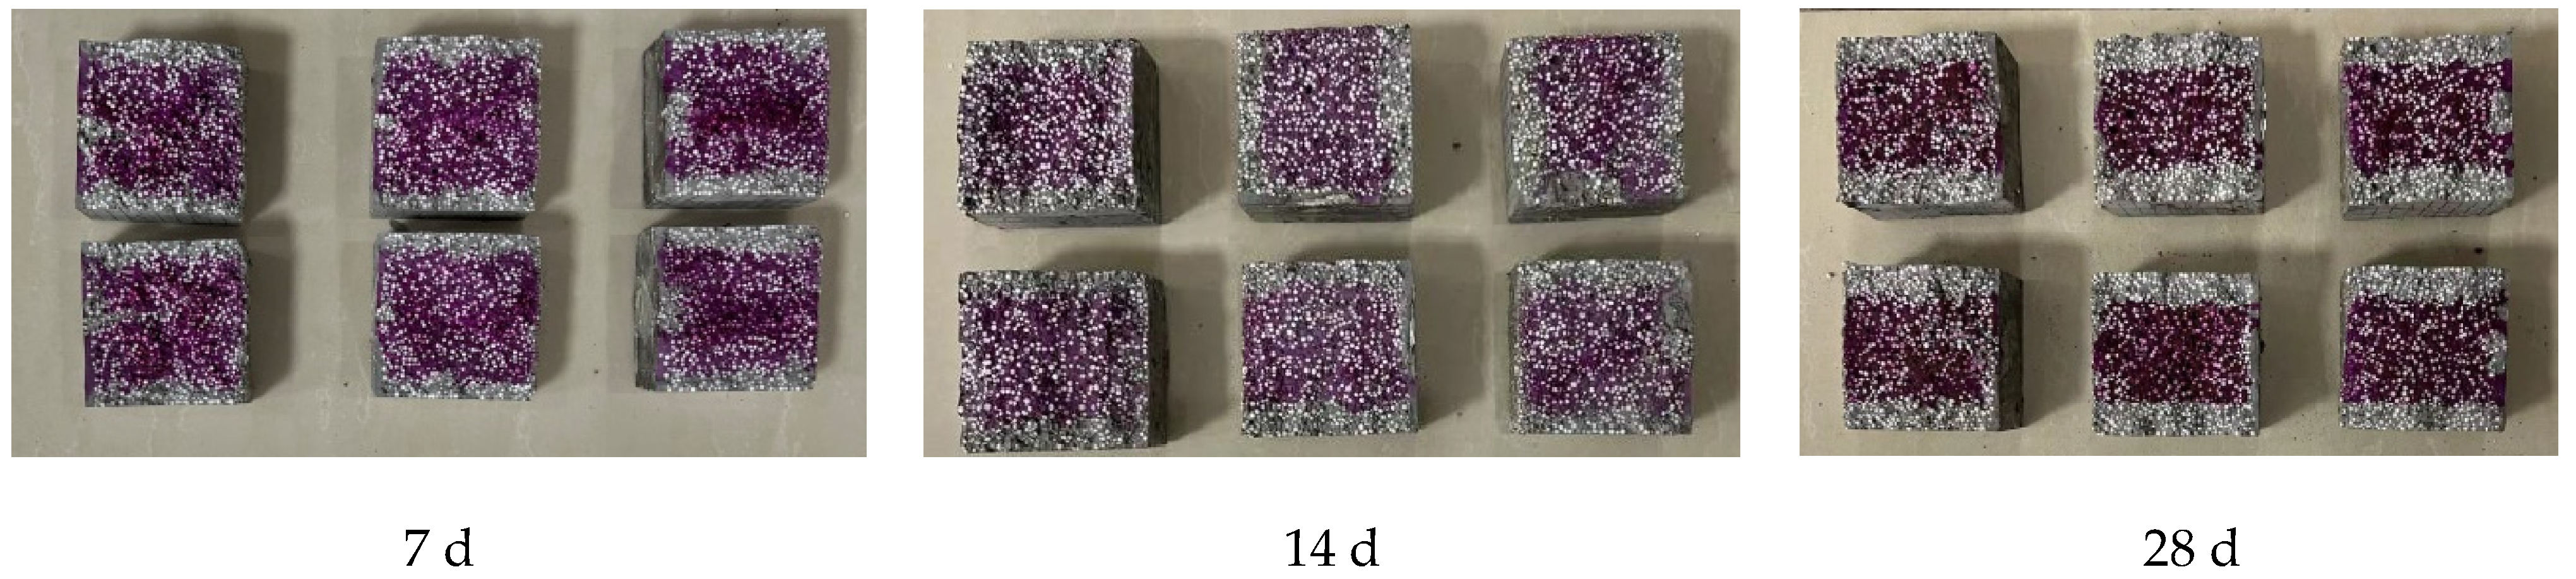
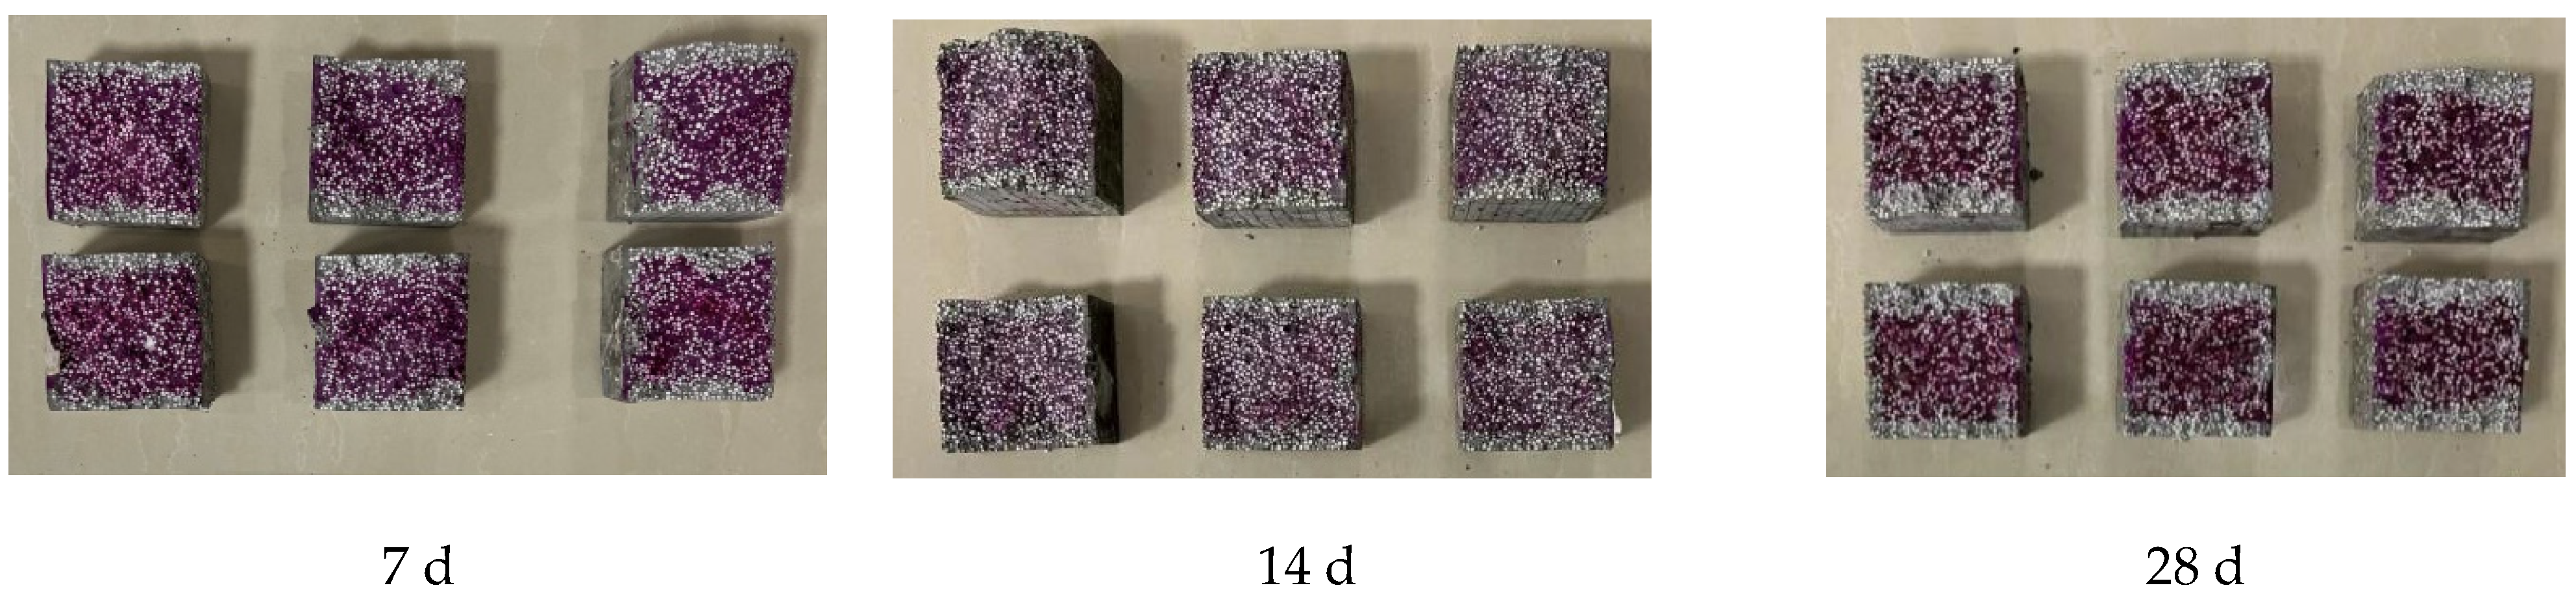
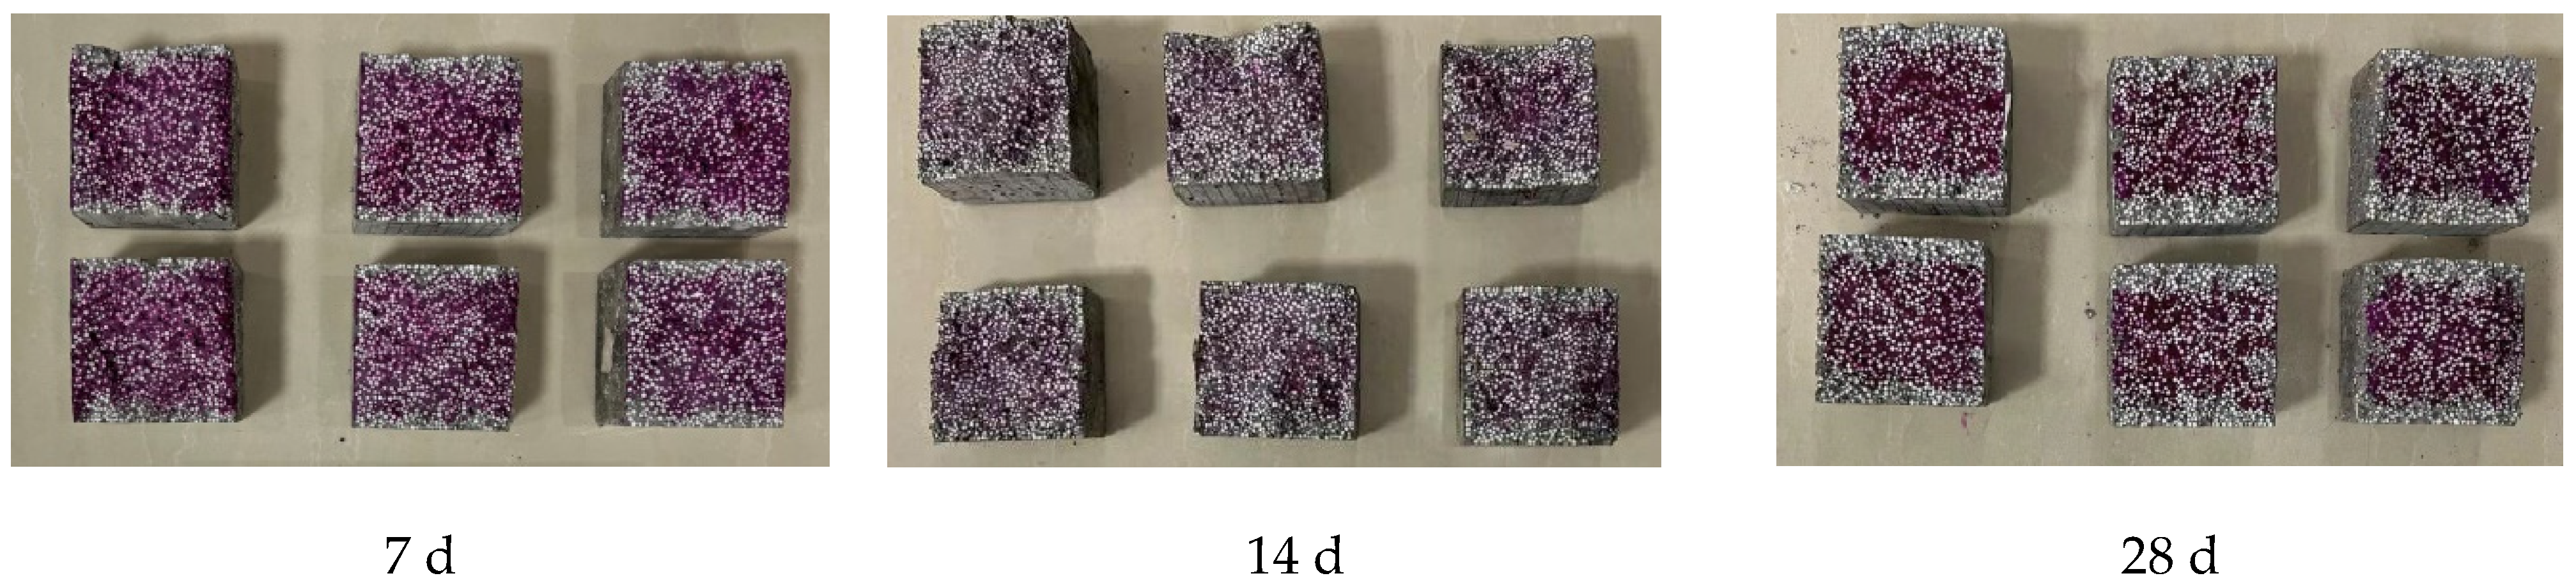
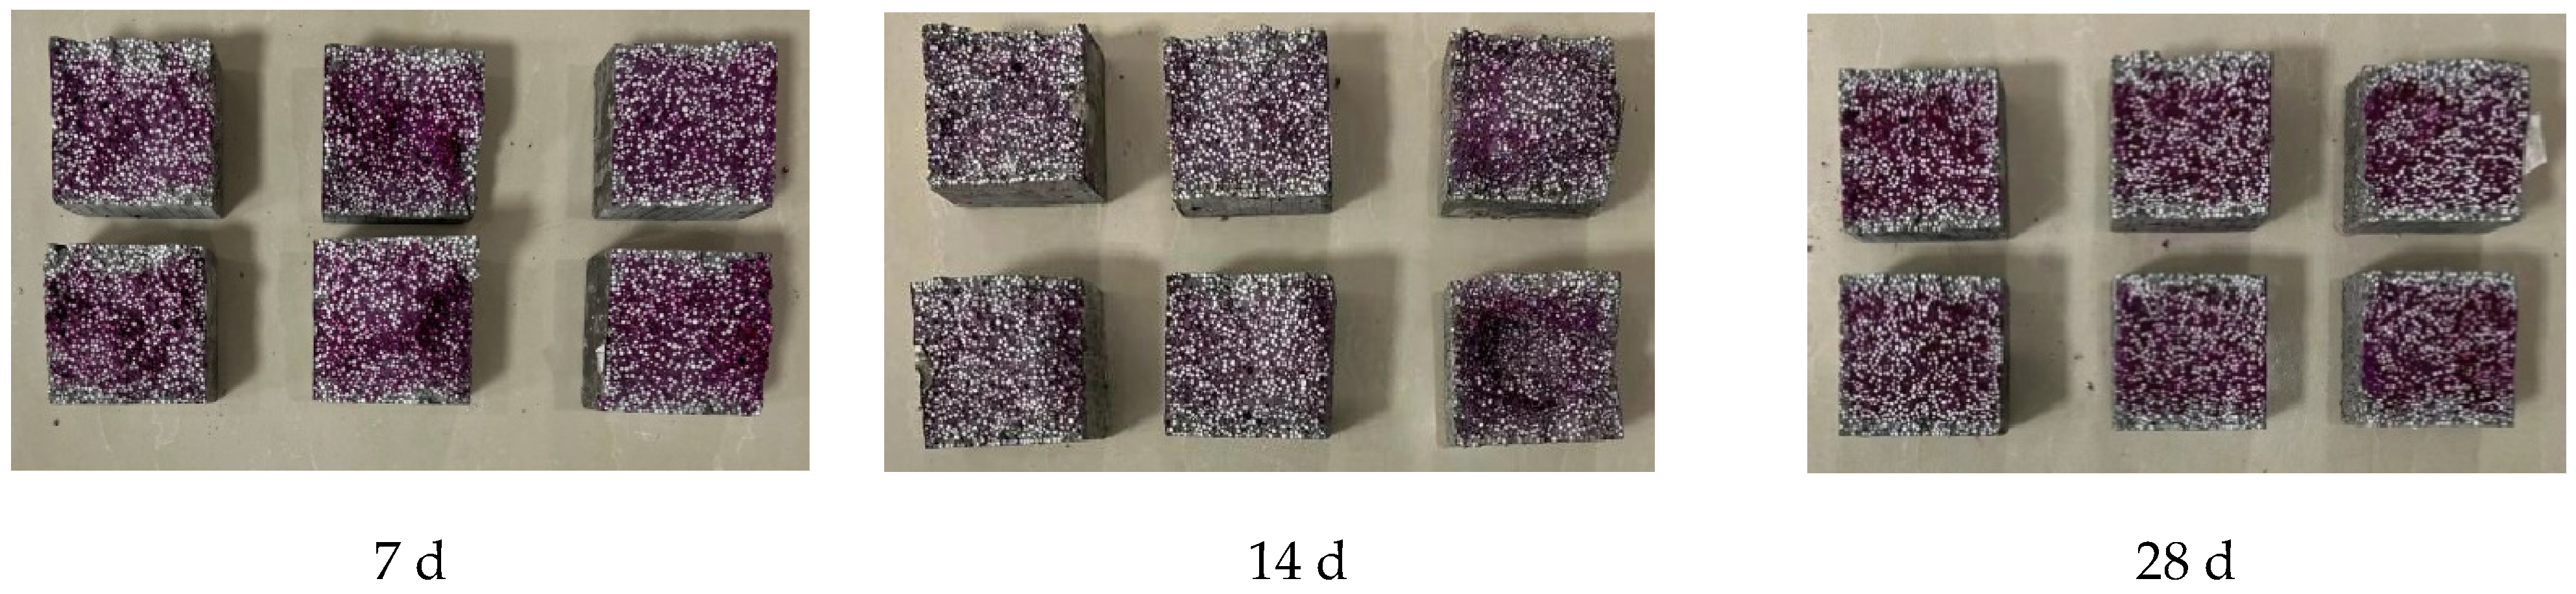
3.1. Effect of Microbead Dosage on the Carbonization Depth
The carbonation phenomenon of EPS concrete in the five groups for 7 days, 14 days, and 28 days is depicted in
Figure 4,
Figure 5,
Figure 6,
Figure 7 and
Figure 8, while the carbonation depth is presented in
Table 3 and
Figure 9. The carbonation test was conducted for 7 days, during which the carbonation depth of the specimens increased rapidly. With the progression of carbonation age, the carbonation depth of the specimens grew gradually. Upon reaching 28 days, the maximum carbonation depth of the specimens was found to be 22.42 mm, which was significantly greater than that of ordinary concrete [
20]. The relationship between the carbonation depth and carbonation age of EPS concrete with different microbead dosages is depicted in
Figure 9.
As shown in
Figure 9, the carbonation depth of five groups of EPS concrete specimens increased with the increase in carbonation age. The growth rate was faster during the early stages of carbonation, but the carbonation rate exhibited a slowing trend after 7 days. The reduced carbonation rate after 7 days is attributed to the coverage of CH by CaCO
3 formed in the carbonized zone and the blocking of microscopic pores in the cement mortar. Consequently, the transport rate of ions (Ca
2+, OH
−, and CO
32−) in the solution is restricted, leading to a decrease in the amount of dissolved CH. After a short and rapid reaction, the carbonation rate of CH was significantly reduced, resulting in a significant decrease in the carbonation rate of each specimen during the later stages of carbonation [
27,
28,
29]. The specimens without microbead doping maintained the maximum carbonation depth throughout the aging process. Compared to Group A1, the carbonation depth of the specimens in Groups A2–A5 decreased by 22.73%, 40.91%, 40.91%, and 54.55%, respectively, with the increasing microbead dosage.
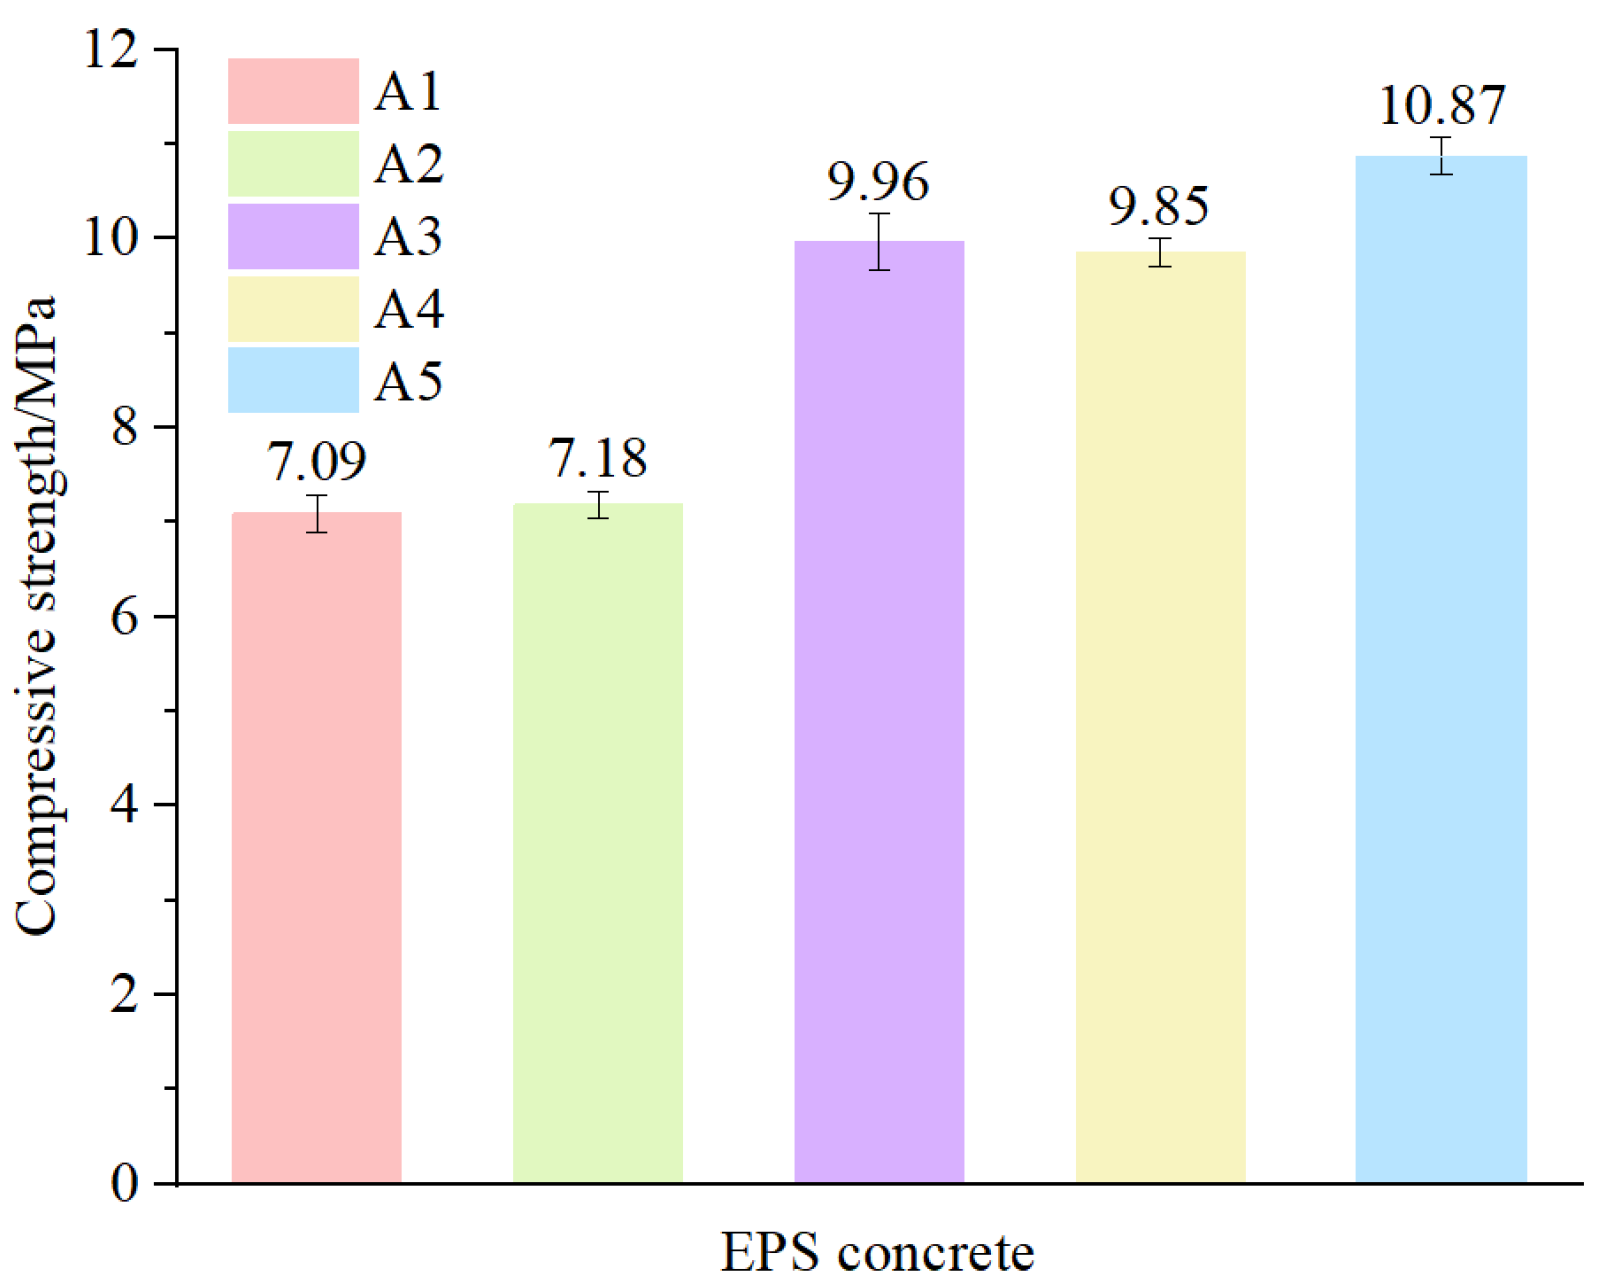
3.2. Effect of Carbonization on the Compressive Strength
The 28-day curing strength of the five groups of specimens is depicted in
Figure 10. It can be observed that the concrete strength increased with the increasing microbead dosage. This is due to the small particle size of the microbeads, which block harmful pores in the concrete when added, resulting in a denser concrete and increased strength [
15,
30].
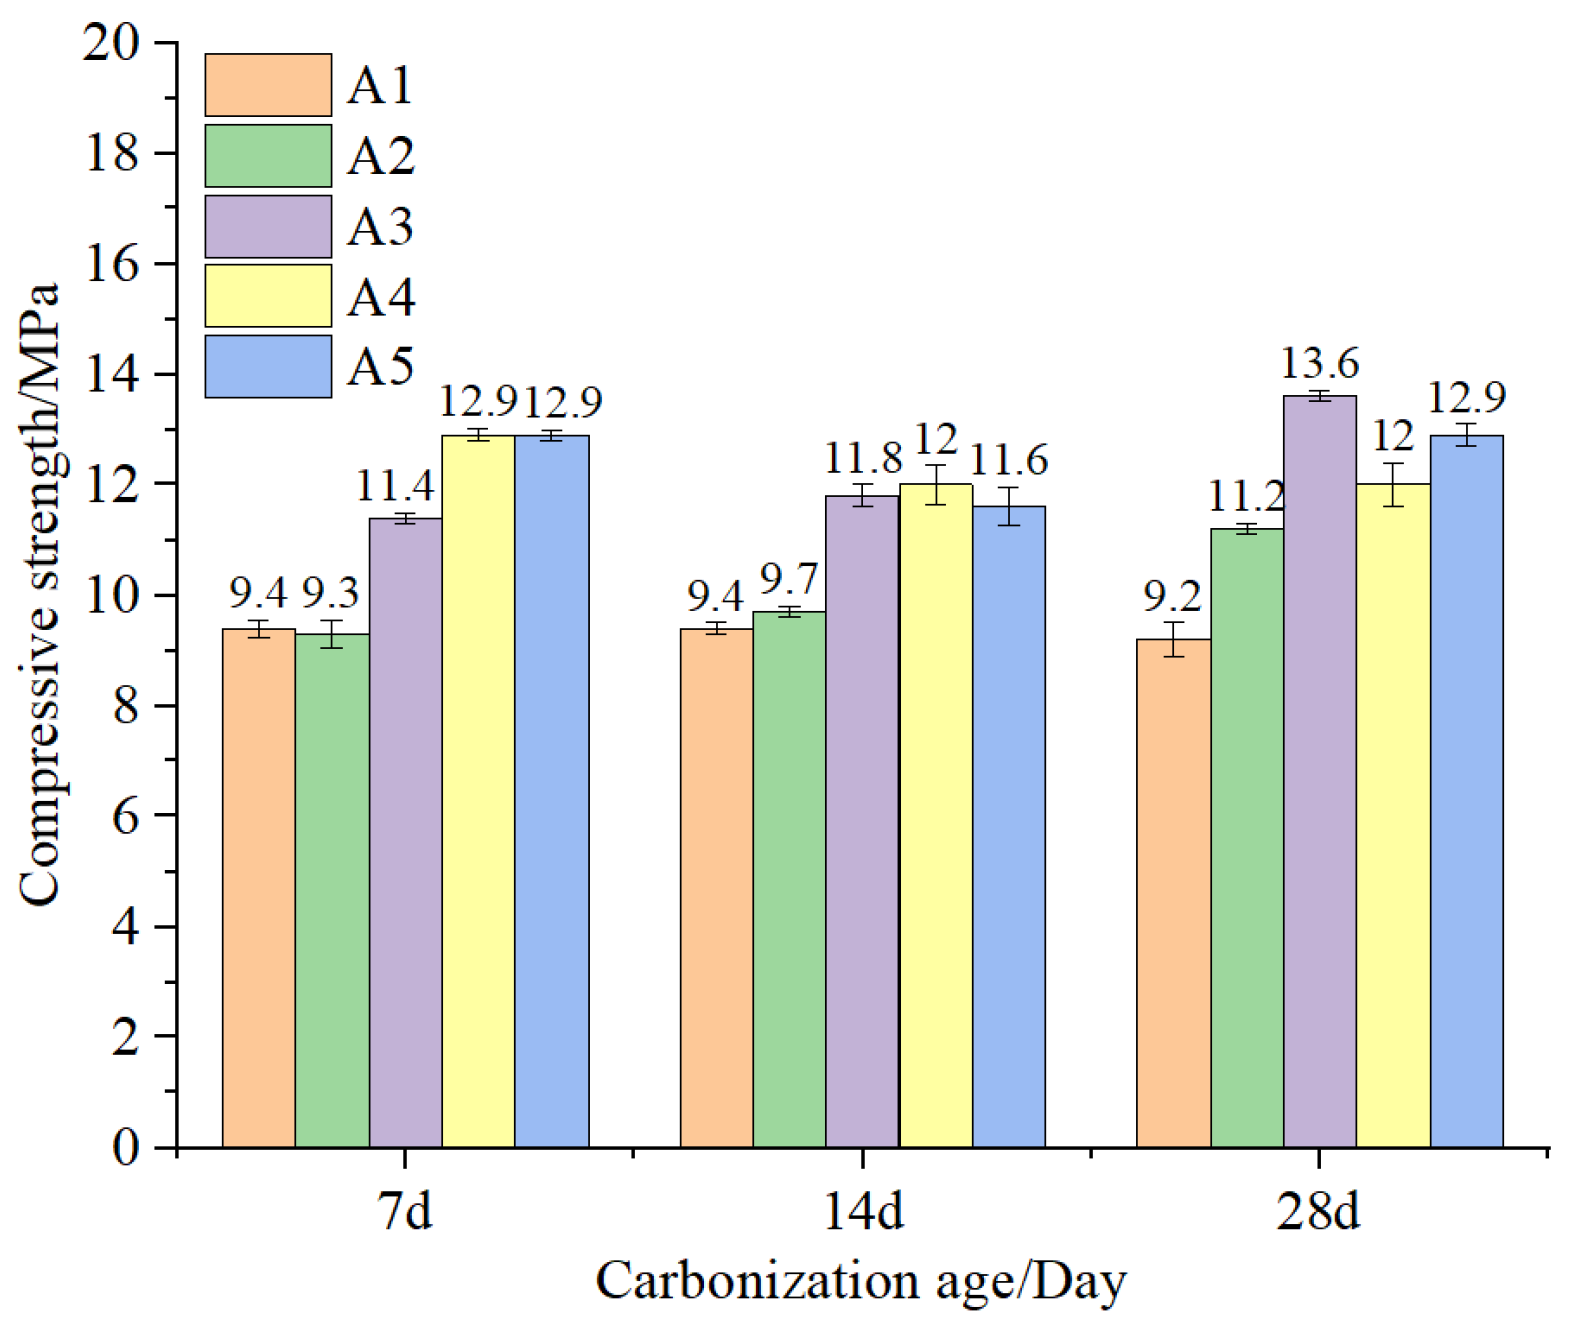
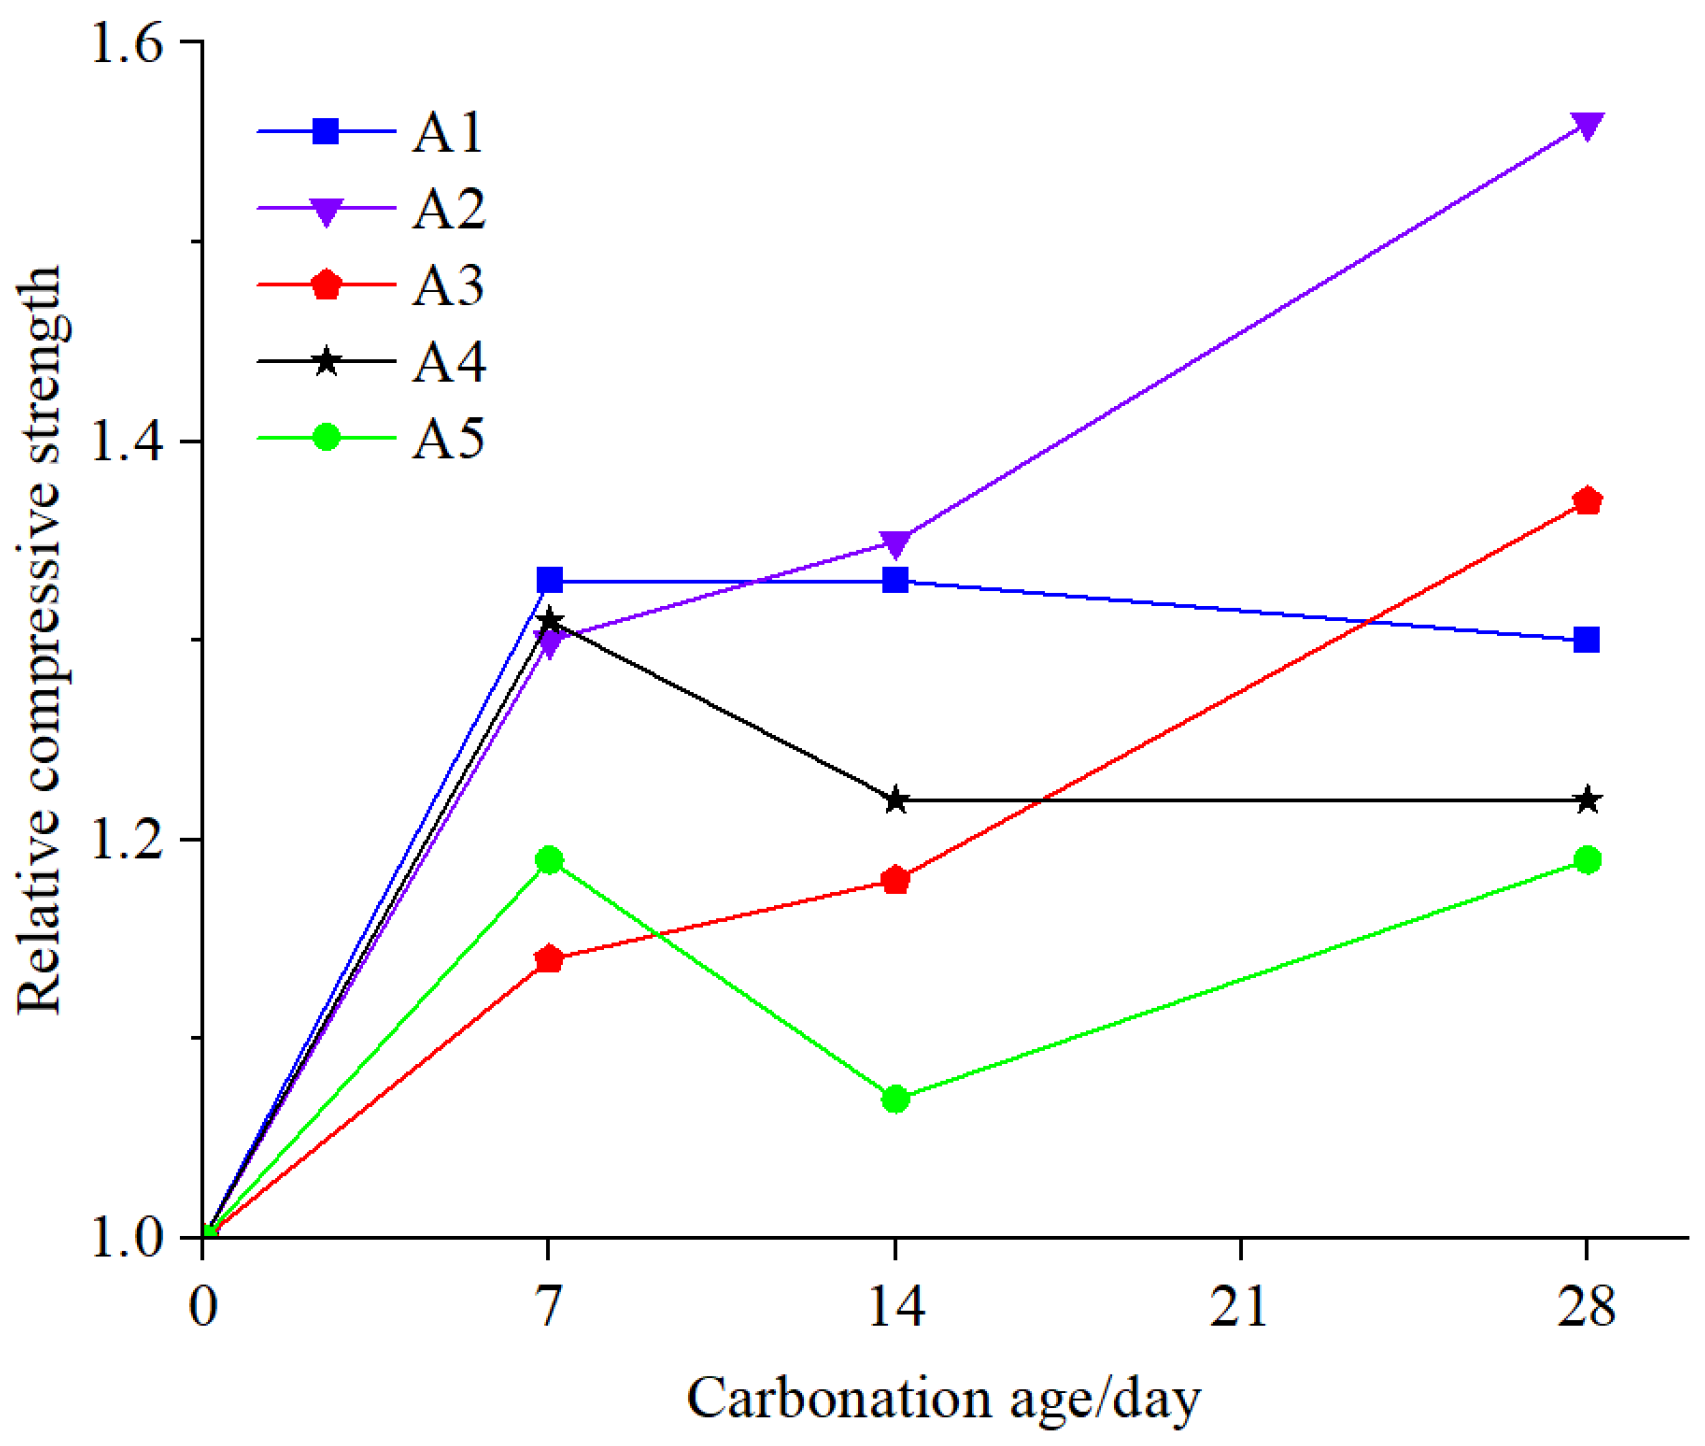
As shown in
Figure 11, the compressive strengths of specimens with different microbead dosages increased with the progression of carbonation age. The strengths increased by 18% to 56% after carbonation compared to those without carbonation. The increase in strength after carbonation is twofold: One is mainly due to the fully hydrated concrete in an environment with a CO
2 volume fraction of (20 ± 3)%, a relative humidity of (70 ± 5)%, and a temperature of (20 ± 2) °C. Adequate moisture, temperature, and humidity allow for more complete hydration, and the hydration products fill the internal pores of the concrete, making the matrix denser and improving its compressive strength. Additionally, the chemical reaction between the C-S-H gel and Ca(OH)
2 and CO
2 within the specimens produces a substantial amount of CaCO
3, filling the defective areas between the ITZ. This improves the pore structure and optimizes the structure of the ITZ, thereby enhancing the compressive strength of the concrete specimens [
31,
32,
33].
Furthermore, the relative compressive strength can be utilized to assess the strength growth of EPS concrete at different carbonation ages. By obtaining the relative compressive strength data of EPS concrete after carbonation, as shown in
Table 4, the relationship curves of relative compressive strength of five groups of EPS concrete with carbonation age were obtained, as shown in
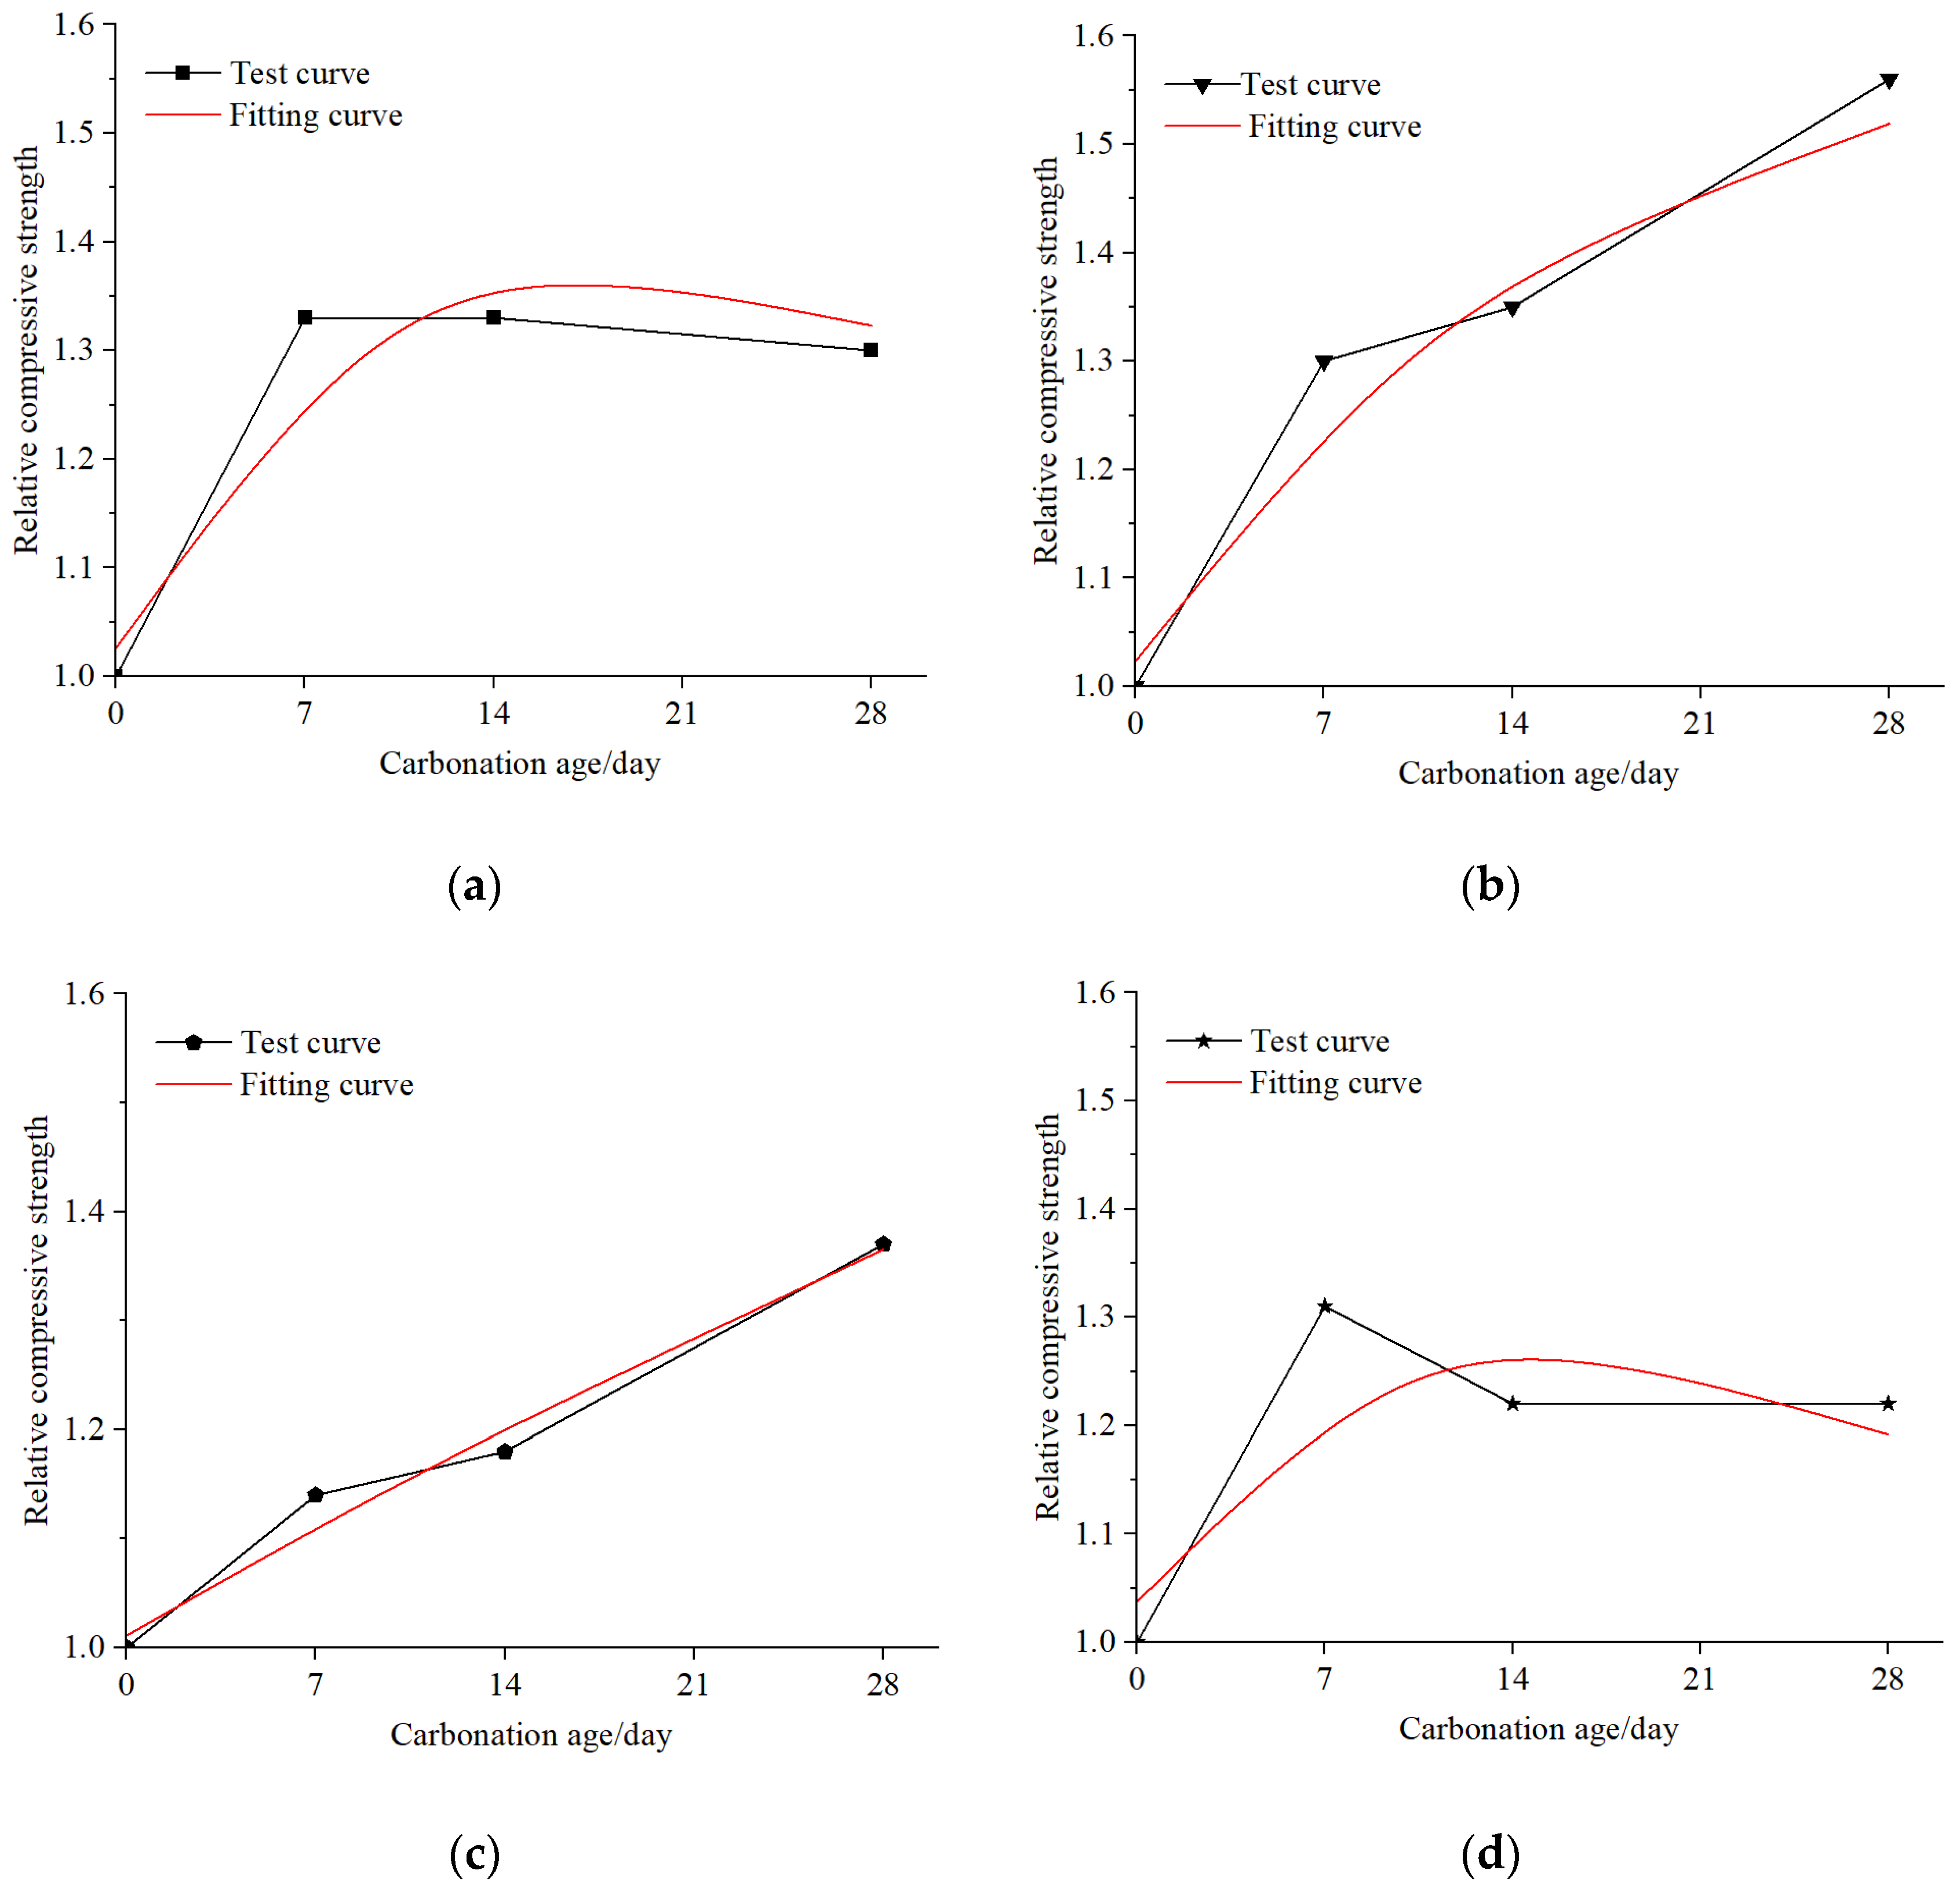
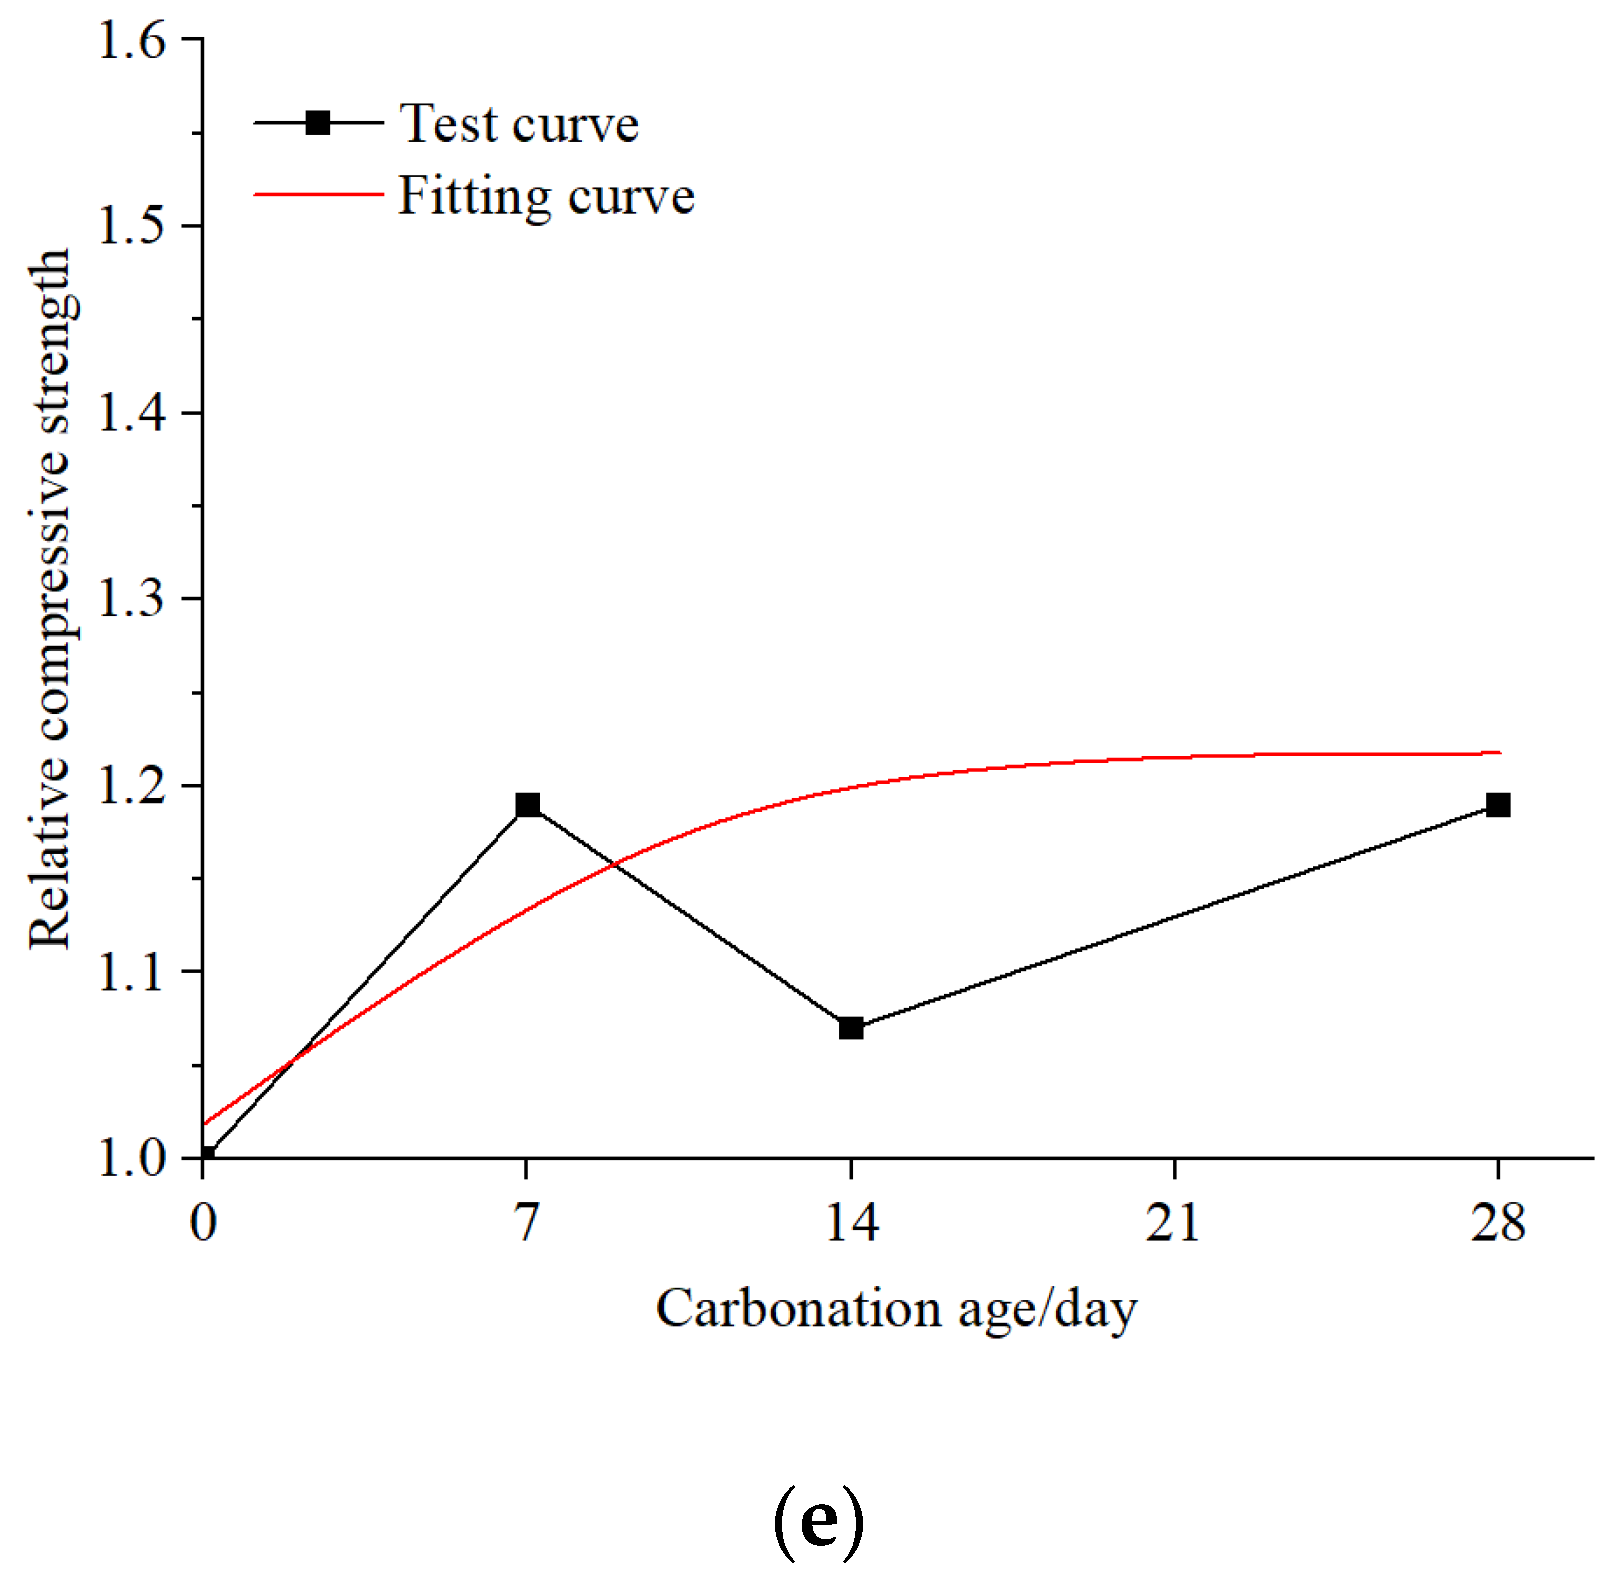
Figure 12. To obtain more accurate equations for the relative compressive strength curves of five groups of EPS concrete after carbonation, a binary function was used to fit the data in this study. The fitting curve is illustrated in
Figure 13. The fitting curves are in good agreement with the experimental curves except for the fourth group. The main reason for the poor fitting coefficient of the fourth group is the low strength after carbonization due to the manufacturing defects of the test specimens. The model function relationship is presented in Equation (1):
where
represents the compressive strength of EPS concrete before carbonation (MPa);
represents the compressive strength of EPS concrete after carbonation in the
i-th test;
i is the number of tests under carbonization, taken as 0, 1, 2, 3, …;
t is the carbonation time (day), taken as 0, 7, 14, and 28; and
a,
b, and
c are coefficients of test parameters to be calibrated under carbonization.
Assuming
as the relative compressive strength of EPS concrete, we can obtain:
Substituting Equation (2) into Equation (1) and finding the first and second order derivatives with respect to the carbonation time
t, the following equations are obtained, respectively.
When the carbonation time
t = 0, from Equation (3) we obtain:
The above equations show that parameter b represents the initial velocity of the change in relative compressive strength of EPS concrete, parameter a represents the acceleration of the change in relative compressive strength of EPS concrete, and parameter c represents the initial value of the relative compressive strength of EPS concrete.
The model parameters obtained by fitting the curves are tabulated in
Table 5. As shown in
Table 5, a value of
b greater than 0 indicates that the relative compressive strength of EPS concrete varies with
b at the beginning of the carbonation test, and the relative compressive strength varies with an acceleration of 2
a during the subsequent carbonation process. Given that the value of parameter
b is considerably greater than that of
a, the change rate of EPS concrete’s relative compressive strength, represented by 2
at +
b, is positive, implying that the relative compressive strength of concrete increases with the extension of the carbonated specimen
t. This result is consistent with the observed test results.
By comparing the model parameters of five groups of EPS concrete in
Table 5, it can be observed that the initial velocity of relative compressive strength of Groups A1 and A2 is higher than that of the last three groups. This is because there is no or less addition of microbeads, resulting in faster early carbonation and faster growth of compressive strength. This is also consistent with the described pattern of relative compressive strength change after carbonization.
3.3. Predicting the Carbonation Depth of EPS Concrete
It is generally concurred that there is a linear relationship between the depth of concrete carbonation and the square root of the carbonation time. Based on the available experiments and relevant theories for ordinary concrete [
34,
35,
36,
37,
38,
39], a prediction model for the carbonation depth of EPS concrete has been established.
where
Y is the carbonization depth, mm;
t is the carbonization time,
d;
K is the carbonization coefficient.
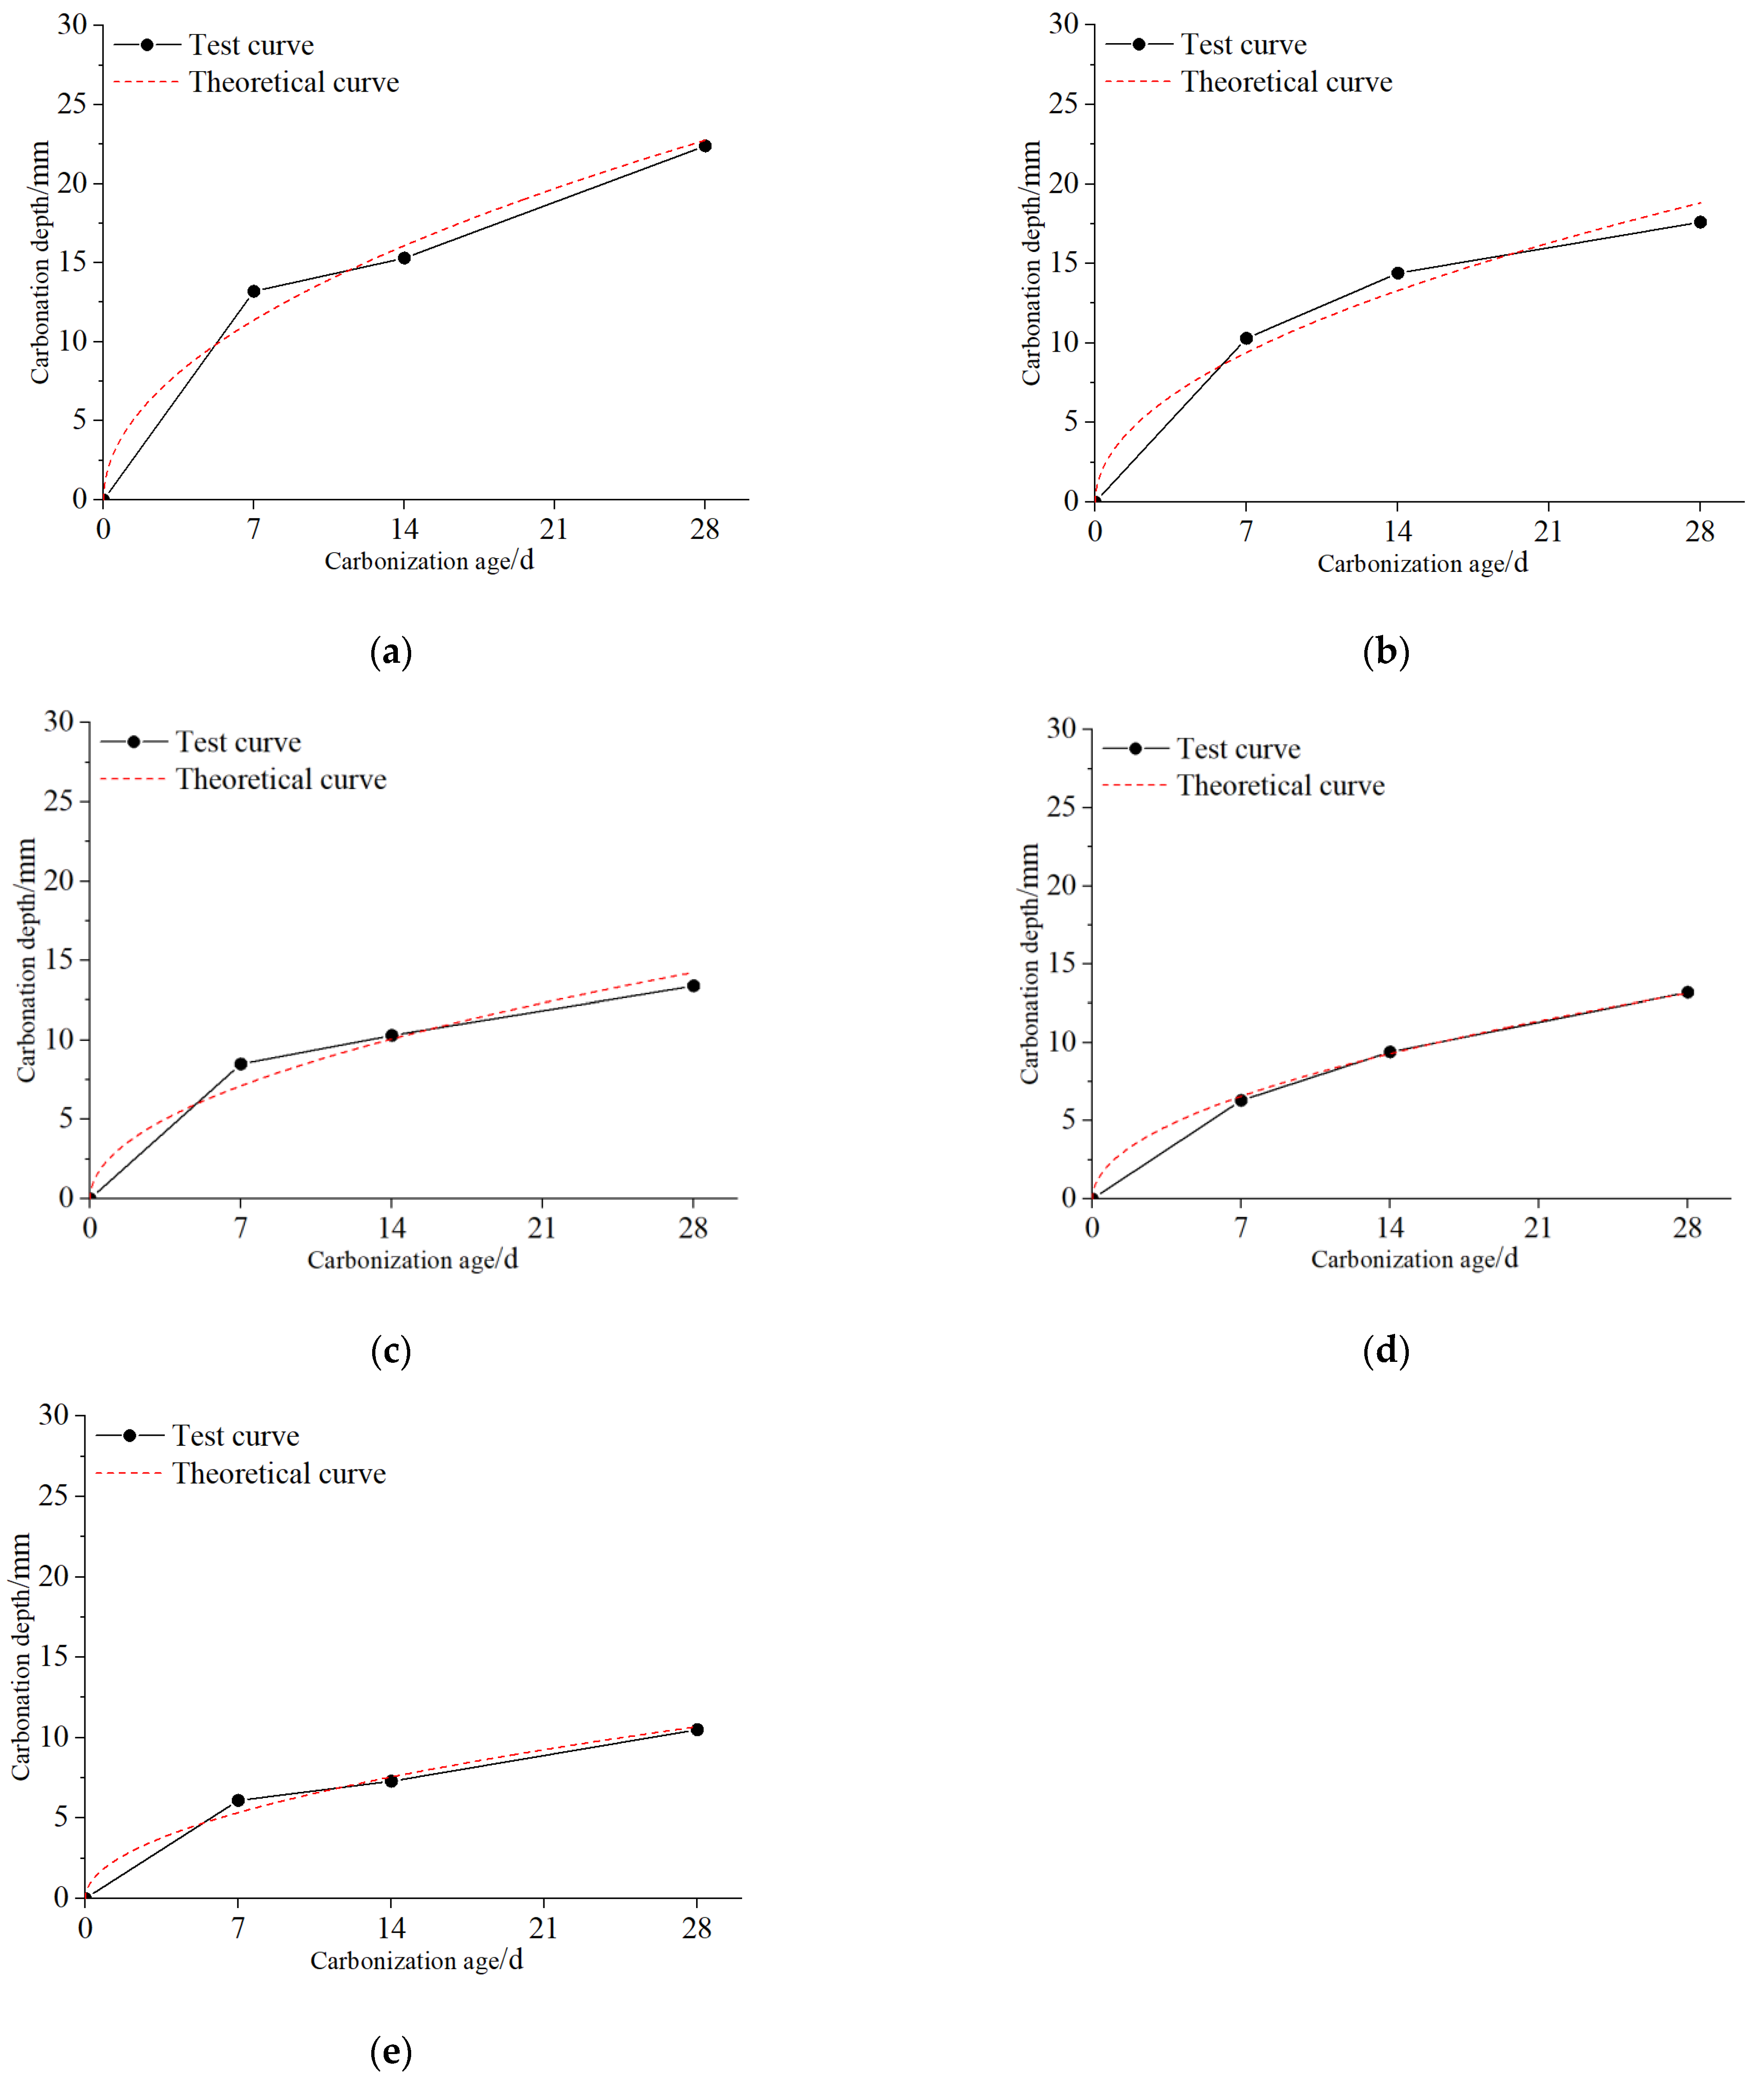
The test results were fitted based on Equation (6) with the requirement that the fitting curve passes through zero (when
t = 0,
Y = 0). This requirement reflects the fact that before the carbonation test began, the specimen was not carbonized, and its carbonation depth was 0. The fitting curve is illustrated in
Figure 14, while the carbonation coefficient is presented in
Table 6.
Table 7 compares the measured and calculated carbonation depth.
The results showed that the difference between the prediction model and the measured values is minimal, as seen in
Table 7. The comparison between the test curve and fitting curve in
Figure 14 indicated that the carbonation depth prediction model is suitable for EPS concrete. The carbonation rate of Group A1 was the highest among all groups, and it gradually decreased as the microbead dosage increased. Compared to Group A1, the carbonation coefficients of Groups A2, A3, A4, and A5 decreased by 17.44%, 37.44%, 42.26%, and 53.00%, respectively.
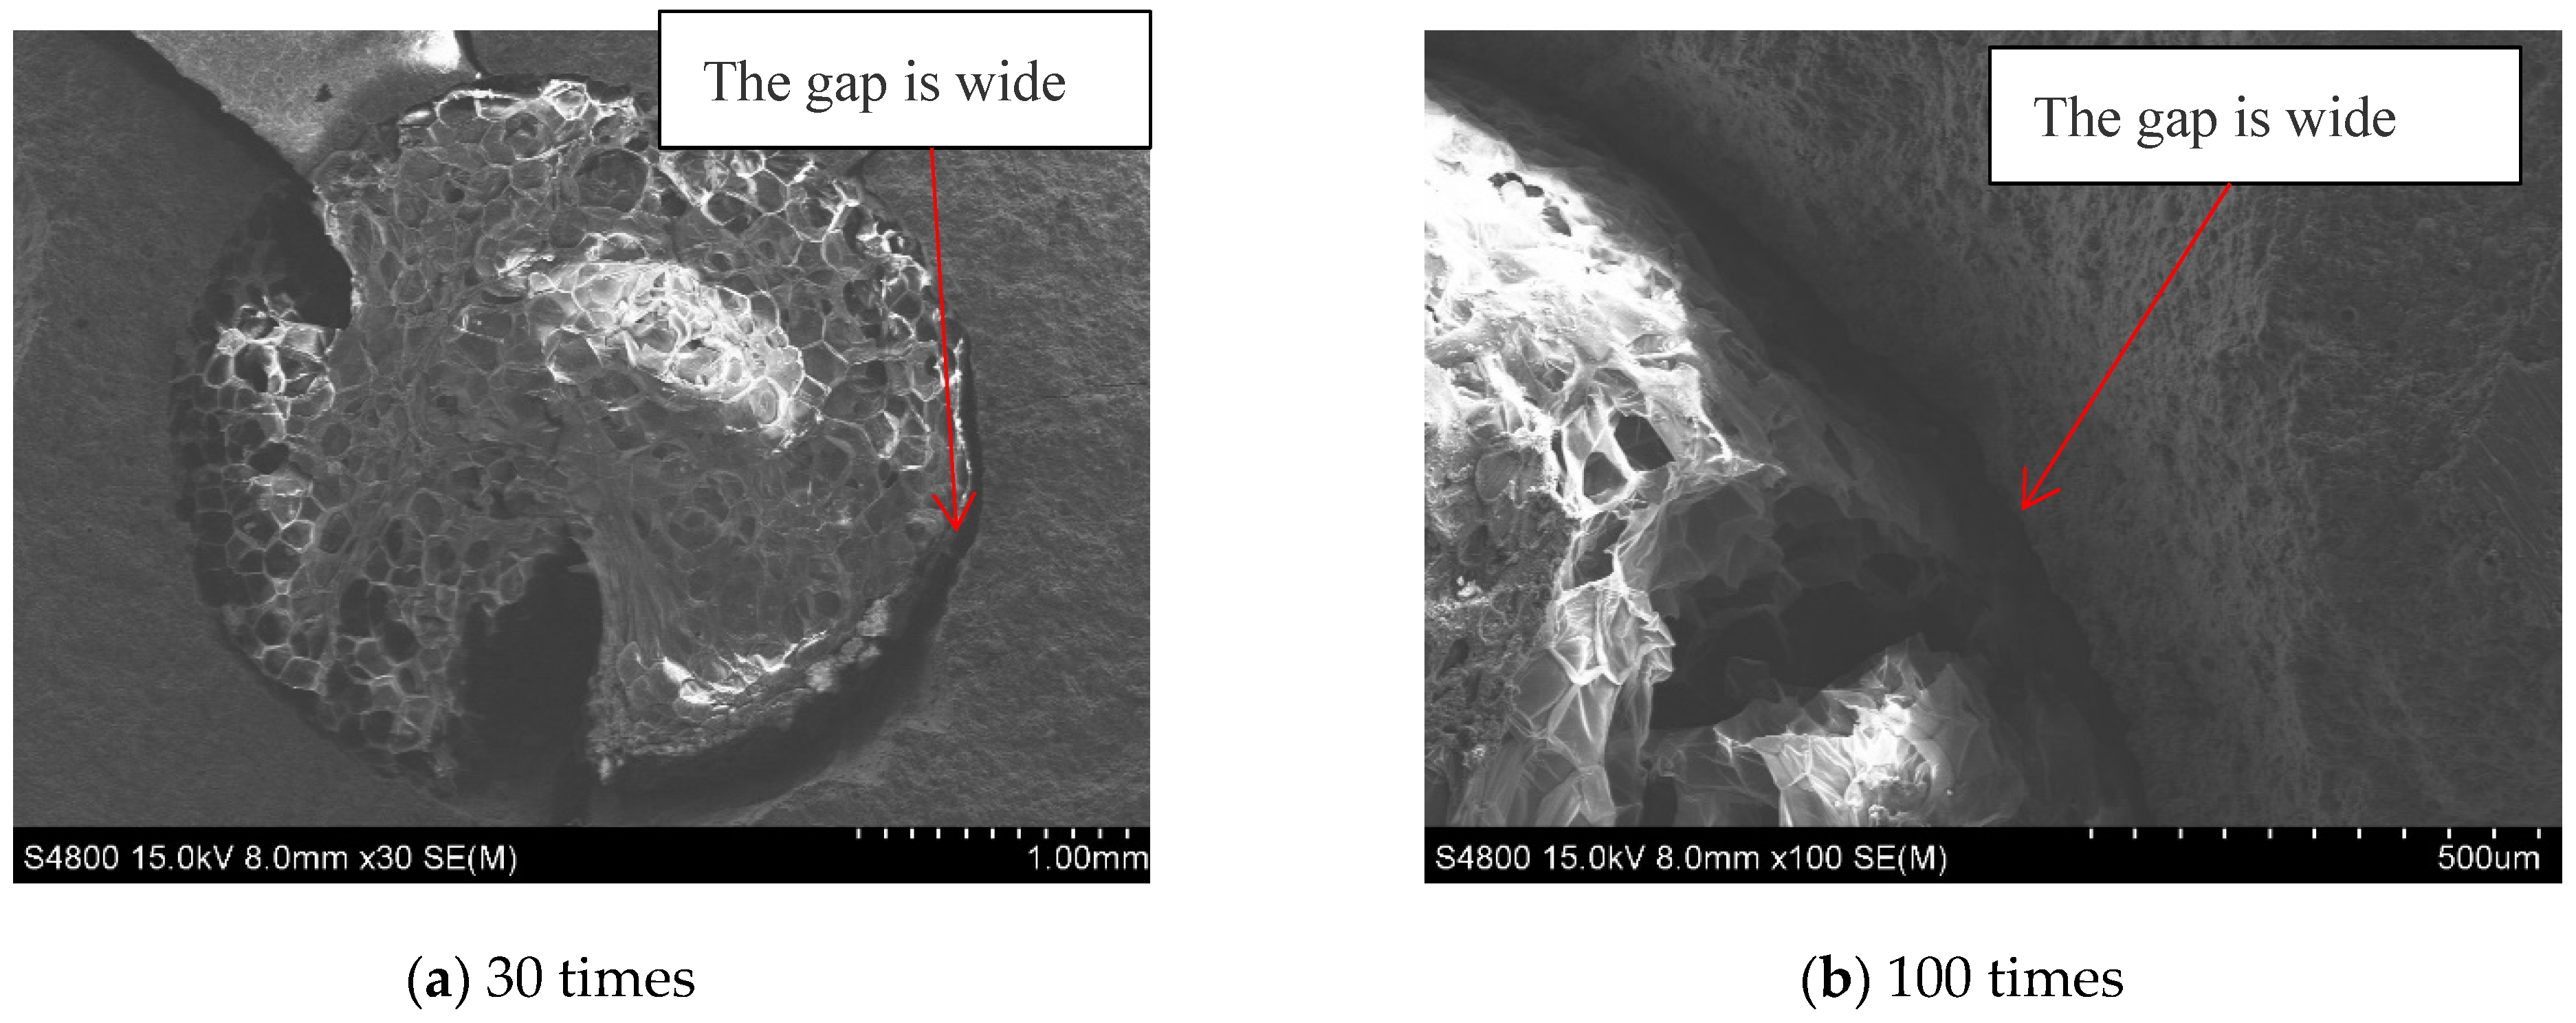
3.4. Microscopic Analysis
The SEM images of the five groups of EPS concrete in
Figure 15,
Figure 16,
Figure 17,
Figure 18 and
Figure 19 demonstrated the presence of an ITZ between EPS particles and the cement matrix [
1,
40,
41]. The surface of EPS particles is non-polar, while the cement matrix is polar, leading to poor compatibility between the two [
15]. Due to the influence of surface tension, the cement mortar is prone to disengage from the EPS particles and to coat the surface of the particles, resulting in the formation of a weak interfacial layer. This weak layer increases the permeability of water and CO
2, thus contributing to the reduction of concrete strength and durability. EPS particles are viewed as harmful pores in concrete and can have a significant impact on the overall quality of the material.
As can be seen from
Figure 15 and
Figure 16, the gap between the ITZ is obvious.
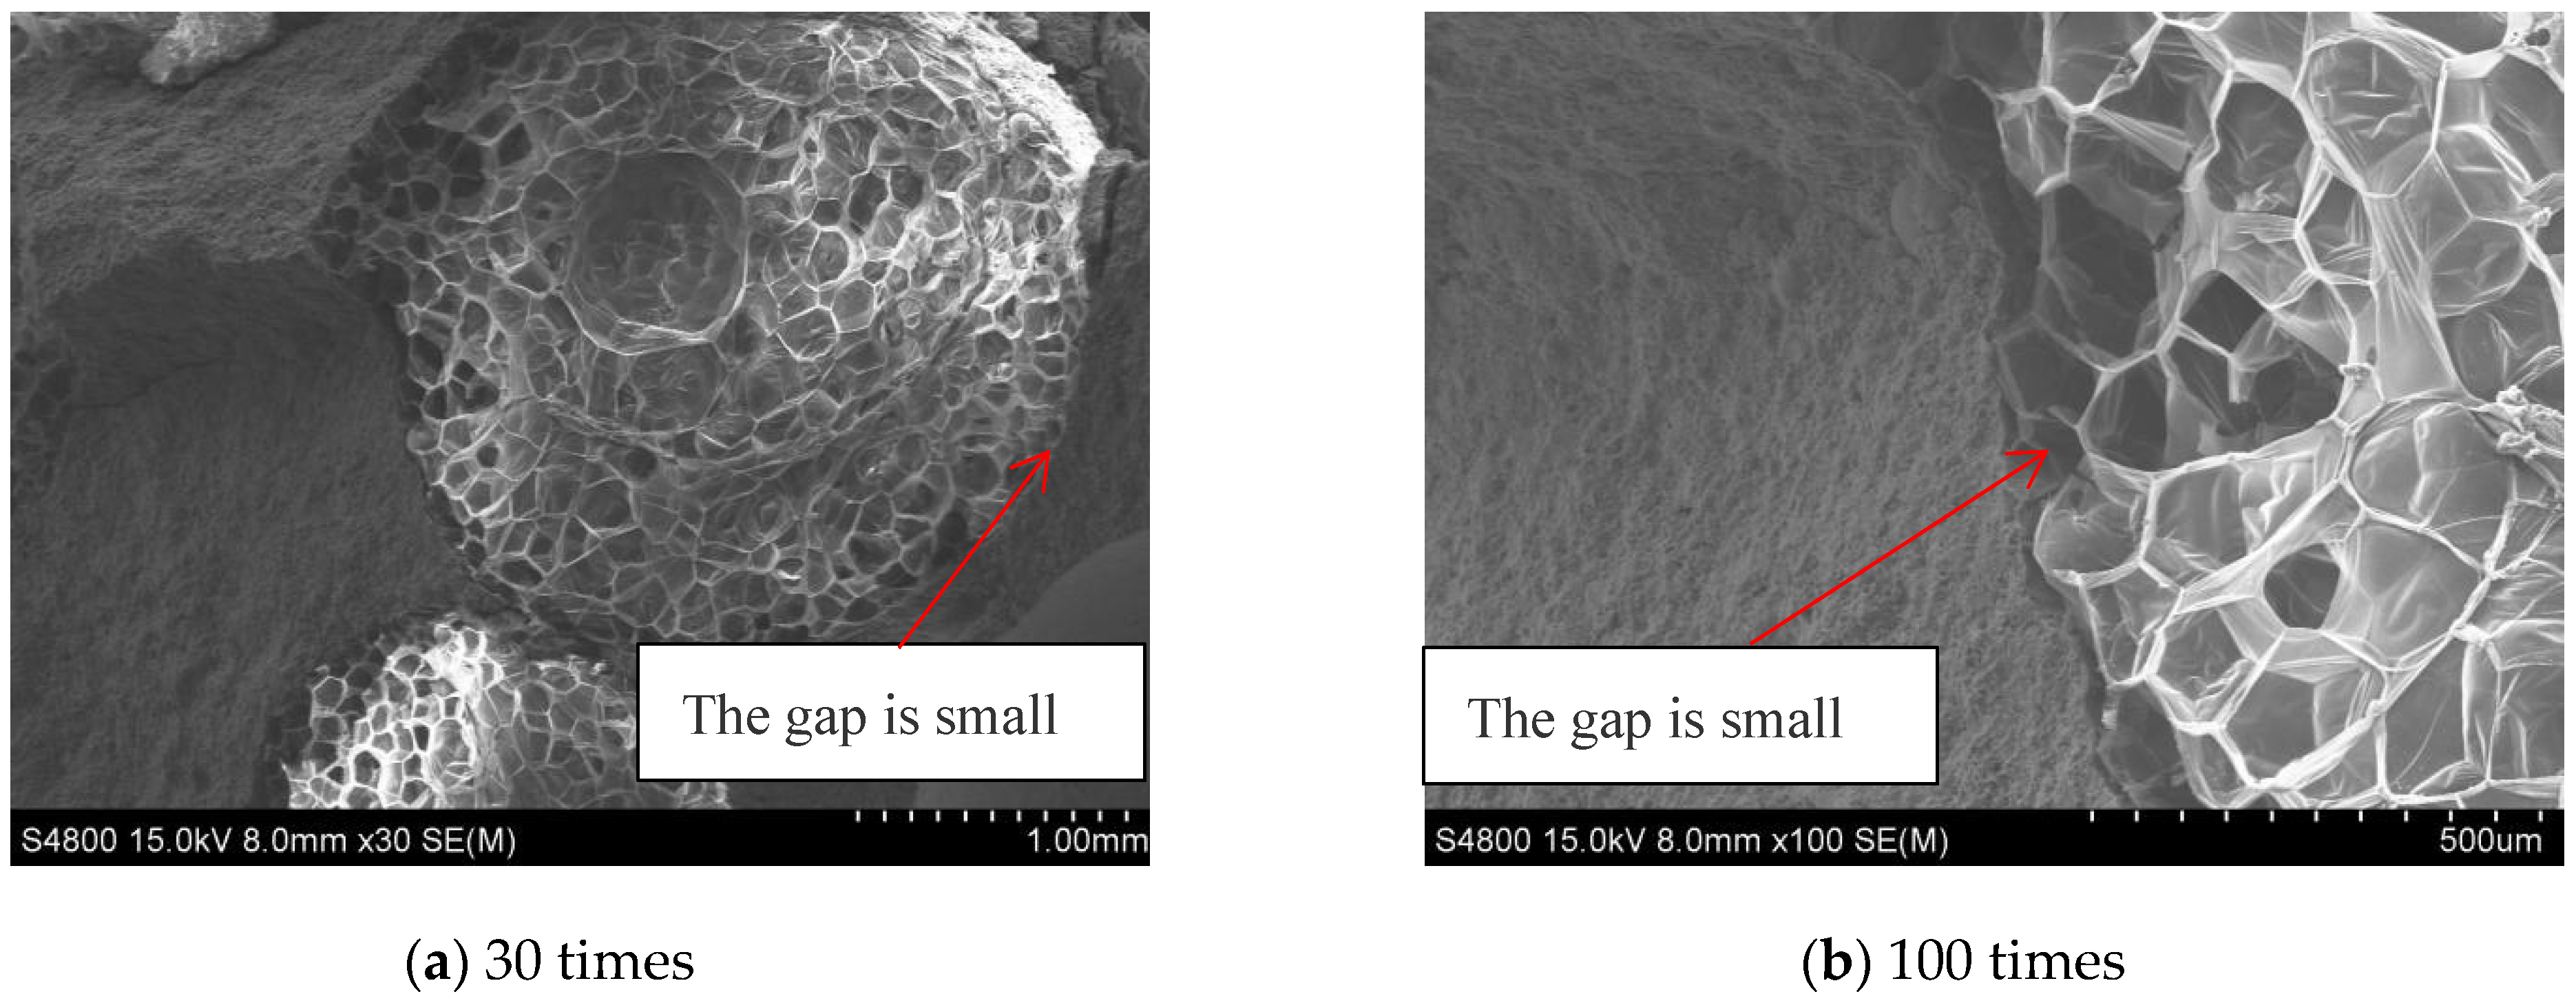
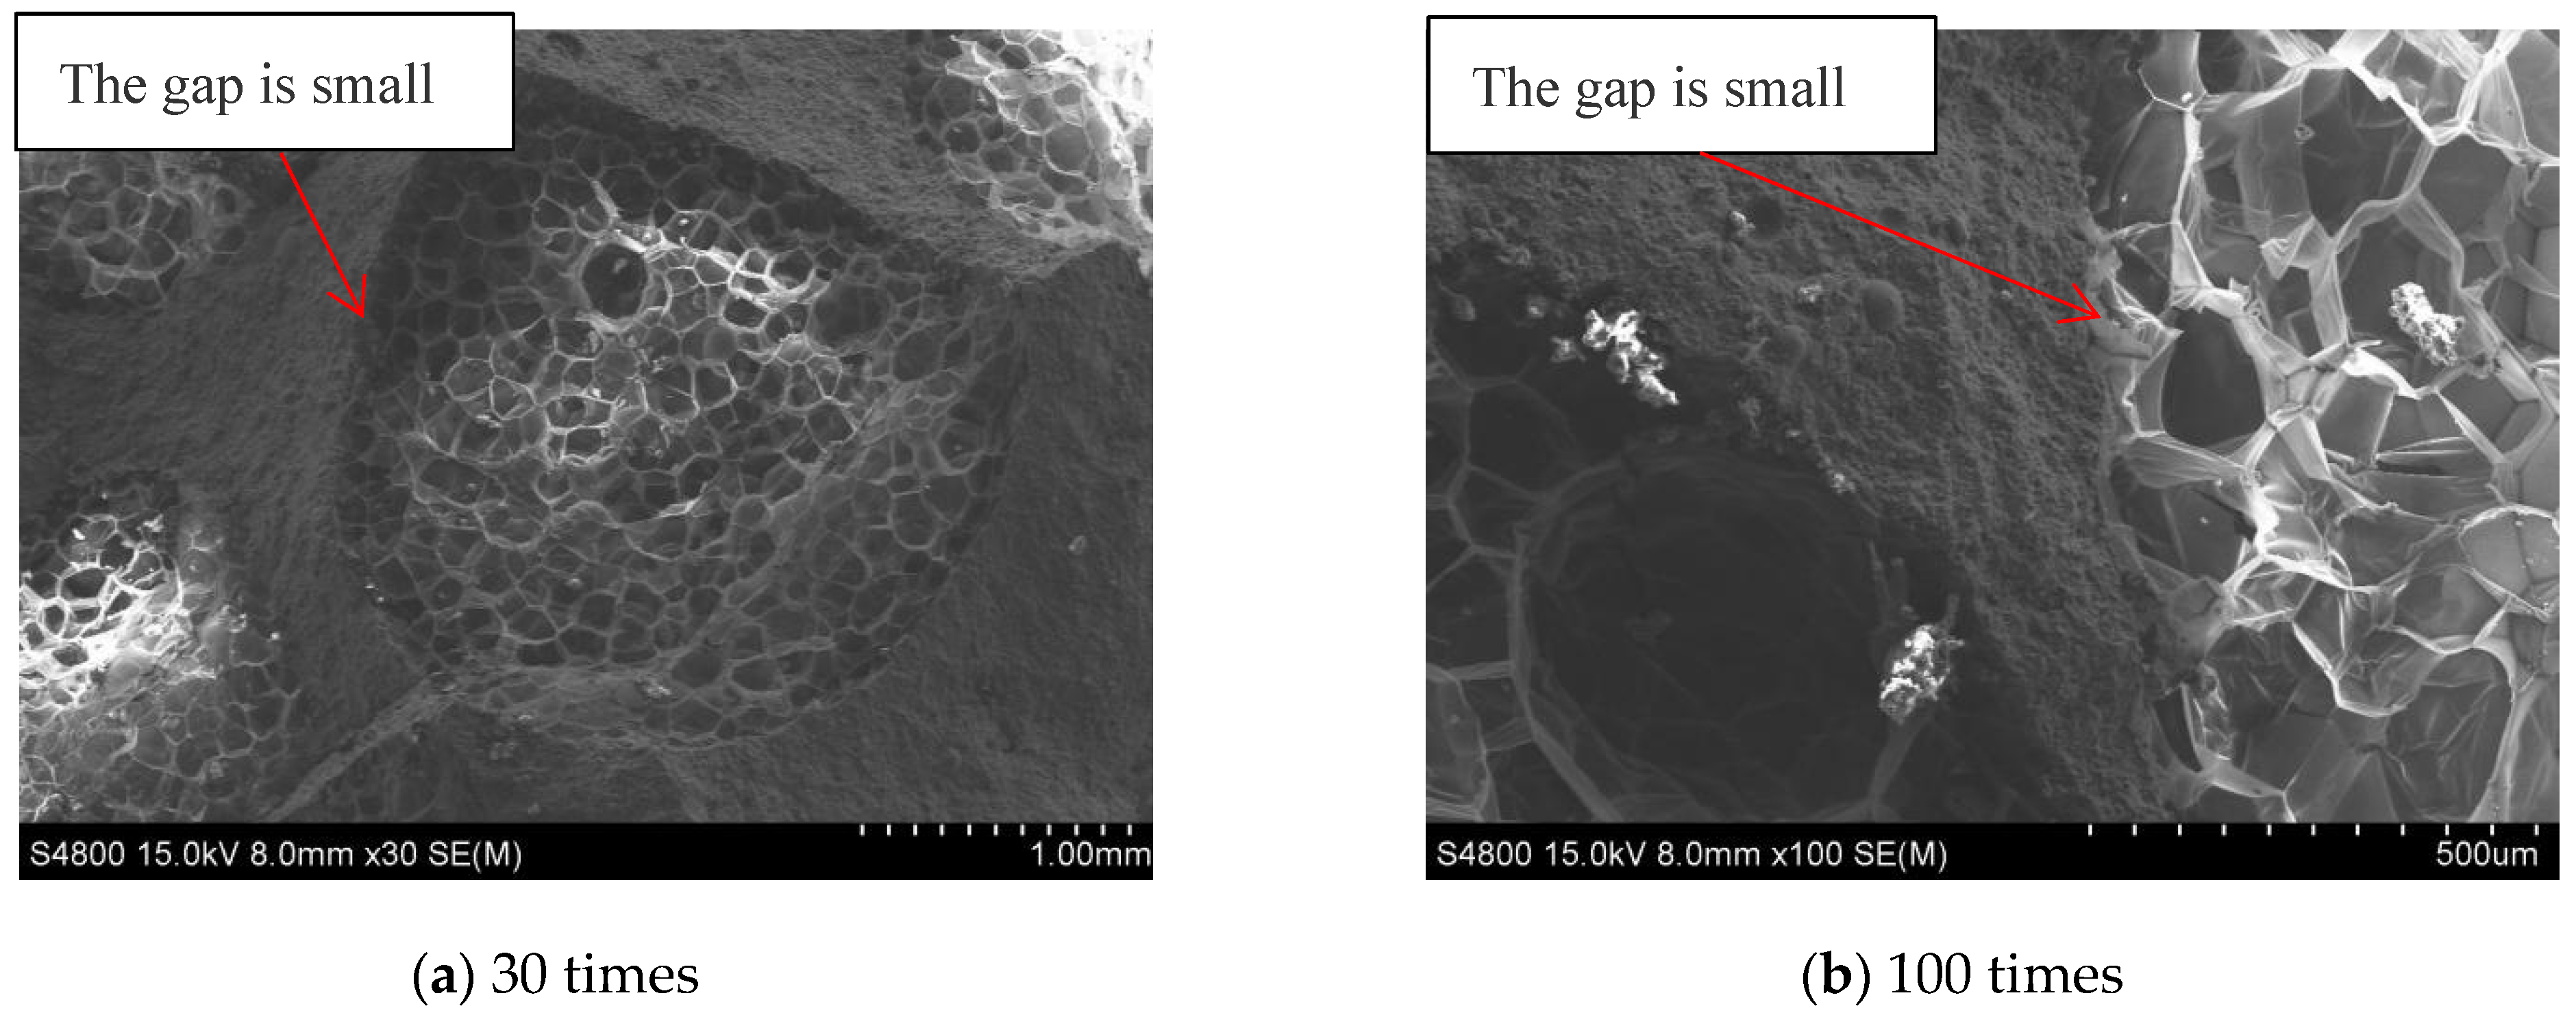
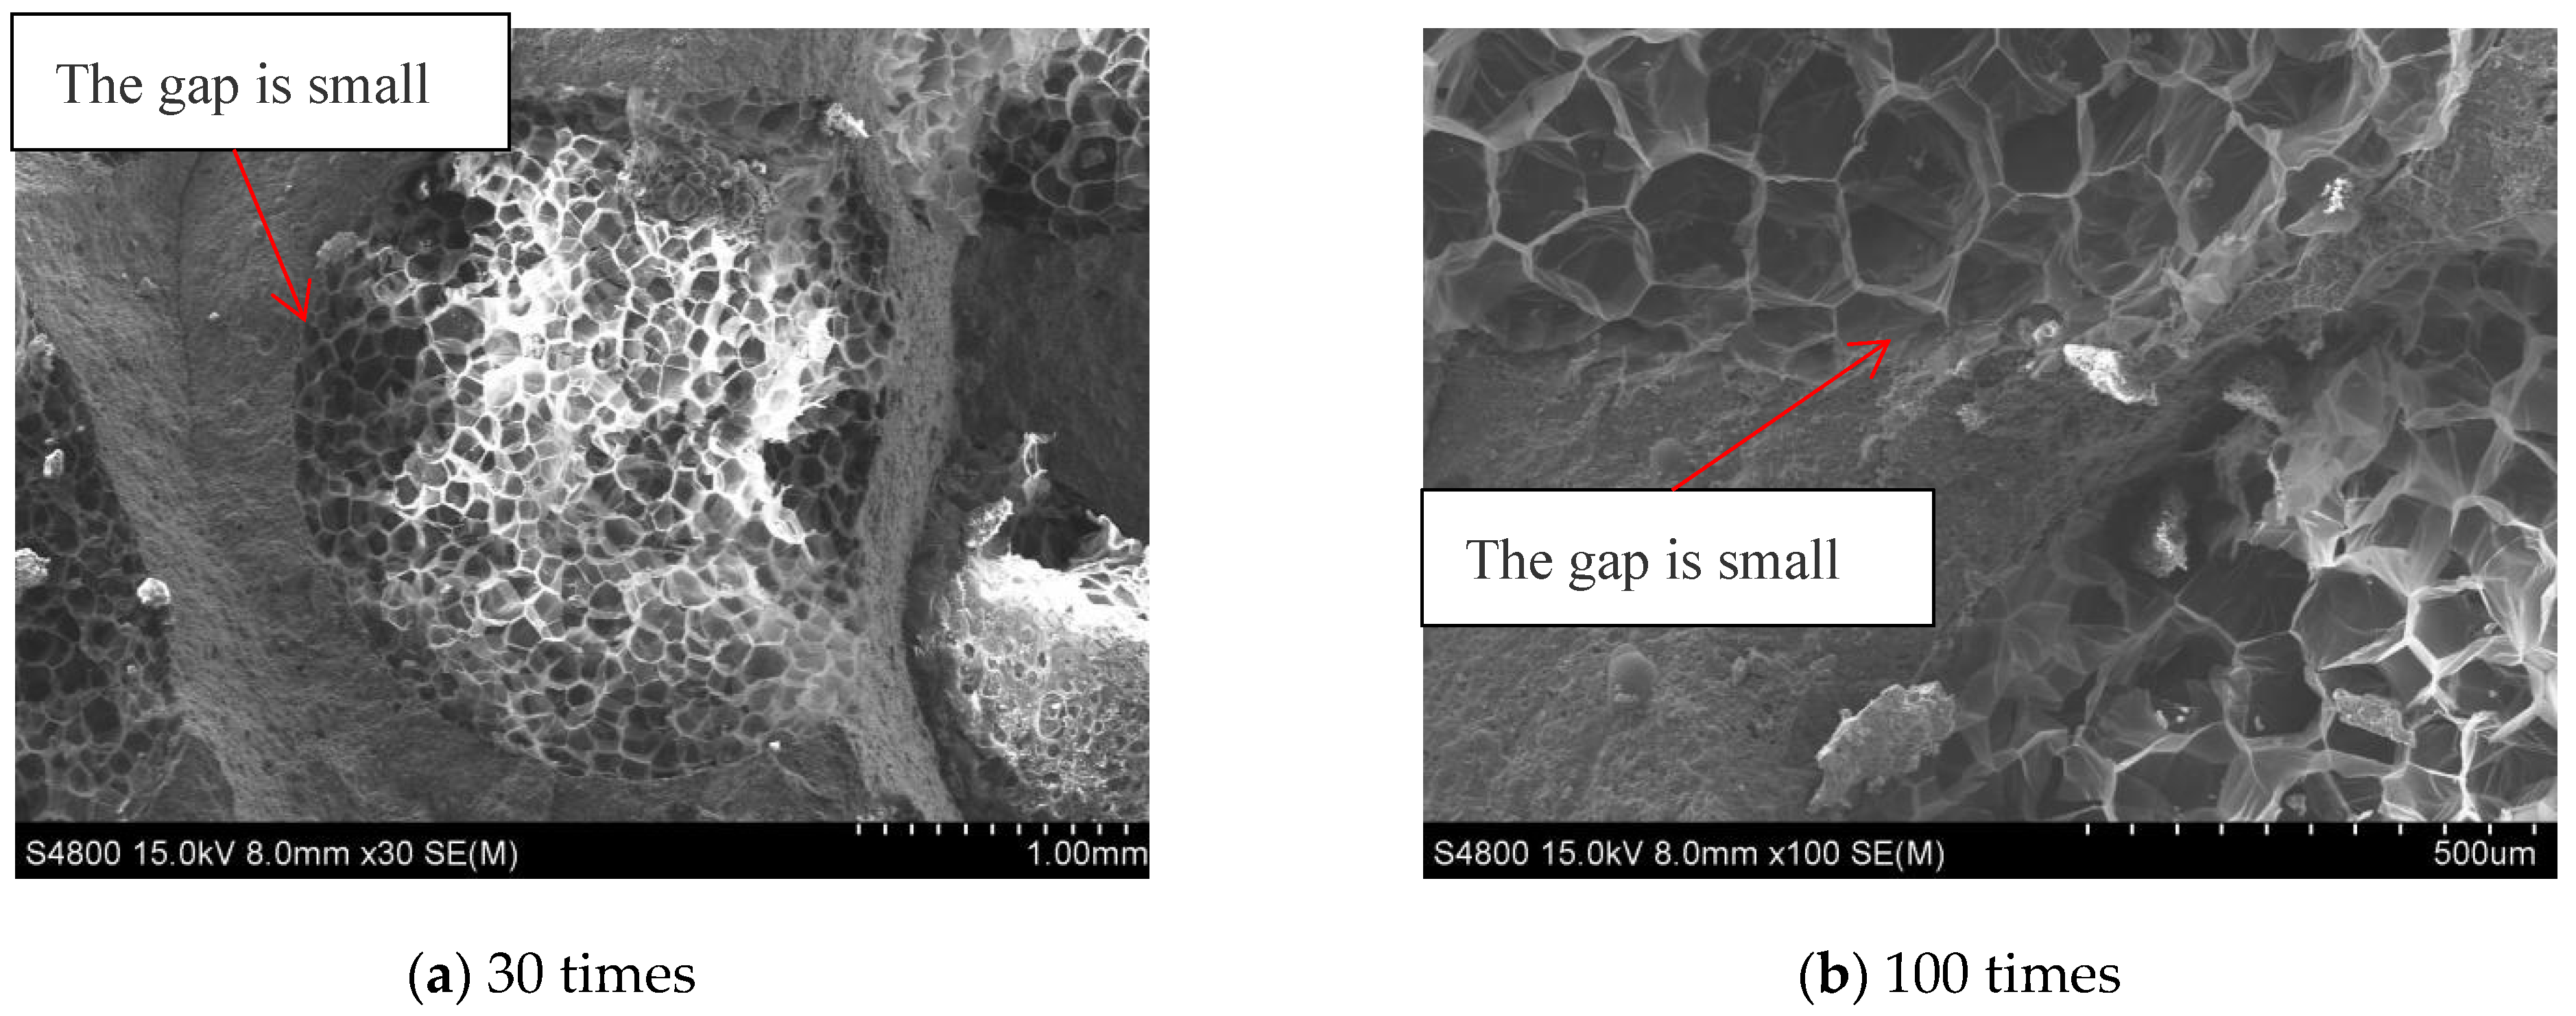
Figure 17,
Figure 18 and
Figure 19 demonstrate that EPS particles are closely embedded into the cement matrix, and there is a small gap at the ITZ between the EPS particles and the cement matrix. This is because with the increasing microbead dosage, some microbeads enter the ITZ between the EPS particles and the cement matrix, making the ITZ denser. Additionally, the smaller particle size of the microbeads compared to cement and fly ash can effectively fill the pores in the cement matrix, resulting in a denser matrix and hindering the infiltration of CO
2.
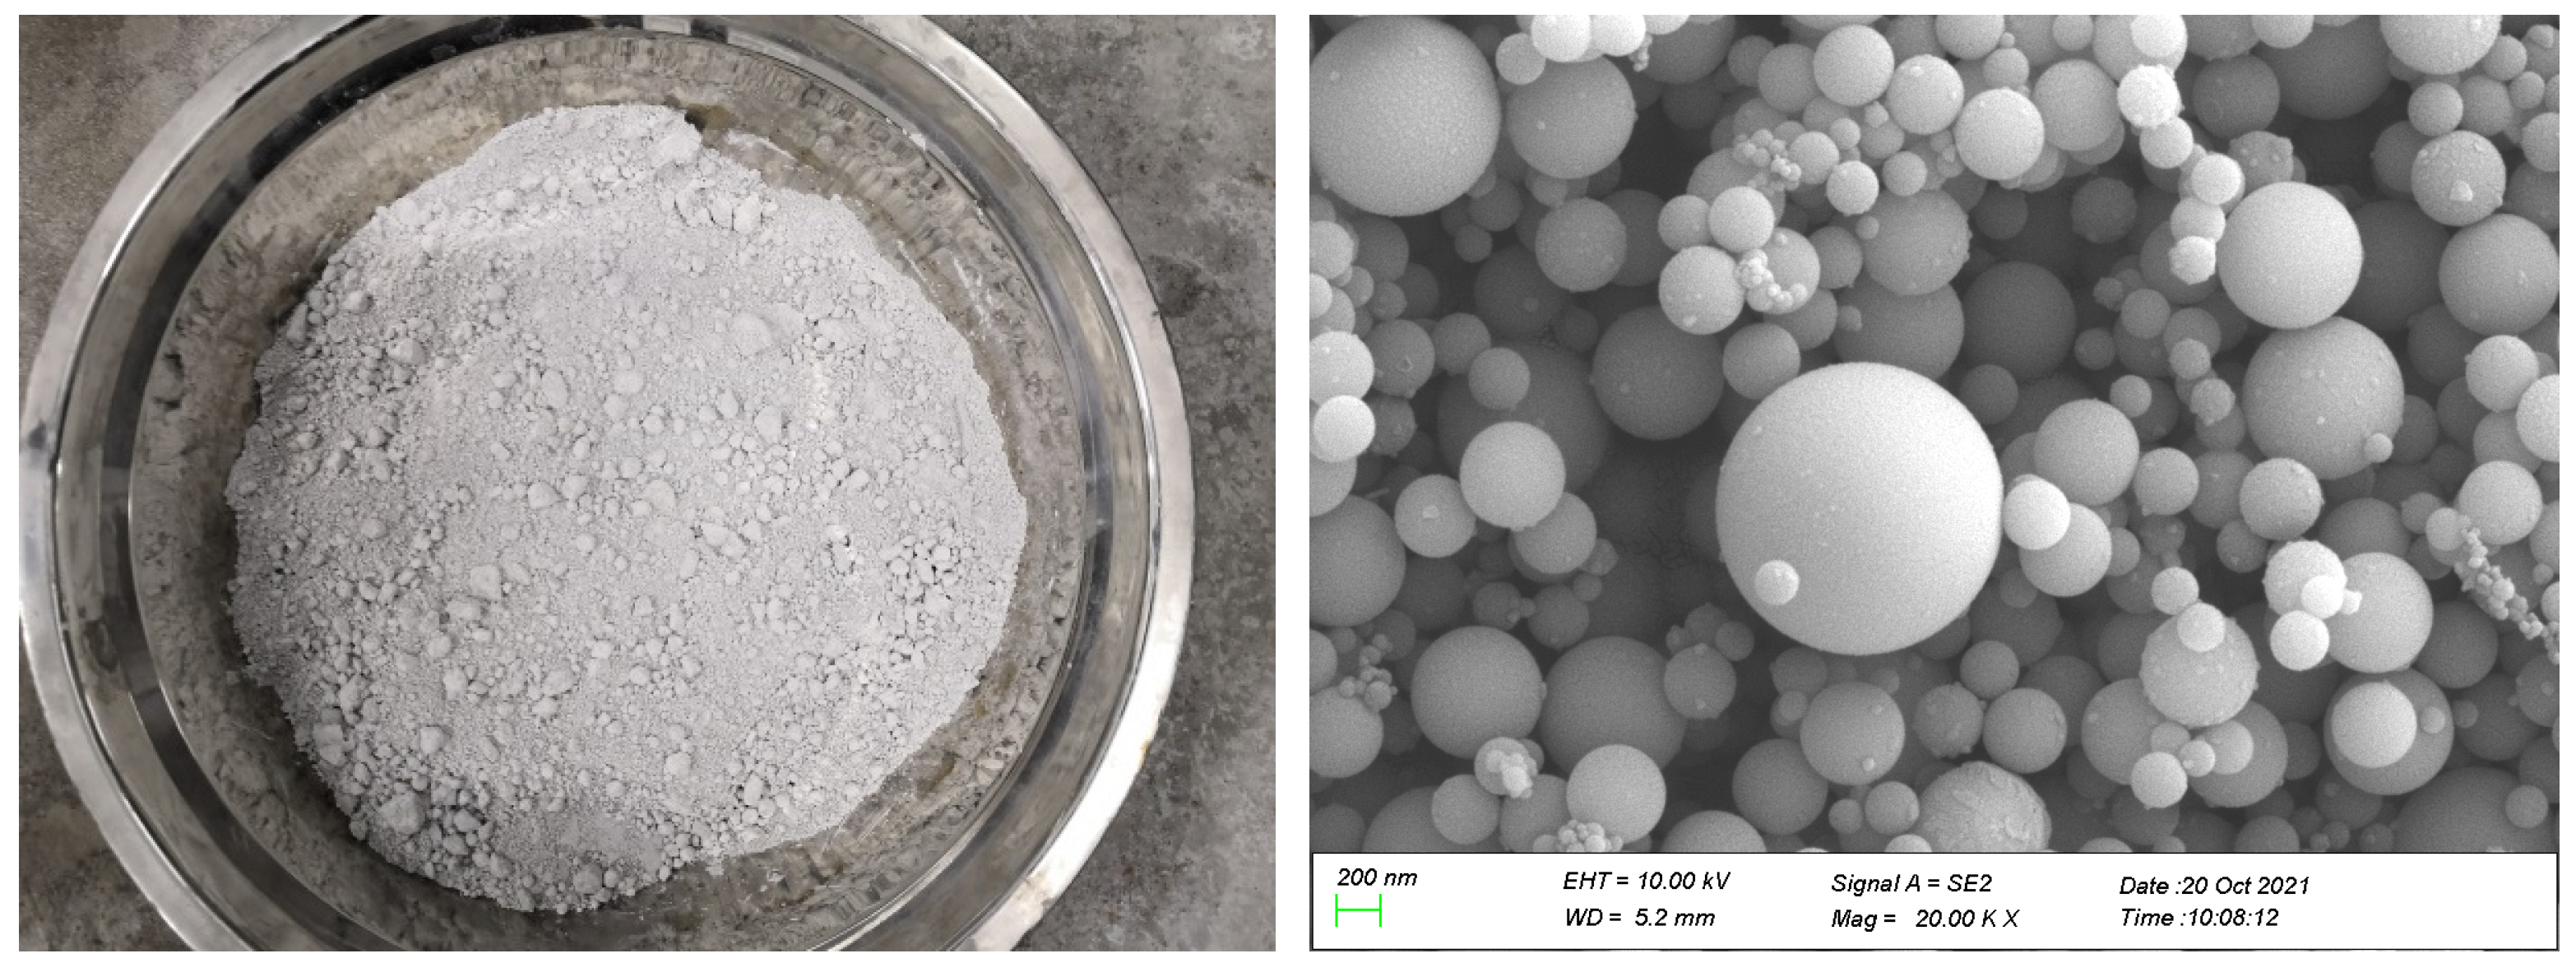
Moreover, due to the nanoscale size of some microbead particles, their chemical activity is significantly higher than that of typical materials. The microbeads are bonded to the hydration products of cement in large quantities, and play a crystalline nucleation role for the hydration products of cement around them, which can adsorb the ions in the cement matrix and become its precipitation site. The hydration product of cement, hydrated calcium silicate gel, has an adsorption effect and can be adsorbed in the form of smaller particles on the surface of gel particles and in the mesh structure of hydrated calcium silicate gel with microbeads as the core, making it difficult for large crystals to form. It reduces the degree of crystal orientation, which is beneficial for improving the interfacial structure and increasing the interfacial bond strength [
42,
43].
Meanwhile, the water reducing agent aids in the full dispersion of microbeads, thereby forming a finer and denser mesh structure [
44]. Microbeads can refine the grains in the cement matrix and fill the pores in the cement matrix, making it denser and less porous. Microbeads improve the microstructure of EPS concrete, increase the diffusion resistance of CO
2, and reduce the total amount of CO
2 diffusion. Therefore, microbeads can improve the carbonation performance of EPS concrete.


 ,
, 


