Article

Climate-Risk Assessment Framework for Airports under Extreme Precipitation Events: Application to Selected Italian Case Studies

1
Regional Models and Geo-Hydrological Impacts Division (REMHI), Fondazione Centro Euro-Mediterraneo sui Cambiamenti Climatici (CMCC), 81100 Caserta, Italy
2
Department of Science and Technology, University of Naples “Parthenope”, Centro Direzionale di Napoli—Isola C4, 80143 Naples, Italy
*
Author to whom correspondence should be addressed.
Sustainability 2023, 15(9), 7300; https://doi.org/10.3390/su15097300
Submission received: 3 March 2023 / Revised: 19 April 2023 / Accepted: 21 April 2023 / Published: 27 April 2023

Abstract

:
Extreme weather phenomena are increasing due to climate change and having a severe impact on critical infrastructure, including airports. In this context, conducting climate risk assessments is an essential step to implement appropriate adaptation strategies. In the present study, a climate-risk assessment framework is applied to evaluate the risk of extreme precipitation events for specific Italian airports: Malpensa, Bergamo, Linate, Fiumicino, Ciampino, Napoli, Catania, Palermo, and Cagliari. This analysis is based on the definition of risk as reported by Sixth Assessment Report of IPCC. The assessment of the climate hazard over the recent-past period (1981–2010) is evaluated through indicators developed from re-analysis data, using the Uncertainties in Ensemble of Regional Re-Analyses dataset are provided by Copernicus Climate Change Service. The expected climate variations are evaluated using an ensemble of high-resolution climate projections from the EURO-CORDEX initiative for the short- (2021–2050), medium- (2041–2070), and long-term future period (2071–2100), under RCP 2.6, RCP 4.5, and RCP 8.5 climate scenarios. The information related to exposure and vulnerability indicators are collected from official documents and website of selected airports, and are freely available. The final risk index provides elements allowing stakeholders to implement adaptation measures to increase their resilience.

1. Introduction

The Intergovernmental Panel on Climate Change [1,2] states that climate change unequivocally impacts natural and anthropic systems, including critical infrastructure. Among this, airports are particularly exposed to the potential consequences of climate change due to their asset and service vulnerabilities to severe weather conditions [3,4,5]. In fact, extreme weather events can interrupt airport services, leading to closures and consequent economic losses for companies. More specifically, in most European countries, extreme precipitation events are likely to become more frequent [6]. This can impact airports in several ways, such as increasing the risk of the flooding of runways, taxiways, and underground infrastructures, especially where storm drainage systems cannot handle the increased volumes of water [4,7,8,9]. Flooding due to extreme precipitation events can also severely damage airport pavements, equipment, and/or buildings, resulting in service disruption [10]. In cases where disruption occurs frequently, it may lead to changes in route planning or impact the destination’s attractiveness [11]. For example, in 2013, at London Gatwick Airport, heavy rain and strong winds combined to severely disrupt travel for more than 16,000 passengers [12]. The consequences here were magnified by the fact that the events occurred on Christmas Eve, which is usually one of the busiest days for air travel in the UK [12,13]. In this context, it is, thus, essential for countries to gain an understanding of critical-infrastructure vulnerability to current and future climate-related threats, to develop effective climate-adaptation strategies. The first requisite step towards implementing these strategies, before any planning process, is the risk assessment. Some airports have already implemented specific strategies to cope with the effects of extreme precipitation events. An example is the Amsterdam Airport Schiphol, in the Netherlands, which is located in a very complex urban area and more than four meters below the sea level [14]. This airport is seizing the opportunity to build resilience to climate change through a developed emergency plan to address extreme rainfall impacts. This strategy sets out the ambition of coping with the risks of climate change, airport planning and water-management activities to 2030 and beyond according to the Water Vision 2030. In Norway, the Oslo airport has also conducted a risk assessment due to extreme precipitation events. Findings from the analyses highlighted how the new drainage systems of the airport needed 50% more capacity than that established in the 1990s, when the airport was constructed [7]. These strategies have been implemented especially in Northern European countries, while in the Mediterranean area airports seem less prepared, despite the expected risks [15]. For example, throughout Italy, detailed analyses of the impacts of climate change on the aviation sector have yet not been conducted. To fill this gap, this study aims to apply the climate-risk assessment framework for several Italian airports (i.e., Malpensa, Linate, Bergamo, Fiumicino, Ciampino, Napoli, Catania, Palermo, Cagliari) with a focus on extreme precipitation events. According to the methodology defined in De Vivo et al. (2022) [15], the past and expected risk of the selected airports was calculated taking into consideration the Hazard (H), the Exposure (E) and the Vulnerability (V), which is, in turn, divided into sensitivity and adaptive capacity.
The hazard analyses were performed considering specific climate indicators both for past trends and numerical projections for future periods. More specifically, for the past reference period 1981–2010, the different climate-hazard indices were calculated starting from the gridded Uncertainties in Ensemble of Regional Re-Analyses dataset (UERRA) [16], while for the future—short- (2021–2050), medium- (2041–2070) and long-term period (2071–2100)—an ensemble of high-resolution climate projections were considered under RCP 2.6, RCP 4.5, and RCP 8.5 IPCC scenarios, starting from the EURO-CORDEX initiative [17,18]. We did not consider CMIP6 (Coupled Model Intercomparison Projects) models because they are only available on a global scale. In order to better characterize local-scale phenomena such as precipitation, we decided to use regional models (i.e., EURO-CORDEX), based on CMIP5, which have a higher spatial resolution (12 km). Exposure and vulnerability data were collected from multiple sources such as online official documents and reports and airport websites. The final risk was obtained by the interaction between hazard, exposure, and vulnerability, properly normalized and aggregated [1,2,15,19]. Quantifying the risk will allow for priorities of intervention in terms of adaptation strategies aimed at making airports more resilient to the changing climate.
The paper is organized as follows: Section 2 summarizes the main related works obtained from a literature review, which highlight the importance of the topic and of the proposed methodology. Section 3 describes the study area, the methodology and the data used to calculate the hazard, the exposure, and the vulnerability indicators. Section 4 shows the results obtained for each individual risk factor and the overall risk related to extreme precipitation. In Section 5, a discussion of the results is presented, while in the Section 6, the main conclusions are drawn.

2. State of the Art

This section summarizes the main works related to the proposed topic of research to place it in the broader context of current studies. The most significant results already available in the literature are reported, highlighting the importance of the topic and the proposed methodology. In particular, once the risks associated with climate change and the potential effects on airports infrastructures are identified, the need to define adaptation measures to climate change based on studies on climate risk assessment emerges. Therefore, national and international studies on climate risk were reviewed and briefly summarized in support of the definition of the method proposed by the authors in this paper.

Climate Risk Assessment for the European Aviation Sector

To establish whether and to what extent adaptation actions may be required at an airport, it is necessary to carry out a risk assessment [3]. To date, in the European context, several projects have been launched to encourage airports to conduct risk assessments in order to cope with consequences of climate change [4,5,20]. In the PESETA III Project [5], the European Commission defined the main impacts of climate change on European transport with a focus on airports, seaports, and inland waterways. According to the results of the analysis, the number of airports at risk of floods is projected to increase by nearly 60% between 2030 and 2080. By 2080, 196 airports will be at risk of flooding due to extreme precipitation and sea-level rises, most of which are situated along the coasts of Northern Europe. In fact, the airports of Northern Europe are the most prepared to face the consequences of climate change, with adaptation strategies in place or to be adopted. In the other European regions, especially in the Mediterranean area, although the effects of climate change are already observable [21], the impacts on aviation have not previously been assessed and climate risk assessments are still very limited. In fact, only France, in 2011, and Spain, in 2012, have launched national programs of resilience to climate change which also include a study of the vulnerability to climate change of infrastructures, including airports. More specifically, the French civil aviation authority (DGAC) developed a climate-risk assessment methodology for French airports in the VULCLIM Project [4]. This project has drawn a comprehensive picture of the climate change impacts expected on French airports by the end of the 21st century. Impacts have been identified that could positively or negatively affect airport infrastructure, construction, and operations. Therefore, based on the potential climate risks and their impacts, a method was developed to assess the vulnerability of airports to climate change. Taking the characteristics of a specific site, the methodology combines the probabilities of the occurrence of climate-change risks and the intensity of potential impacts to assess the vulnerability of the site. DGAC applied this assessment methodology to two of the top-five French airports located on the Mediterranean coast. Both cases identified sea-level rise and extreme rainfall as greater threats to the places considered. In the recent “Environment Report of International Civil Aviation Organization” [10], the effects of four atmospheric parameters in terms of Extreme Weather Indicators (e.g., R25 is the number of days that experience precipitation of more than 25mm) on infrastructure and services were analyzed using three Global Climate Models (GCMs) over the period 2030, 2050 and 2080 under two IPCC scenarios, RCP 4.5 and RCP 8.5. Bucchignani et al. (2021) [22] conducted a study on the expected extreme climate variations considering extreme precipitation indicators on the Napoli-Capodichino airport, with Regional Climate Model COSMO-CLM [23]. In the Italian context, greater attention has been paid to the effects of climate change on infrastructure only in recent years, especially with the publication of the “Climate Change, Infrastructure and Mobility” Report by the Italian Ministry of Infrastructure in February 2022 [24]. This report highlighted the potential climatic risks to the critical infrastructures with a prior identification of the targeted adaptation strategies to take into account. However, a detailed analysis on the climate risk for the Italian aviation sector has not been conducted yet. In this context, this work aims to bridge this knowledge gap and allow a first complete assessment of the risk due to extreme precipitation events for Italian airport infrastructures. The methodology proposed in this study considers all components involved in airport risk assessment (i.e., hazard, exposure, and vulnerability). This aspect constitutes the main element of novelty with respect to previous methodologies proposed by the scientific literature, which offered only a partial evaluation of risk that did not include sensitivity and adaptive capacity, key factors for climate risk analysis introduced in the Fifth and Sixth Assessment Report of the IPCC [1,2].

3. Materials and Methods
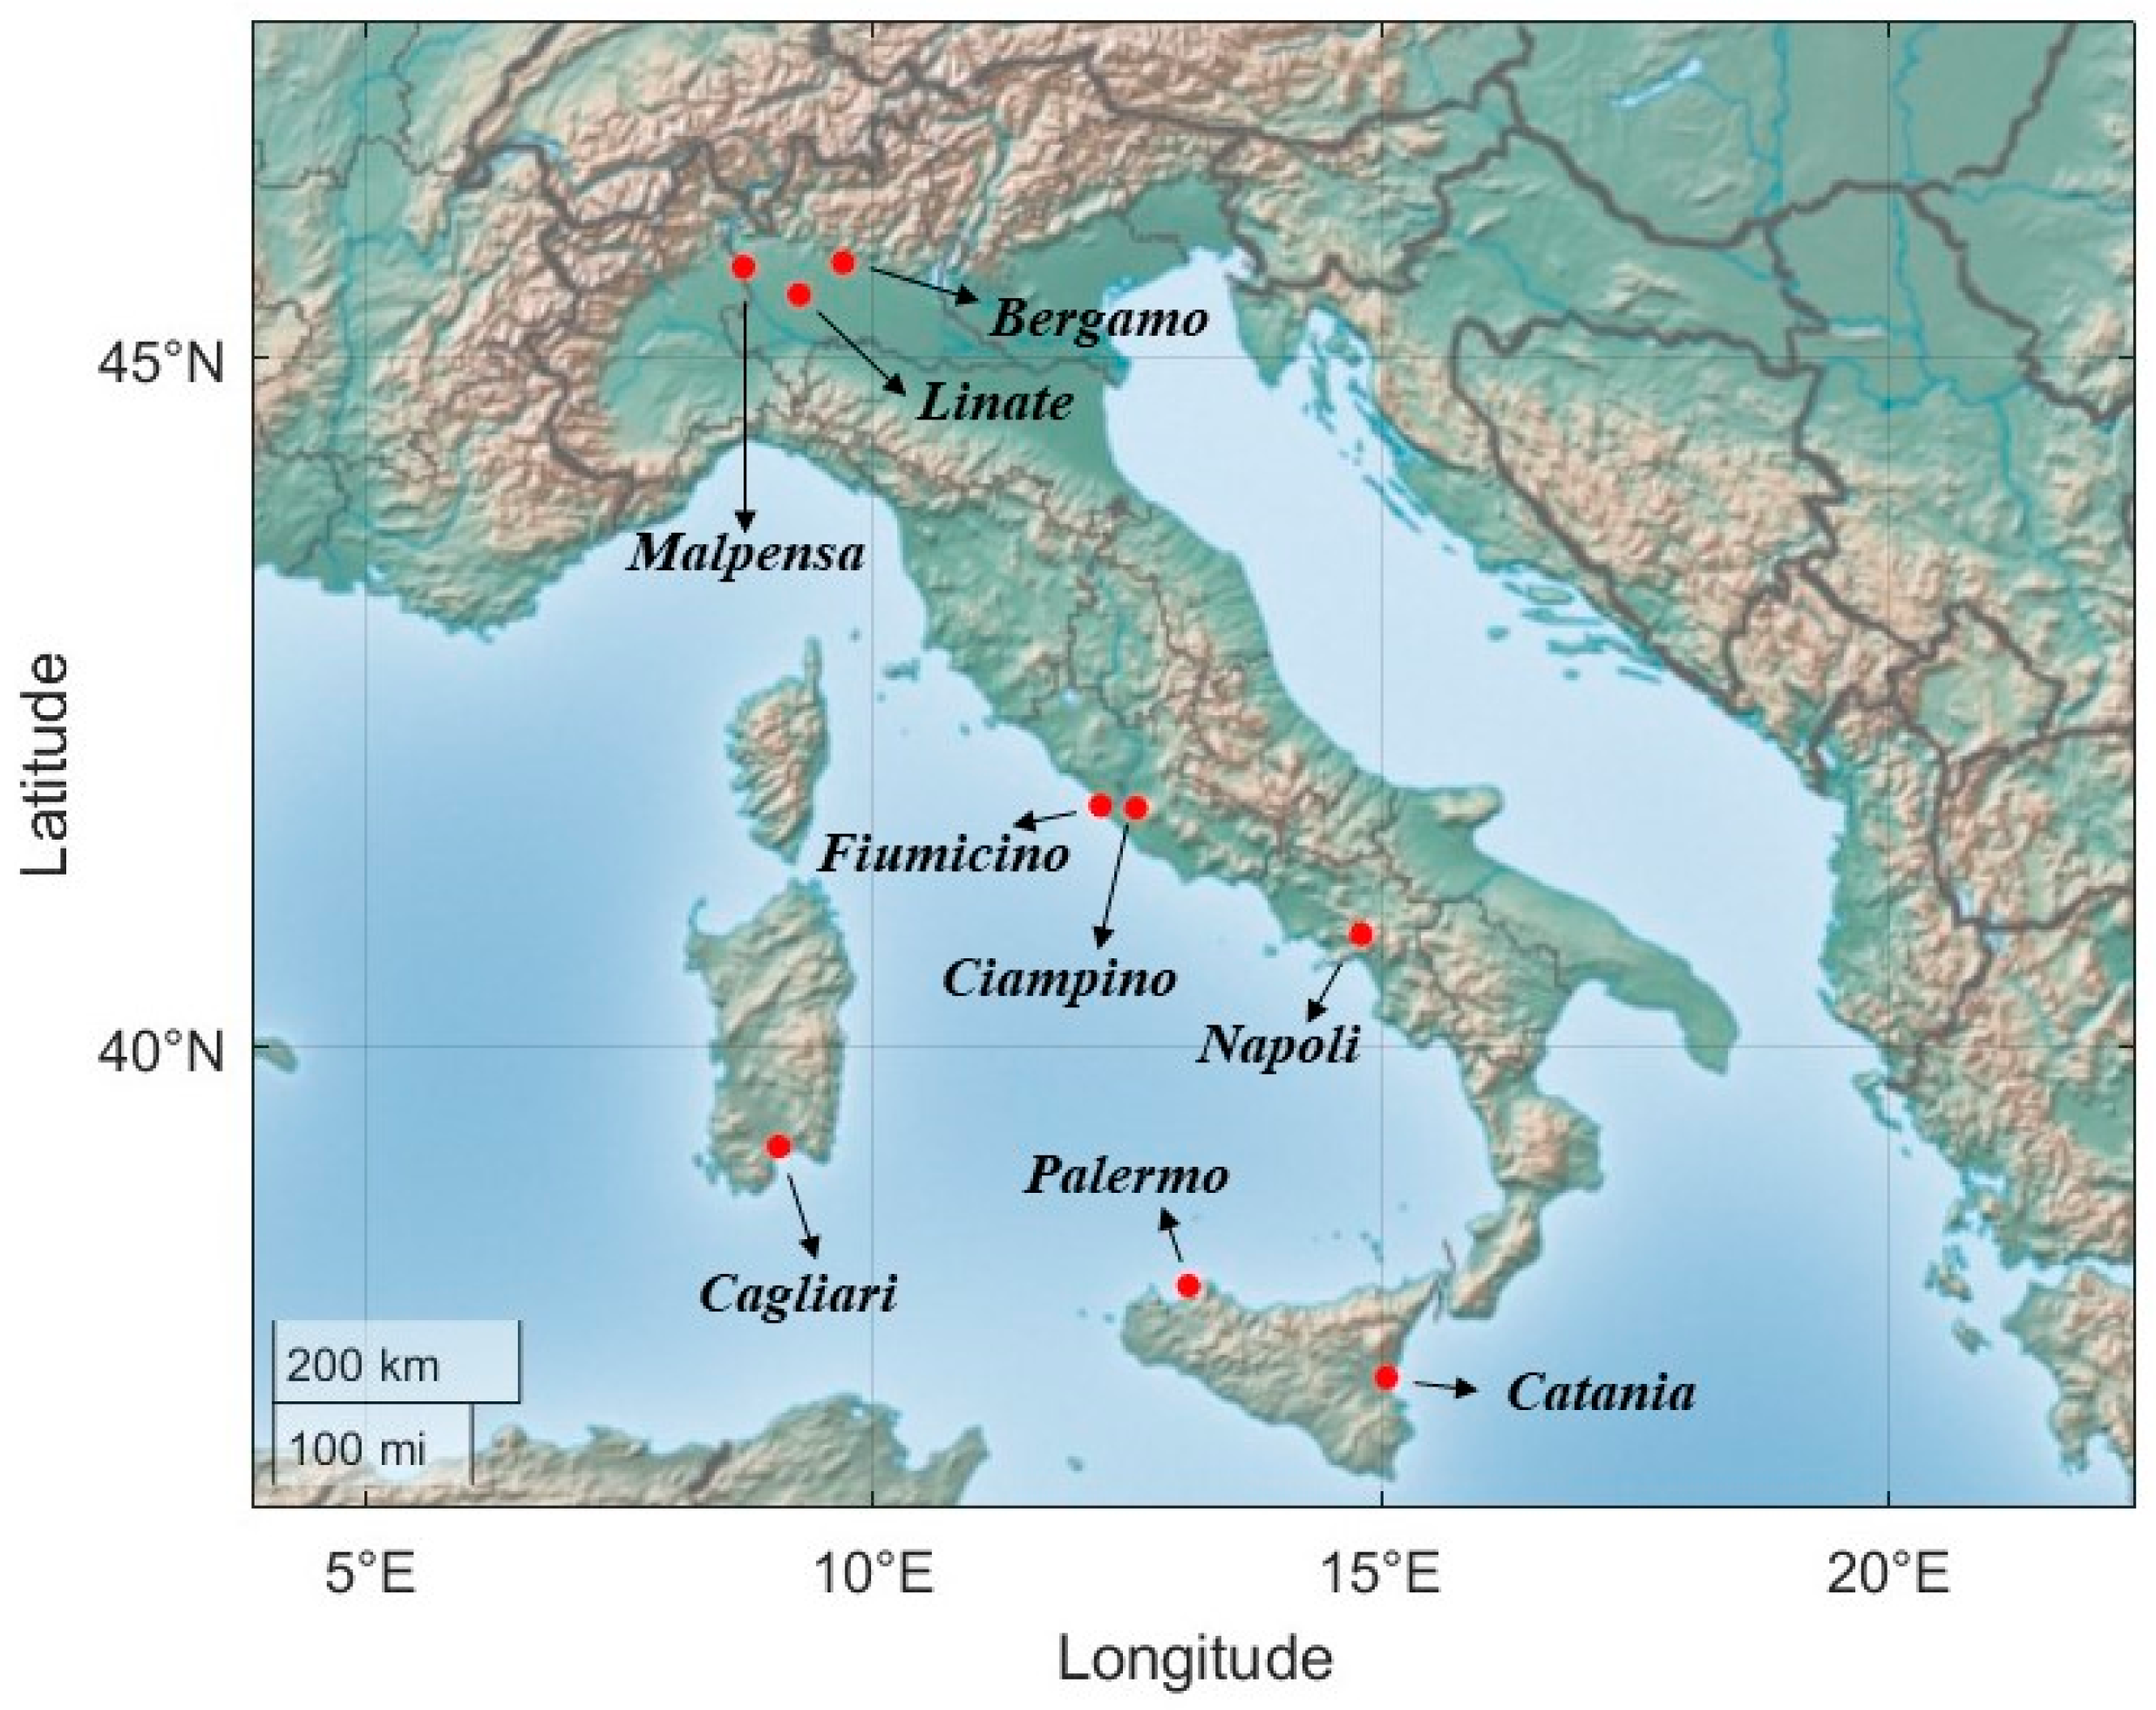
3.1. Study Area

The climate-risk assessment framework for extreme precipitation events was applied to the following Italian airports: Milano-Malpensa, Bergamo Orio, Milano-Linate (in Lombardia region, center north of Italy), Roma-Fiumicino and Roma-Ciampino (Lazio region, center of Italy), Napoli-Capodichino (Campania, south of Italy), Palermo-Punta Raisi, Catania-Fontanarossa and Cagliari-Elmas (Sicily and Sardinia, islands) (Figure 1). These airports play an important role in the Italian and international socio-economic context. The three airports around the Milan area (Linate, Malpensa and Bergamo), with almost 45 million passengers in transit every year, represent the second busiest airport system in Italy after Rome. The Rome airport system (Fiumicino and Ciampino airports), with over 50 million passengers per year (2019), is the largest in Italy and among the largest in Europe. Napoli-Capodichino is located about 4 km from the center of Naples, and it is the second airport of Southern Italy, where the greatest number of passengers pass every year (11 million in 2019), and the fourth national airport after Rome-Fiumicino, Rome-Ciampino, Milan-Malpensa and Bergamo Orio al Serio. The Sicilian airport system consists of two main airports: Catania-Fontanarossa (located 4.3 km south-west of Catania) and Palermo-Punta Raisi (situated 35 km west of the city of Palermo). The first is the main airport in Sicily, while the second is the third airport in Southern Italy for number of passengers, after Napoli-Capodichino and Catania-Fontanarossa. Finally, the Cagliari Elmas Airport, in Sardinia, is located in the territory of Elmas (near Cagliari), and it is the major airport of the Sardinia Island in terms of passengers [25].

3.2. Conceptual Approach for Quantifying Climate Risk for the Selected Airports

This study applies the risk-assessment framework proposed by De Vivo et al. (2022) [15], which defines a specific methodology for calculating the climate risk related to airports in the Mediterranean area with a focus on extreme temperatures, extreme precipitation, and sea-level rise. In the present work, we considered the framework related to the risk due to extreme precipitation events. Figure 2 shows the methodological approach used in the study and the key steps are summarized below. In order to achieve the final risk, we used the following procedure, which has been widely used in several studies [19,26,27,28]:
  • Assessment of hazard, exposure and vulnerability indicators;
  • Normalization of hazard, exposure and vulnerability data;
  • Calculation of the three synthetic indices (H, E, V);
  • Estimation of climate risk levels (R).
Each risk component was assessed through a list of indicators chosen from a literature analysis referring to the airport context. In this framework, hazard refers to the potential occurrence of extreme precipitation events that could damage the airport and compromise its operations. Indices related to extreme precipitation events were defined using absolute thresholds and thresholds based on percentiles. They describe the climate conditions (increase in rainfall frequency and intensity) under which physical damage to infrastructure might occur (e.g., flooding of runway or taxiways) and airport operations could be affected (e.g., cancellations of flights, closure of airports, etc.). The exposure sample refers to the different airports components, divided into the air-side (i.e., runways, taxiways, tower and aprons) and land-side areas (i.e., offices, terminals, airport access systems and parking areas) that may be affected and damaged by extreme precipitation events. For sensitivity and adaptive capacity factors, physical, socio-economic, social, and institutional indicators were included. These characteristics define the degree to which the airport system can be affected by climate change and its ability to adapt or cope with the related consequences. Once the indicators were identified and calculated, they were normalized using the min–max method [29] (Equation (1)):
X i , 1 = x i x m i n x m a x x m i n
where x i represents the individual data point to be transformed, x m a x corresponds to the highest value and x m i n to the lowest value for each indicator. In this way, every parameter X i , 1 is identified by a numerical value from 0 to 1, where the value 0 represents the optimal level, while the value 1 reflects the most critical estimates [15,19,26].
The nominal indicators (i.e., non-numerical, for example, for presence or absence of green area, the presence of adaptation plan, etc.) were normalized into five classes, in which the lowest class represents optimal conditions and the highest class the most critical ones, according to the scheme presented in Master Adapt (2018) [30]:
-
Class 1: optimal (numeric score: 0.1);
-
Class 2: rather positive (numeric score: 0.3);
-
Class 3: neutral (numeric score: 0.5);
-
Class 4: rather negative (numeric score: 0.7);
-
Class 5: critical (numeric score: 0.9).
The absence and presence of specific adaptation measures were assessed with the “critical class” score equal to 0.9 and the “optimal class” score equal to 0.1, respectively. Concerning the mitigation initiatives, the highest score (0.1) was attributed to the Fiumicino and Ciampino airports, as they achieved the highest level of carbon accreditation (Level 4); in airports with Level 3+ (Malpensa, Linate, Bergamo, Napoli), the score corresponds to the “rather positive” class equal to 0.3, while those with the Level 2 (Palermo) and Level 1 (Cagliari) 0.5 and 0.7, respectively. In the case of Catania airport, which has not achieved any accreditation, the score assigned is equal to 0.9. With respect to guidelines for adaptation to climate change, since no airport has a specific adaptation plan, none achieved the maximum score. A score of 0.3 was assigned if there is a regional plan or strategy for adaptation to climate change or local initiatives (urban level), and 0.5 if it is being developed. In the case of adaptive-capacity indicators, lower values indicate positive conditions for vulnerability, while higher values refer to negative conditions. In this case, the range of values of the indicator must be inverted to have them all in the same normalization ranking [30]. To achieve this, the indicator value was subtracted from 1 to determine the final standardized value.
After normalizing the data, it was necessary to calculate the synthetic indicator for each risk component. The Risk Supplement to the Vulnerability Sourcebook [31] recommends a method called weighted arithmetic aggregation (Equation (2)):
I C = w 1 · x 1 , 1 + w 2 · x 2 , 1 + w n · x n , 1 1 n w
Equation (2) allows estimation of the synthetic indicator of the I C risk component by combining the normalized values of the indicators x i , 1 previously weighted by associating the relative weights w i . By applying a uniform weighting ( w = 1), the indicators are simply summed and divided by the number of indicators. The Vulnerability Index formula implies a simple average between sensitivity and adaptive-capacity indices. Based on this, the risk index was calculated through Equation (3) [1,2,15,19,31]:
R = H × E × V
To obtain comparable hazard, exposure, vulnerability and risk classes, we applied the “quantile classification method” implemented in ArcGIS in which each class contains an equal number of values. This approach is well-suited to distributed data in a linear manner. According to GIZ (2017) [31], we adopted the following five qualitative classes for the representation of the risk and its various components: “very low”, “low”, “intermediate”, “high”, and “very high” [15,19,31].

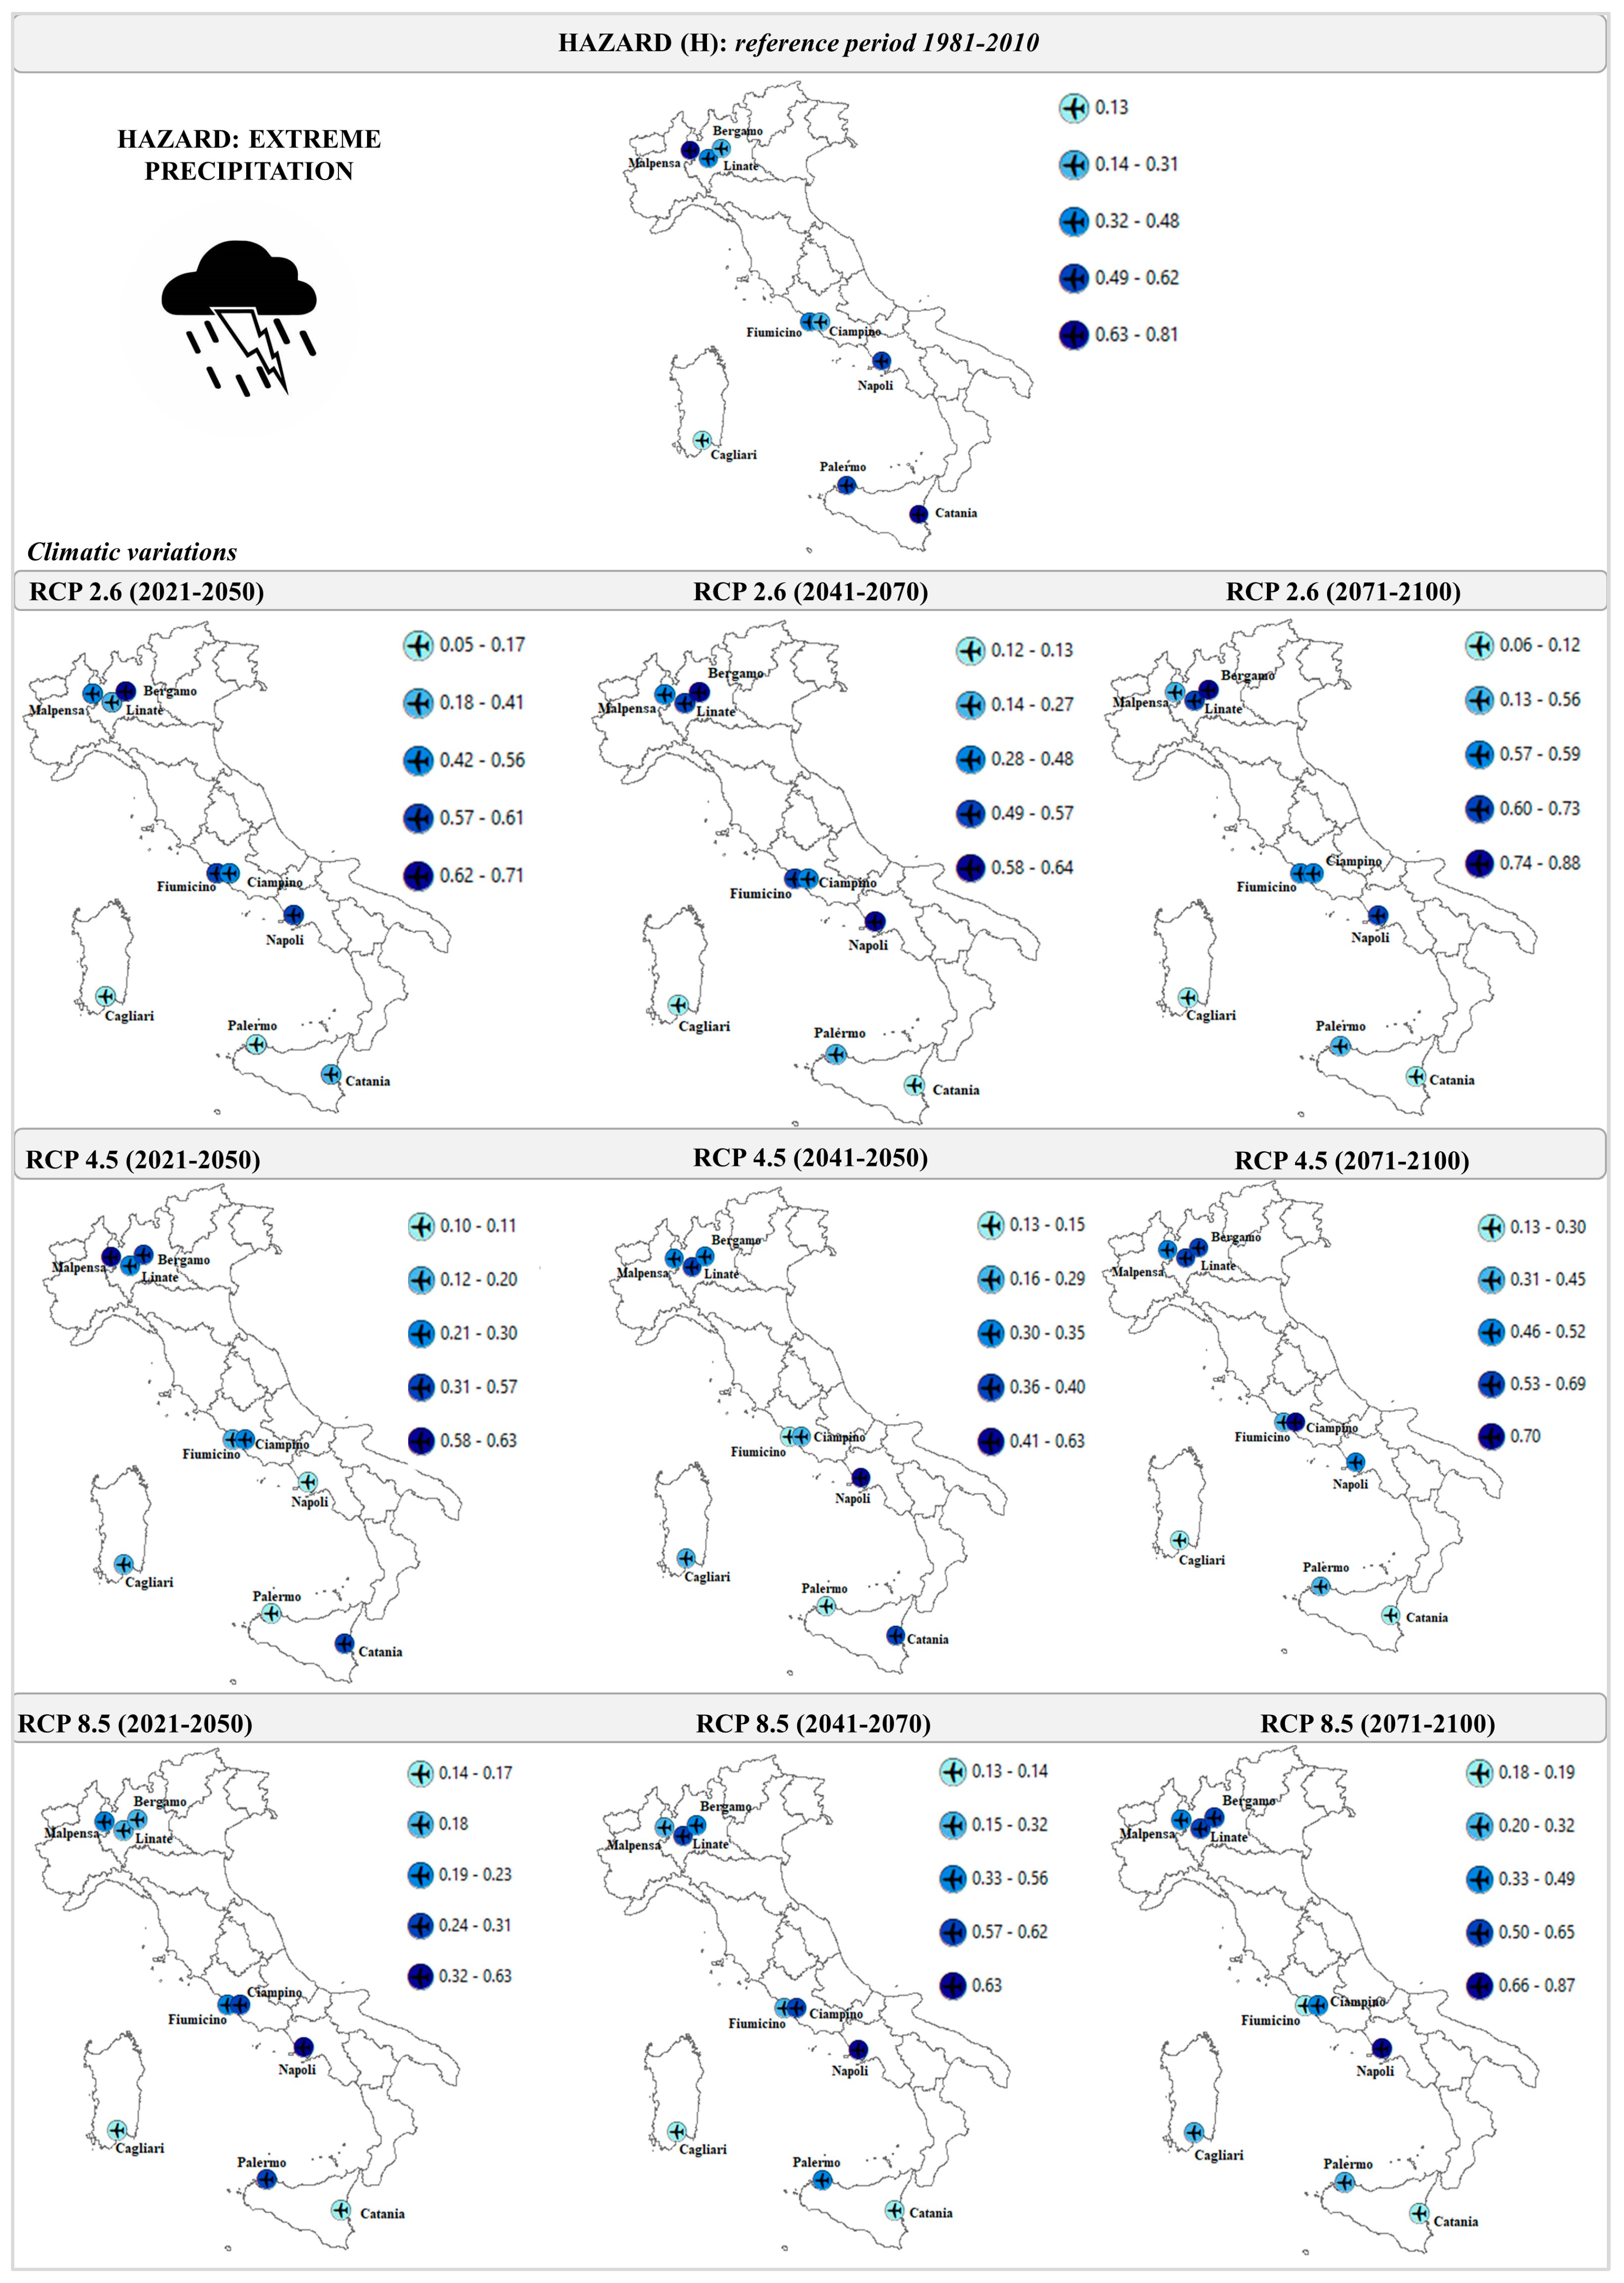
3.3. Datasets Used to Calculate the Climate Hazard

This section describes the datasets used to calculate the present and future climate indicators over the areas of interest. In this work, the precipitation indicators of the past were developed for the reference period 1981–2010, starting from the daily precipitation variable of gridded dataset UERRA MESCAN-SURFEX [16]. This dataset is a downscaled surface analysis system of the UERRA-HARMONIE regional reanalysis (with a resolution of about of 11 km) forced by the global ERA-Interim reanalysis data [32]. It has a spatial resolution of 5.5 km over Europe, from January 1961 to July 2019, and it is freely available as a product of the Copernicus Climate Change Service (C3S). We decided not to use Copernicus European Regional Reanalysis (CERRA), (available at Copernicus regional reanalysis for Europe (CERRA)|Copernicus) [33], despite it being a more up-to-date dataset, because it does not cover the reference period chosen (it starts from 1984 rather than 1981).
Concerning the climate analysis of the future, the variation in extreme precipitation indicators was performed using the high-resolution simulation (about 12 km) of different regional climate models (RCM) included in the EURO-CORDEX initiative [17,18]. The simulation considered was obtained according to the RCP 2.6, RCP 4.5, RCP 8.5 IPCC scenarios (i.e., multi-scenarios approach). RCP 2.6 assumes “aggressive/immediate” strategies and ambitious mitigation to ensure greenhouse-gas emissions approach zero in around 50 years. RCP 4.5 is a “stabilization scenario”, which provides the stabilization of the greenhouse-gas concentration by the end of the century at about double the pre-industrial levels. The temperature increase consistent with this scenario is around 3 °C at the end of the century compared to pre-industrial levels (around 2 °C compared to today) [24,34]. The RCP 8.5 can be considered the “worst case” scenario [35]: it excludes any climate-mitigation policies, leading to nearly 5 °C of global warming by the end of the century. The climate variation was evaluated over the future periods 2021–2050 (near time horizon), 2041–2070 (medium time horizon), 2071–2100 (long time horizon) with respect to the reference period 1981–2010. The analysis was developed using a multi-model ensemble averaging of EURO-CORDEX data, as carried out in several literature studies [19,36,37,38]. The dispersion was quantified through the calculation of the standard deviation: a low standard deviation value indicates high agreement between the climate models of the EURO-CORDEX ensemble, and vice versa [39]. For a better spatial representation of the study areas, daily precipitation generated by the Regional Climate Models was extracted considering the average value over a 3 × 3 grid box including the airport site (the same was performed for the UERRA dataset).

3.4. Information from Airport Systems Needed to Quantify the Exposure

Exposure indicators summarize the characteristics of the airports under analysis. We considered several components of the airports as exposure samples, divided into air-side and land-side areas (see Table 1). The air-side components include the structures used for the movement of aircrafts, such as runways, taxiways, tower, and aprons, while the land-side components refer to the public access areas such as offices, terminals, airports access systems and parking areas. These components may suffer different forms of damage due to extreme precipitation events (e.g., runways and taxiways flooding, delay, and cancellation of the flights). The various structures of an airport are interconnected, and the interruption of the services offered by a single component can create criticalities in other activities. For example, if the runway is flooded due to heavy rainfall, it can lead to flight delays or cancellations, or, in the worst case, the closure of the airport. Most of the information relating to the exposure was extrapolated from “Atlante degli aeroporti italiani” (2010) [40], which contains, in detail, all the technical information of Italian airports.
Table 1 lists the exposure indicators for each airport. The names of the airports are reported with the following abbreviations: Malpensa (MAL); Linate (LIN); Bergamo (BERG); Fiumicino (FIU); Ciampino (CIA); Napoli (NAP); Palermo (PAL); Catania (CAT); and Cagliari (CAG). Unavailable data is reported as NA (i.e., Not Available).

3.5. Vulnerability Index: Information Regarding the Sensitivity and Adaptive Capacity of the Airports Analyzedrr

3.5.1. Sensitivity Components

Concerning vulnerability, we selected specific sensitivity and adaptive-capacity indicators. More specifically, sensitivity includes physical indicators such as age, building assets, soil sealing, underground infrastructures, and the percentage of flooded areas (Figure 2). The age was defined starting from the year of construction of the selected airports. Napoli Capodichino is the “oldest” airport, built in 1911 (111 years old), while the airport of Palermo is the most recent, built in 1960. Data related to the airport asset conditions (e.g., buildings in bad condition) are not available. The information about the soil sealing refers to the surface of the airport grounds and it is contained in the “Atlante degli aeroporti italiani, 2010” [40]. Fiumicino and Malpensa have the highest soil sealing with 1590 hectares (ha) and 1235 ha, respectively. In terms of the underground infrastructure, all the airports’ underground structures were considered (available from the “Atlante degli aeroporti italiani 2010” report) [40]. Regarding the social indicators, air traffic, passengers, and parking access were selected (see Figure 2). There is no data about the access to parking areas while the number of passengers and air traffic were obtained by consulting the “Assaeroporti” website [41] and refer to the year 2019. Fiumicino and Malpensa are the airports with the highest number of passengers (43,532,573 and 27,000,000, respectively) and the highest number of movements in 2019 (309,783 and 201,050, respectively). We decided to consider the year 2019 as it was not affected by the COVID-19 pandemic situation. Sensitivity indicators are listed in Table 2.

3.5.2. Adaptive-Capacity Components

Regarding adaptive capacity, among the selected physical indicators, there are drainage systems, bio-infiltration/permeable pavements and monitoring and alarm systems. Efficient drainage systems are present in all the analyzed airports, while alarm and monitoring systems for specific extreme events are not always present. For example, the Malpensa monitoring system alerts the airport services responsible for cleaning the runways and parking areas of different weather conditions and the state of the asphalt [42]. Milano Linate airport has installed three weather stations that allow the collection of real-time data on the weather conditions at the airport and the state of the runways [43]. Bergamo airport is equipped with highly permeable flooring (namely, Geoplast Acquabox) which allows the removal of surface rainwater from the runway, to ensure infiltration of water into the natural soil through special underground drainage basins [44]. Regarding indicators with institutional information, an insurance policy (for extreme events), risk awareness, and the presence of guidelines for adaptation plan to climate change were considered. No insurance policy for extreme events is available at any of the analyzed airports. Concerning risk awareness, all airports have implemented strategies to mitigate climate change and reduce CO2 emissions. The Airport Carbon Accreditation Program is currently the only institutionally approved program which independently assesses and recognizes the efforts of airports to manage and reduce their CO2 emissions. This program provides different levels of accreditation [45]. Thanks to their active combatting of climate change, Ciampino and Fiumicino obtained the Airport Carbon Accreditation 4+ “Transition” at the end of 2020 (the maximum certification level introduced by the ACI). Malpensa, Linate, Bergamo, and Naples airports reached level 3+ neutrality of ACI a few years ago, committing to the fight against climate change by reducing emissions and energy consumption. [46,47,48]. Palermo airport achieved level 2 in 2021, reducing carbon emissions through the production of energy from renewable sources [49], while Catania airport has not obtained any certification. Cagliari airport reached accreditation Level 1 in 2017 and aims to complete the emission-reduction process in the next two years [50]. Another important aspect relating to adaptive capacity is the presence or absence of specific adaptation plans and/or strategies developed and implemented by the airport. None of the airports considered in the study has an adaptation plan; however, some exist at regional and local levels (e.g., “Regional action document on adaptation to climate change” in Lombardy; “Action plan for sustainable energy and climate” for the city of Rome; “Strategy for the green city” in Naples). Table 3 lists the adaptive-capacity indicators.

4. Results

4.1. Hazard Assessment: Extreme Precipitation Events

The assessment of the current and expected climate conditions in the airport areas, based on the reanalysis dataset and climate projections, allowed the characterization of the expected evolution of the hazard related to extreme precipitation events in the next decades considering different GhG concentration scenarios (RCP 2.6, RCP 4.5 and RCP 8.5 IPCC scenarios). The multi-scenario and multi-model approach permits evaluation of the uncertainty associated to the result, a relevant aspect for decision makers and stakeholders.
For the reference period, the values of indicators are more pronounced for Malpensa, Linate, Napoli, Fiumicino, and Palermo airports, especially for TR100 and TR150 (Table 4).
In the future scenarios (see Figure 3), the variation in TR indicators increases overall, except in the case of the Catania, Palermo, and Cagliari, where a slight decrease is recorded for the RCP 2.6 scenario. For the other airports, both the RCP 2.6 and RCP 4.5 scenarios project an increase in the climate variation (between 15 and 20%), especially in the medium term 2041–2070, particularly for the airports of the Milano area; this is less pronounced for the airports of the islands. This variation increases significantly (between 30% and 40%) in the RCP 8.5 scenario, particularly in the long-term horizon (2071–2100). The uncertainties associated with these variations appear particularly significant for airports in the island areas (from 20% to 35%), for all scenarios (Table A1, Table A2 and Table A3). These uncertainties are derived from various sources such as the uncertainty of the scenario, the uncertainty of the Global Climate Models (GCM), the uncertainty of the Regional Climate Models (RCM), the internal variability of the climate and the uncertainty related to the various interactions (RCM—GCM, RCM—scenario, GCM–scenario) [51].
Figure 4 shows that in the reference period (1981–2010), the airports characterized by “high” and “very high” hazard scores are Palermo, Catania, Napoli and Malpensa, then followed by Fiumicino and Linate (“intermediate”) and Ciampino, Bergamo and Cagliari, respectively, with “low” and “very low” scores. Under the RCP 2.6 scenario, Cagliari is placed in the lowest class while Palermo and Catania are characterized by an important decrease in hazard, passing from the “very high” class of the observed period to the lowest one in the future period. Bergamo, Linate, and Fiumicino show an increase in the hazard index, while Malpensa shows a decrease. In the RCP 4.5 and RCP 8.5 scenarios, the Milan area airports are characterized by a pronounced increase in hazard, especially for the long-term horizon. The same is true for Fiumicino, Ciampino, Naples and Palermo, where hazard is more pronounced in the worst-case scenario and in the short and medium term. On the other hand, Cagliari and Catania show a slight decrease in hazard, which is more evident in the RCP 8.5 scenario.

4.2. Vulnerability Results: Sensitivity and Adaptive Capacity of the Exposure Sample

The results for exposure are influenced by the structural characteristics of the considered airports. Although airports systems have a long lifespan, the air-side and land-side components are very sensitive to the direct and indirect impacts of climate change. Managing these impacts is much more expensive (especially from an economic point of view) for large airports. In fact, Malpensa and Fiumicino are characterized by a very high exposure index, followed by Fiumicino and Linate. The intermediate class includes Bergamo and Cagliari while Palermo, Ciampino, Napoli and Catania are, instead, characterized by the low and very low index (Figure 5).
Based on the combined effects of the sensitivity and adaptive-capacity indexes, the vulnerability assessment of the airports is found to be particularly heterogeneous (Figure 5). Fiumicino, Napoli and Malpensa airports present “very high” and “high” levels of vulnerability, respectively, with indices values equal to 0.50, 0.33 and 0.34. These results depend on the sensitivity values which appear more pronounced for Malpensa and Fiumicino (“very high class”) due to the greater impermeability of the soil and the high number of passengers and movements. On the other hand, both due to the high awareness of climate risk and the presence of efficient drainage and warning systems for extreme events, Malpensa and Fiumicino are confirmed as the airports with the highest level of adaptation. On the contrary, Napoli has a very low level of adaptation which determines a high level of vulnerability. For Bergamo and Catania, the relationship of sensitivity and adaptability indicators produces “intermediate” levels of vulnerability with a synthetic index equal to 0.23 and 0.30, respectively. Catania is, in fact, characterized by an “intermediate” level of sensitivity and a “very low” class of adaptive capacity while the Bergamo airport shows a “low” level of sensitivity and an “intermediate” adaptive capacity.

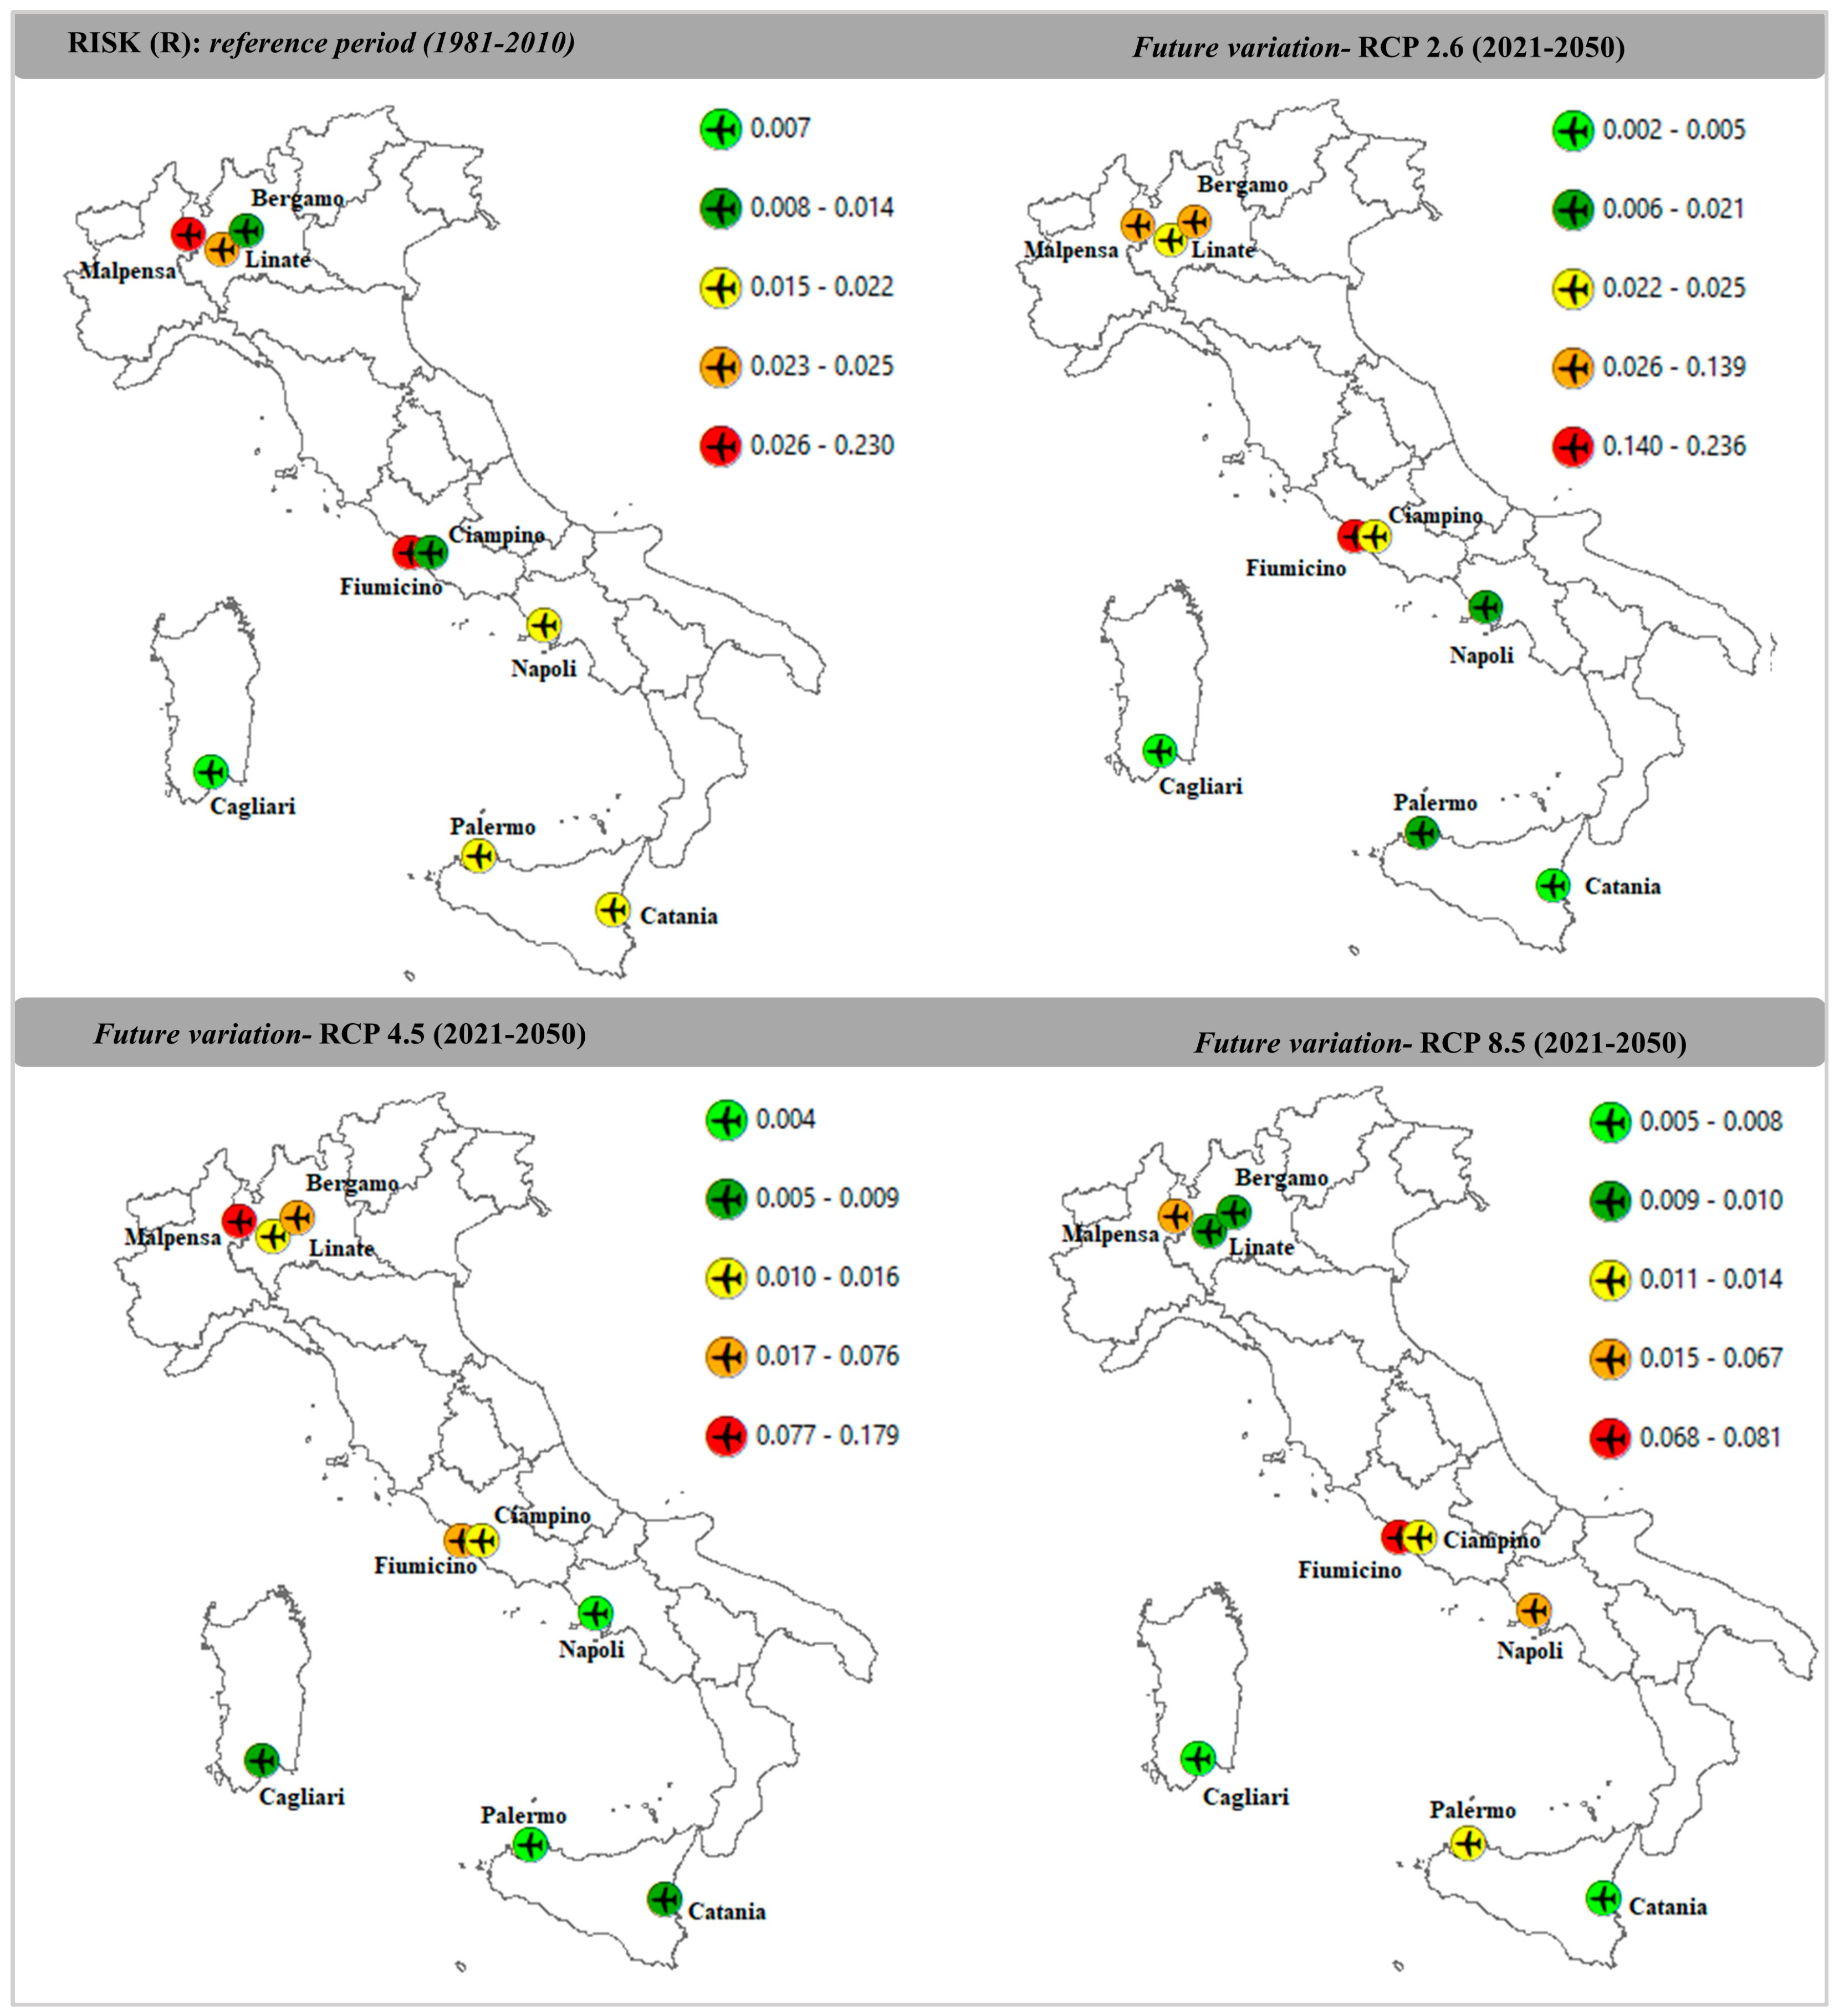
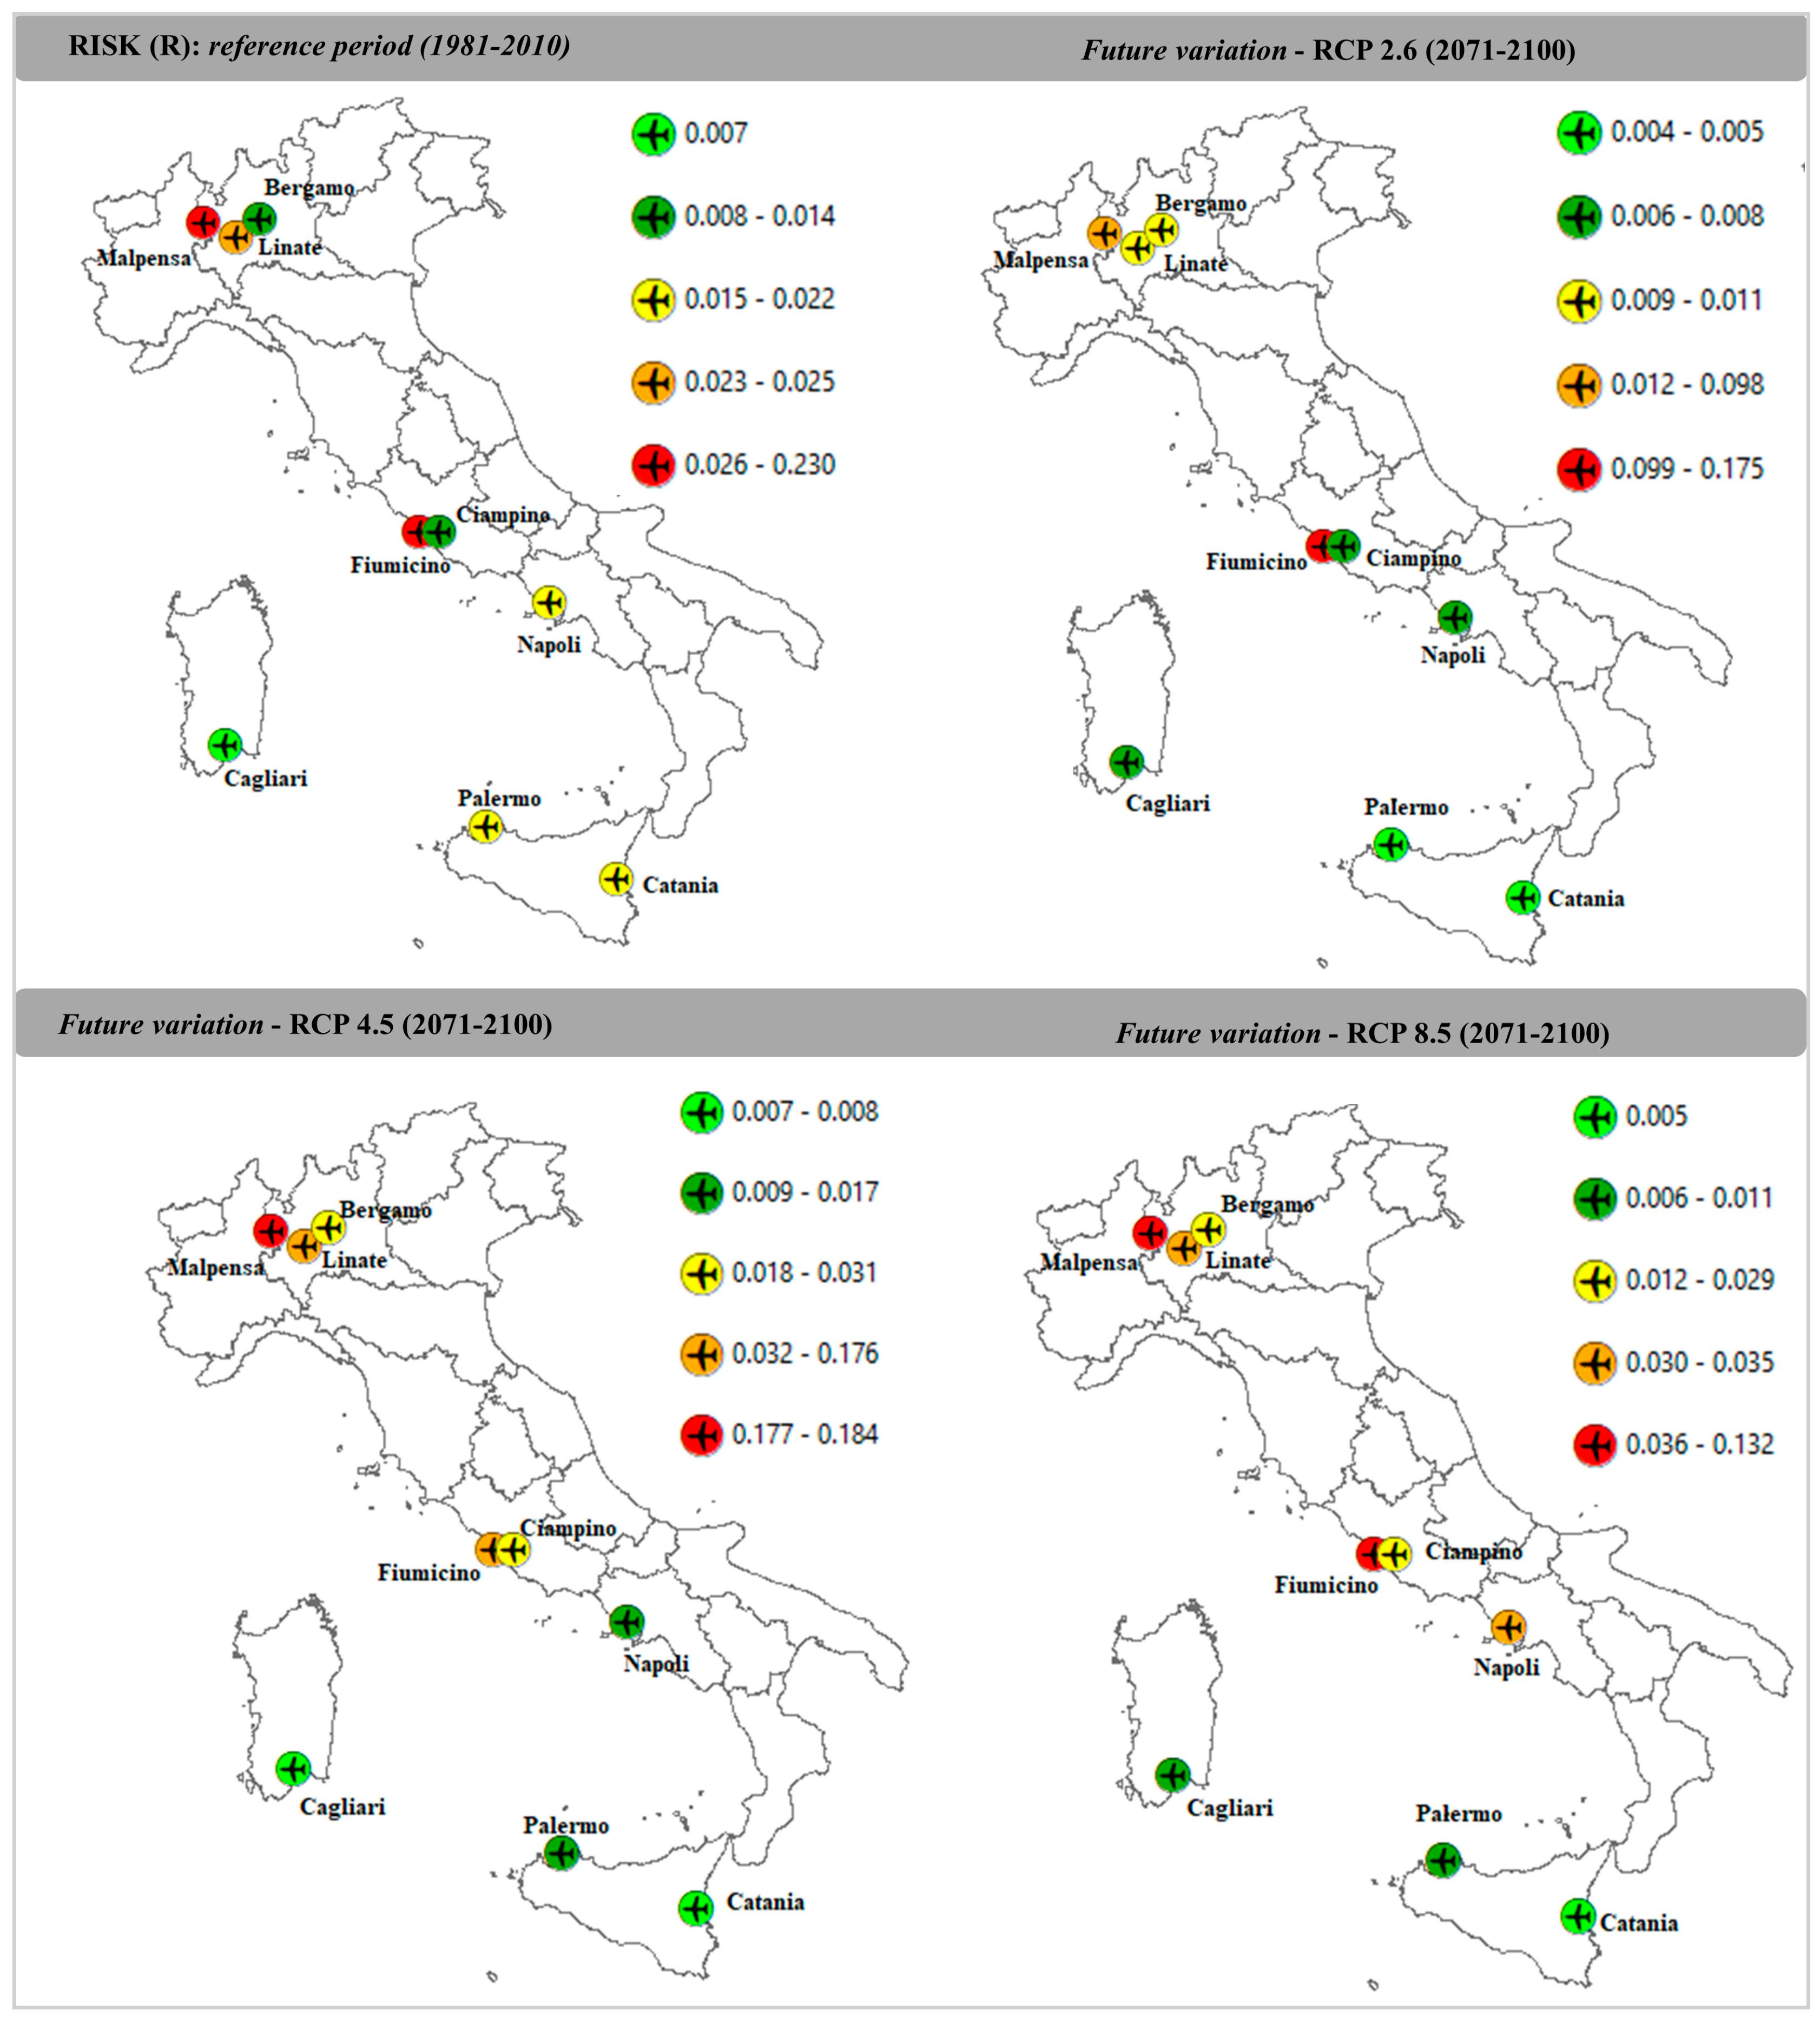
4.3. Current and Future Climate Risk for the Selected Airports

The interaction between the hazard, exposure and vulnerability indices produces a rather heterogeneous final risk index based on the frameworks analyzed and the period considered. In general, the results underline that the final risk strongly depends on the variation in the hazards under different scenarios (RCP 2.6, RCP 4.5 and RCP8.5), but also on the exposure index. In the reference period (1981–2010), the risk appears rather heterogeneous for the various airports studied. Malpensa, Fiumicino, and Linate are classified as the highest risk airports. These results are supported both by the important climatic variations observed in terms of the frequency and intensity of precipitation phenomena (Table 4) that determine a high level of hazard, as well as by a greater exposure and vulnerability, especially for Fiumicino and Malpensa. Intense precipitation events which occurred in the past have caused several types of damage to this infrastructure, including the flooding of parking areas, runways, and aprons with the consequent interruption of air traffic and inconvenience for passengers. The Napoli, Palermo and Catania airports are characterized by an intermediate level of risk, despite the high hazard values. This is due to their moderate vulnerability, but above all to a rather low exposure. On the other hand, Ciampino, Bergamo and Cagliari received the low risk level. These results are supported by moderate climate hazard (Figure 4) and by a modest level of exposure and vulnerability (Figure 5).
For the period 2021–2050 (Figure 6), Malpensa and Fiumicino are classified in the high and very high risk class in all scenarios, to which Bergamo is added in the RCP 2.6 and RCP 4.5 and Napoli in the worst-case scenario. Cagliari, Palermo, Catania, and Linate are characterized by a general decrease in the level of risk, which is more pronounced for the Linate airport. On the other hand, Ciampino passes from the low risk to intermediate in all scenarios.
In the medium-term horizon 2041-2070 (Figure 7), Bergamo shows an increase in the level of risk from low in the reference period, to high and intermediate, respectively, in the RCP 2.6, 4.5 and 8.5 scenarios. Malpensa, Fiumicino, and Linate are confirmed as the airports with the highest risk. Instead, the islands’ airports show a slight decrease in risk and Ciampino and Napoli remain almost unchanged, with a moderate increase in the case of Naples in the RCP 4.5 scenario.
In the long-term horizon 2071–2100 (Figure 8), Malpensa and Fiumicino are characterized by high risk, in addition to Linate in the RCP 4.5 and RCP 8.5 and Napoli airport in the worst scenario. Cagliari, Palermo, and Catania are in the lower class while Ciampino and Bergamo are in the intermediate one for RCP 4.5 and RCP 8.5. These variations in the risk over the future period primarily reflect changes in hazard indicators.

5. Discussion

The interaction between the various components of the risk produced rather heterogeneous results between the analyzed airports, depending both on the evolution of the hazard in the various future scenarios and on the intrinsic characteristics of the systems, as well as on their adaptive capacity. Current variation in climate hazard indicators and related future projections often depend both on the areas considered and on the season of the year (e.g., a large increase in precipitation is projected in winter over central and northern Italy) [22,23]. A significant increase in extreme rainfall events occurred, in general, for all airports, especially for those on the island, such as Palermo (except in the RCP 2.6 scenario where a slight decrease is recorder). However, this increase appears to be more pronounced for the airports located in the north (Malpensa, Linate, and Bergamo), in the center (Fiumicino and Ciampino) and in the south (Napoli). These results are consistent with the climate variation across Italy [52] and with the findings of Bucchignani et al. (2021), which projected a significant increase in precipitation indexes, especially under the RCP 8.5 scenario [22]. However, the assessment of how these phenomena cause concrete damage is still a particularly complex issue that requires more precise information and high-resolution climate models that correctly reproduce the phenomena on a local scale. Indeed, this study showed that the standard-deviation values associated with the ensemble of the regional simulation available in the framework of Eurocordex program are quite pronounced in the case of precipitation (see Appendix A for further details). In fact, the heavy-precipitation events are best represented by models with a resolution from 11 to 3 km [23,53]. An example on a European scale is provided by a dataset available (with a resolution of about 2 km) within the Copernicus C3S platform which provides, for 20 European cities (including Milano), assessments of the risks originating from extreme rain events [54,55].
In general, the analyses concerning the climate hazard showed that the adoption of a mitigation scenario (RCP 2.6) can lead to a substantial decrease in climate hazard compared to the stabilization scenarios with a higher concentration, such as RCP 4.5, and compared to the scenario with high emissions and no mitigation strategy (RCP 8.5). However, a decrease in hazard does not necessarily translate into a drastic reduction in risk, as the calculation of the final index is strongly influenced by exposure, sensitivity, and adaptive-capacity factors. In particular, the adaptive capacity which, if high, should mitigate the climate risks, appears very low for southern airports such as Napoli, Cagliari, Palermo, and Catani. The airports of Linate, Malpensa, Bergamo, Ciampino and Fiumicino seem to be better prepared to face the challenges of climate change. These results are consistent with the adaptive-capacity index calculated at regional and provincial levels in the CMCC report [52], which is characterized by higher values in the northern regions than in the other areas of Italy. However, part of the southern provinces could be rewarded by the increase in their resilience in recent years. For these reasons, the evolution of infrastructure risk could be better conducted considering not only the evolution of hazard data (different climate scenarios), but also those concerning adaptation (with additional adaptation vs. without additional adaptation) or socio-economic scenarios (e.g., population growth, economic development) [31].

6. Conclusions

In this study, the methodology proposed in De Vivo et al. (2022) [15] was applied to quantify the present and expected climate risk for some Italian airports through the calculation of specific hazard, exposure, and vulnerability indicators, according to IPCC 2022. The results obtained show that Fiumicino, Malpensa, Bergamo, Linate, and Napoli are the airports with the highest risk related to extreme precipitation for all the analyzed scenarios. The results of the analysis allow the establishment of planning actions for climate adaptation to be adopted at local level (e.g., grey, green and soft measures). An example of soft measures could certainly be the strengthening of early-warning and monitoring systems with sensors as well as increasing the risk awareness; green measures include an increase in vegetated area, while grey measures include the creation of enhanced drainage systems in areas most subject to flooding in the event of heavy precipitation [56]. The study showed that in the Italian context there are not many adaptation strategies in place, despite the need to make infrastructure more resilient to climate change having emerged both at the European level (with the new EU strategy COM (2021) 82 of 24.2.2021 on adaptation to climate change) [57] and at the national level (with the report “Cambiamento Climatico, Infrastrutture e Mobilità”) [24]. In this context, the risk analysis proposed in this research, since it is based on quantitative data and provides the uncertainty associated with the climate models, could be useful in supporting stakeholders in the decision-making process on intervention priorities.

Author Contributions

Conceptualization, C.D.V., P.M. and G.B. (Giorgio Budillon); methodology, C.D.V., G.B. (Giuliana Barbato), M.E. and V.C.; software, C.D.V. and G.B. (Giuliana Barbato); validation, C.D.V., G.B. (Giuliana Barbato), M.E. and V.C.; formal analysis, C.D.V.; investigation, C.D.V.; resources, C.D.V.; data curation, C.D.V., G.B. (Giuliana Barbato) and M.E.; writing—original draft preparation, C.D.V.; writing—review and editing, G.B. (Giuliana Barbato), M.E., V.C., G.B. (Giorgio Budillon) and P.M.; supervision, P.M. All authors have read and agreed to the published version of the manuscript.

Funding

This research received no external funding.

Institutional Review Board Statement

Not applicable.

Informed Consent Statement

Not applicable.

Data Availability Statement

No new data were created or analysed in this study. Data sharing is not applicable to this article.

Acknowledgments

The authors thank Giuseppe Giugliano of the Regional Models and geo-Hydrological Impacts Division (REMHI)—CMCC foundation—for supporting climate data analysis and validation.

Conflicts of Interest

The authors declare no conflict of interest.

Appendix A

This section shows the standard deviation associated with the Ensemble of Euro-Cordex models used in the calculation of the extreme-precipitation indicators for the RCP 2.6 (Table A1), RCP 4.5 (Table A2) and RCP 8.5 (Table A3) IPCC scenarios in the near, medium and long time horizons. The names of the airports are reported with the following abbreviations: Malpensa (MAL); Linate (LIN); Bergamo (BERG); Fiumicino (FIU); Ciampino (CIA); Napoli (NAP); Palermo (PAL); Catania (CAT); and Cagliari (CAG).
Table A1. Standard deviation associated with the Euro-Cordex Ensemble models used to calculate the extreme-precipitation indicators in the near, medium and long time horizons in the RCP 2.6 scenario.
IndicatorsMALLINBERGFIUCIANAPPALCATCAG
Standard Deviation 2021–2050PREC99PRCTILE (days/year)001000100
PREC99.5PRCTILE
(days/year)
000000100
PREC99.9PRCTILE
(days/year)
000000100
TR10PR
(mm)
10%8%12%11%15%21%21%21%17%
TR20PR
(mm)
12%9%13%12%17%23%23%23%18%
TR50PR
(mm)
13%10%14%13%18%25%25%27%20%
TR100PR
(mm)
14%12%15%14%20%28%28%29%23%
TR150PR
(mm)
14%12%16%14%21%31%31%31%25%
Standard Deviation 2041–2070PREC99PRCTILE
(days/year)
001000100
PREC99.5PRCTILE
(days/year)
010000100
PREC99.9PRCTILE
(days/year)
000000100
TR10PR
(mm)
10%6%7%18%16%17%22%15%17%
TR20PR
(mm)
11%6%8%19%18%19%25%19%19%
TR50PR
(mm)
12%7%8%21%20%21%29%24%22%
TR100PR
(mm)
13%7%9%23%22%22%32%28%26%
TR150PR
(mm)
13%7%9%23%22%22%34%30%28%
Standard Deviation 2071–2100PREC99PRCTILE
(days/year)
001011100
PREC99.5PRCTILE
(days/year)
011010100
PREC99.9PRCTILE
(days/year)
000000100
TR10PR
(mm)
15%14%15%14%20%7%12%16%14%
TR20PR
(mm)
16%15%16%15%21%8%14%17%13%
TR50PR
(mm)
17%16%18%15%22%10%19%20%15%
TR100PR
(mm)
18%16%19%15%23%11%23%23%17%
TR150PR
(mm)
19%17%19%15%24%11%25%24%19%
Table A2. Standard deviation associated with the Euro-Cordex Ensemble models used to calculate the extreme-precipitation indicators in the near, medium and long time horizons in the RCP 4.5 scenario.
IndicatorsMALLINBERGFIUCIANAPPALCATCAG
Standard Deviation 2021–2050PREC99PRCTILE
(days/year)
001000100
PREC99.5PRCTILE
(days/year)
000000000
PREC99.9PRCTILE
(days/year)
000000000
TR10PR
(mm)
10%14%10%14%15%12%12%19%19%
TR20PR
(mm)
11%15%11%16%16%14%14%19%23%
TR50PR
(mm)
13%17%12%19%17%16%16%21%31%
TR100PR
(mm)
13%18%13%21%18%18%18%23%33%
TR150PR
(mm)
14%18%14%22%18%18%19%26%34%
Standard Deviation 2041–2070PREC99PRCTILE
(days/year)
001000100
PREC99.5PRCTILE
(days/year)
010000000
PREC99.9PRCTILE
(days/year)
000000000
TR10PR
(mm)
10%13%9%16%15%15%15%22%24%
TR20PR
(mm)
11%14%10%18%16%19%18%26%27%
TR50PR
(mm)
12%16%10%21%17%26%21%27%31%
TR100PR
(mm)
13%17%11%24%17%28%23%28%32%
TR150PR
(mm)
13%18%11%25%18%30%24%29%33%
Standard Deviation 2071–2100PREC99PRCTILE
(days/year)
001011100
PREC99.5PRCTILE
(days/year)
011010100
PREC99.9PRCTILE
(days/year)
000000100
TR10PR
(mm)
13%14%6%17%15%8%22%18%17%
TR20PR
(mm)
14%17%6%20%16%9%24%19%19%
TR50PR
(mm)
15%21%8%25%18%11%26%21%22%
TR100PR
(mm)
16%24%9%31%20%12%28%24%23%
TR150PR
(mm)
17%27%10%32%22%12%29%27%24%
Table A3. Standard deviation associated with the Euro-Cordex Ensemble models used to calculate the extreme-precipitation indicators in the near, medium and long time horizons in the RCP 8.5 scenario.
IndicatorsMALLINBERGFIUCIANAPPALCATCAG
Standard Deviation 2021–2050PREC99PRCTILE
(days/year)
000001100
PREC99.5PRCTILE
(days/year)
000000000
PREC99.9PRCTILE
(days/year)
000000000
TR10PR
(mm)
13%7%11%14%11%15%17%23%17%
TR20PR
(mm)
15%9%13%16%13%17%20%24%19%
TR50PR
(mm)
17%12%16%19%16%20%25%26%24%
TR100PR
(mm)
19%16%19%21%19%25%31%29%29%
TR150PR
(mm)
20%18%21%22%22%29%34%31%32%
Standard Deviation 2041–2070PREC99PRCTILE
(days/year)
011011110
PREC99.5PRCTILE
(days/year)
011000000
PREC99.9PRCTILE
(days/year)
001000000
TR10PR
(mm)
15%11%13%16%16%19%18%14%19%
TR20PR
(mm)
17%13%15%18%18%22%20%16%21%
TR50PR
(mm)
20%15%19%20%21%28%25%21%23%
TR100PR
(mm)
22%18%22%22%24%31%30%27%25%
TR150PR
(mm)
23%20%23%23%27%34%34%31%26%
Standard Deviation 2071–2100PREC99PRCTILE
(days/year)
011012000
PREC99.5PRCTILE
(days/year)
011011000
PREC99.9PRCTILE
(days/year)
001000000
TR10PR
(mm)
19%16%16%16%18%15%24%22%25%
TR20PR
(mm)
21%17%18%17%18%16%25%23%27%
TR50PR
(mm)
24%18%22%19%20%20%29%26%30%
TR100PR
(mm)
26%19%25%22%20%26%34%30%32%
TR150PR
(mm)
27%20%27%23%21%31%36%33%33%

References

  1. IPCC. Contribution of Working Group II to the Fifth Assessment Report of the Intergovernmental Panel on Climate Change. In Climate Change 2014: Impacts, Adaptation, and Vulnerability. Part A: Global and Sectoral Aspects; Cambridge University Press: Cambridge, UK; New York, NY, USA, 2014; Available online: http://www.ipcc.ch/report/ar5/wg2/ (accessed on 3 May 2017).
  2. IPCC. Climate Change 2022: Impacts, Adaptation and Vulnerability; IPCC: Geneva, Switzerland, 2022; Available online: https://www.ipcc.ch/report/sixth-assessment-report-working-group-ii/ (accessed on 24 February 2022).
  3. Burbidge, R. Adapting European airports to a changing climate. Transp. Res. Procedia 2016, 14, 14–23. [Google Scholar] [CrossRef]
  4. Lopez, A. Vulnerability of airports on climate change: An assessment methodology. Transp. Res. Procedia 2016, 14, 24–31. [Google Scholar] [CrossRef]
  5. Christodoulou, A.; Demirel, H. Impacts of Climate Change on Transport: A Focus on Airports, Seaports and Inland Waterways; Publications Office of the European Union: Luxembourg, 2018. [Google Scholar]
  6. Nissen, C.; Cludius, J.; Graichen, V.; Graichen, J.; Gores, S. Trends and Projections in the EU ETS in 2020; EEA: Copenhagen, Denmark, 2021. [Google Scholar]
  7. ACI. Policy Brief: Airports’ Resilience and Adaptation to Changing Climate—ACI World Store. 2018. Available online: https://store.aci.aero/product/policy-brief-airports-resilience-and-adaptation-to-changing-climate/ (accessed on 12 February 2023).
  8. Burbidge, R. Adapting aviation to a changing climate: Key priorities for action. J. Air Transp. Manag. 2018, 71, 167–174. [Google Scholar] [CrossRef]
  9. Wu, D.; Qi, H. Evaluating the economic and ecological impact for small and medium airport subsidies in China. J. Clean. Prod. 2021, 281, 124811. [Google Scholar] [CrossRef]
  10. Internation Civil Aviation Organitation Environment Report; Aviation and Environment Report; ICAO: Montreal, QC, Canada, 2019; pp. 21–22.
  11. Pek, S.; Caldecott, B. Physical Climate—Related Risks Facing Airports: An Assessment of the World’s Largest 100 Airports; University of Oxford: Oxford, UK, 2020. [Google Scholar]
  12. Voskaki, A.; Budd, T.; Mason, K. The impact of climate hazards to airport systems: A synthesis of the implications and risk mitigation trends. Transp. Rev. 2023, 1–24. [Google Scholar] [CrossRef]
  13. Fenn, T.; Clarke, C.; Burgess-Gamble, L.; Harding, E.; Ogunyoye, F.; Hick, E.; Dawks, S.; Morris, J.; Chatterton, J. The costs and impacts of the winter 2013/14 floods in England and Wales. E3S Web Conf. 2016, 7, 05004. [Google Scholar] [CrossRef]
  14. Dolman, N.; Sindhamani, V. Climate Change Impacts on Airports and Measures—Case of Schiphol Airport; ICAO: Montreal, QC, Canada, 2022. [Google Scholar]
  15. De Vivo, C.; Ellena, M.; Capozzi, V.; Budillon, G.; Mercogliano, P. Risk assessment framework for Mediterranean airports: A focus on extreme temperatures and precipitations and sea level rise. Nat. Hazards 2021, 111, 547–566. [Google Scholar] [CrossRef]
  16. Ridal, M.; Olsson, E.; Unden, P.; Zimmermann, K.; Ohlsson, A. Uncertainties in Ensembles of Regional Re-Analyses. Deliverable D2.7 HARMONIE Reanalysis Report of Results and Dataset. 2017. Available online: http://www.uerra.eu/component/dpattachments/?task=attachment.download&id=296 (accessed on 10 February 2023).
  17. Benestad, R.; Haensler, A.; Hennemuth, B.; Illy, T.; Jacob, D.; Keup-Thiel, E.; Kotlarski, S.; Nikulin, G.; Otto, J.; Rechid, D.; et al. Guidance for EUROCORDEX Climate Projections Data Use. Version1.0—2017.08. Available online: https://euro-cordex.net/imperia/md/content/csc/cordex/euro-cordex-guidelines-version1.0-2017.08.pdf (accessed on 10 February 2023).
  18. Jacob, D.; Teichmann, C.; Sobolowski, S.; Katragkou, E.; Anders, I.; Belda, M.; Benestad, R.; Boberg, F.; Buonomo, E.; Cardoso, R.M.; et al. Regional climate downscaling over Europe: Perspectives from the EURO-CORDEX community. Reg. Environ. Change 2020, 20, 51. [Google Scholar] [CrossRef]
  19. Ellena, M.; Ricciardi, G.; Barbato, G.; Buffa, A.; Villani, V.; Mercogliano, P. Past and future hydrogeological risk assessment under climate change conditions over urban settlements and infrastructure systems: The case of a sub-regional area of Piedmont, Italy. Nat. Hazards 2020, 102, 275–305. [Google Scholar] [CrossRef]
  20. Colin, M.; Palhol, F.; Leuxe, A. Adaptation of transport infrastructures and networks to climate change. Transp. Res. Procedia 2016, 14, 86–95. [Google Scholar] [CrossRef]
  21. Lelieveld, J.; Hadjinicolaou, P.; Kostopoulou, E.; Chenoweth, J.; El Maayar, M.; Giannakopoulos, C.; Hannides, C.; Lange, M.A.; Tanarhte, M.; Tyrlis, E.; et al. Climate change and impacts in the Eastern Mediterranean and the Middle East. Clim. Chang. 2012, 114, 667–687. [Google Scholar] [CrossRef] [PubMed]
  22. Bucchignani, E.; Zollo, A.L.; Montesarchio, M. Analysis of expected climate extreme variability with regional climate simulations over Napoli Capodichino Airport: A contribution to a climate risk assessment framework. Earth 2021, 2, 980–996. [Google Scholar] [CrossRef]
  23. Bucchignani, E.; Montesarchio, M.; Zollo, A.L.; Mercogliano, P. High-resolution climate simulations with COSMO-CLM over Italy: Performance evaluation and climate projections for the 21st century. Int. J. Climatol. 2016, 36, 735–756. [Google Scholar] [CrossRef]
  24. Mims. Report “Cambiamenti Climatici, Infrastrutture e Mobilità”. 2022. Available online: https://www.mit.gov.it/nfsmitgov/files/media/notizia/2022-02/Rapporto_Carraro_Mims.pdf (accessed on 22 January 2023).
  25. Assaeroporti. Statistiche. 2019. Available online: https://assaeroporti.com/statistiche/ (accessed on 12 February 2023).
  26. Francini, M.; Chieffallo, L.; Palermo, A.; Viapiana, M.F. A Method for the Definition of Local Vulnerability Domains to Climate Change and Relate Mapping. Two Case Studies in Southern Italy. Sustainability 2020, 12, 9454. [Google Scholar] [CrossRef]
  27. Ellena, M.; Melis, G.; Zengarini, N.; Di Gangi, E.; Ricciardi, G.; Mercogliano, P.; Costa, G. Micro-scale UHI risk assessment on the heat-health nexus within cities by looking at socio-economic factors and built environment characteristics: The Turin case study (Italy). Urban Clim. 2023, 49, 101514. [Google Scholar] [CrossRef]
  28. Ricciardi, G.; Ellena, M.; Barbato, G.; Giugliano, G.; Schiano, P.; Leporati, S.; Traina, C.; Mercogliano, P. Climate change adaptation cycle for pilot projects development in small municipalities: The northwestern Italian regions case study. City Environ. Interact. 2023, 17, 100097. [Google Scholar] [CrossRef]
  29. EOCD. Joint Research Centre-European Commission. In Handbook on Constructing Composite Indicators: Methodology and User Guide; OECD Publishing: Paris, France, 2008; ISBN 978-92-64-04345-9. [Google Scholar]
  30. Master Adapt. Linee Guida, Principi E Procedure Standardizzate Per L’Analisi Climatica E La Valutazione Della Vulnerabilità a Livello Regionale E Locale. 2018. Available online: https://masteradapt.eu/ (accessed on 3 March 2023).
  31. GIZ. Risk Supplement to the Vulnerability Sourcebook; Guidance on How to Apply the Vulnerability Sourcebook’s Approach with the New IPCC AR5 Concept of Climate Risk; GIZ: Bonn, Germany, 2017; Available online: https://www.adaptationcommunity.net/wp-content/uploads/2017/10/GIZ-2017_Risk-Supplement-to-the-Vulnerability-Sourcebook.pdf (accessed on 1 March 2023).
  32. Dee, D.P.; Uppala, S.M.; Simmons, A.J.; Berrisford, P.; Poli, P.; Kobayashi, S.; Vitart, F. The ERA-Interim reanalysis: Configuration and performance of the data assimilation system. Q. J. R. Meteorol. Soc. 2011, 137, 553–597. [Google Scholar] [CrossRef]
  33. Copernicus Cerra. Copernicus Regional Reanalysis for Europe (CERRA). Available online: https://climate.copernicus.eu/copernicus-regional-reanalysis-europe-cerra (accessed on 1 March 2023).
  34. IPCC. Summary for Policymakers. In Climate Change 2021: The Physical Science Basis. Contribution of Working Group I to the Sixth Assessment Report of the Intergovernmental Panel on Climate Change; Masson-Delmotte, V.P., Zhai, A., Pirani, S.L., Connors, C., Pean, S., Berger, N., Caud, Y., Chen, L., Goldfarb, M.I., et al., Eds.; Cambridge University Press: Cambridge, UK, 2021. [Google Scholar]
  35. Hausfather, Z.; Peters, G.P. Emissions–the ‘business as usual’ story is misleading. Nature 2020, 577, 618–620. [Google Scholar] [CrossRef]
  36. Jacob, D.; Petersen, J.; Eggert, B.; Alias, A.; Christensen, O.B.; Bouwer, L.M.; Braun, A.; Colette, A.; Déqué, M.; Georgievski, G.; et al. EURO-CORDEX: New high-resolution climate change projections for European impact research. Reg. Environ. Change 2014, 14, 563–578. [Google Scholar] [CrossRef]
  37. Kotlarski, S.; Keuler, K.; Christensen, O.B.; Colette, A.; Déqué, M.; Gobiet, A.; Goergen, K.; Jacob, D.; Lüthi, D.; van Meijgaard, E.; et al. Regional climate modeling on European scales: A joint standard evaluation of the EURO-CORDEX RCM ensemble. Geosci. Model Dev. 2014, 7, 1297–1333. [Google Scholar] [CrossRef]
  38. Tobin, I.; Jerez, S.; Vautard, R.; Thais, F.; Van Meijgaard, E.; Prein, A.; Déqué, M.; Kotlarski, S.; Maule, C.F.; Nikulin, G.; et al. Climate change impacts on the power generation potential of a European mid-century wind farms scenario. Environ. Res. Lett. 2016, 11, 034013. [Google Scholar] [CrossRef]
  39. von Trentini, F.; Leduc, M.; Ludwig, R. Assessing natural variability in RCM signals: Comparison of a multi model EURO-CORDEX ensemble with a 50-member single model large ensemble. Clim. Dyn. 2019, 53, 1963–1979. [Google Scholar] [CrossRef]
  40. Atlante Degli Aeroporti Italiani. 2010. Available online: https://www.enac.gov.it/ContentManagement/information/P464245000/CAP_01_Atlante_Aeroporti-NO_Iparte.pdf (accessed on 11 January 2023).
  41. Assaeroporti. Available online: https://assaeroporti.com/ (accessed on 11 January 2023).
  42. Aeroporto di Malpensa. Available online: https://www.lsi-lastem.com/it/casi-studio/monitoraggio-dellaeroporto-di-milano-malpensa/ (accessed on 11 January 2023).
  43. Aeroporto di Milano Linate. Available online: https://www.lsi-lastem.com/it/casi-studio/sea-milano-linate-sistema-di-monitoraggio-delle-condizioni-meteorologiche/ (accessed on 12 January 2023).
  44. Geoplast Aquabox. Available online: https://www.youtradeweb.com/2021/07/drenaggio-geoplast-aquabox-per-laeroporto-di-orio-al-serio/ (accessed on 20 December 2022).
  45. Airport Carbon Accreditation. Available online: https://www.airportcarbonaccreditation.org/ (accessed on 10 January 2023).
  46. SEA Milano. Available online: https://seamilano.eu/en/sustainability/case-histories/airport-carbon-accreditation (accessed on 13 January 2023).
  47. Aeroporto di Milano Bergamo. Available online: https://www.milanbergamoairport.it/en/airport-carbon-accreditation/ (accessed on 13 January 2023).
  48. Aeroporto di Napoli Capodichino. Available online: https://www.aeroportodinapoli.it/documents/10186/978434/ACA_Certificate_Europe_2021-2024_NEUTRALITY.pdf/cdb24d0f-1fad-44f6-9dd9-3537a526a84d (accessed on 13 January 2023).
  49. Aeroporto di Palermo. Available online: https://www.aeroportodipalermo.it/news-eventi/ambiente-riduzione-co2-aeroporto-di-palermo-ottiene-certificazione-di-livello-2-programma-aca-di-aci-europe/ (accessed on 14 January 2023).
  50. Sogaer Ambiente. Available online: http://www.sogaer.it/it/ambiente (accessed on 15 January 2023).
  51. Evin, G.; Somot, S.; Hingray, B. Balanced estimate and uncertainty assessment of European climate change using the large EURO-CORDEX regional climate model ensemble. Earth Syst. Dyn. 2021, 12, 1543–1569. [Google Scholar] [CrossRef]
  52. Spano, D.; Mereu, V.; Bacciu, V.; Marras, S.; Trabucco, A.; Adinolfi, M.; Barbato, G.; Bosello, F.; Breil, M.; Chiriacò, M.V.; et al. Analisi del rischio. I cambiamenti climatici in Italia; Fondazione CMCC—Centro Euro-Mediterraneo sui Cambiamenti Climatici: Lecce, Italy, 2020. [Google Scholar] [CrossRef]
  53. Adinolfi, M.; Raffa, M.; Reder, A.; Mercogliano, P. Evaluation and Expected Changes of Summer Precipitation at Convection Permitting Scale with COSMO-CLM over Alpine Space. Atmosphere 2021, 12, 54. [Google Scholar] [CrossRef]
  54. Reder, A.; Raffa, M.; Padulano, R.; Rianna, G.; Mercogliano, P. Characterizing extreme values of precipitation at very high resolution: An experiment over twenty European cities. Weather. Clim. Extrem. 2022, 35, 100407. [Google Scholar] [CrossRef]
  55. Copernicus. Available online: https://climate.copernicus.eu/pluvial-flood-risk-assessment-urban-areas (accessed on 1 March 2023).
  56. ISPRA. Valutazione d’impatto Ambientale, Norme Tecniche per la Redazione Degli Studi di Impatto Ambientale. 2021. Available online: https://www.isprambiente.gov.it/files2021/eventi/studi-impatto-ambientale/19-marzo-2021-webinar-norme-tecniche-via-adattamento-ai-cc-viviana-lucia.pdf (accessed on 1 March 2023).
  57. European Commission. Forging a Climate-Resilient Europe—The New EU Strategy on Adaptation to Climate Change, Brussels. 2021. Available online: https://eurlex.europa.eu/legal-content/EN/TXT/PDF/?uri=CELEX:52021DC00 (accessed on 2 March 2023).
Figure 1. Airports selected for climate risk analysis.
Sustainability 15 07300 g001
Figure 2. Conceptual framework to quantify the climate risk of airports under extreme precipitation conditions. * The units of measurement of vulnerability factors can be expressed as numbers or as the absence or presence of a given factor.
Sustainability 15 07300 g002
Figure 3. Annual climate variation in extreme precipitation indicators for the airports under analysis in the future period under RCP 2.6, RCP 4.5, and RCP 8.5 IPCC scenarios.
Sustainability 15 07300 g003
Figure 4. Hazard index for the reference period (1981–2010) and RCP 2.6, RCP 4.5 and RCP 8.5 future scenarios in the near-, medium- and long-term horizon for the analyzed airports. The classes were obtained using the quantile method and correspond to the qualitative classification: “very low”, “low”, “intermediate”, “high”, “very high” (from light to dark blue).
Sustainability 15 07300 g004
Figure 5. Exposure and vulnerability results. The classes were obtained by the quantile method and correspond to the qualitative classification: “very low”, “low”, “intermediate”, “high”, “very high” (from lightest color to darkest color). In the case of the adaptive-capacity index (unlike the other calculated indices), the lower values indicate a high adaptive capacity, while higher values indicate a low adaptive capacity. The qualitative classes of the adaptive-capacity index are “very high”, “high”, “intermediate”, “low” “very low” (from yellow to red colors).
Sustainability 15 07300 g005
Figure 6. Risk results for the reference period (1981–2010) and the future variation for the near time horizon 2021–2050 in the RCP 2.6, RCP 4.5, and RCP 8.5 scenarios. The classes correspond to the qualitative classification: “very low”, “low”, “intermediate”, “high”, “very high” (from green to red).
Sustainability 15 07300 g006
Figure 7. Risk results for the reference period (1981–2010) and the future variation for the medium time horizon 2041–2070 in the RCP 2.6, RCP 4.5, and RCP 8.5 scenarios. The classes correspond to the qualitative classification: “very low”, “low”, “intermediate”, “high”, “very high” (from green to red).
Sustainability 15 07300 g007
Figure 8. Risk results for the reference period (1981–2010) and the future variation in the long time horizon 2071–2100 in the RCP 2.6, RCP 4.5 and RCP 8.5 scenarios. The classes correspond to the qualitative classification: “very low”, “low”, “intermediate”, “high”, “very high” (from green to red).
Sustainability 15 07300 g008
Table 1. Exposure indicators. The names of the airports are reported with the following abbreviations: Malpensa (MAL); Linate (LIN); Bergamo (BERG); Fiumicino (FIU); Ciampino (CIA); Napoli (NAP); Palermo (PAL); Catania (CAT); and Cagliari (CAG). (NA: Not Available data).
Exposure (E)IndicatorsMALLINBERGFIUCIANAPPALCATCAG
Air-Side
Components
Runways (sqm)470,400159,742145,530396,0009900118,260292,650109,575126,000
Taxiways (sqm)NANANANANANANANANA
Tower (m)804730566040251228
Apron (sqm)1,319,000387,000190,000797,250NA200,000148,000180,000156,000
Land-Side
Components
Terminals (sqm)315,00085,05053,025354,30020,95030,70035,40043,31041,290
Offices and other buildings (sqm)26,71513,527707529,52059501915418069205030
Airport accesses systems (sqm)31,660NANANANANANANANA
Carparks (number of parking spaces)15,0003000800020,10012201500136418002133
Table 2. Sensitivity indicators. The names of the airports are reported with the following abbreviations: Malpensa (MAL); Linate (LIN); Bergamo (BERG); Fiumicino (FIU); Ciampino (CIA); Napoli (NAP); Palermo (PAL); Catania (CAT); and Cagliari (CAG). [NA: Not Available data).
IndicatorsMALLINBERGFIUCIANAPPALCATCAG
Soil sealing (ha)12353003001590133217391225246
Passengers (number in 2019)27,000,0007,000,00013,857,25743,532,5735,879,49610,860,0687,018,08710,223,1134,747,806
Buildings in bad conditions (number)NANANANANANANANANA
Age buildings73828363105111619784
Air traffic (movements in 2019)201,05085,73095,377309,78352,25382,57754,24373,49439,691
Parking accesses (number in 2019)NANANANANANANANANA
Underground infrastructures (sqm)30,30014,7005700330014,7005700-8650-
Flooded areas (%)NANANANANANANANANA
Table 3. Adaptive-capacity indicators. The names of the airports are reported with the following abbreviations: Malpensa (MAL); Linate (LIN); Bergamo (BERG); Fiumicino (FIU); Ciampino (CIA); Napoli (NAP); Palermo (PAL); Catania (CAT); and Cagliari (CAG). Unavailable data are reported as NA (Not Available). “Present” and “Not Present” indicates the presence or absence of specific adaptation measures for the selected airports.
IndicatorsMALLINBERGFIUCIANAPPALCATCAG
Vegetated area in the airportNANANANANANANANANA
Risk awareness: e.g., initiatives for mitigation to climate change1. Neutrality3+;2. ISO 50001 for “energy saving”Neutrality 3+Neutrality 3+Transition 4+
ISO 50001 (energy saving); Climate Group
Transition 4+; ISO 50001 (energy saving)Neutrality 3+Carbon Accreditation Level2Commitment to obtain carbon certificationCarbon accreditation Level 1
Efficient drainage systemPresentPresentPresentPresentPresentPresentPresentPresentPresent
Monitoring and alarm systemPresentPresentPresentNot PresentNot PresentNot PresentPresentNot PresentNot Present
Insurance policy for extreme eventsNot presentNot presentNot presentNot presentNot presentNot presentNot presentNot presentNot present
Guidelines for adaptation plan to climate changePlan and regional strategy of adaptation to climate changePlan and regional strategy of adaptation to climate changePlan and regional strategy of adaptation to climate changeRegional adaptation plan being processedRegional adaptation plan being processedStrategy for the green cityAction plan for sustainable energy and climateAction plan for sustainable energy and climateRegional strategy of adaptation to climate change
Bioinfiltration and permeable pavementsNot presentNot presentNot presentNot presentNot presentNot presentNot presentNot presentNot present
Table 4. Extreme precipitation indicators for the reference period 1981–2010 (annual average values) for the airports analyzed. The names of the airports are reported with the following abbreviations: Malpensa (MAL); Linate (LIN); Bergamo (BERG); Fiumicino (FIU); Ciampino (CIA); Napoli (NAP); Palermo (PAL); Catania (CAT); and Cagliari (CAG).
IndicatorsMALLINBERGFIUCIANAPPALCATCAG
Prec99prctile (days/year)111111111
Prec99.5prctile (days/year)110000000
Prec99.9prctile (days/year)000000000
TR10pr (mm)107.978.165.582.367.39695.610658.8
TR20pr (mm)120.886.67394.276.5111.2111.4123.960.5
TR50pr (mm)137.497.681.3109.788.3131131.4147.170.4
TR100pr (mm)150.1105.987.5121.397.2145.7147164.577.8
TR150pr (mm)157.1110.691.2128.1102.4154.3155.9174.682.1
Disclaimer/Publisher’s Note: The statements, opinions and data contained in all publications are solely those of the individual author(s) and contributor(s) and not of MDPI and/or the editor(s). MDPI and/or the editor(s) disclaim responsibility for any injury to people or property resulting from any ideas, methods, instructions or products referred to in the content.

