1. Introduction
Under China’s new development paradigm of “dual circulation” development pattern, in which the domestic economic cycle plays a leading role while the international economic cycle remains its extension and supplement, high-quality development is linked to regional coordination. Guided by urban agglomeration, regional agglomeration now provides support for China’s sustained economic growth. Since 2006, when urban agglomeration first appeared as a strategy in China’s 11th Five-Year Plan [
1], China has established 19 urban agglomerations [
2]. Each has an average of six airports.
In an airport logistics network, an airport is a node, and air transportation is the edge. Such networks help China participate in international development, transform its economic structure, and promote its civil aviation development [
3]. A Multi-airport Logistics System (MLS) refers to two or more airports with close geographical ties in an urban agglomeration. The number of airports in China’s MLSs has been increasing, reaching about 10 in a single MLS. An MLS includes airport logistics parks, airport-related Free Trade Zones, and all other agents in the airport logistics service chain. MLS has a certain level of self-organization and self-regulation [
4], and the agents in the airport logistics service chain are interrelated.
Studying the spatial differentiation of MLSs and examining their features have practical value. In February 2021, China issued the National Comprehensive Three-dimensional Transportation Network Planning Outline [
5], proposing to speed up the construction of the main skeleton of the high-efficiency national integrated transportation network. It can help us understand the general development of MLSs in specific urban agglomerations and support high-quality MLS development in others. The findings can guide the formulation of development strategies for MLSs in urban agglomerations, supporting the formation of linkages with the global industrial value chain. Studying MLS development in urban agglomerations can also help promote the sustainable development of urban agglomeration economies.
The next section of this paper reviews the literature.
Section 3 presents the MLS evaluation index system and the data sources.
Section 4 presents the results and discusses the spatial differentiation characteristics of MLSs.
Section 5 presents the conclusions.
2. Literature Review
Bonnefoy [
6] suggested that multiple airport systems (MASs) would be the best way for the global air transport system to meet future needs. An MAS could alleviate the congestion problems of core airports in multi-airport areas. Various studies have found that MAS development can promote the sustainable competitiveness of airports and regions [
7,
8,
9]. While research on MAS has focused on multi-airport passenger markets [
10,
11,
12,
13], fewer studies have investigated multi-airport logistics markets. Shen first proposed the concept of MLS [
4]. Since then, researchers have studied sustainable MLS development by taking an urban agglomeration as a case [
14]. Other MLS-related studies have investigated the cargo competitiveness of multiple airports. Van, for example, examined the air cargo competitiveness of European airports and identified the characteristics that determine airport competitiveness [
15]. Gökhan, meanwhile, studied the domestic and international industry competition environment in relation to Istanbul Airport and determined the best competitive strategy for Turkey’s air cargo industry [
16]. Further, in studies at airports in Turkey, Hilal used the analytic network process to analyze airports’ competitive advantages [
17].
Studying MLS and measuring differences in its development levels can help promote the coordinated development of regional industries [
18,
19]. Research on evaluation systems for airport logistics development generally includes constructing a system and selecting evaluation methods. System construction can be divided into two steps: exploring influencing factors and filtering initial indicators. Developing an evaluation method includes three steps: data preprocessing, evaluation model selection, and weight determination [
20]. Few studies have explored the development level of airport logistics, with most focusing mainly on the influencing factors. A limited number of studies have investigated the competitiveness of airport logistics development and its influencing factors [
15], such as the levels of economic development and management [
17]. Most, however, are qualitative, with little quantitative content.
Methods used to evaluate the levels of logistics development can be applied to airport logistics. There are three main methods: subjective weighting, objective weighting, and combined subjective–objective weighting [
20,
21,
22]. Subjective weighting methods such as the analytic hierarchy process [
23], fuzzy evaluation [
24], and the Delphi method [
25] are widely used in logistics development evaluation. However, given the subjectivity of those methods, some have used principal component analysis [
26], the entropy method [
27], factor analysis [
28], and criteria importance through intercriteria correlation (CRITIC) [
29] to reduce the subjectivity of evaluation [
30]. The factors involved in various objective assignment methods are different, and the methods need to be compared and selected based on the features of the data. Each method has advantages and disadvantages, and more reasonable results can be obtained by combining different methods. Entropy focuses on the variability of indicators [
31]. Moreover, since the CRITIC algorithm considers correlations within indicators and conflicts between indicators, it is considered a relatively perfect objective weight assignment method [
32]. However, since it does not consider discretization between data, it can be improved by combining it with entropy weighting [
33].
In summary, while there is relatively abundant research on MASs in urban agglomerations, fewer studies have considered the spatial differentiation of MLSs in China’s agglomerations. This study, therefore, constructed an index system to evaluate MLS development and examined its spatial differentiation. The findings can inform MLS development in other urban agglomerations.
3. Methods and Data
3.1. Initial Evaluation Index System
The development level of MLSs in urban agglomerations can be measured from two aspects: supply and demand. The supply aspect includes airport logistics resource supply and service supply. The demand aspect mainly relates to airport logistics market demand. Specifically,
(1) The resource supply of airport logistics takes the airport as the core. The basis for MLS in an urban agglomeration can be understood in terms of the number of aircraft taking off and landing, the number of connecting points, and the total number of all-cargo routes at the airport. The airport hub is the necessary premise for development and the key factor affecting operational efficiency.
(2) In terms of the logistics service chain, MLS emphasizes the relevance and systematism of each agent, with an airport as the core. MLS development requires the participation of all agents. Logistics service providers in airport logistics mainly include (1) the air carriers responsible for air transportation; (2) the air freight forwarding companies and ground distribution agencies responsible for collecting, receiving, and distributing goods; and (3) integrated logistics service providers that integrate carrier and agent services and provide door-to-door cargo transportation and distribution services.
(3) Market demand reflects the economic development level of the logistics catchment area of the airport. High local supply can promote the formation, upgrading, and development of cargo transportation systems with the airport as the core. This can create a broad space for the production and development of third-party logistics enterprises and form an effective linkage mechanism for airport logistics enterprises. This, in turn, will promote the optimal allocation and flow of various resource elements and accelerate the formation and development of MLSs in urban agglomerations.
Combined with data availability and experts’ opinions on MLS,
Table 1 shows our initial evaluation system for MLS development levels in urban agglomerations.
In
Table 1, the airport logistics resources: (1) The higher the number of aircraft take-offs and landing sorties, the better the aviation logistics resources in MLS of this urban agglomeration, and the higher the development level. (2) If there are more national airport logistics hubs in an urban agglomeration, the more attention the country pays to the region, the richer its aviation resources will be. (3) The larger the number of designated regulatory sites, the higher the development level will be. If the number of designated regulatory sites is larger in the airports of urban agglomerations, business cooperation between them may be easier. (4) The higher the number of airport traffic points in the urban agglomeration, the better the aviation logistics resources. (5) The closer the concentration index HHI is to 1⁄n, the better, but it is not average (n is the total number of airports in urban agglomeration). (6) The larger the total number of cargo routes, the better the development level.
As for the airport logistics service chain: (1) The shorter the average import clearance time, the higher the efficiency of the customs, and the more conducive to the development of aviation logistics. (2) The larger the area of the aviation logistics park, the more conducive to the development of aviation logistics. (3) The number of cargo carriers operating more than two airports is directly proportional to the development level of aviation logistics, which is more conducive to matching transport capacity from a global perspective, and avoiding vicious competition among regional airports to a certain extent. (4) Whether there is a transfer center for integrated carriers such as UPS. The transfer presence of a center indicates that air carriers have developed well, which is conducive to the better development of aviation logistics. The more the number of global top 10 freight forwarding enterprises in the urban agglomeration, the more attractive the regional airports are to freight forwarding agents. (5) The more the Civil Aviation Administration invested in large and medium-sized fixed assets projects of airports and the more the general public budget expenditure (science and technology), it indicates that it should pay more attention to aviation logistics, which is more conducive to the development of aviation logistics.
In the airport logistics market demand: (1) The larger the air cargo volume, the stronger the regional air logistics market demand and its growth rate reflect the quality of market demand. (2) The greater the per capita GDP, the greater the consumption potential of the region, and the stronger the market demand for aviation logistics. (3) With the continuous development of e-commerce, the total online retail volume of physical commodities, to some extent, represents the development degree of e-commerce in the region. The greater the value, the greater the demand for e-commerce in the region and the greater the demand for the aviation logistics market. (4) The greater the total volume of import and export trade, the greater the demand for the aviation logistics market.
3.2. Case Selection
We selected four major urban agglomerations in China: Beijing–Tianjin–Hebei (BTH) (Outline of the Coordinated Development of the Beijing–Tianjin–Hebei Region (2015)), Yangtze River Delta (YRD) (Outline of the Yangtze River Economic Belt Development Plan (2016)), Guangdong–Hong Kong–Macau Greater Bay Area (GHM) (Outline of the Development Plan for the Guangdong–Hong Kong–Macao Greater Bay Area (2019)), and Chengdu–Chongqing Double Cities Economic Circle (C–C) (Outline of the Construction Plan of the Chengdu–Chongqing Double Cities Economic Circle (2020)). These are the top four urban agglomerations in China.
Based on the approved plans for these agglomerations, we identified the specific cities or regions included. The number of airports in BTH, YRD, GHM, and C–C is 10, 15, 7, and 10, respectively (
Table 2). To highlight the logistics catchment area of the airport, Beijing–Tianjin–Hebei includes Beijing, Tianjin, Hebei, and Anyang.
3.3. Data Collection and Analysis
Considering the timeliness and representativeness of data, as well as the impact of COVID-19, most data were for FY2019.
Table 3 shows the values for each variable.
The data mainly came from official statistics and network channels. Economic and social indicators such as the total online retail sales of physical goods, total import and export trade, and GDP mainly came from the China Urban Statistical Yearbook 2020. The annual airport cargo and mail throughput volume, number of aircraft take-offs and landings, total number of all-cargo routes, and the annual investment of the Civil Aviation Administration of China (CAAC) in large- and medium-sized projects of airport fixed assets came from the Statistical Bulletin of Civil Aviation Airport Production 2020 and the Statistical Yearbook of Civil Aviation of China 2019. Data on airport accessibility and carriers were from the airports’ official websites. The number of airport logistics hubs within the National Logistics Hub City, the number of designated supervision sites in the airports, the number of integrated carrier transshipment centers (e.g., UPS), the number of freight-forwarding enterprises, and the area of airport logistics parks came from the local government’s websites. Some data for Hong Kong and Macao came from the China Urban Statistical Yearbook, the official website of the Civil Aviation Department of Hong Kong, the official website of the Civil Aviation Administration of Macao, and the OAG Database of OAG Aviation Worldwide Limited.
3.3.1. Airport Logistics Resource Data Analysis
In terms of resources, we might find the following:
- (1)
The higher the number of aircraft take-offs and landings, the better the airport logistics resources and the higher the development level in the MAS of this urban agglomeration.
- (2)
If there are more hubs within the National Logistics Hub City in an urban agglomeration, the country pays more attention to this region, and its resources are richer.
- (3)
The greater the number of customs supervision sites in airports, the higher the development level. If there are more customs supervision sites in an airport location in urban agglomerations, business between them might become more cooperative.
- (4)
The better an airport’s accessibility, the better its logistics resources.
- (5)
The closer the concentration of the Herfindahl–Hirschman Index (HHI), , the better, but it is not the average ( is the total number of airports in an urban agglomeration).
- (6)
The greater the number of airports all-cargo routes in the urban agglomeration, the better the development level.
3.3.2. Airport Logistics Service Chain Data Analysis
In the service chain aspect, we might find the following:
- (1)
The shorter the average import customs clearance time, the higher the efficiency of customs and the more conducive it is to the development of airport logistics.
- (2)
The larger the size of the airport logistics park, the more beneficial it is for the development of airport logistics.
- (3)
The number of freight carriers operating in more than two airports is directly proportional to the development level of airport logistics. This is more conducive to matching capacity from a global perspective, and vicious competition can be avoided among airports in the region to a certain extent.
- (4)
If UPS and other integrators have transhipment centers, it shows that air carriers are developing well, which is conducive to air logistics development. The greater the number of top 10 global freight forwarders in the urban agglomeration, the more attractive the airports in the region.
- (5)
The greater the investment and general public budget expenditure (science and technology) of the CAAC for large- and medium-sized projects of airport fixed assets in that year, the more attention paid to airport logistics, which is conducive to the development of airport logistics.
3.3.3. Airport Logistics Market Demand Data Analysis
In the market demand aspect, we might find the following:
- (1)
The greater the air cargo and mail throughput volume, the stronger the air logistics market demand in this region. The growth rate reflects the quality of market demand.
- (2)
The larger the per capita GDP, the greater the consumption potential and the stronger the market demand for airport logistics.
- (3)
With e-commerce development, the total number of online retail sales of goods represents the development degree of e-commerce in the region. The higher the value of online retail sales goods, the greater the demand for e-commerce in the region and the greater the demand for the airport logistics market.
- (4)
The greater the total import and export trade, the greater the demand for the airport logistics market.
3.4. Final Evaluation Index System
In order to avoid deviations caused by human factors and ensure the independence of each index, the correlation coefficient can be used to measure the mutual influence of each evaluation index. Thus, we further adjusted the evaluation index. The specific steps are as follows:
First, the raw data in
Table 3 are dimensionless.
When the metric attribute of the index is positive,
When the metric attribute of the index is negative,
is the original value of the th index of the th evaluation object; ; . is the normalized value of the index. m is the number of evaluation objects, and is the number of evaluation indexes.
In addition, in the actual calculation, the minimum value of the average import customs clearance time is the minimum nationwide value in China, which is 5.4. The maximum growth rate of air cargo throughput took the maximum growth rate of the top 100 airports in 2019, which is 22.1. Similarly, the minimum value is −12.6.
Then, correlation analysis should be carried out to obtain the correlation coefficient:
and are the average values of samples.
Second, the correlation coefficients between indexes were calculated, and the correlation coefficients of several indexes were higher; for example, the correlation coefficient of X12 and X13 reached 0.952. The evaluation indexes, therefore, needed to be filtered. We needed to delete one of the two indexes whose correlation coefficient was over 0.9 in the same system layer. This reduces the correlation between evaluation indexes.
Finally, through the filtering of indexes, we obtained the adjusted evaluation index system of MLS development level in urban agglomerations, as shown in
Table 4.
3.5. Evaluation Method Selection
To enhance the credibility of the evaluation results and avoid errors caused by the single weighting method and subjective weighting method, we used the entropy–CRITIC weighting method for comprehensive evaluation.
(1) Entropy method
indicates the proportion of index under index , .
When , then .
The weight of index entropy is
(2) CRITIC method
represents the average value of each index, and is the standard deviation of index .
Indicator conflict is expressed by the correlation coefficient,
represents the correlation coefficient between evaluation indexes
and
.
The amount of information is
The larger the , the greater the role of index in the whole evaluation system, and more weight should be assigned to it.
The objective weight
of index
is
(3) The comprehensive weight is
(4) The comprehensive evaluation score is
4. Results and Discussion
4.1. Overall Spatial Differentiation Characteristics
We used the above method to calculate the indexes of the evaluation index system shown in
Table 4. Then, we obtained the rankings of the MLS development levels in the four urban agglomerations.
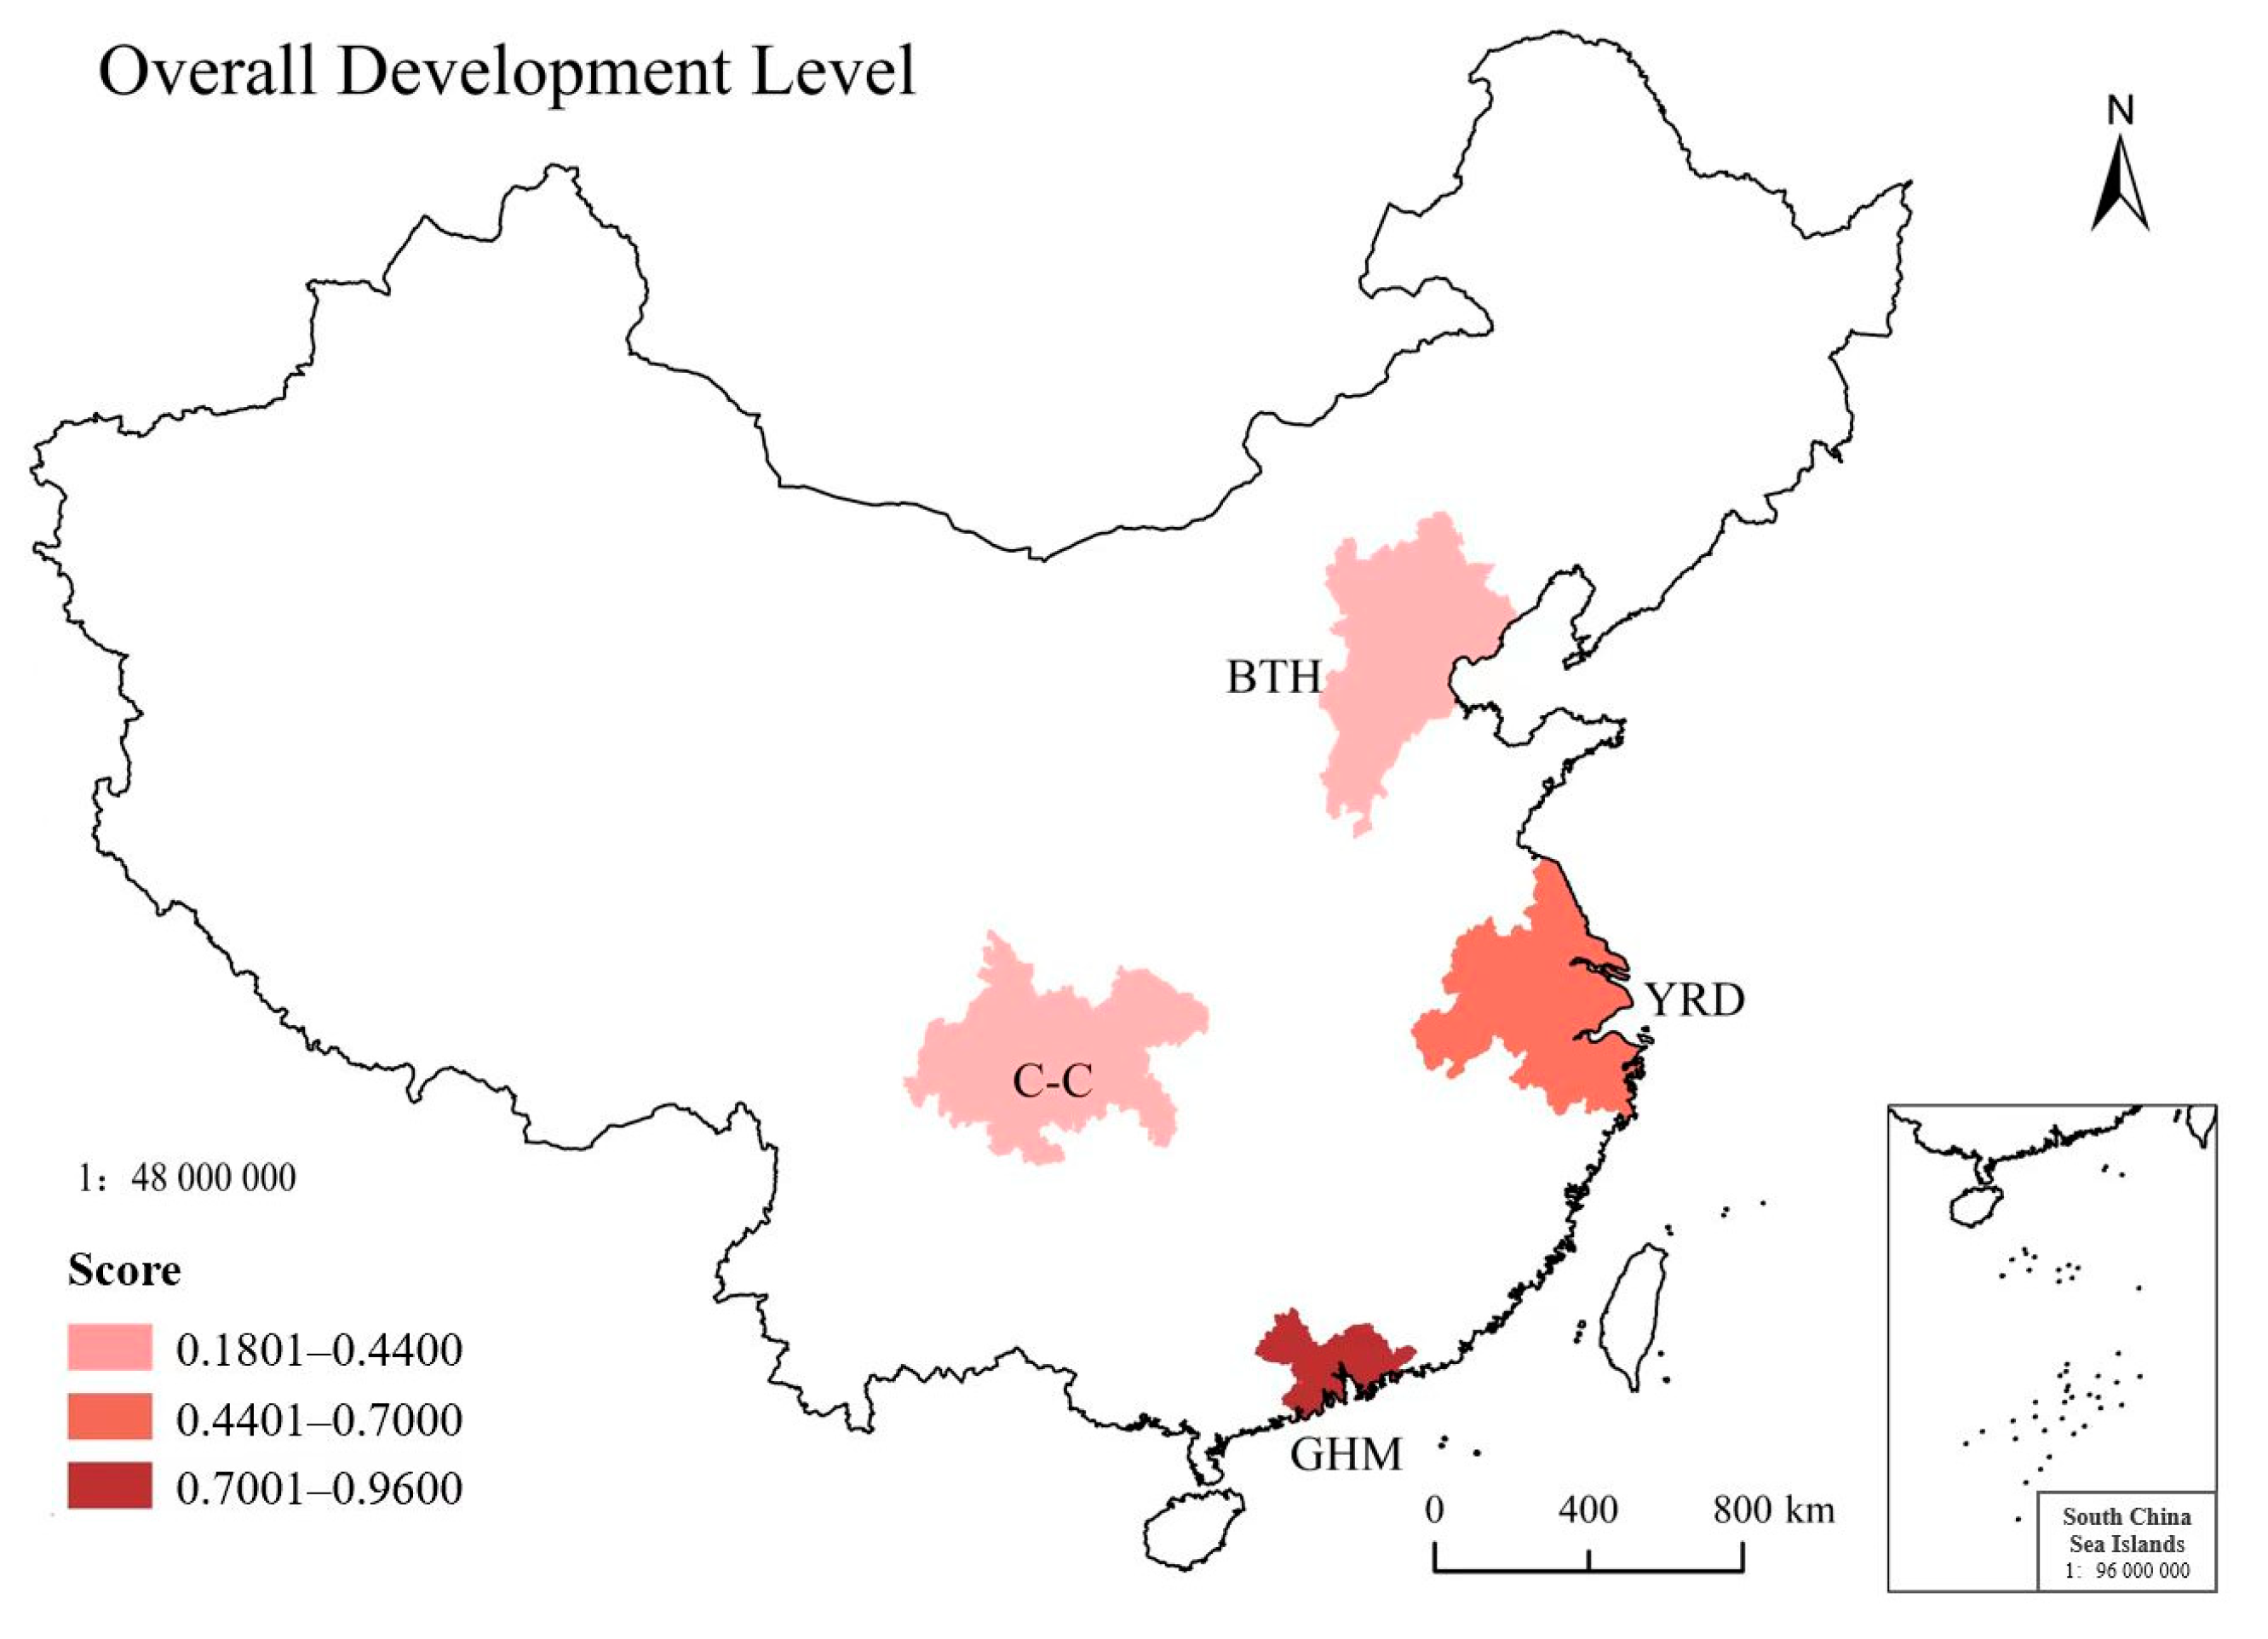
Table 5 shows the overall scores and sub-scores. According to the overall score, from high to low, the rankings of the four urban agglomerations are as follows: GHM, YRD, C–C, and BTH.
The overall scores and the sub-scores of GHM and YRD were higher than those of C–C and BTH. GHM and YRD showed advantages in various subindexes. GHM ranked first in terms of airport logistics resources and market demand. The airport logistics resources score of GHM was 0.9431, which was 0.3105 higher than that of the urban agglomeration in the second place and far superior to those of the other three urban agglomerations. YRD ranked first in the airport logistics service chain. The overall scores of C–C and BTH were quite different from those of YRD and GHM. The demand of the airport logistics market was the most obvious difference.
Based on the overall score and the maximum and minimum values of each score in
Table 5, the overall score and three first-class index scores were divided into three levels using the equal interval method. ArcGIS 10.4 was used to create a spatial differentiation map of the overall development level of airport logistics in urban agglomerations (
Figure 1). The first level included GHM, whose overall score was 0.7624. YRD was at the second level, with an overall score of 0.6932. C–C and BTH were at the third level. C–C ranked third with a score of 0.3832. BTH ranked fourth with a score of 0.3640. The overall level gradient of MLS development in the four urban agglomerations was obvious.
MLS development was better in GHM and YRD, far higher than that in C–C and BTH, which aligned with expectations. Unlike expectation, C–C had a higher overall score for airport logistics development than BTH. The reasons for this gradient relationship in the four major urban agglomerations can be analyzed in three aspects: MLS resources, service chain, and market demand.
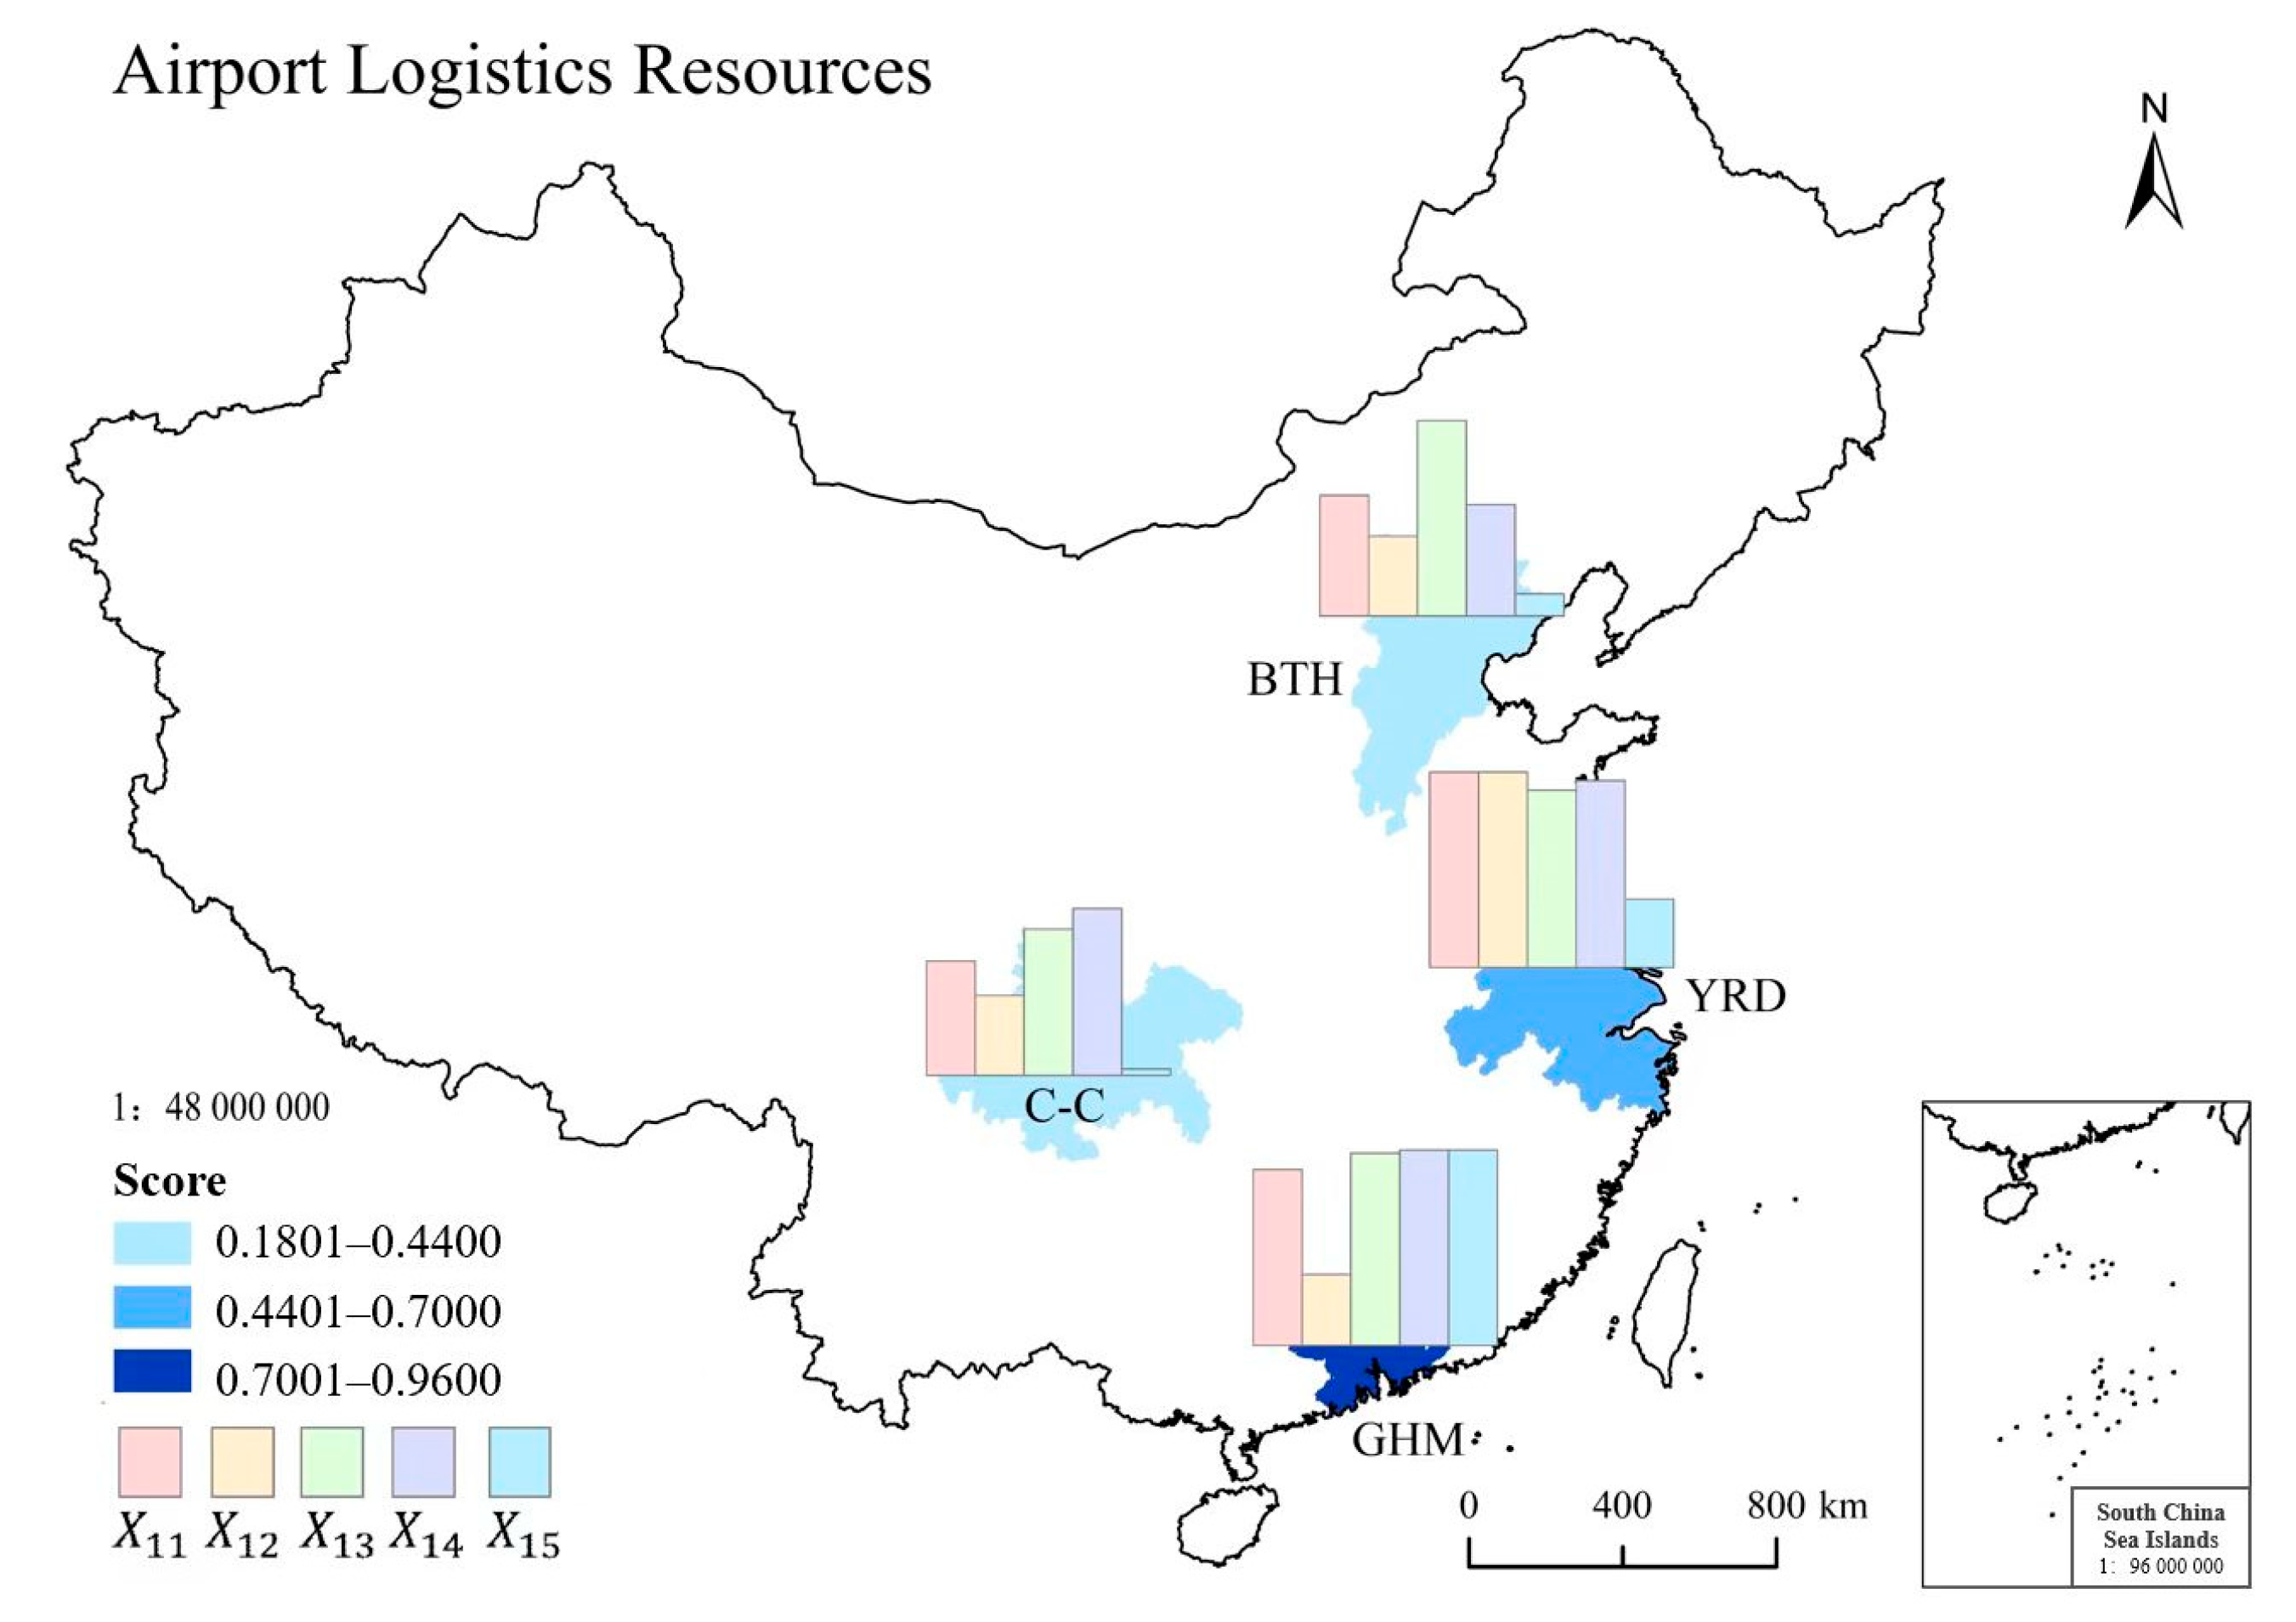
4.2. Differentiation Characteristics of Airport Logistics Resources
GHM was at the first level, with the highest scores for airport logistics resources. GHM was superior to the other three urban agglomerations, as shown in
Figure 2.
The airport logistics development model of GHM is “resource supported”. Its performance can be characterized as follows: first, GHM has location advantages. There are three international hub airports in GHM. Hong Kong Airport is the busiest cargo airport in the world. Given its adjacency to Southeast Asia, Hong Kong Airport can attract more overseas Chinese resources. Second, high-density hub airports can provide global accessibility. There are seven transport airports distributed within an 80 km range in the whole Bay Area. The number of cargo-accessible points and all-cargo routes is far greater than that of the other three agglomerations. This strongly drives the sustainable development of airport logistics in GHM.
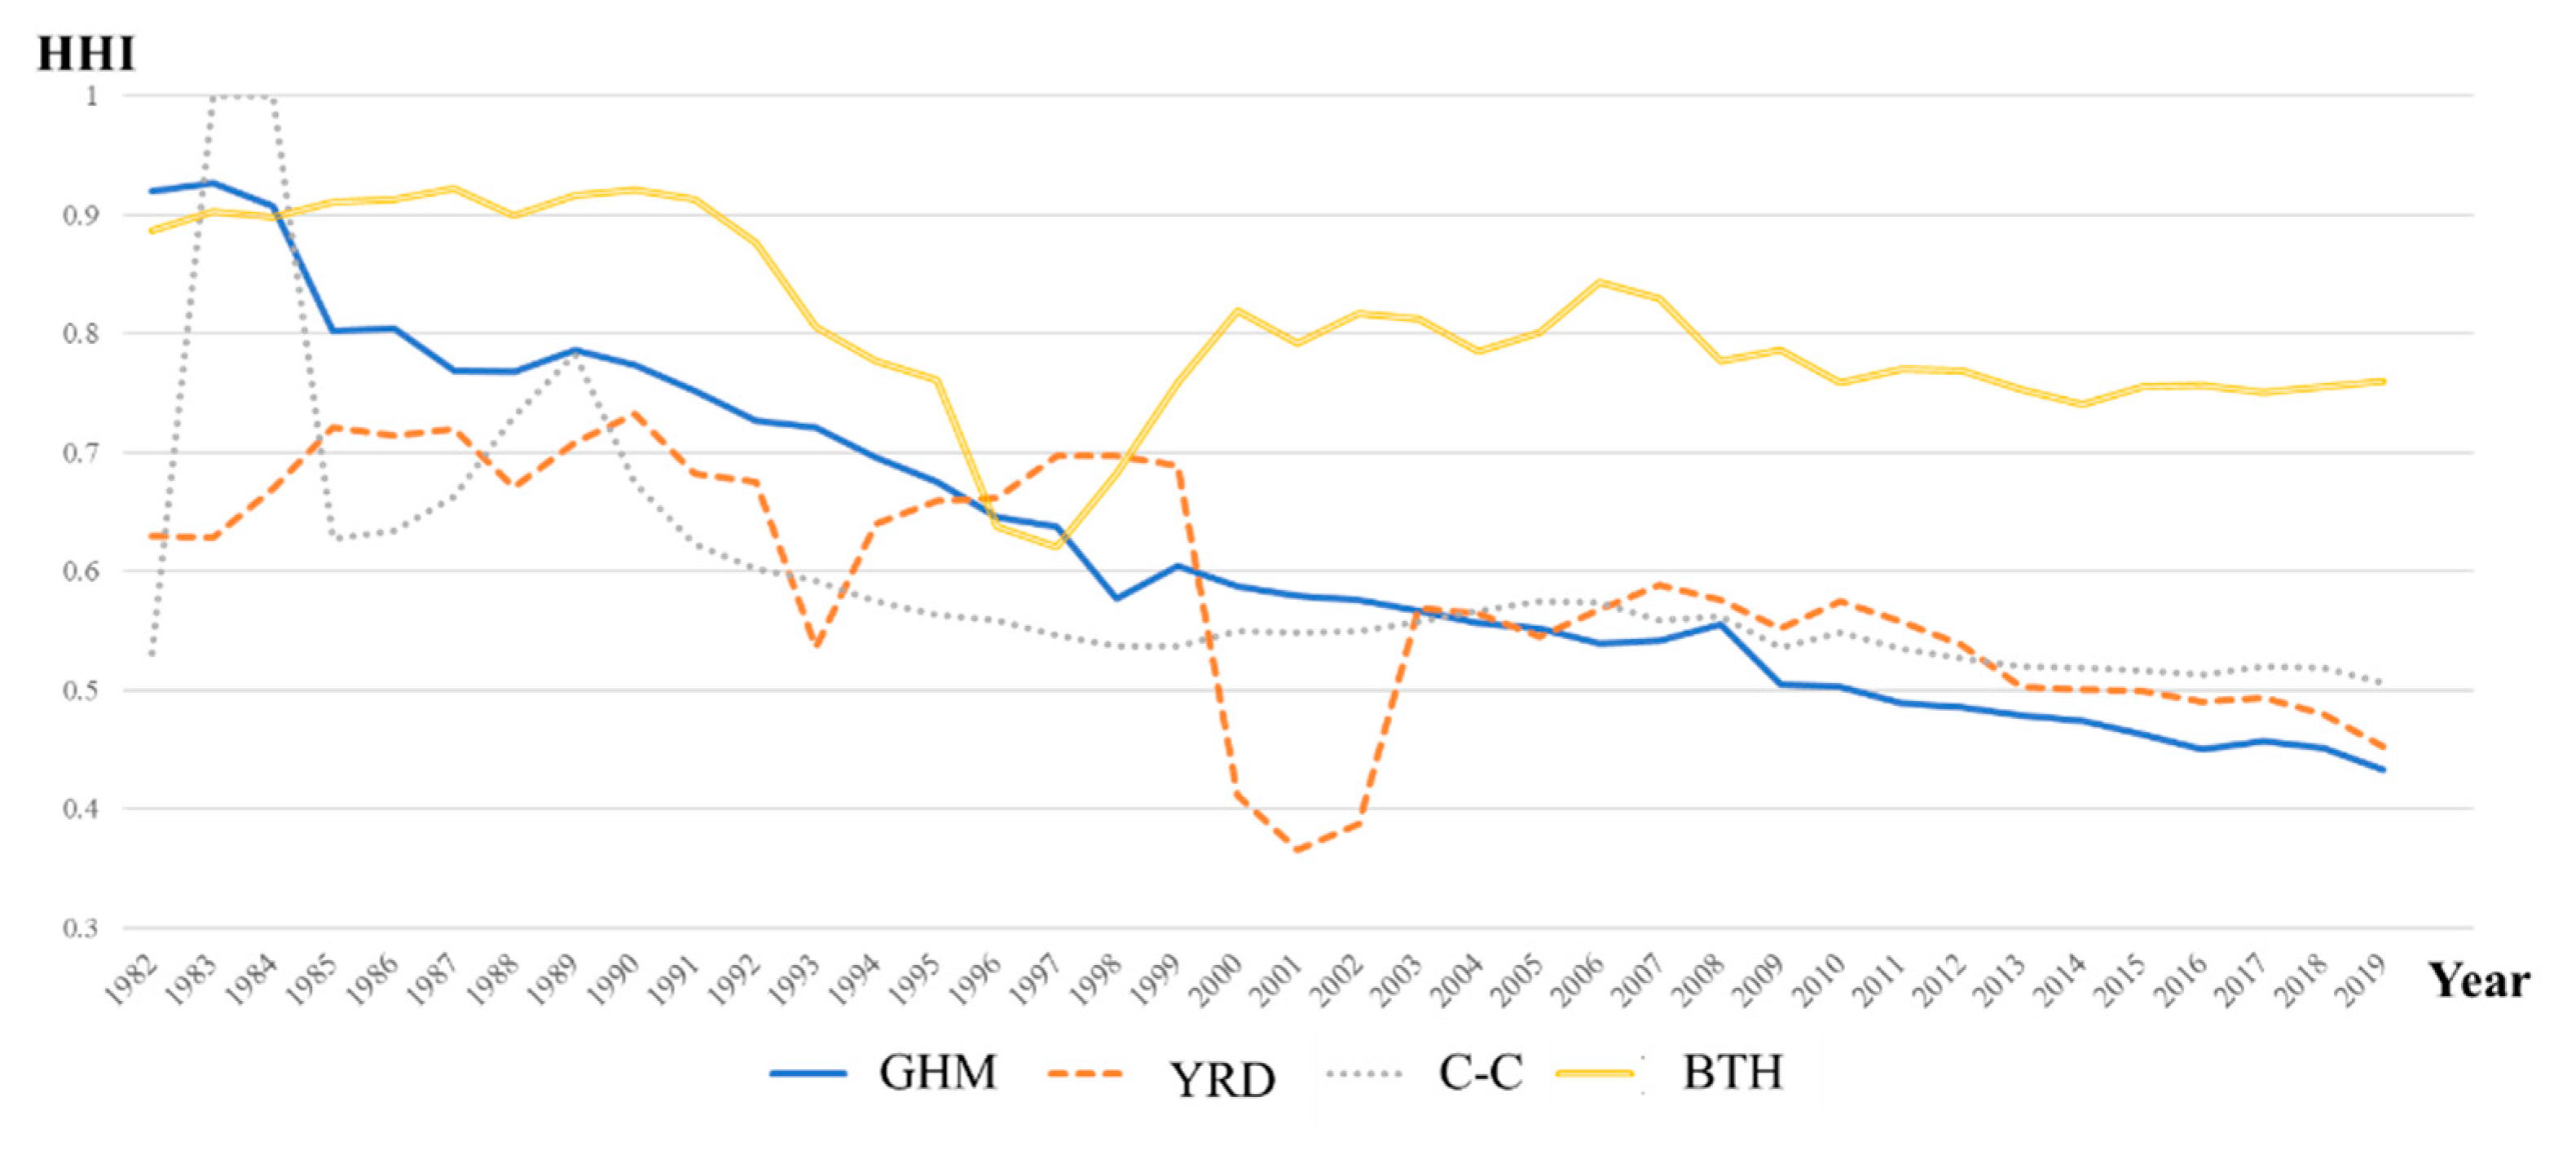
MLS development in urban agglomerations is affected by the cross-hinterland or the same airport catchment area. The airport logistics of each airport interact directly or indirectly at the spatial level. We calculated the concentration of cargo and mail throughput according to the HHI. The HHI can be used to analyze regional differences in airport logistics resources in urban agglomerations. The HHI calculation formula is as follows:
indicates the cargo and mail throughput of airport, and is the total cargo and mail throughput of all airports in the urban agglomeration.
The larger the HHI value, the higher the concentration of MLS in the urban agglomeration. When , MLS is monopolistic in the urban agglomeration. When , MLS development is at the same scale in the urban agglomeration. When tends to infinity, HHI tends to 0.
We can derive the following from
Figure 3:
- (1)
HHI in GHM decreased year by year, and each airport had a clear position. MLS in GHM gradually developed from “competition” to “competition and cooperation”. Overall competitiveness improved. Hong Kong, Guangzhou, and Shenzhen all have international hub airports. Guangzhou Airport and Shenzhen Airport are continually expanding to enhance the supply capacity of airport logistics resources.
- (2)
HHI in YRD fluctuated, and competition was far greater than cooperation. Shanghai is the core city in YRD. There are two international hubs in Shanghai. The advantages of airport logistics resources in Shanghai are outstanding. The airports in Nanjing, Hangzhou, and Ningbo have strong development momentum. They are attracting many logistics resources, and their overall development is uneven.
- (3)
The overall construction of C–C airports was late. The number of airports in the early stage was small. With the construction of new airports and the suspension of old airports, market concentration in C–C has been unstable. In the later period, with an increase in the number of airports, market concentration tended to be stable. The airports in Chengdu and Chongqing are in a monopoly position in C–C. HHI was above 0.6 over the last 20 years.
- (4)
In BTH, the Beijing Capital Airport showed a strong siphon effect. It was in a monopoly position in MLS development. In addition, MLS was seriously insufficient in Tianjin and Hebei. Thus, MLS resources in BTH were uneven, with HHI hovering around 0.8 over the last 10 years. Beijing Daxing International Airport opened to traffic in 2019, aiming to build itself into a freight hub in Northeast Asia. It is bound to bring changes in the concentration of BTH. At the beginning of 2020, however, with the spread of COVID-19, cargo and mail throughput at Beijing Capital Airport and Tianjin Airport dropped sharply. However, air cargo at Shijiazhuang Airport went against the trend. Meanwhile, cargo and mail throughput at Daxing Airport was only 78,000 tons, which delayed the regulation of the unbalanced development of MLS in BTH.
In order to describe the development of the airports in these four urban agglomerations to also find the leading role of airports and cities in each urban agglomeration, we calculated the latest HHI of these four urban agglomerations in 2022, as in
Table 6.
The ascending sort of the 2022 HHI is coincidentally as same as the descending order of the overall level score of these four urban agglomerations. Airports with a market occupation of more than 15% in the MLS are considered significant airports. In BTH, the HHI is too large, and there is only one significant airport, indicating that a siphon effect is formed within it. In this case, it is not conducive to the development of other airports in urban agglomeration. Among these four urban agglomerations, the best situation is that, like GHM, various airports in GHM form echelons. The market share of HKG, CAN, and SZX is 54.70%, 24.54%, and 19.63%, respectively, which are all significant airports. Despite the impact of the epidemic on the global aviation industry, HKG, with its accessible air network, high operating efficiency, and advanced cargo facilities, has maintained sound development of air logistics and has become a leading cargo hub in the world. CAN continues to develop cross-border e-commerce, and its scale advantage continues to lead the country. The airport supports the transformation and upgrading of traditional manufacturing enterprises relying on cross-border e-commerce, fully stimulates the vitality of the cross-border e-commerce industry in the harbor, and promotes the development of aviation logistics in urban agglomeration. SZX has a strong supply chain and industrial belt, with obvious competitive advantages, and also gathers the largest cross-border e-commerce group. The development of aviation logistics at multiple airports in urban agglomerations should learn from GHM, regional coordination, and industrial cooperation of aviation logistics so as to effectively expand the radiation range of urban agglomerations, drive the development of surrounding areas, and promote the overall sound development of urban agglomerations.
4.3. Differentiation Characteristics of the Airport Logistics Service Chain
Figure 4 shows that from the perspective of airport logistics service supply, the airport logistics service chain scores of the four urban agglomerations had not entered the first level.
YRD, GHM, and C–C were at the second level, while BTH was at the third level. The airport logistics service chain in YRD was slightly better than that of the other three. YRD can be said to have “service blessing” development. Its performance can be described as follows: first, there were many core enterprises in the airport logistics service chain in YRD, such as air carriers, freight forwarders, and cargo handlers. The service range of those companies is also broad. Moreover, YRD has UPS, DHL, and FedEx transshipment centers, thus highlighting the advantages of urban agglomeration integration [
34]. Second, YRD has had a long period of industrial accumulation. YRD paid much attention to the external service environment. Product coverage, infrastructure, supporting functions, and organizational efficiency are good in YRD. Third, many freight carriers have introduced innovative development models. For example, Eastern Air Logistics Co. took the lead in opening up mixed-ownership reforms and creating integrated “door–to–door” logistics capability. Furthermore, JD.COM has proposed building the Wuhu Logistics Air Cargo Hub to enhance the overall service capability of the airport logistics service chain.
The airport logistics service chains in C–C and BTH are different. On the one hand, the number of freight carriers in C–C is greater than that in BTH; on the other hand, there is more investment in large- and medium-sized projects of airport fixed assets in C–C. There is much room for future development in C–C. Some new airports are emerging, such as Chengdu Tianfu Airport and Chongqing Second Airport, which will provide more logistics service support for China’s western region.
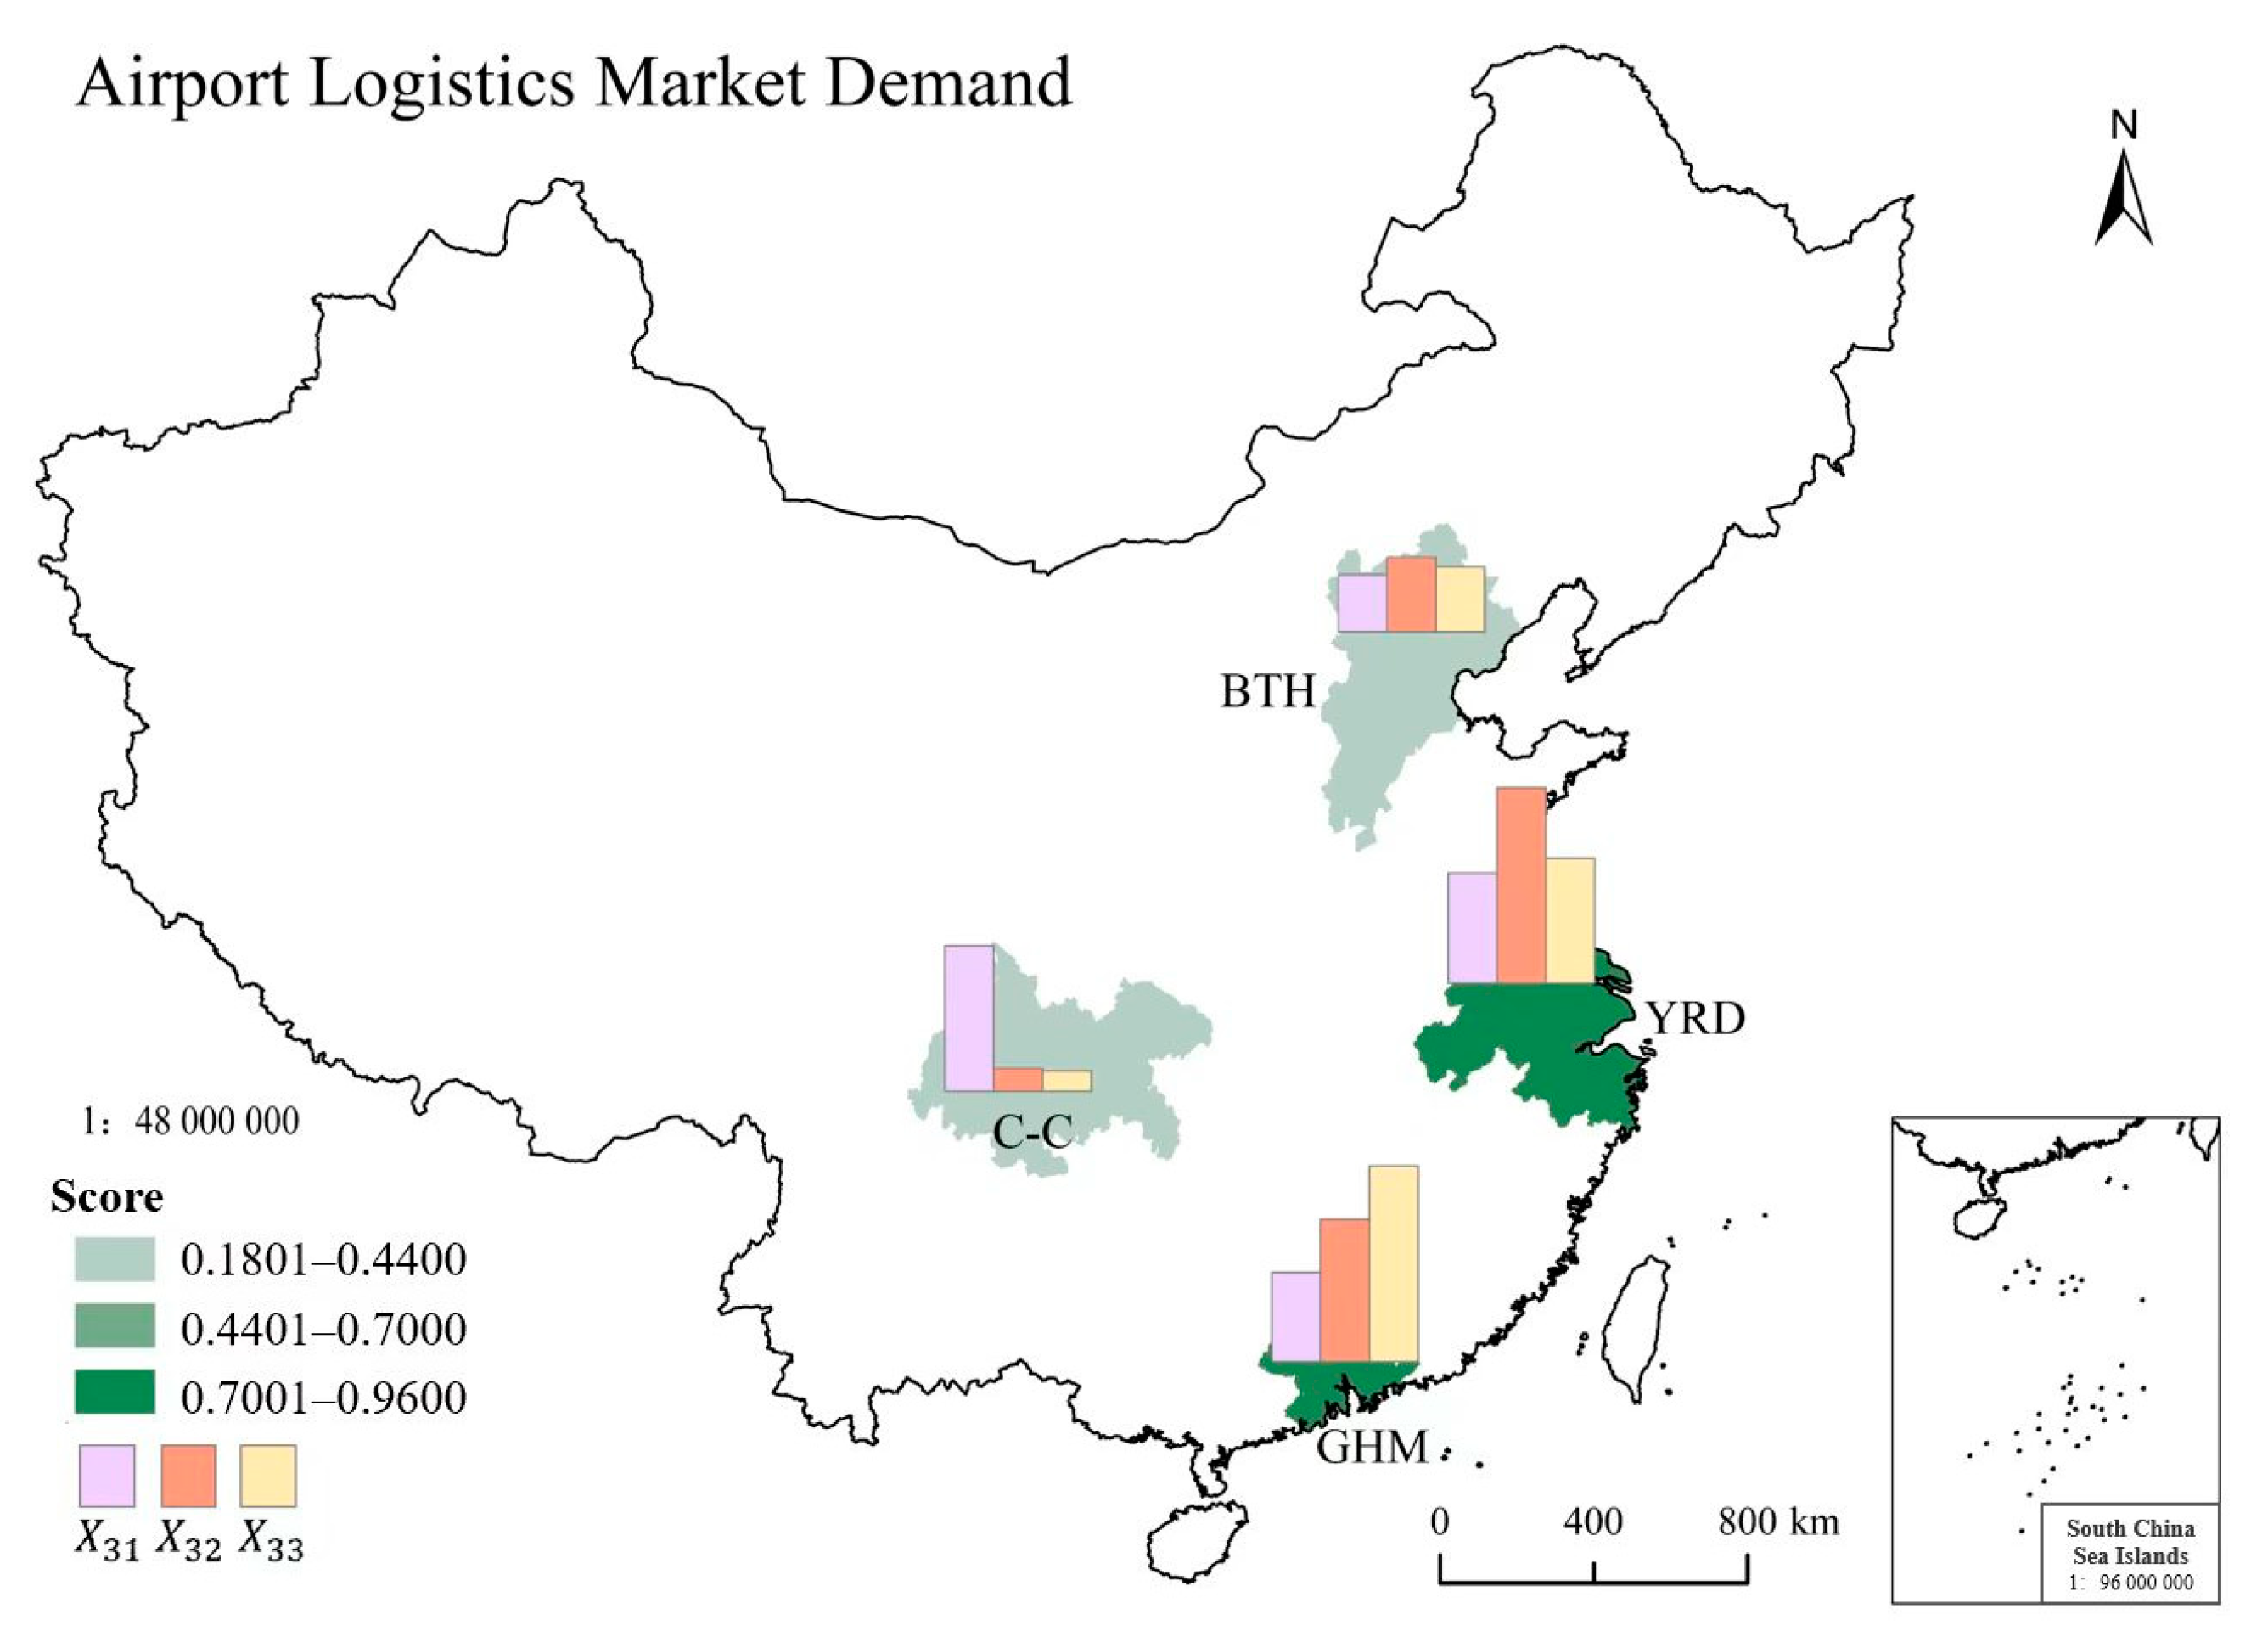
4.4. Differentiation Characteristics of Airport Logistics Market Demand
Consumption is becoming the main driving force of economic development, and it continues to drive the rapid growth of cargo transportation. As shown in
Figure 5, in terms of airport logistics market demand, GHM and YRD are at the first level, while BTH and C–C are at the third level.
(1) GHM has high economic density, per capita GDP, and urbanization. Its economic foundation, consumption power, and market demand are good. The superposition effect of free-trade-related systems provides space for industrial development and stimulates market demand for airport logistics. Moreover, scientific and technological innovation has developed quickly in GHM. The number of high-tech industrial enterprises and their imports and exports are at the forefront in Guangdong Province.
(2) Industries in YRD’s cities are highly consistent with each other (e.g., the integrated circuit industry). Wuxi, Suzhou, Nanjing, and Hefei are among the top 10 integrated circuits in China. The vertical integration of industrial chains in YRD has formed efficient synergy.
(3) Unbalanced industrial development in BTH has led to unbalanced market demand. Although there is some coordinated industrial development in BTH [
35], the industrial fit between Beijing and other cities is not high. The industrial structure of BTH is poor, resulting in a low demand score for the airport logistics market.
(4) Although C–C’s cargo and mail throughput is growing rapidly, the airport logistics foundation is still weak. The core cities in C–C are different from their surrounding cities, and demand is uneven.
5. Conclusions and Suggestions for High-Quality Development
We investigated spatial differentiation in MLS in China. First, we constructed an index system for MLS development level in urban agglomerations with 13 indexes. Second, we collected data from 67 cities and 42 airports in China. Then, we evaluated four major urban agglomerations in China using the entropy–CRITIC weight method. Finally, we analyzed the overall scores and sub-scores of MLS development in the four agglomerations. We found the following:
MLS development in GHM benefitted from airport logistics resources and market demand. Overall, high-quality resources stimulated market demand, with a focus on “resource–supported” development. Compared with GHM, MLS development in YRD was slightly inferior in terms of airport logistics resources and market demand. Owing to strong demand, YRD’s service-chain score ranked first. The overall development of airport logistics in C–C and BTH was not good; C–C’s overall development was better than that of BTH. In addition to the air logistics service chain, in the other three aspects, the level of BTH is higher than C–C, but the gap between these two is not large. However, in terms of the service chain, C–C is far ahead of BTH, whose score is only two-thirds of that of C–C. It was pointed out in 4.3 that C–C outperforms BTH in two aspects, i.e., the number of freight carriers operating in >two airports and the amount of investment in large- and medium-sized projects of airport fixed assets, which have high weights in the evaluation process.
Based on these findings, to achieve high-quality development and support the overall national transportation network, MLS development in urban agglomerations should include the following:
- (1)
The government should design the top-level logic of MLS to cooperate with each airport in the urban agglomeration. Each airport should clarify its strategy and develop differently.
- (2)
The government should pay attention to logistics resources and learn from GHM. This can include improving the accessibility of the air cargo network, enriching air logistics resources, opening all-cargo routes, and increasing the number of access points. The government should support cargo airlines in cooperating with e-commerce and express delivery companies, promote the development of cross-border e-commerce businesses, increase the cargo capacity of all-cargo aircraft, and improve their utilization. The government should set up different types of designated supervision sites to promote intensive supervision by customs.
- (3)
The government should learn from YRD and emphasize the airport logistics service chain. Considering the status quo in airport logistics services, the government should optimize the infrastructure and functional facilities of airport cargo terminals to improve the efficiency of customs clearance. The government should also promote innovation in freight carrier modes, introduce airlines with their own aircraft, enhance the comprehensive service capability of airport logistics, and attract international freight-forwarding companies to relocate there.
- (4)
The government should try to expand market demand. In this aspect, C–C has potential. The government should focus on stimulating an increase in the airport logistics demand market and generating higher airport logistics demand. The government should seize the opportunity to increase international freight demand in the global context of COVID-19. The government should also expand its opening up to the outside world. This could help create a better business environment that would adapt to China’s current development pattern.
The spatial differentiation in multi-airport logistics in urban agglomerations presented here improves our understanding of airport logistics in China. The findings can provide support in terms of regional differences for the high-quality development of airport logistics in urban agglomerations. However, because of the effects of COVID-19, our data did not extend beyond 2019, and there was a lack of further penetration of airport logistics in each agglomeration. In the future, the internal reasons for spatial differentiation in MLS can be further illustrated through the identification of key influencing factors.


