Abstract
Exploring the coupling coordination degree between supply and demand and its key influencing factors is important for ecological security and socioeconomic sustainable development in resource-based cities. On the basis of measuring the supply and demand of ecosystem services in 125 resource-based cities in China from 2000 to 2020, we analyzed the matching pattern and coupling coordination degree between supply and demand. The Spearman correlation analysis and quantile regression models were used to explore the impacts of the natural and socioeconomic factors on the coupling coordination degree between supply and demand. The results indicate that the supply and demand of ecosystem services in resource-based cities exhibits obvious spatiotemporal heterogeneity. Cities with a higher ecosystem service demand are mainly located in Eastern China. Cities with a higher ecosystem service supply are mainly concentrated in Western China. The ecosystem service supply decreased, while the demand increased over time. In addition, the coupling coordination degree between supply and demand is low and increased slowly over time. Population density, economic density, construction land, arable land and grassland have significant effects on the supply–demand relationship in resource-based cities. The elasticity coefficients obtained from the quantile regression model imply that the effects are significantly heterogeneous in terms of time and the level of coupling coordination degree.
1. Introduction
As a special type of city with natural resource extraction and processing as the leading industries, resource-based cities provide a strong guarantee of energy and resources for national economic development [1]. However, long-term intensive mining activities have significantly affected the ecological processes and ecosystem services. In 2012, the State Council issued the “National Sustainable Development Plan for Resource-based Cities (2013–2020)”, marking a shift from policy interference to policy guidance and placing more emphasis on the sustainable development of resource-based cities [2]. After that, the government issued “General Plan for the Transformation and Relocation Project of Independent Industrial and Mining Areas”, “Special Plan for the Comprehensive Management of Coal Mining Subsidence Areas” and other policies to promote sustainable development [3,4,5]. The successful ecological transformation of these cities is of significance to achieve sustainable development. The ecosystem services of the resource-based cities must be urgently and effectively analyzed [6].
The relationship between supply and demand of ecosystem services can effectively reflect the state of regional economic development and the balance of ecological and environmental quality. Investigation of the relationship between supply and demand and its influencing factors are important for solving ecological problems and promoting high-quality development in resource-based cities [7]. Ecosystem service supply refers to the natural resources and services that are physically available for use within a given spatial and temporal context, while the ecosystem service demand is the consumption and use of goods and services produced from such ecosystems by humans [8,9]. The supply and demand together constitute the dynamic flow of ecosystem services from natural ecosystems to human social systems, and the supply–demand relationship reveals the intricate and dynamic linkages between ecosystems and human society [10,11]. Under the influence of both resource exploitation and urbanization, resource-based cities are facing a prominent ecological crisis and enormous pressure on socioeconomic development. Research on the supply–demand relationship of ecosystem services and its key influencing factors can effectively clarify the intrinsic links between human and social needs and the natural ecosystem and, thus, support the formulation of the regional ecological protection and sustainable socioeconomic development policies.
In this study, we aim to use resource-based cities as the research object and reveal the relationship between the supply and demand of ecosystem services and its influencing factors in resource-based cities. This study has four objectives: (1) to quantify the supply and demand of ecosystem services in resource-based cities in China; (2) to reveal the characteristics of the supply–demand relationship of ecosystem services in resource-based cities during the study period; (3) to investigate the impacts of the natural and socioeconomic factors on changes in coupling coordination degree between supply and demand; (4) to propose the policy implications for the ecosystem management and sustainable development of resource-based cities.
2. Literature Review
2.1. Literature Review
The concept of ecosystem service supply was firstly associated with ecological carrying capacity, which referred to the ability to supply resources in a given area [8,9]. Ecosystem service demand refers to the quantity and quality of ecosystem services required by humans, which is generally expressed by public preferences, desires and direct use or consumption. With the development of socioeconomic and increasing land development, the deterioration of the ecological environment could result in a significant decrease in the ecosystem service supply and an imbalance in supply–demand. The imbalance has caused the phenomenon of ecological deficit and environmental injustice. The analysis of the supply–demand relationship can help inform effective ecological management and can generate useful information for planning and integrating ES frameworks into decision-making processes. Numerous previous studies were conducted to analyze the relationship between the supply and demand of ecosystem services [12,13,14].
A large number of studies have been conducted on the assessment methods of ecosystem service value, but methodology differences lead to wide variation in the results. The method of accounting for the value of ecosystem services based on the value equivalent factor per unit area has been widely applied. The method is based on the classification of ecosystem service functions by Costanza et al. [9] and the construction of expert knowledge based on the ecosystem service value method by Xie et al. [15]. The method has been widely used to assess the ecosystem service value in recent years [16,17]. The equivalent factor method is more intuitive and easier to use, and the data are easily obtained, which is particularly suitable for the assessment of ecosystem service value on a large scale. Therefore, the equivalent factor method is selected in this study.
In recent years, some scholars have gradually focused on regional supply and demand patterns and spatial matching analysis, but the difference in measurement units between ecosystem service supply and demand brings a challenge to further analysis [18]. As a comprehensive and effective indicator, coupling coordination degree can alleviate the problem through indicating whether two separated systems are coordinated [19]. There are few studies on the theory and application of coupling coordination degree between ecosystem service supply and demand [20]. In addition, most of the studies focus on the spatial pattern characteristics of supply–demand relationships without considering their spatiotemporal dynamics, and research on the spatiotemporal evolution of supply–demand relationships still needs to be enriched.
So far, the exploration of the influencing factors that affect the relationship between ecosystem service supply and demand is still limited. Xie et al. investigated the relationship between urban expansion, climate change and the value of ecosystem services [21,22]. Wang et al. analyzed the relationship between vegetation cover, precipitation, altitude and ecosystem services in the Ziwuling region [23]. However, these studies mainly focused on a single type of influencing factor, thus ignoring the comprehensive effect of various natural and socioeconomic influencing factors. Previous studies used linear regression to identify the impacts of influencing factors on the supply–demand relationship [24,25]. The linear regression or ordinary least square (OLS) model focuses on modeling the conditional mean of a response variable without accounting for the full conditional distributional properties of the response variable. The quantile regression model does not restrict attention to the conditional mean but permits estimation of the whole conditional distribution of a response variable, and it approximates quantile exact effects, which explain the impact of the covariates, not only in the middle but also on the extremes of the distribution of the outcome variables. It allows researchers to investigate the effects of independent variables on different quantiles of the dependent variable. Thus, the quantile regression model can be applied to more accurately describe the effect of these factors throughout the entire distribution of supply–demand relationships [26,27].
Although, the previous studies made relatively significant progress in the supply–demand relationship and its influencing factors, comprehensive research on the spatial relationships and determinants of ecosystem service supply–demand mismatches remains rare. Firstly, the study on the spatiotemporal dynamics of supply–demand relationships needs to be enriched. Secondly, most of the current studies on supply–demand relationships focus on river basins, urban agglomerations or a particular city, while research on a particular type of city is scarce. Thirdly, little attention has been paid to exploring the impacts of socioeconomic factors throughout the entire distribution of the coupling coordination degree between supply and demand.
2.2. The Main Work and Innovations
Based on the socioeconomic data and the land use situation in resource-based cities in China from 2000 to 2020, we evaluated the value of ecosystem services using the revised equivalence factors and characterize demand for ecosystem services using the land development index (LDI) in this study. Furthermore, we quantitatively analyzed the coupling coordination degree between supply and demand in resource-based cities. Finally, the Spearman correlation analysis and quantile regression models were used to explore the impacts of the natural and socioeconomic factors on the coupling coordination degree between supply and demand.
Compared with previous studies, three main innovations made this study necessary. Firstly, we conducted studies on the supply and demand of ecosystem services from a macro perspective for specific types of cities. Secondly, we investigated the spatiotemporal evolution of supply and demand relationships between ecosystem services in resource-based cities over time. Thirdly, by involving natural and socioeconomic factors, the Spearman correlation analysis and quantile regression models were further applied to analyze the impacts of key influencing factors on changes in the supply–demand relationship of ecosystem services.
3. Research Methodology and Data Sources
3.1. Study Area
Resource-based cities represent a type of city in which the exploitation and processing of natural resources, such as local forests and ores, are the leading areas of industry [1]. In this paper, with reference to the list of 262 resource-based cities delineated in the National Plan for Sustainable Development of Resource-based Cities (2013–2020) [2], cities are taken as the basic spatial unit, and resource-based cities at the interior level of the list are identified as the research objects, with specific reference to the 2015 administrative division standards of cities. In total, 125 municipal administrative units are specified, and the total research area is 3,426,800 km2.
3.2. Data Sources and Processing
The data used in this paper include: (1) Land cover data with a spatial resolution of 30 m, obtained from GlobeLand30. The land cover data were preprocessed using ArcGIS 10.2 and reclassified into six land cover types for resource-based cities in China: arable land, wood land, grassland, water, construction land and unused land. (2) Economic density, population density, gross regional product and other socioeconomic data were obtained from the China Urban Development Bulletin, the China Urban Statistical Yearbook and the National Compilation of Information on the Costs and Benefits of Agricultural Products. (3) Administrative boundaries and other vector data were obtained from the Resource and Environment Data Cloud Platform.
3.3. Research Methodologies
3.3.1. Ecosystem Service Supply and Demand Assessment
Compared with other methods for assessing ecosystem services, the equivalent factor method is simpler in estimating ecosystem service values at larger scales and requires fewer data. By considering the research scale and the data availability in this study, the equivalent factor method was appropriate for calculating the supply of ecosystem services for resource-based cities in China. The equivalent factor method can be conducted based on the average annual value equivalents of various ecosystem services per unit area of different land use types. The equivalent factor table specified by Xie [15,28] was used in this study. There are four types of ecosystem services, including provision services, regulating services, supporting services and cultural services. The ecosystem service values were calculated as follows:
where represents the ecosystem service value (CNY). is the ecosystem service value for land use type (CNY). is the area of land use type (hm2), which is derived from the land cover data. is the value coefficient of the ith ecosystem service of the land use type (Yuan/hm2), which is shown in Table 1. The details of the calculation are listed in Supplementary Section S1.

Table 1.
Ecosystem service value coefficients per unit area/(CNY/hm2).
Demand for ecosystem services includes both products and services that can be obtained (consumed) and those that are desired. In this study, taking into account the drivers of ecosystem service change and the availability of data, with reference to Peng et al. [29,30,31], three of the socioeconomic indicators, namely, the degree of land use development, population density and economic density, were selected to construct a land development index (LDI) to express the demand for ecosystem services. Among them, the degree of land use development, i.e., the ratio of built-up land area to the total land area of the region, presented as a percentage, reflects the intensity of human consumption of ecosystem services: the larger the proportion of built-up land area is, the greater the degree of land development and use is, and the higher the human consumption of ecosystem services is. Population density can reflect the quantity of demand for ecosystem services: the higher the population density is, the greater the total demand for services is. Economic density reflects the affluence of a region and can indirectly reflect the level of human preference for access to ecosystem services: the stronger the region’s economy is, the higher the expected access to ecosystem services is. In order to eliminate the obvious differences in population density and economic density in a small number of extremely developed regions, which make the two indicators extremely volatile, the method of taking logarithms in statistics was used. The calculation formula is as follows:
where denotes the land development index of the th parcel. denotes the proportion of proportion of land used for construction of the th parcel. denotes the population density of the th parcel. denotes the economic density of the th parcel.
3.3.2. Ecosystem Service Supply and Demand Matching Model and Coupling Coordination Degree Model
This study used a four-quadrant approach to characterize the supply–demand matching pattern of ecosystem services [32]. The ESV and LDI were first standardized using z–score, and the standardized ecosystem service values were plotted on the X-axis and the land development index on the Y-axis, resulting in four quadrant partitions of high supply–high demand (H–H), high supply–low demand (H–L), low supply–high demand (L–H) and low supply–low demand (L–L).
The degree of coupling (C) and the degree of coupling coordination (D) together constitute the coupling coordination degree model, the former only singularly characterizing the strength of the coupling between the supply of and demand for ecosystem services and the latter building on this to better reflect the coupling coordination degree effects of both [1,19]. Therefore, this paper used the coupling coordination degree (D), which discriminates the degree of coupling coordination between the two interactive couplings and is calculated as follows:
where denotes the coupling between the supply of and demand for ecosystem services. and denote the standardized ecosystem service value and the ecosystem service demand index, respectively. denotes the coupling index. denote the weights of the supply of and demand for ecosystem services, respectively, both of which are 0.5. denotes the degree of coupling coordination between the supply of and demand for ecosystem services.
3.3.3. Quantitative Regression Model
As a statistical regression method, the quantile regression model was used to estimate quantitative distributions. The distribution of a variable in terms of a specific quantile was first defined, and the parameters were further estimated based on the characteristics of the observed data distribution and the regression explanatory variables. By eliminating the disadvantages of the least squares (OLS) method, quantile regression is less susceptible to outliers and can estimate the regression coefficients of the explanatory variables at different quartiles, which is suitable for models with heteroskedasticity and makes the estimation results more robust and complete [26,27]. This study adopted quantile regression models to comprehensively explore the correlation between the supply–demand relationship and influencing factors. By involving the coupling coordination degree between supply and demand as the explanatory variable and various land use and socioeconomic data as explanatory variables, quantile regression models estimated the impacts of various influencing factors on the supply–demand relationship. The regression parameters at the 0.1, 0.3, 0.5, 0.7 and 0.9 quartiles were measured in Section 4 to explore the differences in the influence of socioeconomic factors and land use at different levels of coupling coordination degree between the supply of and demand for ecosystem services. The calculation formula is as follows:
If the explanatory variable is given, is the value of the explained variable at the quantile. is a vector of explanatory variables, = (proportion of arable land, proportion of woodland, proportion of grassland, proportion of water area, proportion of land used for construction, proportion of unused land, population density, economic density). denotes the vector of regression coefficients at the quantile, satisfying the following conditions:
As the value of changes from 0 to 1, the trajectory of the conditional distribution of all on can be plotted, and the results of parameter estimation at the 0.1, 0.3, 0.5, 0.7 and 0.9 quartiles are given below to explore the differences in the influence of natural and socioeconomic factors at different levels of coupling coordination degree between supply and demand of ecosystem services.
4. Results Analysis
4.1. Spatiotemporal Evolution of Ecosystem Service Supply and Demand
The overall trend of the shrinking ecosystem service supply in resource-based cities from 2000 to 2020 was CNY 34.741 billion, a decrease of 6.35% (Table 2). In terms of the supply of ecosystem services from different land types, the grassland supply declined the most, reaching CNY 93.534 billion. The arable land supply shrank by CNY 18.545 billion, and the supply of ecosystem services from woodland was volatile, increasing by CNY 29.163 billion from 2000 to 2010 and decreasing by CNY 17.692 billion from 2010 to 2020. The supply of ecosystem services from water and unused land has continued to grow, increasing by CNY 62.621 billion and CNY 3.246 billion, respectively.
Table 2.
Supply of ecosystem services in resource-based cities nationwide (unit 108 CNY).
In terms of spatial distribution, there is a clear spatial divergence in ecosystem service supply, with highest-supply areas only in Hulunbuir City in the north, higher-supply areas mainly concentrated in western the West Mongolian Tibetan Autonomous Prefecture and other areas and lowest-supply and lower-supply areas mainly in the more economically developed cities in the east (Figure 1). In terms of temporal changes, the supply of ecosystem services in Bayingolin and Altay declined significantly from 2000 to 2020, while the supply of ecosystem services in the West Mongolian Tibetan Autonomous Prefecture, which is also a western region, increased significantly. The change in the supply of ecosystem services in the central region was relatively small.
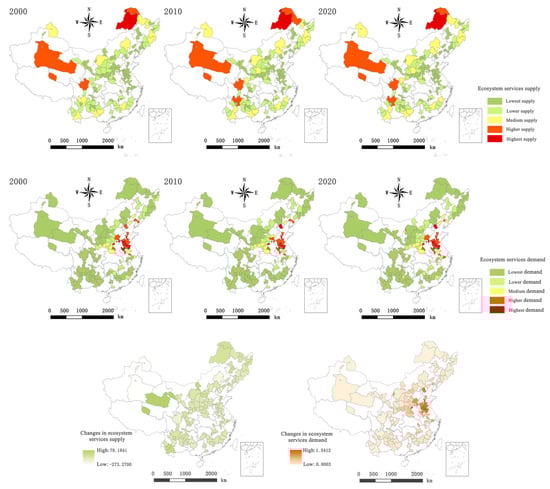
Figure 1.
Changes in demand and supply of ecosystem services.
The demand index for ecosystem services, as characterized by the LDI, increased from 0.21 in 2000 to 0.53 in 2020, an increase of 252.38%. In terms of spatial distribution, the highest- and higher-demand areas are concentrated in the central and eastern regions of Anhui, Zhejiang and Jiangsu. The demand index for ecosystem services is lower in resource-based cities in the west, north and south. In terms of temporal change, the increase in regional demand was consistent with regional population density, economic density and the distribution of land for construction, with a larger increase in the demand index for ecosystem services in the central and eastern regions and a lower increase relative to other regions (Figure 1).
4.2. Ecosystem Service Supply and Demand Matching Modes
This study used a four-quadrant approach to classify the supply–demand relationship for ecosystem services into high supply–high demand (H–H), high supply–low demand (H–L), low supply–high demand (L–H) and low supply–low demand (L–L) patterns. In terms of composition, the number of low-supply–low-demand (L–L) cities is the largest, with 53, 53 and 49 in 2000, 2010 and 2020, respectively. The number of high-supply–low-demand (H–L) cities is the second largest, with 39 in all three years. The number of low-supply–high-demand (L–H) cities is 32, 32 and 36 in 2000, 2010 to 2020, respectively. The number of high-supply–high-demand (H–H) cities is the lowest, with only one city, Nanyang (Figure 2).
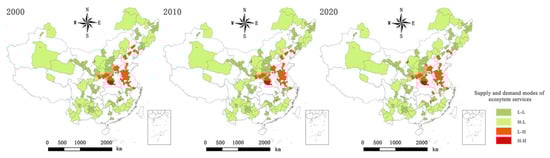
Figure 2.
Supply and demand modes in resource-based cities.
In terms of spatial distribution, low-supply–low-demand (L–L) cities are mainly in Gansu, Heilongjiang, Shanxi and some resource-based cities in the south with poor natural ecological backgrounds and less-developed economies. High-supply–low-demand (H–L) cities are mainly concentrated in the western, northern and southern regions, with better ecological backgrounds and less-developed economies, such as Baise City, Hulunbeier City and Bayingolin Mongol Autonomous Prefecture. Low-supply–high-demand (L–H) cities are mostly located in the eastern regions, with more developed socioeconomic development. Nanyang City is the only high-supply–high-demand (H–H) city.
From 2000 to 2020, the supply–demand matching patterns of individual cities remained basically stable, with six cities with low supply–low demand (L–L) decreasing, all transforming into low-supply–high-demand (L–H) cities, namely, Yangquan, Tongling, Pingxiang, Huangshi, Ezhou and Shizuishan, and two cities with low supply–high demand (L–H) decreasing, all transforming into low-supply–low-demand (L–L) cities, namely, Fuxin and Huludao.
4.3. Coupling Coordination Degree between Ecosystem Service Supply and Demand
A study by Cheng [33] classified the coupling coordination degree into five grades (Table 3). The mean value of the coupling coordination degree between ecosystem service supply and demand in resource-based cities from 2000 to 2020 is 0.23, which shows moderate imbalance, with a low total level, a slow growth trend (Table 4) and obvious spatial differentiation characteristics (Figure 3). Extremely imbalanced cities dominate in the west, mild- and on-the-verge-of-imbalance cities dominate in the east and moderate-imbalanced cities dominate in the south and north. In terms of temporal changes, the number of extremely imbalance and seriously imbalanced cities gradually decreased from 2000 to 2020, by 2 and 22, respectively, while the number of moderate-imbalanced and mild-imbalanced cities remained steady.
Table 3.
Division of the coupling coordination degree level.
Table 4.
Coupling coordination degree under different supply and demand matching modes.
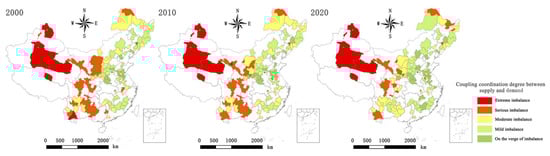
Figure 3.
Coupling coordination degree between supply and demand in resource-based cities.
In terms of different ecosystem service supply–demand matching modes, the mean values of the low-supply–low-demand (L–L) mode were 0.20, 0.21 and 0.23, respectively, which were at a moderate-imbalanced level. In the low-supply–high-demand (L–H) mode, the mean values of the supply–demand coupling coordination degree are 0.28, 0.29 and 0.27, respectively, which are in moderate imbalance. In the high-supply–low-demand (H–L) mode, the mean values of the supply–demand coupling coordination degree are 0.20, 0.21 and 0.23, respectively, which are in moderate imbalance. The mean values of the supply–demand coupling coordination degree in the high-supply–high-demand (H–H) mode were 0.40, 0.42 and 0.40, respectively, which were at the level of on the verge of imbalance (Table 3).
4.4. Influencing Factors of Supply of and Demand for Ecosystem Services in Resource-Based Cities
Based on the results of the Spearman correlation analysis (Table 5), five influencing factors showing significant correlations (p ≤ 0.05) with the degree of coupling coordination between supply and demand were selected: the proportion of cultivated land, the proportion of grassland, the proportion of construction land, population density and economic density. As a whole, the proportion of cultivated land, the proportion of land for construction, population density and land for construction consistently contributed to improvements in the supply–demand coupling coordination degree from 2000 to 2020, mainly because the total economic development level of resource-based cities was low relative to the supply of ecosystem services. Increasing the area of land for construction, population and economic growth to improve the ecosystem service can contribute to an increase in the level of supply–demand coupling coordination degree. The results of the correlation analysis show that there is a negative relationship between the proportion of grassland and the coupling coordination degree between supply and demand. The most resource-based cities in Western China, with high ecological environment quality and a low socioeconomic level, are categorized into the high-supply and low-demand type. For this type of city, the increase in the proportion of grassland could result in an increase in the ecosystem service supply, which, in turn, leads to a lower coupling coordination degree..
Table 5.
Results of Spearman correlation analysis.
A quantile regression model was further used to reveal the mechanism of the key influencing factors on the relationship between supply and demand at different levels of coupling coordination degree. As indicated by the quantile regression results (Table 6 and Figure 4), the influencing factors on the supply–demand coupling coordination degree of ecosystem services at different times and quantile points showed significant differences.
Table 6.
Elasticity coefficients of various factors under different levels of coupling coordination degree in resource-based cities, 2000–2020.
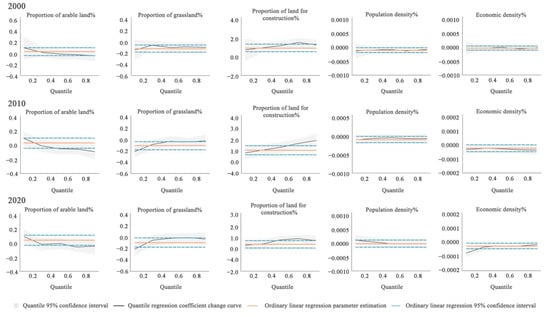
Figure 4.
Changes in elasticity coefficients of various factors at different quantile levels in the quantile regression model.
The proportion of cultivated land in the low coupling coordination degree range (quantile < 0.5) made a significant contribution to the coupling coordination degree from 2000 to 2020, while it had a negative impact in the medium and high coupling coordination degree range. This indicates that increasing the proportion of cultivated land and improving the supply of ecosystem services has a positive effect on coupling coordination degree in areas with a low level of coupling coordination degree. When the level of coupling coordination degree reaches a certain level, an increase in the proportion of cultivated land leads to an imbalance between supply and demand, which is detrimental to improvements in the coupling coordination degree. In most cases, there is a negative correlation between the proportion of grassland and the degree of coupling coordination, mainly due to the fact that an increase in the proportion of grassland aggravates the imbalance between the supply and demand of ecosystem services. There was a consistent positive correlation between the proportion of land used for construction and the degree of coupling coordination for the supply of and demand for ecosystem services from 2000 to 2020. For resource-based cities, which include a high number of cities with high supply–low demand (L–H), increasing the proportion of land for construction raises the demand for ecosystem services, thus changing the supply–demand imbalance. In the medium-to-high coupling coordination degree range (quantile ≥ 0.5), there is a negative correlation between population density and the supply and demand coupling coordination degree at each quantile, mainly due to the fact that the increase in population puts great pressure on the ecological environment, while this population agglomeration effect promotes economic growth and increased demand from residents, so the supply and demand of ecosystem services gradually becomes out of balance. Population density was positively correlated in the low coupling coordination degree range (quantile < 0.5) in 2020, with more high-supply–low-demand cities in the low coupling coordination degree range, where an increase in population density can lead to an increase in demand, thus facilitating the matching of supply and demand. In 2000, economic density was positively correlated with the supply and demand coupling coordination degree at all sub-points. On the one hand, this is mainly due to the low level of socioeconomic development and demand for ecosystem services at that time. On the other hand, the natural ecosystem structure was less disturbed, the services provided were stronger and the supply–demand relationship shows a situation where supply exceeded demand. Sustained economic growth increases the demand for ecosystem services and decreases the supply of ecosystem services, thus matching the supply and demand. During rapid socioeconomic development, the demand for ecosystem services continues to rise, while the supply continues to weaken, which resulted in a negative correlation between economic density and the supply and demand coupling coordination degree in 2010 and 2020.
5. Discussion
Ecosystem services are the basis for the survival and development of human society. The balance between the supply and demand of ecosystem services has an important impact on regional ecological security and sustainable socioeconomic development. It is important to study the relationship between the supply and demand of ecosystem services and its influencing factors [7]. Under the new development model, resource-based cities in China are facing a change in the method of factor concentration, the long-accumulated ecological safety problems need to be solved and resource-based cities are in a critical period of industrial structure transformation to achieve high-quality development [34].
Our findings suggest that resource-based cities face major challenges in preventing ecosystem services from degrading within the context of resource extraction and a rapid urbanization process. Over the period of 2000–2020, the total ecological service values decreased from 2000 to 2020 in resource-based cities, which is consistent with those of previous studies indicating that urbanization and coal mining subsidence land management were the main influencing factors for the spatial patterns of ecosystem services [35]. Furthermore, Zhu et al. and Wang et al. showed that the coupling coordination degree between urban development and ecosystem services exhibited increasing trends. In contrast to previous studies [36,37], however, the trends of supply–demand coupling coordination degree in resource-based cities varied significantly under different ecosystem service supply–demand matching modes from 2000 to 2020. The cited studies analyzed the spatial distribution of the value of ecosystem services in a resource-based city from the supply side of the ecosystem services, and they investigated the impacts of human activities and land use change on ecosystem services in resource-based cities. The results of these studies show that the value of ecosystem services in resource-based cities is gradually decreasing. This study quantified the supply and demand of ecosystem services in resource-based cities from a macro perspective and analyzed the matching patterns and coupling coordination degree between supply and demand over time.
Furthermore, the impacts of land use change and socioeconomic factors on the coupling coordination degree were investigated. The results support ecological environmental protection and the sustainable socioeconomic development of resource-based cities. Due to long-term resource exploitation and socioeconomic development, the ecological land of resource-based cities has been continuously encroached upon, and the ecosystem service supply capacity has been shrinking. The various physical conditions and socioeconomic levels lead to significant spatial heterogeneity in the relationship between supply and demand of ecosystem services in the study area. In addition, the impact of natural and socioeconomic factors on the coupling coordination degree between the supply and demand of ecosystem services varied spatially. Natural factors in resource-based cities, such as an increase in the proportion of arable land, could reduce the coupling coordination degree between the supply and demand of ecosystem services, while the proportion of grassland always shows a negative correlation with it. Socioeconomic factors are another key factor influencing the relationship between supply and demand in resource-based cities. During rapid urbanization, an increase in the proportion of unused land can increase the level of supply–demand coupling coordination degree, while economic density may be a catalyst in the early stages of urbanization, leading to an increase in supply–demand conflicts in the later stages, and an increase in population density can reduce the level of supply–demand coupling coordination. In addition, corresponding suggestions are made for the development of resource-based cities under different supply and demand matching modes to promote a high level of coupling coordination degree in resource-based cities.
Low-supply–low-demand (L–L) mode resource-based cities are currently facing the dilemma of a deteriorating ecological environment and the lagging development of traditional industries. They should implement the concept of green development, carry out ecological restoration of abandoned land, such as existing coal mining collapse sites and mine traces, and improve the quality of the urban ecological environment by increasing the number of parks and green areas, wetland landscape development, etc., while eliminating pollution at the source, implementing the main body responsible for environmental pollution and improving the ecological compensation mechanism. On top of improving the quality of the ecological environment, we focus on coordinating environmental protection with social and economic development, strive to create a superior business environment, guide the green transformation and upgrading of local industries, while actively introducing foreign high-tech industries and talents, balancing the regional industrial structure and promoting positive economic growth [2,34].
Low-supply–high-demand (L–H) mode resource-based cities have a high level of urbanization and low ecological quality. These cities should take the comprehensive management of sinkholes and related ecological restoration as an entry point to solve the problems of surface subsidence caused by over-exploitation and the serious pollution of land resources, water resources and the air environment. While investing in the treatment of existing pollution further and enhancing the carrying capacity of the ecological environment, new pollution emissions should be strictly limited to avoid the superposition of the pollution effects of environmental pollution factors. Approaches should include innovating ecological governance models, combining ecological environmental protection with urban construction planning, protecting and restoring ecological space in accordance with the principles of farming, forestry, grass and water as appropriate and promoting the construction of ecological civilization and sustainable socioeconomic development in resource-based cities [38,39].
High-supply–low-demand (H–L) mode resource-based cities have high ecological and environmental qualities, abundant natural resources and backward social development levels. The government’s guiding role in social and economic development should be brought into play, in response to the current situation of resource-based cities, where enterprises have short and single industrial chains and products lack competitiveness and have low profit margins. Cities should fully implement supply-side structural reforms, increase investment in technology, talent and innovation and adjust the proportion of traditional industries among the three industries by developing modern green industries, such as the Internet of Things and New Energy and Intelligent Manufacturing. On the basis of optimizing traditional industries, a diversified modern industrial system can be built to promote economic development [39,40,41].
The trend of supply–demand coupling coordination degree between 2000 and 2020 (Figure 3) shows that the increase in demand due to socioeconomic development led to an increase and then a decrease in the level of high-supply–high-demand (H–L) mode resource-based cities’ coupling coordination degree. These cities should focus on improving ecological quality in parallel with urban economic growth, play a guiding role in the public financing of ecological construction, formulate preferential policies to guide social capital to invest in environmental protection projects with certain economic benefits, focus on the green transformation of industrial structure, improve the efficiency of resource use while controlling corporate pollution emissions, increase publicity about environmental protection, raise awareness of environmental protection among regional residents and promote regional economic high-quality development [41,42].
Based on the calculation of the supply value, demand index, supply–demand relationship and coupling coordination degree of ecosystem services in resource-based cities from 2000 to 2020, this paper analyzed the changes in the coupling coordination degree under different supply–demand matching patterns and the influence of natural and socioeconomic factors on the coupling coordination degree of supply and demand in different coupling coordination degree zones, which can provide a reference for ecological environmental protection, socioeconomic coordination and sustainable development in the transformation process of resource-based cities. This paper provides a reference for the sustainable development of eco-environmental protection and socioeconomic coordination in resource-based cities.
6. Conclusions
This paper revealed the matching pattern and coupling coordination degree of the supply and demand of ecosystem services in resource-based cities from 2000 to 2020. Moreover, it explored the influence of socioeconomic factors, land use types and other influencing factors on the coupling coordination degree between the supply and demand and their spatiotemporal heterogeneity. The findings could provide a reference for the coordinated and sustainable development of ecological environmental protection and socioeconomic development in resource-based cities.
In summary, the supply and demand of ecosystem services in resource-based cities shows obvious spatiotemporal divergences. In terms of the spatial distribution, cities with a higher ecosystem service demand are mainly located in Eastern China. The western part is dominated by grassland and unused land, with a developed livestock industry, low population, economic density and a high supply of ecosystem services. From 2000 to 2020, the supply of ecosystem services in resource-based cities in China was high but showed a slight decrease, while the spatial differences in demand levels were obvious and showed a significant increase. In addition, the overall supply–demand coupling coordination degree was low and increased slowly over the study period. The coupling coordination degree in resource-based cities varied significantly for different ecosystem service supply–demand matching modes. Finally, population density, economic density, built–up land, arable land and grassland have important effects on the supply–demand relationship in resource-based cities, and the effects are significantly heterogeneous in terms of time and the level of coupling coordination degree.
Finally, it should be noted that there is still room for deepening our research. Firstly, we did not consider the spatial heterogeneity of ecosystem service value coefficients when assessing the ecosystem service values for different cities, and the associated correction of ecosystem service value coefficients for different cities is a feasible direction for future research. In addition, this study analyzed the impact of five natural and socioeconomic factors on the ecosystem service supply–demand relationship in resource-based cities due to difficulty in obtaining complete natural and socioeconomic data on soil types, food production, sulphur dioxide emissions, etc. Research on the evolution of the relationship between the supply and demand of ecosystem services under the combined effect of multiple influencing factors will help to develop scientific and efficient ecosystem management strategies. Therefore, future research should take into account the development history and characteristics of the study area and introduce more types of influencing factors to conduct in-depth research to improve the accuracy of the research results.
Supplementary Materials
The following supporting information can be downloaded at: https://www.mdpi.com/article/10.3390/su15097397/s1, Section S1: The calculation of ecosystem service value coefficient; Table S1. The equivalent weight factor of ESV per unit area of terrestrial ecosystem in China.
Author Contributions
Conceptualization, H.Z. and C.L.; data curation, H.Z.; formal analysis, H.Z. and C.L.; funding acquisition, C.L.; investigation, M.G.; methodology, H.Z. and M.G.; project administration, C.L.; resources, C.L.; software, H.Z. and M.G.; writing—originaldraft, H.Z.; writing—review and editing, H.Z., C.L. and M.G. All authors have read and agreed to the published version of the manuscript.
Funding
National Natural Science Foundation of China, China (Grant Number: 42001241); Basic Research Program of Xuzhou (Grant Number KC22045); Project of Social Science Foundation of Jiangsu Province, China (Grant Number: 20SHD010).
Institutional Review Board Statement
Not applicable.
Informed Consent Statement
Not applicable.
Data Availability Statement
Not applicable.
Conflicts of Interest
The authors declare no conflict of interest.
References
- Liu, Y.; Wang, D.L. Evaluation of Ecological Efficiency and Promotion Potential of Industrial Ecosystem in Coal City. Min. Saf. Environ. Prot. 2017, 44, 99–105. [Google Scholar]
- The National Sustainable Development Plan for Resource–based Cities (2013–2020). Available online: http://www.gov.cn/gongbao/content/2013/content_2547140.htm (accessed on 1 February 2023).
- Yu, J.H.; Zhang, W.Z.; Wang, D. Evaluation on the transformation effect of resource–exhausted cities in China. J. Nat. Resour. 2011, 26, 11–21. [Google Scholar]
- Yu, J.H.; Li, J.M.; Zhang, W.Z. Identification and classification of resource–based cities in China. J. Geogr. Sci. 2019, 29, 1300–1314. [Google Scholar] [CrossRef]
- Liu, X.W.; Shen, W.F.; Duan, P.X.; Li, Q. Evaluation on sustainable development transformation of coal exhausted cities in the New Era. China Min. 2020, 29, 75–82. [Google Scholar]
- Zhao, J.Y. A Research Review and Prospect on the Transformation and Development of Resource–based Cities in China. Econ. Probl. 2021, 11, 17–25. [Google Scholar]
- Liu, L.C.; Liu, C.F.; Wang, C.; Li, P.J. Supply and demand matching of ecosystem services in loess hilly region: A case study of Lanzhou. Acta Geogr. Sin. 2019, 74, 1921–1937. [Google Scholar]
- Daily, G.C. Nature’s Services: Societal Dependence on Natural Ecosystems; Island Press: Washington, DC, USA, 1997. [Google Scholar]
- Costanza, R.; d’Arge, R.; de Groot, R.; Farberk, S.; Grasso, M.; Hannonf, B.; Limburg, K.; Naeemh, S.; O’Neill, R.V.; Parueloj, J.; et al. The value of the world’s ecosystem services and natural capital. Nat. Int. Wkly. J. Sci. 1997, 387, 253–260. [Google Scholar]
- Zhang, L.W.; Fu, B.J. The progress in ecosystem services mapping: A review. Acta Ecol. Sin. 2014, 34, 316–325. [Google Scholar]
- Wang, J.; Zhai, T.L.; Lin, Y.F.; Kong, X.S.; He, T. Spatial imbalance and changes in supply and demand of ecosystem services in China. Sci. Total Environ. 2018, 657, 781–791. [Google Scholar] [CrossRef] [PubMed]
- Xie, Y.C.; Zhang, S.X.; Lin, B.; Zhao, Y.J.; Hu, B.Q. Spatial zoning for land ecological consolidation in Guangxi based on the ecosystem services supply and demand. J. Nat. Resour. 2020, 35, 217–229. [Google Scholar]
- Gu, K.K.; Yang, Q.Q.; Cheng, F.; Chu, J.L.; Chen, X.H. Spatial Differentiation of Anhui Province Based on the Relationship Between Supply and Demand of Ecosystem Service. J. Ecol. Rural. Environ. 2018, 34, 577–583. [Google Scholar]
- Guan, Q.C.; Hao, J.M.; Xu, Y.Q.; Ren, G.P.; Kang, L. Zoning of agroecological management based on the relationship between supply and demand of ecosystem services. Resour. Sci. 2019, 41, 1359–1373. [Google Scholar]
- Xie, G.D.; Lu, C.X.; Leng, Y.F.; Zheng, D.U.; Li, S.C. Ecological assets valuation of the Tibetan Plateau. J. Nat. Resour. 2003, 18, 189–196. [Google Scholar]
- Zhou, L.L.; Zhang, H.Z.; Bi, G.H.; Su, K.C.; Wang, L.; Chen, H.J.; Yang, Q.Y. Multiscale perspective research on the evolution characteristics of the ecosystem services supply–demand relationship in the Chongqing section of the three gorges reservoir area. Ecol. Indic. 2022, 142, 109227. [Google Scholar] [CrossRef]
- Jia, Y.; Liu, Y.; Zhang, S.L. Evaluation of Agricultural Ecosystem Service Value in Arid and Semiarid Regions of Northwest China Based on the Equivalent Factor Method. Environ. Process. 2021, 8, 713–727. [Google Scholar] [CrossRef]
- Yang, M.H.; Zhao, X.N.; Wu, P.T.; Hu, P.; Gao, X.D. Quantification and spatially explicit driving forces of the incoordination between ecosystem service supply and social demand at a regional scale. Ecol. Indic. 2022, 137, 108764. [Google Scholar] [CrossRef]
- Li, W.J.; Wang, Y.; Xie, S.Y.; Cheng, X. Coupling coordination analysis and spatiotemporal heterogeneity between urbanization and ecosystem health in Chongqing municipality, China. Sci. Total Environ. 2021, 719, 148133. [Google Scholar] [CrossRef] [PubMed]
- Xin, R.H.; Skov–Petersen, H.; Zeng, J.; Zhou, J.H.; Li, K.; Hu, J.Q.; Liu, X.; Kong, J.W.; Wang, Q.W. Identifying key areas of imbalanced supply and demand of ecosystem services at the urban agglomeration scale: A case study of the Fujian Delta in China. Sci. Total Environ. 2021, 791, 148173. [Google Scholar] [CrossRef]
- Xie, H.L.; Liu, L.M.; Li, B.; Zhang, X.S. Spatial autocorrelation analysis of multi–scale land–use changes: A case study in Ongniud Banner, Inner Mongolia. Acta Geogr. Sin. 2006, 61, 389–400. [Google Scholar]
- Pecl, G.T.; Araújo, M.B.; Bell, J.D.; Blanchard, J.; Bonebrake, T.C.; Chen, I.-C.; Clark, T.D.; Colwell, R.K.; Danielsen, F.; Evengård, B.; et al. Biodiversity redistribution under climate change: Impacts on ecosystems and human well–being. Science 2017, 355, 1389–1398. [Google Scholar] [CrossRef]
- Wang, S.M.; Jin, T.T.; Yan, L.L.; Gong, J. Trade–off synergy among ecosystem services and the influences factors in the Ziwuling Region, Northwest China. Chin. J. Appl. Ecol. 2022, 33, 3087–3096. [Google Scholar]
- Deng, L.Z.; Yang, Z.H.; Su, Z.H. Valuing the Water Ecosystem Service and Analyzing Its Impact Factors in Chongqing City Under the Background of Urbanization. Res. Soil Water Conserv. 2019, 26, 208–216. [Google Scholar]
- Xu, N.Y.; Guo, L.; Xue, D.Y.; Sun, S.Q. Land use structure and the dynamic evolution of ecosystem service value in Gannan region, China. Acta Ecol. Sin. 2019, 39, 1969–1978. [Google Scholar]
- Fang, D.C.; Pei, M.D. Study on Spatial Heterogeneity of Chinese Innovation Level and Its Influencing Factors––Based on GWR and Quantile Regression Analysis. Contemp. Econ. Manag. 2019, 41, 36–42. [Google Scholar]
- Liu, J.J.; Wang, J.; Dai, J.W.; Zhai, T.L.; Li, Z.H. The relationship between supply and demand of ecosystem services and its spatio–temporal variation in the Yellow River Basin. J. Nat. Resour. 2021, 36, 148–161. [Google Scholar] [CrossRef]
- Xie, G.D.; Zhang, C.X.; Zhang, L.M.; Chen, W.H.; Li, S.M. Improvement of the Evaluation Method for Ecosystem Service Value Based on Per Unit Area. J. Nat. Resour. 2015, 30, 1243–1254. [Google Scholar]
- Peng, J.; Yang, Y.; Xie, P.; Liu, Y.X. Zoning for the construction of green space ecological networks in Guangdong Province based on the supply and demand of ecosystem services. Acta Ecol. Sin. 2017, 37, 4562–4572. [Google Scholar]
- Huang, Z.X.; Wang, F.F.; Cao, W.Z. Dynamic analysis of an ecological security pattern relying on the relationship between ecosystem service supply and demand: A case study on the Xiamen–Zhangzhou–Quanzhou city cluster. Acta Ecol. Sin. 2018, 38, 4327–4340. [Google Scholar]
- Villamagna, A.M.; Angermeier, P.L.; Bennett, E.M. Capacity, pressure, demand, and flow: A conceptual framework for analyzing ecosystem service provision and delivery. Ecol. Complex. 2013, 15, 114–121. [Google Scholar] [CrossRef]
- Xu, M.; Zhang, J.; Liu, G.B.; Qu, T.T.; Zheng, Q.M. Analysis on Vegetation–Soil Coupling Relationship in Gullies with Different Vegetation Restoration Patterns. J. Nat. Resour. 2016, 31, 2137–2146. [Google Scholar]
- Cheng, M.L.; Li, Q.; Wen, Z.J. Coupling coordination degree analysis and driving factors of innovation network and eco–efficiency in China. Environ. Impact Assess. Rev. 2023, 99, 107008. [Google Scholar] [CrossRef]
- Zhang, W.Z.; Yu, J.H. Policy evolution and transformation effect analysis of sustainable development of resource–based cities in China. J. Nat. Resour. 2023, 38, 22–38. [Google Scholar] [CrossRef]
- Chen, M.N. Ecological Restoration Zoning of Resource–basedCities Based on Ecosystem Services––A case study of Jiawang district. China Univ. Min. Technol. 2022. [Google Scholar] [CrossRef]
- Zhu, S.C.; Huang, J.L.; ZhaoY, L. Coupling coordination analysis of ecosystem services and urban development of resource–based cities: A case study of Tangshan city. Ecol. Indic. 2022, 136, 108706. [Google Scholar] [CrossRef]
- Wang, Q.S.; Liu, M.Q.; Tian, S.; Yuan, X.L.; Ma, Q.; Hao, H.L. Evaluation and improvement path of ecosystem health for resource–based city: A case study in China. Ecol. Indic. 2021, 128, 107852. [Google Scholar] [CrossRef]
- Implementation Plan for Supporting the High–Quality Development of Industrial Transformation and Upgrading Demonstration Zones in Old Industrial Cities and Resource–based Cities in the 14th Five–Year Plan. Available online: https://www.ndrc.gov.cn/xxgk/zcfb/tz/202111/t20211130_1306223.html (accessed on 1 February 2023).
- Several Opinions of the State Council on Promoting the Sustainable Development of Resource–based Cities. Available online: http://www.gov.cn/zhengce/content/2008-03/28/content_4941.htm (accessed on 1 February 2023).
- The “14th Five–Year Plan” to Promote High–Quality Development of the National Standards System Construction Plan. Available online: http://ncse.sac.gov.cn/sxxgk/zcwj/202112/t20211222_349879.html (accessed on 1 February 2023).
- Guiding Opinions on Strengthening Classification and Guiding the Cultivation of New Dynamic Energy for Transformation and Development of Resource–Based Cities. Available online: https://www.ndrc.gov.cn/xxgk/zcfb/tz/201701/t20170125_962892_ext.html (accessed on 1 February 2023).
- “Fourteen Five” National Cleaner Production Promotion Program. Available online: https://www.ndrc.gov.cn/xxgk/zcfb/tz/202111/t20211109_1303467.html (accessed on 1 February 2023).


Disclaimer/Publisher’s Note: The statements, opinions and data contained in all publications are solely those of the individual author(s) and contributor(s) and not of MDPI and/or the editor(s). MDPI and/or the editor(s) disclaim responsibility for any injury to people or property resulting from any ideas, methods, instructions or products referred to in the content. |
© 2023 by the authors. Licensee MDPI, Basel, Switzerland. This article is an open access article distributed under the terms and conditions of the Creative Commons Attribution (CC BY) license (https://creativecommons.org/licenses/by/4.0/).