Abstract
The demand for sustainable alternative-fuels in the transportation and agriculture domains is essential due to the quick depletion of petroleum supplies and the growing environmental challenges. The ternary-blends (diesel, biodiesel, and Methyl oleate) have the ability to report the existing challenges in this area because they offer significant promise for reducing exhaust emissions and improving engine performance. In the current work, soy methyl ester is blended with methyl oleate and diesel. The emissions and performance of blended biodiesel was conducted in common rail direct injection engine (CRDI). The characterization and physical properties were also evaluated by utilizing various methods like Fourier-Transform Infrared Spectroscopy (FTIR), UV-vis Spectroscopy (UV-vis), and Nuclear Magnetic Resonance. FTIR spectra showed the existence of the strong C=O, indicating the presence of FAME at 1745 cm−1. Again, UV-vis has reported the appearance of conjugated dienes in the oxidized biodiesel. The results indicated all blended samples retained the properties of diesel. The addition of methyl oleate improved brake specific fuel consumption of blended biodiesel almost near to diesel. D50::S80:M20 produced a mean reduction in hydrocarbon 42.64% compared to diesel. The average carbon monoxide emission reduction for D50::S80:M20 was 49.36% as against diesel.
1. Introduction
The rapid use of fossil fuels and the effects of exhaust emissions are putting a strain on the transportation sector and other industries. In such a situation, the use of biodiesel as a substitute fuel is crucial. They are created through the trans-esterification process from a variety of edible and inedible materials, including cooking oil, and meat tallow. Mono, poly, and unsaturated and saturated fatty-acid methyl-ester make up biodiesel’s composition. Some examples of fatty acid methyl esters (FAME) are methyl linoleate, methyl stearate, methyl linoleate, methyl oleate, etc. [1,2,3]. The Rapid Compression-Expansion Machine (RCEM) can be used to evaluate the benefits of biodiesel. Due to the varying fatty acid methyl ester compositions, biodiesels have different physio-chemical characteristics. In an effort to make biodiesel and its combustion characteristics useful, biodiesel alternative was taken into consideration, which is a unique fatty acid methyl ester. Evidently, the most suitable and sustainable substance was discovered to be methyl oleate (MO), which may be produced from agri-waste and non-edible oilseeds [4]. MO is found to be more easily available and accessible than other fatty acid methyl esters, moreover, it has suitable cetane number as compared to them. As a result, it serves as the foundation for several biodiesels [5]. The features of MO and the impact of its blend with diesel on combustion have been demonstrated in previous research efforts. Altaie et al. (2015) evaluated the impact of adding MO to palm oil methyl ester (PME) and how that affected diesel engine performance. The study found that the pure PME’s low oxygen content and weak reactivity caused a reduction in soot emissions and brake specific fuel consumption (BSFC). Additionally, enrichment by MO resulted in significant reductions in emissions and exhaust gas temperature (EGT), despite increasing fuel usage. Similar research has also been done on a diesel engine using methyl ester enrichment, and it was found that just 15% of the fatty acid methyl ester was required to meet the standards for lubrication and that the mixtures did not phase separate. Additionally, it was claimed that the unsaturated degree of MO proved advantageous because unburnt hydrocarbon (UHC) and CO level fell in comparison with when methyl-esters and methyl-stearate were utilized. When compared to rapeseed biodiesel, it was discovered that C18:1 had lower quantities of NOx and soot [6]. In a diesel engine, Soloiu et al. (2013) studied a combination of MO and pure diesel. According to reports, the peak HRR and peak pressures significantly decreased, and the ignition delay (ID) was 20% shorter than it was for pure diesel. Due to the lower energy density, the NOx level was lowered by 20%, but the break specific fuel conversion (BSFC) saw an increase of 10% [4]. Compared to the standard combustion mode, the CRDI (Common Rail Direct Injection) engine’s reactivity-controlled compression ignition (RCCI) mode leads to decreased concentrations of NOx and soot. The CRDI engine was fueled with a blend of MO and n-butanol [7].
Engine performance increased when MO was used to fuel diesel [8]. In order to investigate the oxidation of blends of n-decane methyl oleate at various temperatures, Bax et al. (2010) employed a jet stirred reactor. When the reactant mole fractions were compared, it was found that in the low temperature zone, Methyl palmitate (MP) exhibited greater reactivity than MO, while in the region with a negative temperature coefficient, MO was more reactive than MP [9]. Lata et al. (2021) studied exhaust gas recirculation (EGR) using hydrogen fuel on dual fuel diesel engine, which drastically reduced 75% NOx formation by adding 15% EGR [10]. Sener and Giil (2021) revealed decrease in NOx, CO emissions in single cylinder direct injection (DI) diesel engine. Authors have performed shape optimization for increasing the combustion efficiency and emissions reduction [11]. Brake thermal efficiency (BTE) enhanced in 40% heptanol biodiesel blended fuel. This ternary blend showed the lowest BSFC 0.305 kg/kWh [12]. In biodiesel and diesel blends, alcohols can be safely utilized in the volumetric percentage range of 5% to 40%. Whereas biodiesel can be used anywhere between 5% and 80% of the amount. Alcohol and biodiesel have higher oxygen contents than diesel, ensuring complete combustion. Because biodiesel and alcohol have a lower energy density and calorific value, they have less brake power (BP) and use more fuel BSFC overall [13]. Koc and Sener (2021) studied the emissions prediction of an RCCI engine by using ANFIS. The results showed by applying artificial intelligence, it is possible to obtain various important parameters of RCCI engine in absence of experimental work [14]. The research on quaternary blend of neem biodiesel, pure neem oil, decanal and diesel indicated enhanced engine lubricity, higher BTE and marginal loss in BP. The smoke and CO missions were also less because of better combustion of the quaternary blends [15]. CaO derived from ostrich eggshell for synthesis of biodiesel production in ultrasonic system increased biodiesel yield by 93%. CaO derived from ostrich eggshell exhibited compatible catalytic activity as against commercial CaCO3 [16]. The different factors, including the initial lipid feedstock’s nature, the biodiesel production process, storage and handling conditions, and biodiesel consumption, determine how biodiesel degrades before being burned in a diesel engine. Furlan et al. (2010) used IR spectroscopy to study the oxidation of biodiesel. The formation of hydroxy peroxides, OH, COOH, CHO, and CO during oxidation significantly influenced the IR spectra. Monitoring the band in the range between 3500–3400 cm−1 is useful to assess the stability of biodiesel due to the additional carbonyl groups that are formed during oxidation [17]. Chatterjee et al. (2022) analyzed oxidation products of biodiesels by 1H nuclear magnetic resonance (NMR) and studied various fatty acids on glycerol by 13C NMR [18]. Alexandri et al. (2017) reviewed the method of high-resolution NMR spectroscopy in determining the structure and fatty acid composition of the unsaturated lipids in the solution. 1H, 13C, and 31P NMR proves to be a promising structural and analytical tool for the unsaturated lipids [19]. Lankhorst and Chang (2018) examined the applicability of NMR method in the compositional analysis of oils [20]. NMR is more advantageous due to its lesser time, ease of sampling of the fuels, and access to additional information. Low field NMR with chemometric methods is useful for various fatty acids, which can alternatively be best quantified by high-resolution 1H NMR. Faraguna et al. (2019) investigated the method used for the determination of the biodiesel contents in pure diesel by the FTIR-ATR method using the C-O signal area in the band range of 1690–1800 cm−1. Aliphatic alkyl, iso-phenyl, and dodecyl fatty acid esters were quantified in biodiesel. The concentration and FTIR absorption showed a linear relationship (R2 > 0.993) [21].
Acevedo et al. (2015) estimated the operating cost of palm oil biodiesel in pilot plant scale. The cost was US $0.99/L. The parameters included in production cost were feedstock, chemicals, labor, electricity, maintenance, and quality [22]. The production cost of waste cooking oil biodiesel was INR 55/kg. The byproduct glycerol cost was INR 22/kg. The profitability analysis revealed unit production cost from the plant was INR 55/kg and revenue earned per unit production was INR 58/kg [23].
The life cycle assessment (LCA) studies for biodiesel showed environmental benefits like moderating the global warming benefits [24,25]. The LCA of palm biodiesel showed a reduction in greenhouse gases (GHG) emissions by 110%. Authors also revealed less environmental impact on depletion of ozone layer, acidification [26]. The LCA study of rapeseed biodiesel in small and large scale revealed reduced global warming potential by 33% and 14% respectively. The sensitivity analysis indicated high dependence on disposal of by-product i.e., glycerol, nitrogen percentage in fertilizer [27]. Fridrihsone et al. (2020) investigated LCA of rapeseed-based polyol production in pilot plant scale. The study indicated reduction in GHG, water usage, but in midpoint categories like ecotoxicity, land use, eutrophication and acidification performance degraded as against petrochemical polyol [28]. The comparative LCA study of waste cooking oil biodiesel produced from conventional and transesterification methods were investigated using SimaPro software in mid and end categories. The study indicated transesterification and conventional produced biodiesel produced 425 kgCO2 eq and 2214 kgCO2 eq to GHG emissions [29].
In the present study, MO was blended to Soy methyl ester (SME) and diesel to investigate the engine performance and emissions characteristics. The novelty of the research work lies where higher blended percentages of SME with MO and diesel (Diesel::SME:MO) was used in emission and performance studies on a CRDI engine that was developed previously without any modifications to the engines. The originality lies in the blending proportions of ternary blends. The higher blending of MO has improved the performance characteristics of the fuel. The importance lies in characterization of the blended fuel to determine and compare its characteristics with that of diesel. The characterization of SME:MO and its diesel blends was performed using various methods such as FTIR, UV–vis, and NMR. The physio-chemical characterization of all blended fuel samples indicates that of the fuel, which retains the characteristic of diesel. The cost of proposed SME biodiesel was 80 INR as against diesel 92 INR in 2022. But the cost of the prepared ternary biodiesel blend was higher than diesel because of blending with MO, which has increased the cost of blended fuel by 25 INR as against SME. Thus, the total cost ternary blend fuel was 105 INR. The higher the blend of MO, the higher the cost of the blended fuel. With increase in the blend of MO (50%), the cost of D50::S50:M50 was 110 INR.
2. Experimental Procedure
2.1. Materials and Methods
The soy biodiesel used in this study was obtained from Uttar Pradesh, India, while the diesel fuel was sourced from Indian Oil in Ranchi, India. Deuterated chloroform CDCl3 (99%) as the NMR solvent was acquired from Sigma Aldrich (St. Louis, MI, USA), while Thermo Fisher (Waltham, MA, USA) provided the NaOH pellets and n-hexane (99%), H3PO4, and H2SO4 from Rankem, CH3OH, C19H36O2 from Fisher Scientific.
All samples were characterised using FTIR in the 7500–350/cm wavelength range (Make-Shimadzu Corp, spectrometer, Kyoto, Japan). The UV-vis (Make-Perkin Elmer Lambda 25 UV/Vis spectrometer, Waltham, MA 02451, USA) was employed to determine the absorption-spectra. at room temperature in the wavelength-range of 190–1100 nm using a 10 mm quartz-cuvette. To get the absorbance within the spectrophotometer’s detectable range, all blended-samples were diluted with n-Hexane. Each UV spectrum was recorded three times. A 0.1 mL of each sample was combined with 9.9 mL of n-Hexane to create the final samples. At 298 K, an NMR study was carried out using a JEOL JNM spectrometer. 0.1 mL of each sample and 1 mL of CDCl3 were combined to get the NMR spectra for all the samples.
The improvisation of diesel was achieved by blending it SME and MO in different ratio of S50:M50 (50:50 vol/vol), S70:M30 (70:30 vol/vol), and S80:M20 (80:20 vol/vol) in ratios of 50:50 with diesel, for the evaluation and analysis of the physicochemical characteristics of the fuel, and the performance and emissions properties of the engine. The test-engine was used to evaluate five-fuel samples, and performance and emission data were collected. The physiochemical characteristics of fuels are indicated in Table 1.

Table 1.
Physio-Chemical Properties of Fuels (Diesel, D50::S70:M30, D50::S80:M20, D50::S50:M50 and D50:S50).
A CRDI diesel engine was employed to carry out the experimental work. To provide the load, a dynamometer using eddy-currents was designed to connect with the test-engine. To gauge the fuel flowrate, a positive displacement-type flow-metre was used. There was a connection between the CRDI engine and a data acquisition system (DAS). The test-engine was equipped with a speed controller, and a load controller to regulate the engine speed (rpm), and load (Nm). A data acquisition system was employed to collect and transfer the data between the electronic control unit, and system input. The concentration-levels of the exhaust emissions were measured using an AVL exhaust gas analyzer. The recommended operational fuel injection pressure was 300 bar. The standard operating conditions of the engine, the fuel injection pressure of the CRDI diesel was measured 270 bar. The purpose of the study is to investigate the effect of the increase in the injection pressure from 270 bar to 300 bar on the performance and emission parameters of the CRDI diesel engine. Although 300 bar is a comparatively low injection pressure for a CRDI diesel engine, the study was concentrated only to analyze the effect the variation of injection on the engine. So, during the conduction of the experiment, the injection was gradually increased from 270 bar to 300 bar for smooth running of the engine and proper recording of the performance and emission parameters at enhanced injection pressure (IP) of 300 bar. Six different fuel mix samples were tried in the test-engine, and data on emissions and performance were collected at various rpms and at 30 Nm of full load. The experiment was conducted at constant full load 30 Nm, at changing engine speed. Table 2 displays the complete engine specifications in detail.
Table 2.
Engine specification.
2.2. Uncertainty Analysis
The errors are inevitable to avoid while observing the readings. The reason for the error is slight deviations in the surroundings in which the experiment is performed and the changes and variations observed during the calibration of various devices and sensors. The uncertainty analysis addresses the experiment’s errors and deviations to obtain precision [30]. Before experimenting, the different components of the testing apparatus, including the AVL exhaust gas analyzer, were properly calibrated. Initially, the engine was run for twenty minutes, and three sample readings at a regular time off each measurable parameter were recorded for the uncertainty analysis.
Equation (1) yields a Gaussian distribution that gives the uncertainty of the variables (Δx) within the ±2σ permissible range. Numerous factors depend on the mean limit, i.e., ±2σ. Equations (2) and (3), where Xi is the quantity of observations and is the standard deviation, were employed to calculate the uncertainty of the estimation. R is the function of x1, x2, x3, …, xn, and n represents the number of observations. The value of ∆ (Delta) R was calculated using the root mean square approach of mistakes. Equation (3) was used to estimate the uncertainty concerning various devices and sensors, and Table 3 contains their uncertainties (%). Table 4 provides the variables’ level of uncertainty.
R = f (x1, x2, x3, …, xn)
Table 3.
Uncertainty of the variables that were assessed.
Table 4.
Extent and precision of the equipment utilized.
The overall uncertainty of the instruments incorporated in the test engine is ±2.51%. It is within acceptable limits.
3. Result & Discussion
3.1. Fourier Transform Infrared Spectroscopy (FTIR) Studies of Biodiesel
The FTIR spectra of the fuel samples of D50::S50:M50, D50::S70:M30, D50::S80:M20, D50:S50, and diesel are depicted in Figure 1. In FTIR spectra, the “C=O signal area” (1692–1805 cm−1) is employed for the estimation of the quantity of C19H32O2 present in the biodiesel-diesel blended fuel samples. The spectra region from 1702–1803 cm−1 is attributable to the C=O bond stretching, which is typically the esters present in FAME in all other blended fuel samples. Spectra signals from 1460 to 1300 cm−1 correspond to the asymmetric stretching of -CH3 bonding [21]. Alcohol spectra from 3050 to 3600 cm−1 were found to be absent in D50:S50, D50::S80:M20, and D50::S70:M30, which signifies the non-appearance of any residual alcohol [31]. All samples had a C=O bond at 1742.65 cm−1, while diesel did not, indicating the difference between the two fuels [32]. The peak obtained in-between 3300–3600 cm−1 is of -O-H axial and was found to be present in D50::S50:M50. In D50::S50:M50, D50::S70:M30, D50::S80:M20, and D50:S50, the peak in the region of 2927 cm−1 was that of =C-H2. However, the peak in the region of 1750 cm−1 was that of C=O, which is due to the stretching of the strong ester carbonyl-bond. This indicates the existence of FAME and its maximum at 1747 cm−1. All the samples showed the occurrence of triglyceride ester linkage presence at 1745 cm−1. The peak at 1746 cm−1 was found to be different, and the C=O stretching band was found to have shifted to the lower wave numbers, such as 1746.85 cm−1, thus indicating the increasing deterioration of the biodiesel-blends with MO. The spectrum ranging from 728 cm−1 to 1165 cm−1 depicts the aromatic-hydrocarbon, while peaks in the region of 1162 cm−1 to 1238 cm−1 depict the C-O bonds absorption [33]. The absorption at 1373 cm−1 designates the C-H group, whereas the peak at 1458 cm−1 depicts the blending-absorption of =CH2. Each sample spectra have a C-H bond/wavelength with length ranging from 2800 to 3000 cm−1. In D50::S70:M30, and D50::S80:M20, the peak reported at 1194 cm−1 is due to the stretching of O-CH3, which is a trace of FAME. The IR spectra of sample D50::S70:M30, D50::S80:M20, and D50:S50 comprise peaks of -COOC-H3 at 1460 cm−1. Again, the peak IR in the region of 1195–1246 cm−1 is that of -C-O-C- which is present in D50::S80:M20,D50::S70:M30 and D50:S50 [34]. No interruptions were found to be reported at 1750 cm−1, but the signals of diesel were found to interfere at 1170–1200 cm−1. The peak was observed at 2668 cm−1, D50::S70:M30, D50::S80:M20, and D50:S50 at 2729 cm−1 in diesel and the presence of spectra in the range of 3100 cm−1 to 2700 cm−1 in all these samples is due to the absorption of the C-H bond [35].
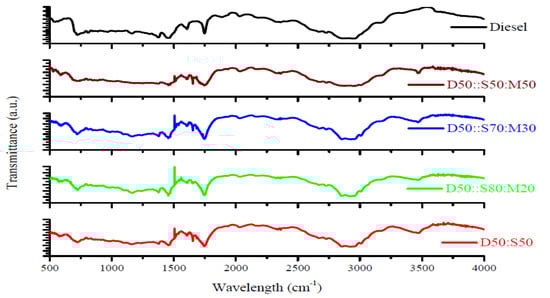
Figure 1.
FTIR-spectra Diesel, D50::S70:M30, D50::S80:M20, D50::S50:M50 and D50:S50.
3.2. UV-vis Spectroscopy
In the present research, UV-vis analysis was subjected to an in-depth analysis of D50::S50:M50, D50::S70:M30, D50::S80:M20, D50:S50, and diesel to indicate the occurrence of the conjugated-dienes in the oxidized-biodiesel. As the biodiesel was diluted with an aliphatic compound like MO, the absorbance of biodiesel at every wavelength reduces (Figure 2). During the degradation of blended fuel samples, double-bonds in the unsaturated FAME isomerized to develop C=C-C=C or C=C-C=O [36]. Oxidation products, along with the conjugated double-bond, absorb energy in the UV and visible regions. D50::S80:M20, and D50:S50 have lower coefficients of absorption in the area between 248–278 nm. However, an unexpected augmentation in the absorption spectrum is observed, possibly owing to the formation of α, β unsaturated CHO or CO by means of the conjugated double-bond in the molecule [37]. A study conducted by Fang and McCormick (2006) found that the oxidation process of biodiesel blends can lead to the production of dissimilar-type oligomers due to aldol-condensation occurring at a later-stage [38].
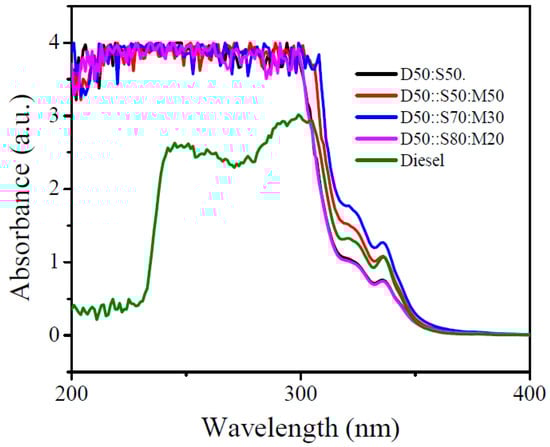
Figure 2.
UV-vis Spectroscopy of Diesel, D50::S80:M20,D50::S70:M30, D50::S50:M50 and D50:S50.
Both C18H32O2 acid as well as the methyl ester, i.e., completely saturated as well as monounsaturated FAME in the UV region, were not found to be absorbed fiercely, while polyunsaturated samples were found to be absorbed strongly and possessing characteristic spectra [39]. Least absorption was found to be for D50:S50 and D50::S80:M20, followed by diesel while D50::S80:M20 and D50::S70:M30 samples indicated maximum absorbance. Similar results were also obtained in characterization of Glycine max biodiesel, where D100 exhibited least absorbance [30]. As the blending of biodiesel increased, the linearity of absorbance decreased, which can be attributed to a diminution in the content of aliphatic compounds (Figure 3). The relationship between linear-absorbance, and the percentage of biodiesel at 320 nm is highly correlated, with a coefficient of determination (R2) of 0.9443.
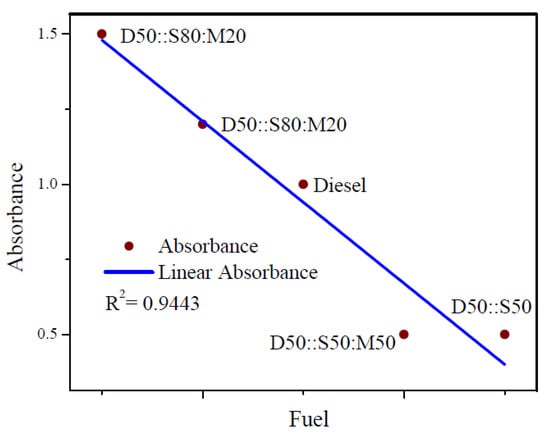
Figure 3.
Absorbance of Diesel, D50::S70:M30, D50::S80:M20, D50::S50:M50 and D50:S50.
3.3. NMR Spectrum Characterization
The samples of D50::S70:M30, D50::S80:M20, and D50::S50:M50 showed characteristic singlet at 3.6 ppm primarily because of methyl ester moiety. However, the occurrence of a peak at 3.60 in D50::S50:M50, 3.66 in D50::S70:M30 and 3.64 in D50::S80:M20 (Figure 4A–D) distinguishes them from diesel and D50:S50. The triplet in the region of 0.8 ppm is that of methyl-hydrogen and is present D50::S70:M30, D50::S80:M20, and D50::S50:M50, while the peak at 4.0–4.6 pertains to the glyceryl-groups, and is found in D50::S70:M30, D50::S80:M20, D50::S50:M50 and D50:S50. The spectra of B100 displayed the peak at 1.2 ppm as well as at 1.59, and this 1.59 ppm is that of methylene of carbon-chain, and beta-carbonyl methylene. The signal of -OC=O-CH2 is reported in all biodiesel blends at around 2.28 ppm [18,40,41]. In D50:S50 peaks at 2.0, 2.8 as well as 5.28 ppm are allylic, bis-allylic, and olefinic-hydrogen correspondingly. The NMR spectra of diesel indicated a number of peaks in the region of 0.8–2.8 ppm from aliphatic-hydrogen, and a few regions of 6.79–7.25 ppm ranges from aromatic-hydrogen. Table 5 indicates the functional group, as well as the corresponding ppm of these samples’ peaks.
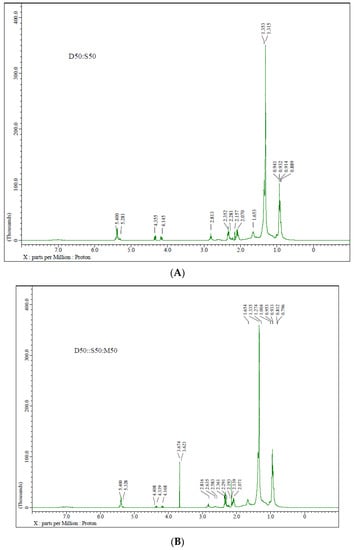
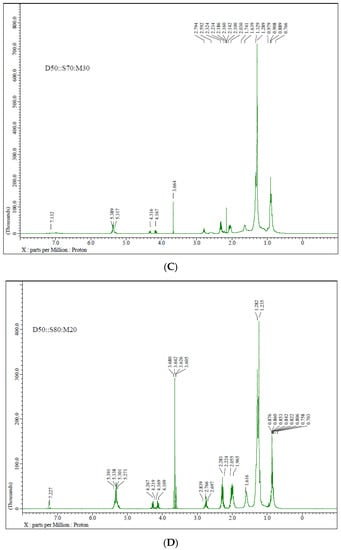
Figure 4.
(A) 1H NMR spectrum of D50:S50. (B) 1H NMR spectrum of D50::S50:M50. (C) 1H NMR spectrum of D50::S70:M30. (D) 1H NMR spectrum of D50::S80:M20.
Table 5.
The peaks of the samples’ functional-groups and their corresponding ppm are shown in the table below.
3.4. Brake Power (BP)
It is the power acquired after removing the frictional power is met due to frictional losses in the engine from the specified power. The relationship between engine-speed and brake-power is shown in the graph below for the various tested fuel samples is depicted in Figure 5. It was found that as engine speed increased, BP increased as well. The maximum value of the BP was observed at the maximal engine-speed of 3000 rpm”. Moreover, the BP for diesel, D50:S50:M50, D50::S70:M30, D50::S80:M20, and D50:S50 was 6.83, 6.11, 6.02, 5.88, and 5.62 kW respectively. The results revealed that D50:S50:M50, D50::S70:M30, D50::S80:M20, and D50:S50 showed 1.9%, 3.37%, 5.61%, and 6.1% respectively lower maximum brake power at 3000 rpm in comparison with diesel. Despite the molecular structure containing a larger proportion of oxygen, D50:S50 produced much lower brake power because of less efficient combustion due to its escalated kinematic viscosity. The mean-values of BP for all engine speeds for Diesel, D50::S50:M50, D50::S70:M30, D50::S80:M20, and D50:S50 were 4.89, 4.78, 4.65, 4.53, and 4.38 kW respectively. Thus, it was observed that D50::S50:M50, D50::S70:M30, D50::S80:M20, and D50:S50 produced respectively 2.2%, 4.9%, 7.36% and 10.4% lesser power than that of diesel. This impact is best explained by the cumulative influence of the blended fuel samples’ lower energy content and highest viscosity relative to diesel [42].
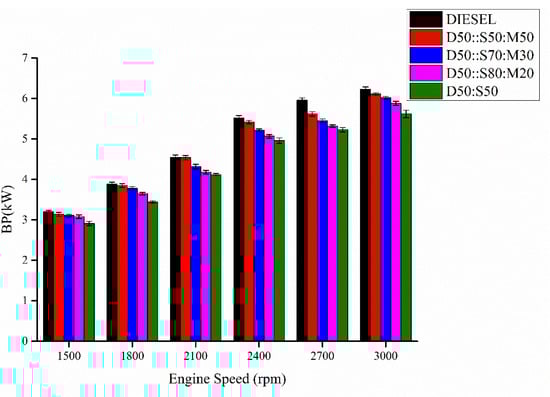
Figure 5.
Variation of BP of samples (Diesel, D50::S70:M30, D50::S80:M20, D50::S50:M50 and D50:S50) with engine-speed at constant load.
3.5. Brake Thermal Efficiency (BTE)
Thermal efficiency is defined as the proportion of power-output to the rate of heat-energy incorporated through fuel-injection into the engine-cylinder. The power-input supplied to the engine-cylinder is the product of the mass flowrate of injected-fuel, and its calorific-value. The fluctuation of BTE with an engine-speed (rpm) for distinct fuel samples is depicted in Figure 6. The maximal BTE was observed at 2400 rpm, and the values of BTE ascertained at 2400 rpm for Diesel, D50::S50:M50, D50::S70:M30, D50::S80:M20, and D50:S50 was 48.99%, 41.39%, 42.15%, 42.25%, and 41.19% respectively. However, the average values of BTE for Diesel, D50::S50:M50, D50::S70:M30, D50::S80:M20, and D50:S50 were 45.31%, 40.64%, 40.28%, 39.41% and 38.28% respectively. Thus, D50::S50:M50, D50::S70:M30, D50::S80:M20, and D50:S50 produced 10.3%, 11.10%, 13.02%, and 15.51% diminution in BTE respectively by comparison with diesel. The combination of the fuel’s raised viscosity and reduced heating-value results in the lower BTE [43]. The addition of MO to SME to the fuel samples escalated the BTE of engine, which is owing to superior power output and lowered BSFC as compared to D50:S50.
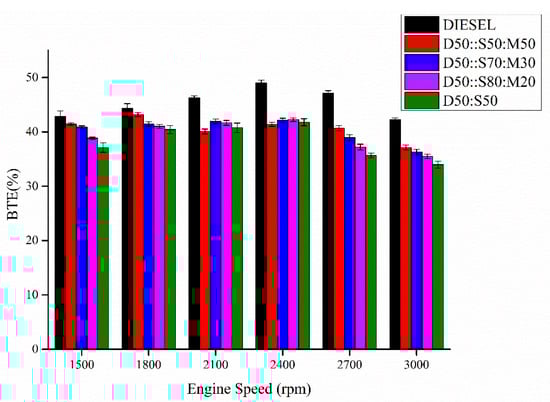
Figure 6.
Variation of BTE of samples (Diesel, D50::S70:M30, D50::S80:M20, D50::S50:M50 and D50:S50) with engine-speed at constant-load.
3.6. Brake Specific Fuel Consumption (BSFC)
BSFC is the mass rate of the fuel combusted to produce unit BP. Figure 7 illustrates the BSFC for all fuel samples at various engine speeds. It was found that the BSFC of the engine was decreased (1500 to 2400 rpm) and then escalated with the increase in the engine-speed (2400 to 3000 rpm). BSFC was found to be lowest at 2400 rpm. The average values of BSFC for Diesel, D50::S50:M50, D50::S70:M30, D50::S80:M20, and D50:S50 were found to be 0.188, 0.208, 0.218, 0.231, and 0.240 kg/kWh respectively. Thus, D50::S50:M50, D50::S70:M30, D50::S80:M20, and D50:S50 showed 10.6%, 15.9%, 22.8% and 27.6% higher BSFC respectively as compared to diesel. However, D50:S50 possessed the minimal calorific-value, due to its highest density, and fuel-borne oxygen among all the tested-fuels. The higher viscosity and volumetric effect of the constant fuel injection rate of biodiesel blends resulted in a rise in fuel consumption [43]. The inclusion of SME further reduced the calorific value of the fuel samples.
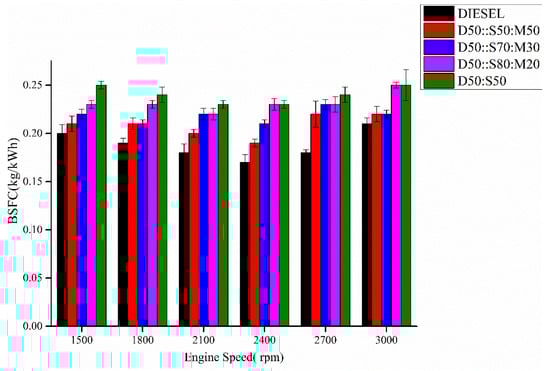
Figure 7.
Variation of BSFC of samples (Diesel, D50::S70:M30, D50::S80:M20, D50::S50:M50 and D50:S50) with engine-speed at constant-load.
3.7. Nitrous Oxide (NOx)
Figure 8 illustrates the NOx emission of the various fuel samples at different engine-speeds. The content of NOx is found first to decrease (1500 to 2400 rpm) and then raise with the engine-speed for all blended-fuels. D50::S50:M50, D50::S70:M30, D50::S80:M20, and D50:S50 produced average decrease in NOx emission of 19.1%, 33.82%, 42.64% and 48.5% compared to diesel. The high in-cylinder temperature is what triggers the NOx generation. The turbulence and intermixing are improved with increased engine speed, resulting in controlled and even combustion and consistent heat-transfer. Adversely, as engine-speed is enhanced further, the concentration of NOx increases because of raised turbulence, and higher combustion-rates, which raised the localised-temperature in the engine-cylinder. In general, the concentration of NOx was found to be lowest in diesel, and it increased proportionally with the quantity of MO in diesel. This increase in concentration was attributed to the corresponding rise in the degree of unsaturation [6]. The concentration of NOx is also affected by adiabatic flame temperature. Due to biodiesel’s dual bonds, they possess higher adiabatic flame temperatures than diesel. Consequently, it will result in NOx formation [44]. Many studies reported that in-cylinder radiation heat transfer due to particle formation affects the adiabatic flame temperature. Because biodiesel contains more oxygen than diesel, it has been shown that NOx generation has risen. Less radiative heat transfer, a greater flame temperature, and increased NOx emissions are the effects of this. The enrichment of Soy biodiesel with MO (SME50-M50) further resulted in the increment of NOx concentration. This is mainly because MO is an unsaturated fatty acid component, ensuing in briefer ignition delay, higher combustion rates and increment in NOx concentrations [6].
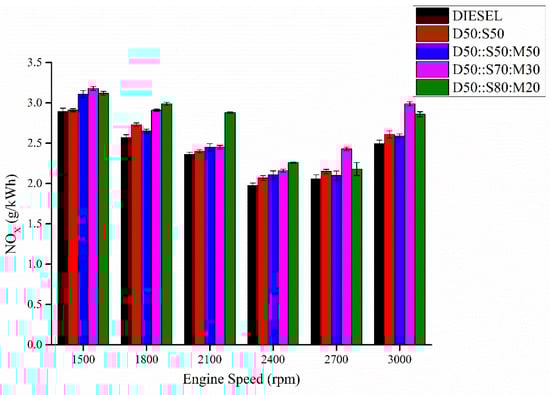
Figure 8.
Variation of NOx of samples (Diesel, D50::S70:M30, D50::S80:M20, D50::S50:M50 and D50:S50) with engine-speed at constant-load.
3.8. Carbon Monoxide (CO)
The fuel partially burns, usually at low temperatures, producing CO [8]. Figure 9 shows the relationship between engine-speed and CO emissions. The average CO emission reductions for D50:S50:M50, D50:S70:M30, D50:S80:M20, and D50:S50 were 40.09%, 47.12%, 49.36%, and 63.02%, respectively as compared to diesel. As a result of combined effects of the higher CN and oxygen contents, the concentration of CO emissions is low [45]. Shorter ignition delays and longer combustion durations are depicted with higher CN values. The increased oxygen-concentration in biodiesel plays a vital role in enhancing the combustion-process. The elevated oxygen concentration within the cylinder results in increased temperature, leading to complete combustion, and improved transformation of CO to CO2 in biodiesel compared to diesel-fuel [46]. The addition of the MO leads to an increase in the CO concentrations of 36.93%, 43.79%, and 62.0% as compared to D50:S50.
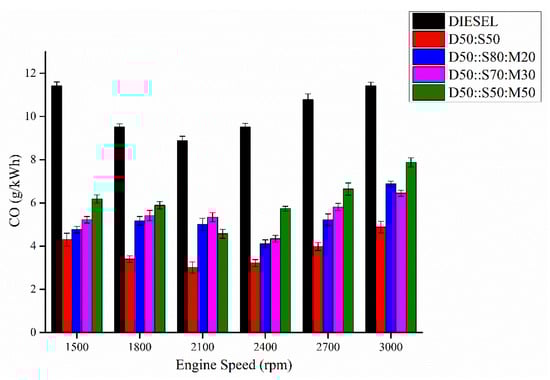
Figure 9.
Variation of CO of samples (Diesel, D50::S70:M30, D50::S80:M20, D50::S50:M50 and D50:S50) with engine-speed at constant-load.
3.9. Unburnt Hydrocarbon (UHC)
The operating conditions of engine, fuel-composition, and fuel-spray characteristics all have an impact on the amount of HC emissions [47]. Poor air-fuel mixing leading to a leaner-blend, and under-mixed gasoline that leaves the fuel-injector nozzles late in the combustion process at lower-velocity are the two primary factors responsible for HC emissions in diesel-engines. This can lead to a lean combustion limit during the delay period. Figure 10 illustrates the HC emission of the various fuel samples at different engine speeds. D50::S50:M50, D50::S70:M30, D50::S80:M20, and D50:S50 generated average diminutions in HC emission of 19.1%, 33.82%, 42.64% and 48.5% in comparison with diesel. The more oxygen-content of biodiesel provided some favorable requirements like, higher flame-speed, post flame-oxidation, etc. during the mixing of the air and fuel, specifically in the fuel-rich areas, which improved the oxidation of the unburnt HC, as a result reducing the content of the HC significantly. It is evident that the inclusion of MO enables to increase the content of the HC emission as compared to D50:S50 at all engine-speeds owing to its reduced oxygen-content than SME [48].
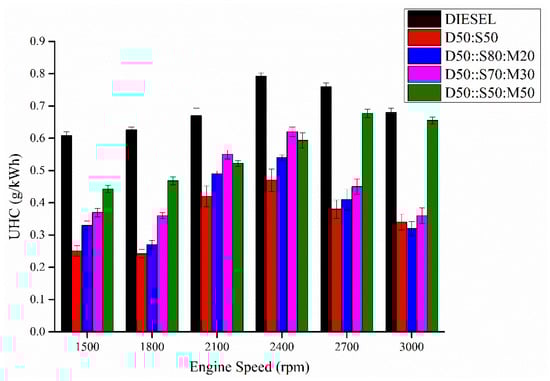
Figure 10.
Variation of UHC of samples (Diesel, D50::S70:M30, D50::S80:M20, D50::S50:M50 and D50:S50) with engine-speed at constant-load.
4. Conclusions
In the present study characterization, performance, and emissions studies of the blended SME:MO with diesel in CRDI engine was performed. MO was blended due to its higher ignition and oxidative stability. The assessment of physio-chemical properties and the identification of the ideal blending ratios for engine performance and emissions are among the study’s scientific contributions.
- The characterizations of blended-biodiesel were performed by using FTIR, and UV-vis. FTIR spectra showed the existence of the strong ester carbonyl bond (C=O), indicating the presence of FAME at 1745 cm−1. Again, the presence of conjugated dienes in the oxidized-biodiesel was detected using UV-vis spectroscopy.
- The signal at 3.6 δ in the 1HNMR corresponds to methyl ester moiety, authenticating biodiesel production.
- The addition of MO:SME improved the BSFC of enriched biodiesels near to pure diesel due to decreased kinematic viscosity with increase CV.
- BTE of the engine enhanced by increasing the quantity of MO in the blend of SME and diesel due to high CV and low viscosity. BTE of all biodiesels remained lower than that of pure diesel. Increasing the content of MO in SME leads to an increase in CO emissions by the incomplete combustion process can be facilitated due to certain factors. For the above reason, the HC emission increased by increasing the quantity of MO in blends of SME and diesel.
- The low cetane number and low oxygen content are the reasons. Invigorating D50:S50 with MO resulted in escalated UHC due to the reduced oxygen concentration, which led to insufficient combustion. The blended biodiesels emit more NOx than that of pure diesel and D50:S50 as the unsaturation degree increases with the addition of MO. NOx emissions can be reduced by incorporating EGR system in the experimental set-up, i.e., connecting CRDI diesel engine with the EGR. The inclusion of 20–40% alcohol, preferably butanol, in the diesel-biodiesel blends. The high latent heat of vaporization of alcohol present in the blend will have cooling effect inside the engine cylinder which will reduce the in-cylinder temperature and ultimately NOx formation will decrease.
- Further studies on EGR, and performance, emissions studies on inclusion of alcohol in blended biodiesels with diesel. More concrete repercussions will come from how IP and timing affect the efficiency and emissions of enriched biodiesel. Applications of the research could result in the creation of green alternative fuels with lower exhaust emissions and better engine efficiency.
Author Contributions
Conceptualization, S.M.M.H., R.C., P.R., G.K. and S.S.; methodology, S.M.M.H., R.C., P.R., G.K. and S.S.; formal analysis, S.M.M.H., R.C., P.R., G.K., S.S. and A.K.; investigation, S.M.M.H., R.C., P.R., G.K. and S.S.; writing—original draft preparation, S.M.M.H., R.C., P.R., G.K. and S.S.; writing—review and editing, S.S., A.K., B.S. and S.S.U.; supervision, S.S., B.S. and S.S.U.; project administration, S.S., A.K., B.S. and S.S.U.; funding acquisition, S.S., B.S. and S.S.U. All authors have read and agreed to the published version of the manuscript.
Funding
This study received funding from King Saud University, Saudi Arabia through researchers supporting project number (RSP2023R145). Additionally, the APCs were funded by King Saud University, Saudi Arabia through researchers supporting project number (RSP2023R145).
Institutional Review Board Statement
Not applicable.
Informed Consent Statement
Not applicable.
Data Availability Statement
No data were used to support this study.
Acknowledgments
The authors would like to thank King Saud University, Riyadh, Saudi Arabia, researchers supporting project number RSP2023R145.
Conflicts of Interest
The authors declare no conflict of interest.
References
- Altaie, M.A.H.; Janius, R.B.; Rashid, U.; Yap, Y.H.T.; Yunus, R.; Zakaria, R. Cold flow and fuel properties of methyl oleate and palm-oil methyl ester blends. Fuel 2015, 160, 238–244. [Google Scholar] [CrossRef]
- Suresh, M.; Jawahar, C.P.; Richard, A. A review on biodiesel production, combustion, performance, and emission characteristics of non-edible oils in variable compression ratio diesel engine using biodiesel and its blends. Renew. Sustain. Energy Rev. 2018, 92, 38–49. [Google Scholar] [CrossRef]
- Mohd Noor, C.W.; Noor, M.M.; Mamat, R. Biodiesel as alternative fuel for marine diesel engine applications: A review. Renew. Sustain. Energy Rev. 2018, 94, 127–142. [Google Scholar] [CrossRef]
- Soloiu, V.; Weaver, J.; Ochieng, H.; Duggan, M.; Davoud, S.; Vlcek, B.; Jenkins, C.; Butts, C. Experimental Study of Combustion and Emissions Characteristics of Methyl Oleate, as a Surrogate for Biodiesel, in a Direct Injection Diesel Engine; No. 2013-01-1142, SAE Technical Paper; SAE: Warrendale, PA, USA, 2013. [Google Scholar] [CrossRef]
- Zhang, Z.; E, J.; Deng, Y.; Pham, M.; Zuo, W.; Peng, Q.; Yin, Z. Effects of fatty acid methyl esters proportion on combustion and emission characteristics of a biodiesel fueled marine diesel engine. Energy Convers. Manag. 2018, 159, 244–253. [Google Scholar] [CrossRef]
- Altaie, M.A.H.; Janius, R.B.; Rashid, U.; Taufiq-Yap, Y.H.; Yunus, R.; Zakaria, R.; Adam, N.M. Performance and exhaust emission characteristics of direct-injection diesel engine fueled with enriched biodiesel. Energy Convers. Manag. 2015, 106, 365–372. [Google Scholar] [CrossRef]
- Soloiu, V.; Moncada, J.D.; Gaubert, R.; Knowles, A.; Molina, G.; Ilie, M.; Harp, S.; Wiley, J.T. Reactivity Controlled Compression Ignition combustion and emissions using n-butanol and methyl oleate. Energy 2018, 165, 911–924. [Google Scholar] [CrossRef]
- Soloiu, V.; Lewis, J.; Covington, A.; Nelson, D.; Schmidt, N. Oleic methyl ester investigations in an indirect injection diesel engine; stage one: Combustion investigations. SAE Int. J. Fuels Lubr. 2011, 4, 58–75. [Google Scholar] [CrossRef]
- Bax, S.; Hakka, M.H.; Glaude, P.-A.; Herbinet, O.; Battin-Leclerc, F. Experimental study of the oxidation of methyl oleate in a jet-stirred reactor. Combust. Flame 2010, 157, 1220–1229. [Google Scholar] [CrossRef]
- Lata, D.B.; Ahmad, A.; Prakash, O.; Khan, M.; Chatterjee, R.; Hasnain, S.M.M. Impact of Exhaust Gas Recirculation (EGR) on the Emission of the Dual-Fuel Diesel Engine with Hydrogen as a Secondary Fuel. J. Inst. Eng. Ser. C 2021, 102, 1489–1502. [Google Scholar] [CrossRef]
- Sener, R.; Giil, M.Z. Optimization of the combustion chamber geometry and injection parameters on a light-duty diesel engine for emission minimization using multi-objective genetic algorithm. Fuel 2021, 304, 121379. [Google Scholar] [CrossRef]
- Kadian, A.K.; Khan, M.; Sharma, R.; Hasnain, S.M. Performance enhancement and emissions mitigation of DI-CI engine fuelled with ternary blends of jatropha biodiesel-diesel-heptanol. Mater. Sci. Energy Technol. 2022, 5, 145–154. [Google Scholar] [CrossRef]
- Khan, M.; Sharma, R.; Kadian, A.K.; Hasnain, S.M.M. An assessment of alcohol inclusion in various combinations of biodiesel-diesel on the performance and exhaust emission of modern-day compression ignition engines—A review. Mater. Sci. Energy Technol. 2022, 5, 81–98. [Google Scholar] [CrossRef]
- Koç, M.A.; Şener, R. Prediction of emission and performance characteristics of reactivity-controlled compression ignition engine with the intelligent software based on adaptive neural-fuzzy and neural-network. J. Clean. Prod. 2021, 318, 128642. [Google Scholar] [CrossRef]
- Khan, M.M.; Kadian, A.K.; Sharma, R.P. An investigation of performance and emission of diesel engine by using quaternary blends of neem biodiesel–neem oil–decanol–diesel. Sādhanā 2023, 48, 28. [Google Scholar] [CrossRef]
- Chen, G.; Shan, R.; Shi, J.; Yan, B. Ultrasonic-assisted production of biodiesel from transesterification of palm oil over ostrich eggshell-derived CaO catalysts. Bioresour. Technol. 2014, 171, 428–432. [Google Scholar] [CrossRef] [PubMed]
- Furlan, P.Y.; Wetzel, P.; Johnson, S.; Wedin, J.; Och, A. Investigating the Oxidation of Biodiesel from Used Vegetable Oil by FTIR Spectroscopy: Used Vegetable Oil Biodiesel Oxidation Study by FTIR. Spectrosc. Lett. 2010, 43, 580–585. [Google Scholar] [CrossRef]
- Chatterjee, R.; Mukherjee, S.K.; Paul, B.; Chattopadhyaya, S. Evaluation of spectroscopic analysis, performance and emissions of enriched Jatropha and Madhuca methyl ester for clean environment. Clean Technol. Environ. Policy 2022, 24, 2295–2312. [Google Scholar] [CrossRef]
- Alexandri, E.; Ahmed, R.; Siddiqui, H.; Choudhary, M.I.; Tsiafoulis, C.G.; Gerothanassis, I.P. High resolution nmr spectroscopy as a structural and analytical tool for unsaturated lipids in solution. Molecules 2017, 22, 1663. [Google Scholar] [CrossRef]
- Lankhorst, P.P.; Chang, A.N. The application of NMR in compositional and quantitative analysis of oils and lipids. In Modern Magnetic Resonance; Webb, G., Ed.; Springer International Publishing AG: Cham, Switzerland, 2018; pp. 1743–1764. [Google Scholar]
- Faraguna, F.; Racar, M.; Jukić, A. Test method for determination of different biodiesels (fatty acid alkyl esters) content in diesel fuel using FTIR-ATR. Renew. Energy 2018, 133, 1231–1235. [Google Scholar] [CrossRef]
- Acevedo, J.C.; Hernández, J.A.; Valdés, C.F.; Khanal, S.K. Analysis of operating costs for producing biodiesel from palm oil at pilot-scale in Colombia. Bioresour. Technol. 2015, 188, 117–123. [Google Scholar] [CrossRef]
- Avinash, A.; Murugesan, A. Economic analysis of biodiesel production from waste cooking oil. Energy Sources Part B Econ. Plan. Policy 2017, 12, 890–894. [Google Scholar] [CrossRef]
- Fridrihsone, A.; Romagnoli, F.; Cabulis, U. Environmental Life Cycle Assessment of Rapeseed and Rapeseed Oil Produced in Northern Europe: A Latvian Case Study. Sustainability 2020, 12, 5699. [Google Scholar] [CrossRef]
- Chatterjee, R.; Sharma, V.; Mukherjee, S. The environmental impacts and allocation methods used in lca studies of vegetable oil-based bio-diesels. Waste Biomass-Valorization 2015, 6, 579–603. [Google Scholar] [CrossRef]
- Arguelles-Arguelles, A.; Amezcua-Allieri, M.A.; Ramírez-Verduzco, L.F. Life cycle assessment of green diesel production by hydrodeoxygenation of palm oil. Front. Energy Res. 2021, 9, 690725. [Google Scholar] [CrossRef]
- Gupta, R.; McRoberts, R.; Yu, Z.; Smith, C.; Sloan, W.; You, S. Life cycle assessment of biodiesel production from rapeseed oil: Influence of process parameters and scale. Bioresour. Technol. 2022, 360, 127532. [Google Scholar] [CrossRef]
- Fridrihsone, A.; Romagnoli, F.; Kirsanovs, V.; Cabulis, U. Life Cycle Assessment of vegetable oil based polyols for polyurethane production. J. Clean. Prod. 2020, 266, 121403. [Google Scholar] [CrossRef]
- Bhonsle, A.K.; Singh, J.; Trivedi, J.; Atray, N. Comparative LCA studies of biodiesel produced from used cooking oil using conventional and novel room temperature processes. Bioresour. Technol. Rep. 2022, 18, 101072. [Google Scholar] [CrossRef]
- Yesilyurt, M.K.; Aydin, M.; Yilbasi, Z.; Arslan, M. Investigation on the structural effects of the addition of alcohols having various chain lengths into the vegetable oil-biodiesel-diesel fuel blends: An attempt for improving the performance, combustion, and exhaust emission characteristics of a compression ignition engine. Fuel 2020, 269, 117455. [Google Scholar] [CrossRef]
- Shah, S.N.; Joshi, A.; Patel, A.; Brahmkhatri, V.P. Synthesis of jatropha oil based biodiesel using environmentally friendly catalyst and their blending studies with diesel. Energy Power 2013, 3, 7–11. [Google Scholar]
- Chatterjee, R.; Mukherjee, S.K.; Paul, B.; Chattopadhyaya, S. Comparative spectroscopic analysis, performance and emissions evaluation of Madhuca longifolia and Jatropha curcas produced biodiesel. Environ. Sci. Pollut. Res. 2021, 28, 62444–62460. [Google Scholar] [CrossRef]
- Chatterjee, R.; Mukherjee, S. Spectroscopic analysis and performance studies of jatropha extracted bio-diesel. Waste Biomass- Valorization 2017, 9, 1579–1585. [Google Scholar] [CrossRef]
- Berdeaux, O.; Fontagné, S.; Sémon, E.; Velasco, J.; Sébédio, J.L.; Dobarganes, C. A detailed identification study on high-temperature degradation products of oleic and linoleic acid methyl esters by GC–MS and GC–FTIR. Chem. Phys. Lipids 2012, 165, 338–347. [Google Scholar] [CrossRef] [PubMed]
- Bradley, M. Biodiesel (FAME) Analysis by FT-IR. 2007. Available online: http://www.thermo.com/eThermo/CMA/PDFs/Articles/articlesFile_2448.pdf (accessed on 25 November 2020).
- Vega-Lizama, T.; Díaz-Ballote, L.; Hernández-Mézquita, E.; May-Crespo, F.; Castro-Borges, P.; Castillo-Atoche, A.; González-García, G.; Maldonado, L. Thermogravimetric analysis as a rapid and simple method to determine the degradation degree of soy biodiesel. Fuel 2015, 156, 158–162. [Google Scholar] [CrossRef]
- Pereira, G.G.; Alberici, R.M.; Fernandes, G.D.; Cunha, I.B.; Eberlin, M.N.; Dobarganes, M.C.; Daroda, R.J.; Barrera-Arellano, D. Ambient sonic-spray ionization mass spectrometry for rapid monitoring of secondary oxidation products in biodiesel. Eur. J. Lipid Sci. Technol. 2014, 116, 952–960. [Google Scholar] [CrossRef]
- Fang, H.L.; McCormick, R.L. Spectroscopic Study of Biodiesel Degradation Pathways; No. 2006-01-3300, SAE Technical Paper; SAE: Warrendale, PA, USA, 2006. [Google Scholar] [CrossRef]
- Zawadzki, A.; Shrestha, D.S.; He, B. Biodiesel blend level detection using ultraviolet absorption spectra. Trans. ASABE 2007, 50, 1349–1353. [Google Scholar] [CrossRef]
- Hasnain, S.M.M.; Chatterjee, R.; Sharma, R.P. Spectroscopic performance and emission analysis of glycine max biodiesel. J. Inst. Eng. Ser. C 2020, 101, 587–594. [Google Scholar] [CrossRef]
- Monteiro, M.R.; Ambrozin, A.R.P.; Lião, L.M.; Ferreira, A.G. Determination of biodiesel blend levels in different diesel samples by 1H NMR. Fuel 2009, 88, 691–696. [Google Scholar] [CrossRef]
- Mofijur, M.; Masjuki, H.; Kalam, M.; Atabani, A. Evaluation of biodiesel blending, engine performance and emissions characteristics of Jatropha curcas methyl ester: Malaysian perspective. Energy 2013, 55, 879–887. [Google Scholar] [CrossRef]
- Devan, P.; Mahalakshmi, N. Study of the performance, emission and combustion characteristics of a diesel engine using poon oil-based fuels. Fuel Process. Technol. 2009, 90, 513–519. [Google Scholar] [CrossRef]
- McCormick, R.L.; Graboski, M.S.; Alleman, T.L.; Herring, A.M.; Tyson, K.S. Impact of Biodiesel Source Material and Chemical Structure on Emissions of Criteria Pollutants from a Heavy-Duty Engine. Environ. Sci. Technol. 2001, 35, 1742–1747. [Google Scholar] [CrossRef]
- Hirkude, J.B.; Padalkar, A. Performance and emission analysis of a compression ignition: Engine operated on waste fried oil methyl esters. Appl. Energy 2012, 90, 68–72. [Google Scholar] [CrossRef]
- Kivevele, T.T.; Kristóf, L.; Bereczky, A.; Mbarawa, M.M. Engine performance, exhaust emissions and combustion characteristics of a CI engine fuelled with croton megalocarpus methyl ester with antioxidant. Fuel 2011, 90, 2782–2789. [Google Scholar] [CrossRef]
- Ozsezen, A.N.; Canakci, M.; Turkcan, A.; Sayin, C. Performance and combustion characteristics of a DI diesel engine fueled with waste palm oil and canola oil methyl esters. Fuel 2009, 88, 629–636. [Google Scholar] [CrossRef]
- Varatharajan, K.; Cheralathan, M.; Velraj, R. Mitigation of NOx emissions from a jatropha biodiesel fuelled DI diesel engine using antioxidant additives. Fuel 2011, 90, 2721–2725. [Google Scholar] [CrossRef]


Disclaimer/Publisher’s Note: The statements, opinions and data contained in all publications are solely those of the individual author(s) and contributor(s) and not of MDPI and/or the editor(s). MDPI and/or the editor(s) disclaim responsibility for any injury to people or property resulting from any ideas, methods, instructions or products referred to in the content. |
© 2023 by the authors. Licensee MDPI, Basel, Switzerland. This article is an open access article distributed under the terms and conditions of the Creative Commons Attribution (CC BY) license (https://creativecommons.org/licenses/by/4.0/).