Abstract
The path to European climate neutrality by 2050 will require comprehensive changes in all areas of life. For large industries such as steelworks, this results in the need for climate-friendly technologies. However, the age structure of existing steelworks makes transitional solutions such as carbon capture, utilization and storage (CCUS) necessary as short-term measures. Hence, a purposeful option is the integration of technical syntheses such as methanation into the overall process. This work summarizes hydrogen-intensified methanation experiments with synthetic steel gases in the novel additively manufactured reactor ‘ADDmeth1’. The studies include steady-state operating points at various reactor loads. Blast furnace gas (BFG), basic oxygen furnace gas (BOFG) and three mixtures of these two gases serve as carbon sources. The methanation achieved methane yields of 93.5% for BFG and 95.0% for BOFG in the one-stage once-through setup. The results suggest a kinetic limitation in the case of BFG methanation, while an equilibrium limitation is likely for BOFG. There is a smooth transition in all respects between the two extreme cases. The reaction channel inlet temperature showed a large influence on the reactor ignition behavior. By falling below the threshold value, a blow-off occurred during experimental operation. By means of a simulation model, practical operating maps were created which characterize permissible operating ranges for as a function of the gas composition and the reactor load.
1. Introduction
The European Green Deal formulates the ambitious goal of European climate neutrality by the year 2050 [1]. To achieve this goal, measures will have to be taken in energy supply, transport, trade, agriculture, forestry and industry to reduce net emissions of greenhouse gases to zero. Supporting this goal, the steel industry is facing a major transformation [2]. The worldwide steel production of approximately 1875 Mt crude steel in 2019 [3] was mainly achieved via the blast furnace/basic oxygen furnace route (72% [3]) and emitted approximately 2.6 Gt of CO2, which amounts to 7% of the global emissions from the use of fossil fuel [2]. In the medium to long term, production must be converted to low-carbon or zero-carbon processes (e.g., hydrogen-based direct reduction of iron (DRI)), taking into account the boundaries imposed by the existing infrastructure. The rapid growth in production capacity over the last two decades has resulted in a large proportion of steel plants being less than 15 years old [4] (see Figure 1), with most of the European steel plants being even younger. Thus, these plants have not even reached one-third of their typical lifetime and could lead to cumulative emissions of 65 Gt CO2 if operated to their end of life (under current conditions) [2]. This already represents a large portion of the CO2 budget consistent with a sustainable transition for the steel sector. Transitional solutions (e.g., carbon capture, utilization and storage (CCUS) [5]) can be applied in the short term and are therefore needed to lower the climate impact of the existing steelmaking facilities [6].
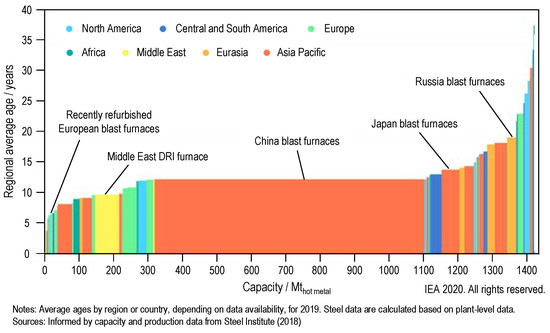
Figure 1.
Age profile of global production capacity for the steel sector (blast furnaces and DRI furnaces); adapted reprint from [4], licensed under CC BY 4.0.
There are different CCUS approaches in steelworks. CO2 can be separated directly from the carbon-rich by-product gases blast furnace gas (BFG) and basic oxygen furnace gas (BOFG) (see Table 1) or after the internal thermal utilization of these gases (e.g., in rolling mill or internal power plant [7]). Subsequently it can be stored or used as feedstock for synthesis processes. The separation can be carried out by means of membrane processes [8,9] or ad-/absorption processes [10,11]. Another possibility is to use BFG and/or BOFG directly as a carbon source for technical syntheses such as urea [12], methanol [13,14,15] or methane synthesis [15,16,17,18,19]. This skips the step of separation, but leads to other challenges. As the new customers for steel gases are in competition with their previous internal use, a dynamic prediction of the gas volume flows generated in the steel production process and their intelligent distribution to the different plants, adapted to the current market situation, becomes necessary [20,21,22,23,24]. Furthermore, for methanol or methane synthesis, hydrogen must be provided economically at the steelworks’ site in addition to the carbon source (BFG/BOFG) in order to be able to set the respective preferred stoichiometric ratio for the reactions [25,26,27] and the reactors used must be able to handle the unconventional feed gases (mixture of CO and CO2, high inert gas content of N2).

Table 1.
Typical composition of the carbon-rich steel gases BFG and BOFG [28].
This work presents hydrogen-intensified catalytic methanation experiments utilizing BFG and BOFG in a novel, innovative, additively manufactured reactor concept. The concept uses green hydrogen from electrolyzers in order to convert the CO and CO2 content of the steel gases at nickel catalysts. Methanation can be described by the coupled system of CO and CO2 methanation and the water gas shift reaction (Equations (1)–(3)).
CO + 3 H2 ⇌ CH4 + H2O(g)
CO2 + 4 H2 ⇌ CH4 + 2 H2O(g)
CO + H2O(g) ⇌ CO2 + H2
Substitute natural gas (SNG) produced in this way has the advantage that it can be used without restriction in the existing natural gas infrastructure for distribution and utilization [29]. In addition, methanation as part of the Power-to-Gas (PtG) concept enables the chemical long-term storage of large amounts of (renewable) electrical energy and can contribute to the reduction in CO2 emissions [30].
In general, many metals within the transition block of the periodic table (transition metals of groups 8–10) catalyze the displayed reactions. Due to its high selectivity and activity for methanation at a comparatively low price, nickel (Ni), usually on an Al2O3 support, is the state-of-art catalyst [31]. Nickel exhibits a high performance/cost ratio combined with very high CH4 selectivity and good activity [32,33,34], which makes it the most studied and applied catalytic material. Alumina (Al2O3) is particularly suitable as a support material for nickel as an active component, since it enables the formation of a fine and homogeneous nickel distribution on its high specific surface [34,35,36].
When nickel catalysts are used, unfavorable operating conditions can lead to the formation of nickel tetracarbonyl (NiCO4) through the reaction of CO(g) with Ni(s), which is highly toxic and harmful to the environment [37]. This risk is particularly relevant at high CO partial pressures and low stoichiometric ratios. With reduced CO partial pressure (e.g., use of BFG/BOFG as a carbon source) and reducing conditions (excess hydrogen), the formation risk decreases significantly [38]. Nevertheless, reactor operation should be ensured above the NiCO4 decomposition temperature of approximately 180 °C [39].
Based on the principle of Le Chatelier, the formation of CH4 (Equations (1) and (2)) is favored by an elevated pressure as the reactions lead to a volume reduction. Furthermore, the methanation is strongly exothermic, which results in one of the current main research fields: the improvement of the control of the reaction temperature. The goal for small to medium-scale methanation plants is to achieve high methane yields in a simple process with long catalyst lifetimes and low maintenance needs.
For the required process intensification, it is necessary to operate the reactor in the ignited state with high temperatures in the reaction zone to avoid kinetic limitation [40]. At the same time, however, it is important to effectively control the resulting hotspot temperature (avoidance of catalyst deactivation by sintering processes) and to ensure a low reactor outlet temperature (avoidance of equilibrium or thermodynamic limitation) [41].
There are different approaches to control the temperature of the methanation reactions.
One of them aiming at modifying the classical fixed bed was Kosaka et al.’s [42] study investigating an axial variation of the concentration of the active catalyst component. The nickel content on the yttria-stabilized zirconia (YSZ) catalyst support material increased from the inlet to the outlet of the reactor and successfully prevented hotspot formation. Temperature gradients of only ~70 °C occurred and a methane yield of approximately 90% was achieved. Zimmermann et al. [43] compared the performances of a catalytic fixed bed diluted with inert particles and catalyst particles with active core and inert shell (core–shell catalyst). The results showed a significantly increased space-time-yield of methane for the core–shell catalyst particles as a result of the decrease in the effective reaction rate at high temperatures. The mass transport through the shell becomes rate-determining and the effective reaction rate gets almost independent of the temperature.
Furthermore, different alternatives to the classic fixed-bed reactor promise high potential for optimizing the thermal management of methanation.
For example, Hervy et al. [44] successfully demonstrated thermal management in CO2 methanation tests using a 400 kWSNG fluidized-bed reactor. The reactor, equipped with an internal heat exchanger and filled with a special, mechanically stable catalyst (Ni as active component), exhibited only very low temperature gradients of 20 °C maximum in the fluidized bed over a wide operating range. Above 280 °C bed temperature, the respective thermodynamic equilibrium was reached; below this limit, kinetic limitation occurred.
Another approach is the structuring of the catalyst support. For this purpose, a catalytically active layer is applied (usually by wash coating) to a regularly or irregularly shaped support structure. With a suitable choice of support material and dimensions, heat transport towards the reactor shell is improved [45]. Baena-Moreno et al. [46] compared two structured supports coated with a Ru-Ni/MgAl2O4 catalyst in methanation experiments. In addition to a conventional honeycomb structure with parallel channels, they investigated a novel 3D-printed gyroid structure. Among others, gas mixtures similar to flue gas served as reactant gas mixtures. The test results showed an axially and radially increased thermal conductivity of the gyroid structure as well as an increased turbulence of the flow inside of it. An increase in CO2 conversion of up to 14% (compared to the conventional honeycomb) reflects these effects in the results of the methanation experiments. Stiegler et al. [47] investigated a Ru/Al2O3-MgO coated metallic catalyst support with a diamond unit cell in dynamic CO2 methanation experiments. They report safe and stable operation over a wide load range. The high thermal conductivity of the metallic structured support thereby homogenized the temperature profile, only small axial temperature gradients occurred (<15 °C) and hotspots were effectively avoided. The CO2 conversion was close to the equilibrium.
In structured fixed-bed reactors, bulk catalyst is used in distinction to structured catalyst supports. The catalyst fixed bed is divided into individual reaction channels for hotspot avoidance and temperature control. Pérez et al. [48] performed comparative studies with a classical fixed-bed reactor (inner diameter 9 mm) and a multichannel reactor (16 channels, inner diameter 1.75 mm each). Thermo-fluid tempered the reactors and a Ni/Al2O3 powder was the catalyst. At stoichiometric conditions, a pressure of 15 bar and a gas hourly space velocity (GHSV) of 30,000 h−1, the CO2 conversion peaked at 96.1% at 350 °C in the structured multichannel reactor. The CO2 conversion in the classical fixed bed was 81.9% at the same conditions, which is approximately 15% less. The continuous heat removal by the use of a thermo-fluid avoided hotspot formation. Neubert et al. [49] developed a structured fixed-bed reactor concept for catalytic methanation that uses heat pipes for heat removal from the main reaction zone and the reactor. The nine reaction channels had an inner diameter of 8 mm and were filled with semi-commercial Ni/Al2O3 catalyst pellets. A series of experiments at 4.5 bar and stoichiometric H2/CO2 ratio showed the capability of the reactor concept to lower the occurring maximum temperature more than 100 °C compared to the calculated adiabatic temperature. Hauser et al. later confirmed the functionality of the concept in experiments during the hydrogen-intensified methanation of carbon-rich by-product gases from the steel industry [16] and proposed a more advanced, non-adiabatic, additively manufactured reactor concept (‘ADDmeth’) to overcome kinetic limitations using a conically widening reaction channel, thus enabling improved methane yield [41].
The core objective of this paper is to summarize experimental results of catalytic hydrogen-intensified methanation of synthetically mixed steel gases in the novel, additively manufactured reactor ‘ADDmeth1’ and thereby provide a proof-of-concept of its design. Special attention is paid to the temperature conditions and the possibilities of influencing them, as well as to the product gas qualities achieved. The experiments cover different reactor loads and feed compositions at a fixed, slightly over-stoichiometric H2/(CO + CO2)-ratio. In addition to the evaluation of the steady-state operating points, a discussion of the effects of reactor operation at the catalyst ignition threshold is provided. Since the latter has a significant influence on stable and safe reactor operation, the experimental considerations were extended by simulation-based investigations to evaluate the influence of the reaction channel inlet temperature on the reactor’s ignition behavior.
Therefore, Section 2 gives an explanation of the experimental setup, the simulation model and the procedures. Section 3 presents and discusses the experimental results on the basis of hydrogen conversion, methane yield, the resulting temperature conditions and observed transient effects and also illustrates and interprets simulated operating maps for permissible reaction channel inlet temperatures in dependence of gas composition and syngas power. Section 4 summarizes the main findings and gives conclusions for further investigations and developments.
2. Materials and Methods
2.1. Experimental Setup
The methanation reaction takes place in the novel, additively manufactured bench-scale reactor ADDmeth1. The reactor body was manufactured using selective laser melting (SLM) of stainless steel (1.4404/316L) and explicitly exploits the advantages of additive manufacturing for the reactor design. The ADDmeth design was recently presented in detail by Hauser et al. [41] and is therefore only described very briefly at this point.
Figure 2 shows a CAD section view of the reactor. The premixed reactant gas enters the reactor via welded fittings, flows downwards in a cavity interspersed with a lattice structure and is thereby preheated internally. The gas enters the reaction channel at the bottom of the reactor and then flows up the channel. The reaction channel is filled with semi-commercial catalyst pellets (not displayed in Figure 2). Water-filled heat pipes serve as heat transfer system, which can be actively cooled in the condenser zones by compressed air.
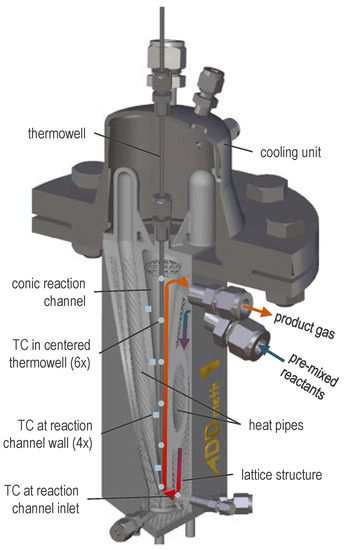
Figure 2.
CAD section view of ADDmeth1 indicating an exemplary gas pathway and the positions of thermocouples (TC); adapted reprint from [41], licensed under CC BY 4.0.
The key innovation, which would not be feasible within this highly complex design without the additive manufacturing process, is the conically widening shape of the reaction channel. The resulting widening fixed bed is intended to counteract the kinetic limitation in the second half of the structured fixed-bed reactor reported previously [16,49] by increasing the temperatures and the local residence times there. As a result, an increased conversion to the desired product methane is expected.
To characterize the temperature conditions in the reactor, among others, six thermocouples (TC) are placed in a central thermowell (blue dots in Figure 2), four more at the reaction channel wall (blue squares in Figure 2) and one TC at the gas inlet into the reaction channel after internal pre-heating (blue rhombus in Figure 2).
The ADDmeth1 methanation reactor described above is integrated into a test rig with additional measuring points for temperature, pressure and differential pressure as well as other ancillary equipment required for the operation. Figure 3 shows a simplified flowchart of the test rig. The feed gas matrix is mixed from technical cylinder gases in a gas control unit by means of mass flow controllers (MFCs) and fed to the methanation plant. The ADDmeth1 reactor holds approximately 36 g of a pelletized Ni/Al2O3 catalyst (cylindrical, Ø 1.9 × 3.9 mm) with a high nickel content (~50%). The start of sintering of the active catalyst component can be estimated to be around 590 °C using the Tamman criterion [29]. The whole test rig can be operated at pressures up to 10 bar. Electrical heating of the reactor shell enables preheating during start-up and, if necessary, trace heating during operation. A condenser downstream of the methanation process dries the product. A pneumatic process control valve regulates the pressure of the test rig. Control, data visualization and recording are performed using a programmable logic controller from B&R Automation GmbH (Eggelsberg, Austria). An AO2000 gas analyzer (GA) from ABB (Zurich, Switzerland) is used to measure the reactant and product gas composition.
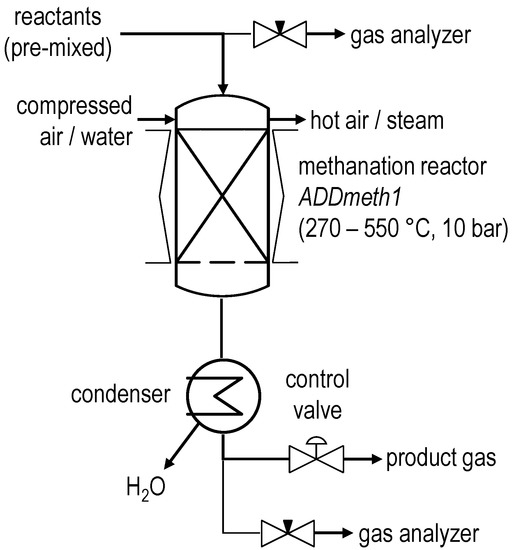
Figure 3.
Simplified flowchart of the ADDmeth methanation test rig.
2.2. Process Parameters
In addition to pressure and temperature, the methanation reaction is mainly influenced by the stoichiometric ratio and the reactant volume flow rate.
Since the hydrogen-intensified methanation of steel gases represents a mixed methanation of CO and CO2, the hydrogen stoichiometry according to Equation (4) is used to characterize the H2/COx ratio, as in previous publications. The description of the gas load in the reactor is presented by means of the gas hourly space velocity GHSV, which relates the total feed gas volume flow rate to the catalyst volume located in ADDmeth1 (Equation (5)).
The two parameters hydrogen conversion and methane yield are relevant for the experimental evaluation. While hydrogen conversion defines the amount of hydrogen converted in relation to the amount of H2 present at the start of the reaction (Equation (6)), the methane yield is the amount of methane formed in the reaction in relation to the sum of the amounts of the COx components initially present (Equation (7)).
2.3. Experimental Procedure
The ADDmeth1 reactor was characterized in hydrogen-intensified methanation experiments using synthetic by-product gas mixtures from steelworks as a carbon source. Both blast furnace gas (BFG), basic oxygen furnace gas (BOFG) and three mixtures of the two steel gases (BFG:BOFG ratios 75:25, 50:50 and 25:75) served as basis. Since the optimal hydrogen stoichiometry (Equation (4)) was determined to be [16], this ratio was held constant during the experiments by respective hydrogen addition.
A syngas power variation (, referred to the lower heating value of the reactants) of 1.00–2.00 kW in 0.25 kW increments was performed with each of the feed gas mixtures described. The transition between the individual steady-state operating points took place by means of steep volume flow ramps of 0.25 kW/min (unless otherwise specified). The system pressure was 10 bar at all operating points. Both the electrical trace heating and the compressed air cooling of the cooling unit were used to stabilize the individual operating points. Gas analysis was performed for each operating point on both the feed gas and the product gas. From feed gas measurement, the actual hydrogen stoichiometry and actual syngas power were calculated for control purposes.
The results of the two extreme examples (hydrogen-intensified methanation of BFG and BOFG) are presented in detail in Section 3.1 and Section 3.2, respectively. Table 2 and Table 3 summarize the respective set parameters of the different operating points.
Table 2.
Set operating points of the variation of syngas power with BFG (BFG: BOFG = 100:0).
Table 3.
Set operating points of the variation of syngas power with BOFG (BFG:BOFG = 0:100).
For a comparative view of the trends for the variation of the BFG/BOFG ratio in the feed (Section 3.3), the experimental results of the other three feed gas mixtures are used in addition. Table A1, Table A2 and Table A3 in the Appendix A summarize the set values of these additional experimental campaigns.
2.4. Simulation Model and Procedure
During the experimental investigations and their evaluation, it became clear that the inlet temperature into the reaction channel () has a significant influence on the temperature conditions in the reactor, in particular on the height and position of the hotspot. It became apparent that the characteristic diagram of permissible for stable operating points is limited by an upper as well as a lower limit.
In order to investigate the influence of the inlet temperature into the reaction channel of ADDmeth1 on the overall temperature conditions and the operational stability of the reactor more extensively, a simulation model of the reaction channel was setup. The aim of this model is to represent the ignition behavior of the reaction kinetics in a way that is comparable to the experimental results, in order to obtain practically relevant operating maps for permissible inlet temperatures as a function of syngas power and gas composition.
For this purpose, a 2D rotationally symmetric, pseudo-homogeneous simulation model of the reaction channel of ADDmeth1 was developed in COMSOL Multiphysics® 6.0 (COMSOL Inc., Stockholm, Sweden). This takes into account the flow field, reaction kinetics and heat and mass transfer in porous media. A Supplementary Material to this paper presents the modules, assumptions, correlations, simplifications, and boundary conditions used in the model in detail.
To define the operating maps for our reactor, it is necessary to specify criteria for the maximum and minimum reaction channel inlet temperatures and , which must not be exceeded or undercut, respectively:
The maximum permissible inlet temperature is defined as the inlet temperature at which the hotspot temperature just does not exceed the maximum temperature permissible in the reaction channel = 550 °C (avoidance of sintering of the catalyst used). At the same time, the position of the hotspot in the reaction channel must be located before the start of the widening of the reaction channel () to ensure stable operation (decreasing heat dissipation capacity with increasing reaction channel diameter). In the case that both criteria cannot be fulfilled at the same time, the position criterion is to be considered more serious and its compliance is to be preferred over a (moderate) exceedance of .
The minimum permissible inlet temperature is defined as the inlet temperature at which the hotspot temperature just does not undercut the temperature threshold for sufficiently fast kinetics for operating the reactor in the ignited state. Based on experimental experience, this threshold was set to . Furthermore, the location criterion already described above for () must also be fulfilled for .
The performed simulations included the 25 steady-state operating points that were also investigated experimentally. Section 2.3 summarizes the corresponding boundary conditions. For each of the described operating points, a variation of in 5 °C steps first determined the ranges relevant for a more detailed specification of the upper and lower limit of the reaction channel inlet temperature. Subsequent, refined simulations of these ranges with finally provided the values for and . In the analysis, the criteria described above were used throughout.
Transient effects are not considered in this approach. However, effects such as wrong-way behavior can lead to a temporary prevalence of non-permissible operating parameters in case of sudden parameter changes (e.g., exceeding of ) or to a transition of the reactor into non-permissible operating ranges (e.g., irreversible hotspot shift into widening section). This should be taken into account when the reactor is operated near the limits.
3. Results and Discussion
3.1. Experimental Variation of Syngas Power with BFG
The GA measurement of the feed gas during the methanation campaign with BFG shows certain deviations to the set values in Table 2, but these are all within the achievable accuracy of MFCs and GA measurement. The desired syngas power is hit very well. The same applies for the stoichiometric ratio, whereas a slight tendency to lower values can be observed here. At low syngas powers, tends to be below the desired value of . As increases, approaches . This could be related to the operating ranges of the used MFCs as they often exhibit higher inaccuracies near the operating range limits (lower limit in this case). The dry product gas after single-stage methanation in ADDmeth1 contains 35.7–39.5 vol.% of the target component CH4. In addition, a large proportion of nitrogen is present (42.6–45.4 vol.%). CO and CO2 concentration in the product gas increase with increasing syngas power.
Figure 4 shows the hydrogen conversion and methane yield of the syngas power variation with BFG evaluated according to Equations (6) and (7). is between 90.7 and 93.5%, which is very high for a single-stage reactor concept in once-through operation. As expected, is somewhat lower (85.9–90.7%) due to the over-stoichiometry. The decrease in and with increasing suggests a kinetic limitation during the methanation of BFG in ADDmeth1. Superimposed on this, a second effect can be observed in Figure 4. The mentioned slight increase in the stoichiometric ratio with increasing results in different slopes of and . This means that with an increasing , more H2 remains in the product gas and less is converted.
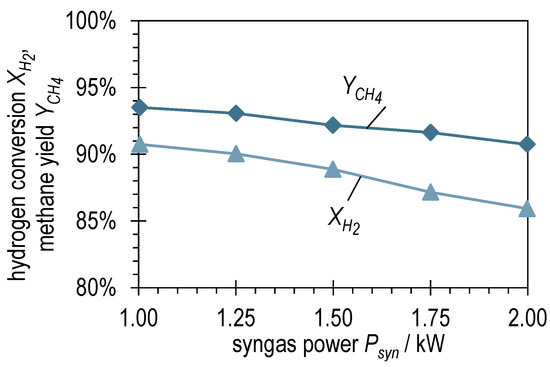
Figure 4.
Hydrogen conversion and methane yield after ADDmeth1 for the different (stabilized) steady-state operating points of the experimental variation of syngas power with BFG.
The bipartite Figure 5 visualizes on the left side the rotationally symmetric profile of the reaction channel of ADDmeth1 widening towards the exit. By means of dashed lines, both the point of the beginning of the expansion and the structural end of the reaction channel are marked. This representation serves as an aid for the interpretation and to better evaluate the axial temperature profiles of ADDmeth1 shown on the right side of Figure 5. The thermocouples of the curves shown with dots and solid lines are located in the thermowell in the center of the catalyst bed, the measuring points of the curves drawn with squares and dashed lines are located on the outer wall of the reaction channel (positioning see also Figure 2). Furthermore, the temperature limit of the used catalyst is indicated (550 °C, avoidance of sintering).
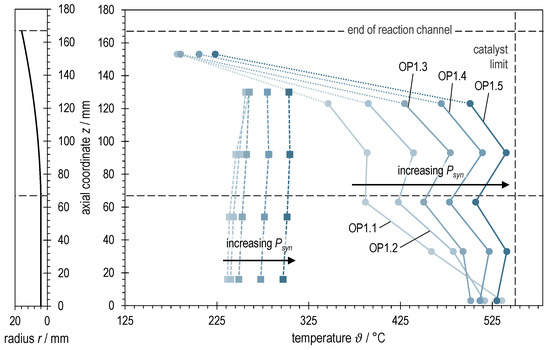
Figure 5.
Right: Axial temperature profiles of ADDmeth1 for the different (stabilized) steady-state operating points of the experimental variation of syngas power with BFG. Left: Visualization of the reaction channel radius as a function of the axial coordinate.
First of all, the graphs in Figure 5 show that it was possible to adjust the temperature conditions for all investigated operating points in such a way that the maximum permissible catalyst temperature of 550 °C was maintained. However, due to the discrete measuring points at fixed heights of the catalyst bed, an exceeding of this temperature between the measuring points is likely. The observation of the curves also shows that the overall temperature level in the reactor increases with increasing syngas power. This is due to the increase in the released heat of reaction as well as the necessary control to stabilize the operating points (see also interpretation of Figure 6 and Section 3.4).
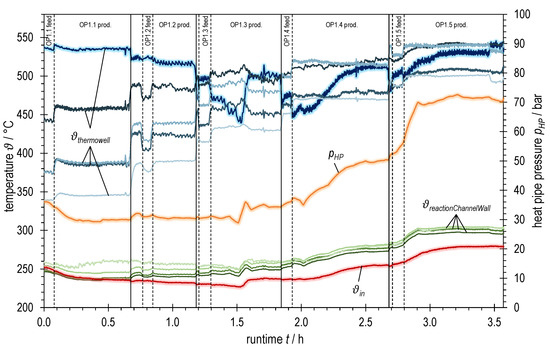
Figure 6.
Temperatures and heat pipe pressure of ADDmeth1 over runtime during the experimental variation of syngas power with BFG (increasing from OP1.1 to OP1.5, see Table 2); bluish: TCs in thermowell (highlighted: bottom TC; dark → light: inlet (bottom) → outlet (top)); greenish: TCs at reaction channel wall (dark → light: inlet (bottom) → outlet (top)); red highlighted: TC inlet reaction channel; orange highlighted: heat pipe pressure.
Another striking feature is that the temperature in the center of the reaction channel stabilizes or increases again from measuring point 3 to measuring point 4 after a previous drop. This can be explained by the geometry of the reaction channel. While measuring point 3 is placed shortly before the beginning of the widening, the reaction channel has already widened at measuring point 4. The expansion increases the local residence time and thus the heat release per volume element and at the same time increases the thermal resistance from the center of the catalyst bed to the reaction channel wall. This leads to the observable temperature increase and thus to the desired kinetics-improving effects in the second half of the reactor. Furthermore, the measurements at low syngas powers (OP1.1 and OP1.2) differ in their course from the other curves. The aforementioned have a pronounced hotspot directly at the reactor inlet. Keeping this temperature below 550 °C was decisive for the choice of the control parameters. As the load increases, the temperature profiles become increasingly uniform. Simultaneously, there was a need to avoid a blow-off (transition from ignited to non-ignited state) of the reactor (see also interpretation of Figure 6 and Section 3.4).
The last thermocouple at z = 153 mm is positioned in a dead zone at the end of the reaction channel. This dead zone forms due to the lateral exit of the product gas from the reaction channel (see Figure 2). Accordingly, this temperature measurement has only minor significance.
Figure 6 summarizes various temperature measurements as well as the heat pipe working pressure plotted over the runtime of the experiment with BFG. The heat pipe pressure is shown in orange. Red represents the gas temperature at the reaction channel inlet, the green graphs correspond to the measuring points on the reaction channel wall (squares in Figure 5) and the blue graphs to those in the thermowell (dots in Figure 5). The jaggedness in the graphs over time is due to a fluctuating process pressure caused by the control valve.
Observation of the blue graphs shows a strong dependence of the temperature conditions on the total volume flow rate (or the syngas power, respectively). This becomes clear both when changing the operating points and when changing the gas sampling points.
At the beginning of OP1.3 (after switching to product gas measurement, OP1.3 prod.) one could think that the temperatures are stationary. However, a closer look reveals a slightly negative trend at the first temperature measurement in the thermowell (bluish highlighted graph). In the further course, there is a further drop of this temperature which might mark the beginning of a blow-off of the reaction in the inlet area of the reactor. By taking suitable countermeasures (raising the trace heating temperature by 15 K, temporarily reducing the cooling volume flow and thus increasing the heat pipe pressure and the overall temperature level), a complete blow-off could be avoided and the temperature at the inlet stabilized at a high level again. A similar behavior can also be observed when setting the operating points OP1.4 and OP1.5. Here, however, it was sufficient to increase the overall temperature level (represented by the heat pipe pressure) by temporarily reducing the active cooling for stabilization. A further increase in the trace heating temperature was not necessary.
The observed behavior during the abrupt changes between the steady-state operating points may be due to several effects of the transient transition phase. These effects are superimposed and partly amplified due to the design of the ADDmeth1 reactor. In addition to the increase in volume flow, the coupled effects of the (at least temporarily) lowered wall and preheating temperature decisively influence the temperature conditions in the reaction channel. Due to the abrupt increase in the volume flow, more cold fluid has to be preheated internally, thus consuming more energy from the reactor. During the transient phase between two self-sustaining, steady-state operating points without trace heating, this can cause the energy balance to become negative (delay in the increase in heat release and conduction to preheating area compared to heat consumption for preheating). As a result, both the mean temperature at the reaction channel wall reactionChannelWall (cooling temperature of the catalyst bed) and the inlet temperature into the reaction channel after internal preheating ϑin decrease, which has an impact on the ignition behavior of the reaction kinetics.
Try et al. [50] investigated the impact of each of the described effects on the temperature profile of a cooled fixed-bed reactor in dynamic simulations using a 2D heterogeneous simulation model. When the inlet volume flow rate is abruptly increased in the ignited reactor state, which is necessary for a high conversion in compact reactors [40], they observed a shift of the temperature profile into the reactor as well as a transient overshoot of the maximum temperature. A decrease in the reactor inlet temperature in the ignited reactor state, which occurs superimposed in ADDmeth1 as described, also causes a shift of the temperature profile into the reactor. At the same time, a transient temperature overshoot of the maximum temperature occurs due to the wrong-way behavior. In another simulation, the simultaneous variation of reactor inlet temperature and cooling (wall) temperature, which were set equal, was investigated. This is very close to the real case in ADDmeth1. Moreover, the abrupt change occurred beyond the ignition/extinction limit. With a negative step beyond this threshold, starting from the ignited state, a traveling hotspot occurs, which moves downstream along the reactor axis and progressively decreases after an initial wrong-way behavior (temporary temperature rise). Finally, the reactor is in the non-ignited state with significantly lower conversion. This behavior is also referred to as blow-off.
In general, the ignition temperature depends on the reactor geometry and the operating parameters such as pressure, volume flow rate and cooling properties [51,52].
Transferred to the variation of syngas power with BFG, it can be concluded from Figure 5 and Figure 6 that ϑin and reactionChannelWall are sufficiently far above the ignition temperature when the operating points OP1.1 and OP1.2 are set. Accordingly, a stable transition to these operating points is possible. Only a moderate downstream shift of the temperature profile can be observed. The situation is different for the transition to OP1.3 (after switching to product gas measurement, OP1.3 prod.). Immediately after the changeover (runtime ~1.3 h in Figure 6), the hotpot has already moved into the reactor and the temperature at the first measuring point in the thermowell (bluish, highlighted) has dropped significantly. The reaction channel inlet temperature ϑin, which had already decreased unnoticed during OP1.2, continues to drop steadily until it presumably falls below the ignition temperature at the given conditions at runtime ~1.5 h. As a result, the temperature at the catalyst bed inlet, the wall temperatures and the heat pipe pressure drop. This marks the beginning of a blow-off as described above. The countermeasures outlined previously increased ϑin by 9 °C, resulting in a temperature increase at the catalyst bed inlet of approximately 60 °C. The ignition temperature under the given conditions (see Section 2.3) is thus between 227 and 236 °C. At the transition to operating points OP1.4 and OP1.5, similar trends of the three-dimensional temperature profile are visible, but much less critical. By allowing a higher overall temperature level in the course of the operating points (temporary reduction in active cooling), it was possible to increase ϑin as well and consequently to shift the hotspot towards the inlet. These observations suggest that an increasing inlet temperature ϑin is required for stable reactor operation in steady-state with increasing or GHSV, respectively, which is consistent with the studies of Moioli et al. [52].
3.2. Experimental Variation of Syngas Power with BOFG
The GA measurement of the feed gas compositions for the different operating points of the power variation with BOFG again shows small deviations within the achievable measurement accuracies from the desired set values listed in Table 3. Again, the desired syngas power is well met. Likewise, the already described trend for (slightly too low at low , increasing with ) is observed. The dry product gas after single-stage methanation in ADDmeth1 contains 54.3–56.5 vol.% of CH4. The nitrogen content is lower compared to BFG methanation (22.0–23.5 vol.%).
The graphs of the hydrogen conversion and methane yield for BOFG methanation in Figure 7 show a different picture than for BFG methanation. Although the values of and for , are comparable, the methane yield remains consistently high at a value of around 95% when the syngas power increases. Despite the hydrogen conversion shows a slightly negative trend, the slope is significantly lower than for BFG methanation (compare Figure 4). The combined consideration of the two curves implies that the slightly negative trend of in Figure 7 is due to the slightly positive trend of . Furthermore, this suggests that, unlike BFG methanation, BOFG methanation is not kinetically limited, but thermodynamically limited under the investigated conditions.
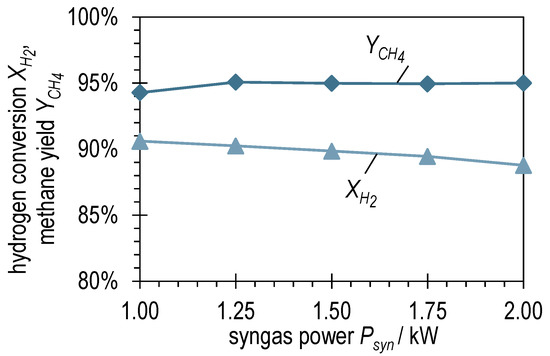
Figure 7.
Hydrogen conversion and methane yield after ADDmeth1 for the different (stabilized) steady-state operating points of the experimental variation of syngas power with BOFG.
Figure 8 shows the rotationally symmetric profile of the reaction channel next to the axial temperature profiles in ADDmeth1 for the investigated operating points at different syngas powers with BOFG. In contrast to BFG methanation, the temperature limit of the catalyst could not be maintained at the measuring points. The measured maximum temperature in the stabilized state was around 580 °C, and during transient operating states it was significantly higher (see Figure 9). The problem of stabilizing the operating points and why it was not possible to maintain the maximum catalyst temperature is explained in more detail in the interpretation of Figure 9. The other characteristics of the array of graphs are similar to those of BFG methanation. Again, the renewed rise in temperature after the start of the widening of the reaction channel can be observed. Additionally, an increase in causes an increase in the temperature level along the reactor axis and a certain homogenization again. However, a larger axial temperature gradient remains compared to the BFG methanation. The radial temperature gradient is also more pronounced (comparison of solid vs. dashed lines in Figure 5 and Figure 8, respectively). This suggests that the higher N2 content in BFG has a homogenizing effect on the temperature conditions in the reactor, while methanation of the more reactive BOFG (more CO, less N2) leads to larger temperature gradients that are more difficult to control. The last temperature measurement (z = 153 mm) is again in the dead zone of the catalyst bed and is therefore of little significance.
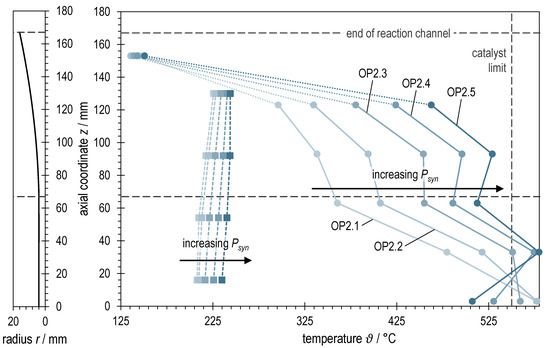
Figure 8.
Right: Axial temperature profiles of ADDmeth1 for the different (stabilized) steady-state operating points of the experimental variation of syngas power with BOFG. Left: Visualization of the reaction channel radius as a function of the axial coordinate.
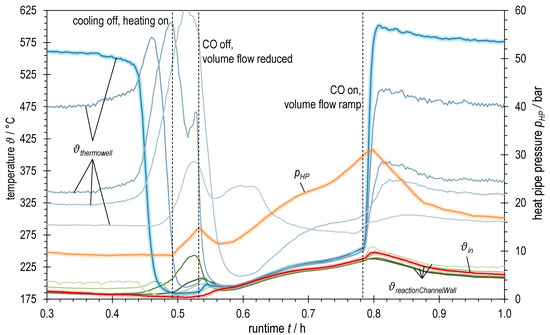
Figure 9.
Detail view of temperatures and heat pipe pressure of ADDmeth1 over runtime during blow-off at OP2.1 of the experimental variation of syngas power with BOFG; bluish: TCs in thermowell (highlighted: bottom TC; dark → light: inlet (bottom) → outlet (top)); greenish: TCs at reaction channel wall (dark → light: inlet (bottom) → outlet (top)); red highlighted: TC inlet reaction channel; orange highlighted: heat pipe pressure.
Figure 9 shows different temperature measurements as well as the heat pipe working pressure for a short period of the experiment with BOFG. After the start of the methanation reaction, a supposedly steady-state operating point is reached after a runtime of ~0.3 h. However, a closer look at the temperature curves reveals that both the temperature after internal preheating ϑin (red highlighted in Figure 9) and the first temperature in the catalytic bed (bluish highlighted in Figure 9) show a slightly negative tendency. This remained unnoticed, however, and shortly thereafter the inlet temperature obviously fell below the ignition temperature (~181 °C) and a blow-off occurred, which this time could not be prevented by suitable countermeasures. The temperature at the reactor inlet drops abruptly at runtime ~0.42 h (400 °C within seconds) and a traveling hotspot forms. As a result, downstream maximum temperatures are measured that are higher than in the previous, supposedly steady-state operation. To a certain extent, this temperature increase is probably due to the discrete temperature measurement along the reactor axis. If the temperature maximum was previously between two temperature measuring points, for example, and is then shifted across the location of a measuring point due to the traveling hotspot, this leads to higher measured temperatures. However, since the temperature increase continues at the third measuring point, it can be assumed that there is also a real temperature increase due to the wrong-way behavior in the reaction channel. Shortly before the fourth temperature measuring point in the thermowell, the widening of the reaction channel starts. This worsens heat removal from the catalyst bed and supports the wrong-way behavior and thus the maximum temperatures that occur. As a result, temperature peaks of over 625 °C are measured.
From an approximate runtime 0.445 h, an attempt was made to counteract the blow-off by switching off the active cooling and increasing the trace heating. However, since the reaction front was already too far inside the reactor at this point and the countermeasures had only too small an effect on the reaction channel inlet temperature, the reaction could not be ignited again. As an emergency measure, the highly reactive component CO was switched off, the volume flow was reduced and a restart of the methanation was prepared by means of electrical preheating of the catalyst bed. This was finally finished at a runtime of approximately 0.79 h and the methanation with the desired gas mixture was started again. To prevent another blow-off, a significantly higher heat pipe pressure was chosen, resulting in a higher overall temperature level and a reaction channel inlet temperature of ϑin ≈ 212 °C (at stabilized operating point, as of runtime 1.0 h), which is well above the determined ignition temperature. However, with the conditions set in this way, it was not possible to maintain the catalyst limit of 550 °C. With the parameters selected, the reactor is operated at an impermissible operating point for the catalyst used, resulting in increased deactivation due to sintering processes. This problem could be avoided by selecting a catalyst with a higher permissible temperature.
In the further course of the experiment, volume flow ramps of 4 minutes duration are used to set the new operating points (0.0625 kW/min). This means that the changes in the three-dimensional temperature profile resulting from the increase in volume flow rate occur slower and the transient effects that could trigger a blow-off are less pronounced (compare also [50]). Furthermore, the plant operator has more time to react and, if necessary, to initiate countermeasures for stabilization. In this way, it was possible to terminate the syngas power variation with BOFG without a further blow-off. At the operating points with higher syngas power, the mean temperature level must be raised slightly for temperature stabilization. However, the adjustment is much less pronounced than with BFG methanation. To achieve sufficiently high for a stable operation, the overall temperature level must be raised to such an extent that the resulting hotspot temperatures exceed the catalyst limit even in the stabilized operating points.
3.3. Experimental Variation of BFG/BOFG Ratio
In addition to the experiments with pure BFG and pure BOFG discussed in detail in Section 3.1 and Section 3.2, experiments with mixtures of BFG and BOFG as a carbon source for hydrogen-intensified methanation were also conducted. BFG:BOFG ratios of 75:25, 50:50 and 25:75 served as a carbon source, and the set stoichiometric ratio was for all experiments. The procedure for these tests was analogous to the two series of tests presented above, and the same operating points (in terms of syngas power) were approached in each case.
A detailed discussion of the results will not be given here as the essential behavior of the new reactor was described on the basis of the two extreme cases ‘pure BFG’ and ‘pure BOFG’. The experiments with the different mixtures of these two gases as carbon sources represent a more or less smooth transition between the two extreme cases. This is true across the board. For example, the temperature gradients (axial as well as radial) become larger with increasing BOFG content and the stabilization of the operating points becomes more challenging when methanizing the increasingly reactive gas. The ignition temperature seems to decrease with increasing BOFG content.
Figure 10 and Figure 11 plot hydrogen conversion and methane yield , respectively, as a function of both syngas power and BFG:BOFG ratio. Here, too, the gradual transition between the characteristics of the two extreme cases already described above becomes clear. and attain the lowest values at high syngas powers with pure BFG methanation. The two surface plots support the statement already made that there is probably a limitation by equilibrium in pure BOFG methanation and that this gradually changes to a limitation by kinetics in the case of pure BFG methanation.
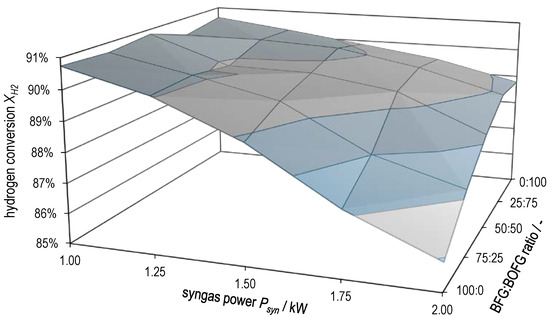
Figure 10.
Hydrogen conversion as a function of syngas power and BFG:BOFG ratio.
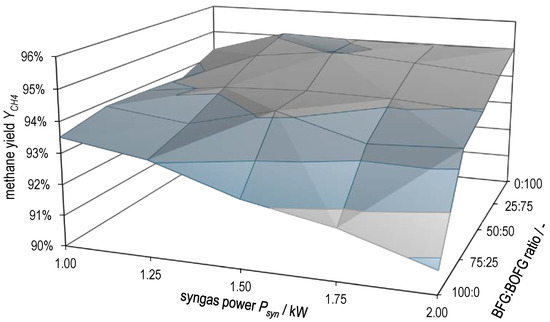
Figure 11.
Methane yield as a function of syngas power and BFG:BOFG ratio.
3.4. Simulated Operating Maps for Maximum and Minimum Inlet Temperatures of ADDmeth1
The experimental studies described above suggest that the inlet temperature into the reaction channel has a great influence on the height and position of the hotspot in the reactor and on the kinetic ignition behavior. With the help of the simulation model presented in the Supplementary Materials, by means of the procedure described in Section 2.4 and the criteria defined in Equations (8) and (9) for the upper and lower limit of the reaction channel inlet temperature, practically relevant operating maps were created.
Figure 12 shows these operating maps, each plotting the dependence of on for one BFG:BOFG ratio. The limits (upper limit, interconnected dots) and (lower limit, interconnected squares), determined according to the procedure described in Section 2.4, are plotted as well as the experimentally measured inlet temperatures into the reaction channel at steady state of the respective operating points (filled triangles). In addition, the inlet temperatures of the two (near) blow-offs are shown (empty triangles).
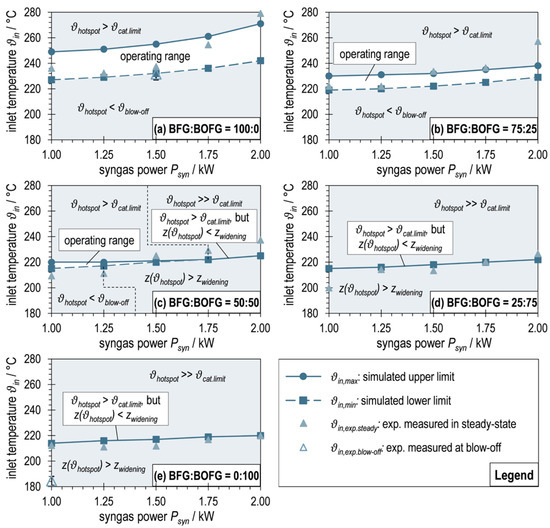
Figure 12.
Operating maps for maximum and minimum reaction channel inlet temperatures of ADDmeth1 derived from simulations in COMSOL Multiphysics® 6.0 (interconnected dots and squares) in comparison with experimentally measured inlet temperatures at steady-state operating points (filled triangles) and at blow-offs (empty triangles).
Figure 12a depicts the limit curves for as a function of syngas power for pure BFG as a carbon source. An operating range of permissible at a temperature level around 240 °C is shown. This range is relatively broad with around 20–30 °C and increases with increasing . Since the increase in syngas power is set by an increase in GHSV, this evokes an increase in the flow velocity in the reaction channel. This subsequently improves the convective heat transport, especially in the axial direction, which causes the reaction zone to be elongated and, keeping constant, the hotspot temperature to decrease. This homogenizing effect was also observed in the experimental studies and was already described above. This means that with an increase in at constant , the conditions for the reaction kinetics become less favorable. Consequently, in order to satisfy the criteria according to Equations (8) and (9), and must increase with as seen in Figure 12a.
Having a look at the diagram of a BFG:BOFG ratio of 75:25 in Figure 12b, it is noticeable that the temperature level of the permissible inlet temperatures decreases. Furthermore, the dependence of on is less pronounced. These trends, which make it more difficult to stabilize the operating points, have already been observed in the experimental runs. This can likely be attributed to the increasing reactivity of the reactant gas mixture with increasing BOFG content (less inert N2, more highly reactive CO). At constant syngas power (defined on the basis of the LHV of the reactant gas mixture), this means a lower GHSV, which in turn leads to lower flow velocities and reduced convective heat transport. At the same time, the thermal ballast (N2) is reduced. This results in a less stretched reaction zone, a more spatially concentrated hotspot, and a higher temperature (at the same per as for BFG:BOFG = 100:0). Conversely, the reaction channel inlet temperature must be lowered to meet the criteria for and . The diminished dependence of on syngas power is also due to the described relationship between and GHSV, as the GHSV span becomes smaller for the considered span of syngas powers. Due to the described effects, the permissible operating range of becomes smaller and the resilience of the reactor to fluctuations in the reaction channel inlet temperature decreases.
The graphs in Figure 12c for a BFG:BOFG ratio of 50:50 show the same trends described above for low syngas powers. From , the criterion of is no longer determined by the critical temperature , but by the position criterion . In order to keep the position of the hotspot before the beginning of the expansion with increasing (1.25 KW–1.75 kW), must increase in excess of the already reported volume flow dependent increase. As a result, the permissible operating range becomes increasingly smaller. With the necessary increase in , the hotspot temperature also increases until it finally reaches the upper temperature limit . From this point on (), there is no longer an operating range for in which the conditions according to Equations (8) and (9) can be fulfilled (further increase in necessary for spatial stabilization of the hotspot, but thereby exceeding ). From a strict point of view, the reactor cannot be operated in these points (congruence of the curves for and ) without an expected catalyst damage. The curve obtained thus only represents an optimization between positioning of the hotspot right before the beginning of the widening of the reaction channel and the minimum necessary exceeding of the hotspot temperature for this purpose. A (moderate) exceeding of the hotspot temperature over the catalyst limit is in any case preferable to its displacement into the widening section, since the latter would cause much higher temperature peaks. The use of an alternative catalyst with a higher would allow (permissible) operation at this operating point and shift the problem towards higher syngas outputs or more reactive reactant gas mixtures.
When looking at Figure 12d,e, it becomes clear that with a further increase in the BOFG share in the reactant gas mixture, no permissible operating range for exists anymore, but instead only the optimization curve described above is found over the entire syngas power range investigated. The temperature level of this curve decreases significantly less with the changing gas composition than the level of the proper operating ranges (Figure 12a–c). This is due to the fact that only the location criterion of the hotspot is considered in this curve, but not the hotspot temperature. The latter increases both with increasing and with increasing BOFG share. For the operating point OP5.1 (BFG:BOFG = 25:75, = 1.0 kW), the catalyst limit is still complied with (), while for OP2.5 (BFG:BOFG = 0:100, = 2.00 kW), this limit is exceeded by around 60 °C (). Similar to the effects before, the fact that from a certain point (depending on gas composition and syngas power) must be exceeded to stabilize the hotspot in the non-widening part of the reaction channel was observed experimentally and described above.
The comparison of the simulated limit curves and the reaction channel inlet temperatures measured during experimental operation at the steady-state operating points agree well throughout. Outliers beyond the upper limit (e.g., OP 3.5 (BFG:BOFG = 75:25, = 2.00 kW) in Figure 12b) may be due to the fact that was not measured correctly (position of the hotspot between two thermocouples) and a too high was set (shifts the hotspot towards the reactor inlet, away from widening). During OP 5.1 (BFG:BOFG = 25:75, = 1.00 kW) in Figure 12d, a stable operating point was found at a significantly lower inlet temperature, although a shift of the hotspot into the widening section of the reaction channel would be expected. This could be due to the fact that an influence of the electrical heating during start-up still existed during this operating point and not all temperature gradients had been finally formed.
This is probably also the reason why the experimentally observed blow-off temperature during the BOFG experiment (see Figure 12e) was well below the expected limit temperature. The influence of the electrical trace heating from the start-up process seems to have delayed the blow-off here. In contrast, for the almost-blow-off during the BFG operating point (see Figure 12a), the measured inlet temperature agrees very well with .
4. Summary and Conclusions
Hydrogen-intensified methanation experiments were conducted in the novel, additively manufactured, heat pipe cooled reactor ADDmeth1 using BFG and/or BOFG as a carbon source. The results allow the following conclusions:
Hydrogen-intensified methanation of carbonaceous steel gases in ADDmeth1 has been successfully demonstrated. At a slight over-stoichiometry of , a pressure of 10 bar and a syngas power range of (corresponding to GHSV ≈ 20,000–49,000 h−1), a methane yield of 90.7–93.5% was achieved for BFG and of approximately 95% for BOFG in the single-stage methanation process. The hydrogen conversion was lower due to the H2 excess in the feed. The observed dependencies of and on syngas power suggest a kinetic limitation during methanation of BFG, while a thermodynamic limitation is likely for BOFG.
In experiments, ADDmeth1 shows a rather sensitive behavior to an abrupt positive change in the inlet volume flow rate, which, due to the design of ADDmeth1, is accompanied by a, at least temporary, decrease in cooling and gas inlet temperature. As a result, the temperature at the reaction channel inlet may fall below the ignition threshold and a blow-off may arise. During this process, traveling hotspots and wrong-way behavior can occur. The ignition threshold and therefore the necessary to avoid a blow-off seems to increase with rising volume flow rate.
Measured steady-state temperature profiles along the reaction channel axis show that the desired beneficial effect of the conically widening reaction channel is achieved. The temperature in the second half of the reactor is stabilized at an elevated level, which results in a kinetics improvement and thus leads to very high methane yields for the single-stage process. The profiles also show that the maximum temperature of the catalyst could be maintained for the methanation of BFG, while this was not possible for BOFG. However, for an optimal equilibrium shift to the product side, the temperatures tend to remain too high up to the reaction channel outlet, which is an indication that the channel is widening too much.
The transition between the two extreme cases of pure BFG and pure BOFG methanation is smooth. This is true in all areas. The temperature gradients increase, both axially and radially, with increasing BOFG content, making reaction stabilization more difficult. The ignition threshold seems to decrease with increasing BOFG content. The trends of H2 conversion and CH4 yield also show continuous progressions depending on the BFG:BOFG ratio.
Practical operating maps of the reaction channel inlet temperature as a function of syngas power and gas composition for the steady-state, created by means of simulations, confirm trends previously observed experimentally. These operating maps can be used during operation of ADDmeth1 to estimate whether a desired operating point is generally possible and whether it can be approached directly from an existing operating point, or whether preparatory measures (e.g., temperature increase to avoid a blow-off in case of volume flow increase) are necessary. Ramps for setting new operating points are advisable to reduce transient effects that are not accounted for in the operating maps but can initiate a blow-off.
The experimental and simulative investigations showed that hydrogen-intensified methanation of BFG in ADDmeth1 is possible in a stable and safe operating range, while the catalyst temperature limit must be exceeded for significant amounts of BOFG to maintain a stable operating point. These operating points must be avoided or increasing catalyst deactivation due to sintering must be expected.
In summary, the ADDmeth concept represents a simple reactor concept (standard catalyst can be used, passive cooling elements, very low system complexity) that enables improved temperature control of the methanation reaction and thus yield maximization.
The successful proof-of-concept of its key innovation, the expanding reaction channel, presented in this paper demonstrates the potential of adding degrees of freedom through 3D printing to the reactor design process for highly exothermic reactions such as methanation. However, the reported investigations with the first prototype ADDmeth1 also show that this potential has not yet been fully exploited.
In further investigations, the simulation model should be formulated more generally in order to be able to correctly represent the kinetics and the thermal conductivity in a catalyst-specific manner. This improved model can subsequently be used to carry out investigations into geometry optimization (e.g., shape and position of beginning of the expansion, reaction channel length). Here, the trade-off between avoiding kinetic limitation and thermodynamic limitation can be understood as an optimization problem. Finally, based on the experimental experience with ADDmeth1 presented in this work and the new simulation results, an optimized prototype and upscale can be implemented.
Supplementary Materials
The following supporting information can be downloaded at: https://www.mdpi.com/article/10.3390/su15097652/s1. Information on used simulation model: Hauser, A.; Karl, J.: 2D Pseudo-Homogeneous Simulation Model of an Additively Manufactured Reactor for Catalytic Methanation. References [41,53,54,55,56,57,58,59,60,61,62,63,64,65,66] are cited in the Supplementary Materials.
Author Contributions
Conceptualization, A.H. and J.K.; data curation, A.H.; formal analysis, A.H.; funding acquisition, J.K.; investigation, A.H. and A.F.; methodology, A.H.; project administration, A.H., P.T. and J.K.; software, A.H. and A.F.; supervision, F.G. and J.K.; validation, A.H.; visualization, A.H.; writing—original draft, A.H.; writing—review and editing, A.H., A.F., P.T., F.G. and J.K. All authors have read and agreed to the published version of the manuscript.
Funding
The experimental work carried out was funded by the European Union through the Research Fund for Coal and Steel (RFCS) within the project entitled “i3upgrade: Integrated and intelligent upgrade of carbon sources through hydrogen addition for the steel industry”, Grant Agreement No. 800659. This paper reflects only the author’s view and the European Commission is not responsible for any use that may be made of the information contained therein.
Conflicts of Interest
The authors declare no conflict of interest.
Appendix A
Table A1.
Set operating points of the variation of syngas power with a BFG:BOFG ratio of 75:25.
Table A1.
Set operating points of the variation of syngas power with a BFG:BOFG ratio of 75:25.
| Operating Point | H2 vol.% | CO2 vol.% | CO vol.% | CH4 vol.% | N2 vol.% | σH2 - | Psyn kW | GHSV h−1 |
|---|---|---|---|---|---|---|---|---|
| OP3.1 | 66.37 | 7.73 | 10.97 | 0.00 | 14.94 | 1.04 | 1.00 | 23,281 |
| OP3.2 | 1.25 | 29,088 | ||||||
| OP3.3 | 1.50 | 34,886 | ||||||
| OP3.4 | 1.75 | 40,717 | ||||||
| OP3.5 | 2.00 | 46,548 |
Table A2.
Set operating points of the variation of syngas power with a BFG:BOFG ratio of 50:50.
Table A2.
Set operating points of the variation of syngas power with a BFG:BOFG ratio of 50:50.
| Operating Point | H2 vol.% | CO2 vol.% | CO vol.% | CH4 vol.% | N2 vol.% | σH2 - | Psyn kW | GHSV h−1 |
|---|---|---|---|---|---|---|---|---|
| OP4.1 | 68.15 | 7.01 | 12.50 | 0.00 | 12.35 | 1.04 | 1.00 | 22,291 |
| OP4.2 | 1.25 | 27,829 | ||||||
| OP4.3 | 1.50 | 33,392 | ||||||
| OP4.4 | 1.75 | 38,961 | ||||||
| OP4.5 | 2.00 | 44,527 |
Table A3.
Set operating points of the variation of syngas power with a BFG:BOFG ratio of 25:75.
Table A3.
Set operating points of the variation of syngas power with a BFG:BOFG ratio of 25:75.
| Operating Point | H2 vol.% | CO2 vol.% | CO vol.% | CH4 vol.% | N2 vol.% | σH2 - | Psyn kW | GHSV h−1 |
|---|---|---|---|---|---|---|---|---|
| OP5.1 | 69.72 | 6.38 | 13.85 | 0.00 | 10.06 | 1.04 | 1.00 | 21,465 |
| OP5.2 | 1.25 | 26,831 | ||||||
| OP5.3 | 1.50 | 32,169 | ||||||
| OP5.4 | 1.75 | 37,537 | ||||||
| OP5.5 | 2.00 | 42,904 |
References
- European Commission. The European Green Deal; European Commission: Brussels, Belgium, 2019; Volume 53. [Google Scholar]
- IEA. Iron and Steel Technology Roadmap; OECD Publishing: Paris, France, 2020. [Google Scholar]
- World Steel Association. Steel Statistical Yearbook 2020 Concise Version; World Steel Association: Brussels, Belgium, 2020. [Google Scholar]
- IEA. Energy Technology Perspectives 2020—Special Report on Clean Energy Innovation; OECD Publishing: Paris, France, 2020. [Google Scholar]
- Osman, A.I.; Hefny, M.; Abdel Maksoud, M.I.A.; Elgarahy, A.M.; Rooney, D.W. Recent Advances in Carbon Capture Storage and Utilisation Technologies: A Review. Environ. Chem. Lett. 2021, 19, 797–849. [Google Scholar] [CrossRef]
- De Ras, K.; Van de Vijver, R.; Galvita, V.V.; Marin, G.B.; Van Geem, K.M. Carbon Capture and Utilization in the Steel Industry: Challenges and Opportunities for Chemical Engineering. Curr. Opin. Chem. Eng. 2019, 26, 81–87. [Google Scholar] [CrossRef]
- Uribe-Soto, W.; Portha, J.F.; Commenge, J.M.; Falk, L. A Review of Thermochemical Processes and Technologies to Use Steelworks Off-Gases. Renew. Sustain. Energy Rev. 2017, 74, 809–823. [Google Scholar] [CrossRef]
- Baker, R.W.; Freeman, B.; Kniep, J.; Huang, Y.I.; Merkel, T.C. CO2 Capture from Cement Plants and Steel Mills Using Membranes. Ind. Eng. Chem. Res. 2018, 57, 15963–15970. [Google Scholar] [CrossRef]
- He, X.; Chen, D.; Liang, Z.; Yang, F. Insight and Comparison of Energy-Efficient Membrane Processes for CO2 Capture from Flue Gases in Power Plant and Energy-Intensive Industry. Carbon Capture Sci. Technol. 2022, 2, 100020. [Google Scholar] [CrossRef]
- Cormos, C.C. Evaluation of Reactive Absorption and Adsorption Systems for Post-Combustion CO2 Capture Applied to Iron and Steel Industry. Appl. Therm. Eng. 2016, 105, 56–64. [Google Scholar] [CrossRef]
- Cormos, A.M.; Dinca, C.; Petrescu, L.; Andreea Chisalita, D.; Szima, S.; Cormos, C.C. Carbon Capture and Utilisation Technologies Applied to Energy Conversion Systems and Other Energy-Intensive Industrial Applications. Fuel 2018, 211, 883–890. [Google Scholar] [CrossRef]
- Yildirim, Ö.; Nölker, K.; Büker, K.; Kleinschmidt, R. Chemical Conversion of Steel Mill Gases to Urea: An Analysis of Plant Capacity. Chem. Ing. Tech. 2018, 90, 1529–1535. [Google Scholar] [CrossRef]
- Girod, K.; Lohmann, H.; Kaluza, S. Methanol Synthesis with Steel Mill Gases: Performance Investigations in an On-Site Technical Center. Chem. Ing. Tech. 2021, 93, 850–855. [Google Scholar] [CrossRef]
- Girod, K.; Lohmann, H.; Schlüter, S.; Kaluza, S. Methanol Synthesis with Steel-Mill Gases: Simulation and Practical Testing of Selected Gas Utilization Scenarios. Processes 2020, 8, 1673. [Google Scholar] [CrossRef]
- Hauser, A.; Wolf-Zoellner, P.; Haag, S.; Dettori, S.; Tang, X.; Mighani, M.; Matino, I.; Mocci, C.; Colla, V.; Kolb, S.; et al. Valorizing Steelworks Gases by Coupling Novel Methane and Methanol Synthesis Reactors with an Economic Hybrid Model Predictive Controller. Metals 2022, 12, 1023. [Google Scholar] [CrossRef]
- Hauser, A.; Weitzer, M.; Gunsch, S.; Neubert, M.; Karl, J. Dynamic Hydrogen-Intensified Methanation of Synthetic by-Product Gases from Steelworks. Fuel Process. Technol. 2021, 217, 106701. [Google Scholar] [CrossRef]
- Wolf-Zoellner, P.; Medved, A.R.; Lehner, M.; Kieberger, N.; Rechberger, K. In Situ Catalytic Methanation of Real Steelworks Gases. Energies 2021, 14, 8131. [Google Scholar] [CrossRef]
- Schöß, M.; Redenius, A.; Turek, T.; Güttel, R. Chemische Speicherung Regenerativer Elektrischer Energie Durch Methanisierung von Prozessgasen Aus Der Stahlindustrie. Chem. Ing. Tech. 2014, 86, 734–739. [Google Scholar] [CrossRef]
- Wolf-Zoellner, P.; Lehner, M.; Kieberger, N. Application-Based Catalytic Methanation of Steelworks Gases under Dynamic Operating Conditions. J. Clean. Prod. 2022, 371, 133570. [Google Scholar] [CrossRef]
- Matino, I.; Dettori, S.; Castellano, A.; Matino, R.; Mocci, C.; Vannocci, M.; Maddaloni, A.; Colla, V.; Wolff, A. Machine Learning-Based Models for Supporting Optimal Exploitation of Process Off-Gases in Integrated Steelworks. In Impact and Opportunities of Artificial Intelligence Techniques in the Steel Industry; Colla, V., Pietrosanti, C., Eds.; Springer: Cham, Switzerland, 2021; pp. 104–118. [Google Scholar]
- Matino, I.; Dettori, S.; Colla, V.; Rechberger, K.; Kieberger, N. Echo-State Neural Networks Forecasting Steelworks off-Gases for Their Dispatching in CH4 and CH3OH Syntheses Reactors. In Proceedings of the ESANN 2021 Proceedings, European Symposium on Artificial Neural Networks, Computational Intelligence and Machine Learning, Bruges, Belgium, 6–8 October 2021; pp. 317–322. [Google Scholar]
- Dettori, S.; Matino, I.; Iannino, V.; Colla, V.; Hauser, A.; Wolf-Zöllner, P.; Haag, S. Optimizing Methane and Methanol Production from Integrated Steelworks Process Off-Gases through Economic Hybrid Model Predictive Control. IFAC-PapersOnLine 2022, 55, 66–71. [Google Scholar] [CrossRef]
- Matino, I.; Dettori, S.; Zaccara, A.; Petrucciani, A.; Iannino, V.; Colla, V.; Bampaou, M.; Panopoulos, K.; Rechberger, K.; Kolb, S.; et al. Hydrogen Role in the Valorization of Integrated Steelworks Process Off-Gases through Methane and Methanol Syntheses. Matér. Tech. 2021, 109, 308. [Google Scholar] [CrossRef]
- Iannino, V.; Colla, V.; Mocci, C.; Matino, I.; Dettori, S.; Kolb, S.; Plankenbühler, T.; Karl, J. Multi-Agent Systems to Improve Efficiency in Steelworks. Matér. Tech. 2022, 109, 502. [Google Scholar] [CrossRef]
- Zaccara, A.; Petrucciani, A.; Matino, I.; Branca, T.A.; Dettori, S.; Iannino, V.; Colla, V.; Bampaou, M.; Panopoulos, K. Renewable VolumenHydrogen Production Processes for the Off-Gas Valorization in Integrated Steelworks through Hydrogen Intensified Methane and Methanol Syntheses. Metals 2020, 10, 1535. [Google Scholar] [CrossRef]
- Bampaou, M.; Panopoulos, K.; Seferlis, P.; Voutetakis, S.; Matino, I.; Petrucciani, A.; Zaccara, A.; Colla, V.; Dettori, S.; Annunziata Branca, T.; et al. Integration of Renewable Hydrogen Production in Steelworks Off-Gases for the Synthesis of Methanol and Methane. Energies 2021, 14, 2904. [Google Scholar] [CrossRef]
- Bampaou, M.; Panopoulos, K.; Seferlis, P.; Sasiain, A.; Haag, S.; Wolf-zoellner, P.; Lehner, M.; Rog, L.; Rompalski, P.; Kolb, S.; et al. Economic Evaluation of Renewable Hydrogen Integration into Steelworks for the Production of Methanol and Methane. Energies 2022, 15, 4650. [Google Scholar] [CrossRef]
- Remus, R.; Roudier, S.; Aguado Monsonet, M.A.; Sancho, L.D. Best Available Techniques (BAT) Reference Document for Iron and Steel Production; European Commission, Joint Research Centre: Seville, Spain, 2013; Volume BREF-IS. [Google Scholar]
- Strucks, P.; Failing, L.; Kaluza, S. A Short Review on Ni-Catalyzed Methanation of CO2: Reaction Mechanism, Catalyst Deactivation, Dynamic Operation. Chem. Ing. Tech. 2021, 93, 1526–1536. [Google Scholar] [CrossRef]
- Götz, M.; Lefebvre, J.; Mörs, F.; McDaniel Koch, A.; Graf, F.; Bajohr, S.; Reimert, R.; Kolb, T. Renewable Power-to-Gas: A Technological and Economic Review. Renew. Energy 2016, 85, 1371–1390. [Google Scholar] [CrossRef]
- Rönsch, S.; Schneider, J.; Matthischke, S.; Schlüter, M.; Götz, M.; Lefebvre, J.; Prabhakaran, P.; Bajohr, S. Review on Methanation—From Fundamentals to Current Projects. Fuel 2016, 166, 276–296. [Google Scholar] [CrossRef]
- Mills, G.A.; Steffgen, F.W. Catalytic Methanation. Catal. Rev. 1974, 8, 159–210. [Google Scholar] [CrossRef]
- Ridzuan, N.D.M.; Shaharun, M.S.; Anawar, M.A.; Ud-Din, I. Ni-Based Catalyst for Carbon Dioxide Methanation: A Review. Catalysts 2022, 12, 469. [Google Scholar] [CrossRef]
- Tan, C.H.; Nomanbhay, S.; Shamsuddin, A.H.; Park, Y.K.; Hernández-Cocoletzi, H.; Show, P.L. Current Developments in Catalytic Methanation of Carbon Dioxide—A Review. Front. Energy Res. 2022, 9, 795423. [Google Scholar] [CrossRef]
- Ma, Y.; Liu, J.; Chu, M.; Yue, J.; Cui, Y.; Xu, G. Cooperation Between Active Metal and Basic Support in Ni-Based Catalyst for Low-Temperature CO2 Methanation. Catal. Lett. 2020, 150, 1418–1426. [Google Scholar] [CrossRef]
- Zhang, L.; Bian, L.; Li, Z.; Xia, R. The Promoter Action of CeO2 for the Ni/Al2O3-Catalyzed Methanation of CO2. Kinet. Catal. 2015, 56, 329–334. [Google Scholar] [CrossRef]
- Material Safety Data Sheet Nickel Tetracarbonyl (NiCO4). Available online: https://gestis.dguv.de/data?name=004260 (accessed on 17 April 2023).
- Neubert, M.F.W. Catalytic Methanation for Small-and Mid-Scale SNG Production|Katalytische Methanisierung für Die SNG Erzeugung in Kleinen Bis Mittleren Anlagengrößen; FAU Erlangen-Nürnberg: Erlangen, Germany, 2019. [Google Scholar]
- Kerfoot, D.G.E. Nickel. In Ullmann’s Encyclopedia of Industrial Chemistry; Wiley-VCH GmbH & Co. KGaA: Weinheim, Germany, 2000. [Google Scholar]
- Bengaouer, A.; Ducamp, J.; Champon, I.; Try, R. Performance Evaluation of Fixed-Bed, Millistructured, and Metallic Foam Reactor Channels for CO2 Methanation. Can. J. Chem. Eng. 2018, 96, 1937–1945. [Google Scholar] [CrossRef]
- Hauser, A.; Neubert, M.; Feldner, A.; Horn, A.; Grimm, F.; Karl, J. Design and Implementation of an Additively Manufactured Reactor Concept for the Catalytic Methanation. Appl. Sci. 2022, 12, 9393. [Google Scholar] [CrossRef]
- Kosaka, F.; Yamaguchi, T.; Ando, Y.; Mochizuki, T.; Takagi, H.; Matsuoka, K.; Kuramoto, K. Thermal Management of CO2 Methanation with Axial Staging of Active Metal Concentration in Ni-YSZ Tubular Catalysts. Int. J. Hydrogen Energy 2021, 46, 4116–4125. [Google Scholar] [CrossRef]
- Zimmermann, R.T.; Bremer, J.; Sundmacher, K. Load-Flexible Fixed-Bed Reactors by Multi-Period Design Optimization. Chem. Eng. J. 2022, 428, 130771. [Google Scholar] [CrossRef]
- Hervy, M.; Maistrello, J.; Brito, L.; Rizand, M.; Basset, E.; Kara, Y.; Maheut, M. Power-to-Gas: CO2 Methanation in a Catalytic Fluidized Bed Reactor at Demonstration Scale, Experimental Results and Simulation. J. CO2 Util. 2021, 50, 101610. [Google Scholar] [CrossRef]
- Tronconi, E.; Groppi, G.; Visconti, C.G. Structured Catalysts for Non-Adiabatic Applications. Curr. Opin. Chem. Eng. 2014, 5, 55–67. [Google Scholar] [CrossRef]
- Baena-Moreno, F.M.; González-Castaño, M.; Navarro De Miguel, J.C.; Miah, K.U.M.; Ossenbrink, R.; Odriozola, J.A.; Arellano-García, H. Stepping toward Efficient Microreactors for CO2 Methanation: 3D-Printed Gyroid Geometry. ACS Sustain. Chem. Eng. 2021, 9, 8198–8206. [Google Scholar] [CrossRef]
- Stiegler, T.; Meltzer, K.; Tremel, A.; Baldauf, M.; Wasserscheid, P.; Albert, J. Development of a Structured Reactor System for CO2 Methanation under Dynamic Operating Conditions. Energy Technol. 2019, 7, 1900047. [Google Scholar] [CrossRef]
- Pérez, S.; Aragón, J.J.; Peciña, I.; Garcia-Suarez, E.J. Enhanced CO2 Methanation by New Microstructured Reactor Concept and Design. Top. Catal. 2019, 62, 518–523. [Google Scholar] [CrossRef]
- Neubert, M.; Hauser, A.; Pourhossein, B.; Dillig, M.; Karl, J. Experimental Evaluation of a Heat Pipe Cooled Structured Reactor as Part of a Two-Stage Catalytic Methanation Process in Power-to-Gas Applications. Appl. Energy 2018, 229, 289–298. [Google Scholar] [CrossRef]
- Try, R.; Bengaouer, A.; Baurens, P.; Jallut, C. Dynamic Modeling and Simulations of the Behavior of a Fixed-Bed Reactor-Exchanger Used for CO2 Methanation. AIChE J. 2018, 64, 468–480. [Google Scholar] [CrossRef]
- Schlereth, D.; Hinrichsen, O. A Fixed-Bed Reactor Modeling Study on the Methanation of CO2. Chem. Eng. Res. Des. 2014, 92, 702–712. [Google Scholar] [CrossRef]
- Moioli, E.; Gallandat, N.; Züttel, A. Parametric Sensitivity in the Sabatier Reaction over Ru/Al2O3-Theoretical Determination of the Minimal Requirements for Reactor Activation. React. Chem. Eng. 2019, 4, 100–111. [Google Scholar] [CrossRef]
- Liu, D.M.; Tuan, W.H.; Chiu, C.C. Thermal Diffusivity, Heat Capacity and Thermal Conductivity in Al2O3Ni Composite. Mater. Sci. Eng. B 1995, 31, 287–291. [Google Scholar] [CrossRef]
- Pushnov, A.S. Calculation of Average Bed Porosity. Chem. Pet. Eng. 2006, 42, 14–17. [Google Scholar] [CrossRef]
- Rönsch, S.; Köchermann, J.; Schneider, J.; Matthischke, S. Global Reaction Kinetics of CO and CO2 Methanation for Dynamic Process Modeling. Chem. Eng. Technol. 2016, 39, 208–218. [Google Scholar] [CrossRef]
- Neubert, M.; Widzgowski, J.; Rönsch, S.; Treiber, P.; Dillig, M.; Karl, J. Simulation-Based Evaluation of a Two-Stage Small-Scale Methanation Unit for Decentralized Applications. Energy Fuels 2017, 31, 2076–2086. [Google Scholar] [CrossRef]
- Elnashaie, S.S.E.H.; Elshishini, S.S. Modelling, Simulation and Optimization of Industrial Fixed Bed Catalytic Reactors. Topics in Chemical Engineering; Gordon and Breach Science Publishers: Philadelphia, PA, USA, 1993; Volume 7, ISBN 2-88124-883-7. [Google Scholar]
- Jess, A.; Wasserscheid, P. Chemical Technology—An Integral Textbook; Wiley-VCH: Weinheim, Germany, 2013; ISBN 978-3-527-30446-2. [Google Scholar]
- Levenspiel, O. Chemical Reaction Engineering; Wiley: Hoboken, NJ, USA, 1999; ISBN 978-0-471-25424-9. [Google Scholar]
- Gruber, M. Detaillierte Untersuchung Des Wärme-Und Stofftransports in Einem Festbett-Methanisierungsreaktor Für Power-to-Gas Anwendungen; Karlsruher Institut für Technologie (KIT): Karlsruhe, Germany, 2019. [Google Scholar]
- Gruber, M.; Wiedmann, D.; Haas, M.; Harth, S.; Loukou, A.; Trimis, D. Insights into the Catalytic CO2 Methanation of a Boiling Water Cooled Fixed-Bed Reactor: Simulation-Based Analysis. Chem. Eng. J. 2021, 406, 126788. [Google Scholar] [CrossRef]
- Burger, T.; Donaubauer, P.; Hinrichsen, O. On the Kinetics of the Co-Methanation of CO and CO2 on a Co-Precipitated Ni-Al Catalyst. Appl. Catal. B Environ. 2020, 119408. [Google Scholar] [CrossRef]
- Schmider, D.; Maier, L.; Deutschmann, O. Reaction Kinetics of CO and CO2 Methanation over Nickel. Ind. Eng. Chem. Res. 2021, 60, 5792–5805. [Google Scholar] [CrossRef]
- COMSOL Inc. CFD Module User’s Guide. Available online: https://doc.comsol.com/6.0/docserver/#!/com.comsol.help.cfd/html_CFDModuleManual.html (accessed on 13 October 2022).
- Vdi, E.V. (Ed.) Verein Deutscher Ingenieure VDI-Wärmeatlas, 11th ed.; Springer: Berlin/Heidelberg, Germay, 2013; ISBN 978-3-642-19980-6. [Google Scholar]
- COMSOL Inc. Chemical Reaction Engineering User’s Guide. Available online: https://doc.comsol.com/6.0/docserver/#!/com.comsol.help.chem/html_ChemicalReactionEngineeringModuleManual.html (accessed on 13 October 2022).


Disclaimer/Publisher’s Note: The statements, opinions and data contained in all publications are solely those of the individual author(s) and contributor(s) and not of MDPI and/or the editor(s). MDPI and/or the editor(s) disclaim responsibility for any injury to people or property resulting from any ideas, methods, instructions or products referred to in the content. |
© 2023 by the authors. Licensee MDPI, Basel, Switzerland. This article is an open access article distributed under the terms and conditions of the Creative Commons Attribution (CC BY) license (https://creativecommons.org/licenses/by/4.0/).