Abstract
Seaweed culture is of great significance in giving full play to the function of marine carbon sequestration and strengthening the protection and repair of the marine ecosystem. Its green efficiency measurement can provide China with a means for a global low-carbon economy. From the ecological perspective of net carbon sink, this paper selects three indexes: input, expected output and unexpected output. The total carbon sink and carbon emissions are included in the evaluation index system of green efficiency of seaweed culture in China. The green efficiency of seaweed culture in China from 2008 to 2020 is calculated by the super-SBM model. Through the redundancy rate of input and output, the influencing factors of net carbon sink output of seaweed culture are put forward. According to the empirical calculation results and influencing factors of green efficiency, the countermeasures and suggestions for green seaweed culture in China under the dual-carbon target are put forward. The results showed that: (1) the net carbon sink and green efficiency level of seaweed culture in China showed an overall growth trend, and there was a lot of room for growth in economic and ecological benefits; (2) influenced by index factors and non-index factors such as marine resource economy and planning, there are differences in seaweed culture and green efficiency in the three major sea areas of China; (3) the indexes of green efficiency of seaweed culture in different study areas are different; and (4) the improvement of green efficiency can promote the Chinese seaweed culture industry. Green technology progress effect, structure effect, and input–output scale effect are the main influencing mechanisms of green efficiency of seaweed culture. It is suggested that in the future, we should optimize the structure of seaweed culture, innovate seaweed culture technology, improve carbon sink trading policy and strengthen the training of carbon sink talents. This will accelerate the realization of the goal of green and double carbon seaweed culture and promote the global low-carbon economy.
1. Introduction
In 2021, China proposed to improve the carbon sink capacity of the ecosystem and strive to achieve the dual goals of carbon peaking before 2030 and carbon neutrality before 2060 [1]. Marine ecosystems are the largest carbon sinks on Earth, absorbing 20–35 percent of the carbon dioxide emitted into the atmosphere [2], three times more than land. A marine carbon sink fishery is a series of marine fishery production activities that can absorb carbon either dioxide directly or indirectly, and it is an important way to contribute to the net carbon sink. One of its concrete manifestations is that seaweed and other cultured organisms carry out carbon sequestration activities in waters through photosynthesis [3]. Seaweeds grow 10 times faster than terrestrial plants. They can absorb nitrate and phosphate from seawater, thus repairing damaged marine ecosystems, absorbing carbon dioxide and releasing oxygen effectively, thus having great carbon sequestration potential. According to the statistics of the Food and Agriculture Organization (FAO), global seaweed production has increased rapidly. In 2019, global seaweed culture accounted for 30% of the total aquaculture production [4]. The output of seaweed culture in China has ranked first in the world for 32 consecutive years, accounting for more than 60% of the total amount of seaweed culture in the world. In 2020, the output of seaweed culture in China’s coastal areas was 2,615,100 t [5] and the annual carbon sequestration was about 150,800 t, which is equivalent to reducing carbon dioxide by 553,400 t. Green is the only way for China’s social economy to progress as proposed by China’s green targets in the new era in 2023. The focus of marine carbon sink fisheries is a win-win situation between ecological benefits and economic benefits. However, at present, the mechanism measurement of marine carbon sink fisheries is still lacking, and the marine carbon sink market trading mechanism has not yet been established. A systematic monitoring and evaluation system for marine carbon sinks has not yet been formed. The marine carbon sequestration fishery is a strategic and concrete action carrier of a low-carbon economy, which is of great significance in giving full play to the function of marine carbon sequestration and strengthening the protection and repair of marine ecosystems. Research on the green efficiency of seaweed culture can objectively reflect the situation between economic output, ecological output and pollution of seaweed culture, which is one of the important ways to promote negative emissions and achieve the goals of the double carbon policy. The research on the green efficiency measurement of seaweed culture in China also provides China with a means for promoting a global low-carbon economy.
2. Research Status at Home and Abroad
The marine carbon sink fishery is a new carbon sink industry, and its industrialization and marketization are becoming more and more stable. This is one of the important ways to reduce emissions and increase sinks. It plays a very important role in controlling the greenhouse effect of the global carbon cycle and greatly promotes the low-carbon economy to help the goal of “carbon neutrality”. Therefore, marine carbon sequestration fisheries and seaweed culture green efficiency have become a hot research topic of scholars at home and abroad, and the importance of marine carbon sequestration has formed a certain consensus and affirmation.
2.1. Study on Seaweed Culture and Carbon Sequestration Function
The release of the Blue Carbon report in 2009 plays an important role in dealing with climate change. Since then, marine carbon sink fisheries have been widely concerned [6]. The three types of “blue carbon” in the marine ecosystem, seagrass beds, mangrove forests and salt marshes, cover the ways of marine carbon sequestration [7]. Among these the seabed ecosystem, to which seagrass beds belong, is regarded as the most important contributor to “blue carbon” [2]. The seagrass bed has efficient carbon sequestration capacity with macroalgae as the main carbon sequestration carrier and the “biological pump” as the main carbon sequestration mechanism. Algae have the characteristics of a fast growth rate and high yield [8,9], leading to a higher carbon sequestration capacity [10]. Carbon sequestration of macroalgae is a necessary condition for photosynthesis, and CO2 and light energy are necessary conditions for carbon sequestration by removing carbon dioxide from seawater. Besides the most basic C3 carbon metabolism pathway, some seaweeds also carry out a C4 carbon metabolism pathway [11], such as the red leaf algae carrying out the Calvin cycle through CO2 diffusion [12]. Ulva seaweed can actively utilize inorganic carbon in seawater for the third photosynthetic carbon metabolism pathway (CAM pathway) besides the C3 and C4 carbon metabolism pathways [13].
2.2. Study on Green Efficiency of Seaweed Culture
A green society needs to unify efficiency, harmony and the three core points to promote economic growth [14]; in addition, “good” output such as economic growth and “bad” output such as pollution, and the efficiency that can input resources at the same time, is called green efficiency. The green efficiency of seaweed culture is the input–output ratio between the resource input index and the eco-economic output index. As one of the important ways to achieve the dual-carbon goal, the research has continuously expanded the green efficiency measurement system on the basis of input–output efficiency of seaweed culture and transformed the output index into a resource index including expected output (such as carbon sink) and unexpected output (such as carbon emission). With the continuous development of the marine carbon sink fishery industry, and in order to improve green efficiency, scholars have put forward suggestions from the aspects of industrial structure, technological innovation and trading system [15,16,17,18].
There are four kinds of green efficiency measurements in the present research: the comprehensive evaluation method, the stochastic frontier method (SAF), the data envelopment analysis DEA (data envelopment analysis DEA) and the decoupling theory. The data envelopment model is first used to measure the aquaculture efficiency in mariculture. Vassdal T. et al. [19], Ji J. et al. [20], Wang P. et al. [21], the Malmquist productivity index model, the SBM model and the Seiford linear transformation model of the DEA data model are used to measure the aquaculture efficiency of marine fisheries. With the implementation of marine fishery green policy, scholars began to use the DEA model to study the green efficiency of marine aquaculture. Martinezcordero F.J. et al. [22], Qian Z M. and others [23], Ji J Y. and others [24], and Qin H. and others [25] used the DEA model to measure the green efficiency of marine aquaculture, green economic efficiency, green technical efficiency and ecological economic efficiency. The data envelopment method can effectively measure the green efficiency of marine carbon sink fisheries.
Research on selecting input–output indicators for the data envelopment model land labor capital technology is usually used as the core input index. Ji J Y. et al. [24] and Wang P. et al. [21] take the aquaculture area, the number of aquaculture fishing boats and the intermediate consumption of aquaculture as input factors. Qin H. and others added technical elements on this basis and took the training intensity of mariculture as an input index [25]. Xu J J. and others focused on the allocation of fishery resources in mariculture and the number of fishery fry as input index [26]. With the impact of marine ecology on economic output and the gradual deepening of the study of marine carbon sinks, scholars have added ecological factors and pollution factors to the selection of output indicators and divided the output indicators into expected output and non-expected output. Shao G L. et al. took the total carbon sequestration of seawater shellfish algae culture as the expected output index from the perspective of the marine carbon cycle [27]. Zhang X. et al. took the carbon emission of mariculture as an unexpected output index from an ecological perspective [28].
2.3. Study on the Influencing Factors of Green Efficiency of Seaweed Culture
The existing research on the influencing factors of green efficiency of seaweed culture mainly includes three aspects: economic structure, technology and regulation. The economic influencing factors of seaweed culture mainly include the yield and output values of mariculture. Some scholars have proved that the relationship between the output value and the yield of mariculture efficiency is an inverted U-shape [29]. With the popularization of the concept, the rationality of mariculture scale has a positive promotional effect on the improvement of economic efficiency and green efficiency [30]. The influencing factors of marine carbon sink fishery structure mainly include the variety culture structure and industrial structure. Priority carbon sink industries and products can promote the effective growth of the green efficiency of mariculture [31]. The multi-trophic level of the ecological culture combination of different varieties in different sea areas is positively correlated with the improvement of green efficiency [32]. The influencing factors of marine carbon sink fishery technology mainly include the technical training of employees and the scientific research of aquaculture technology. Some scholars believe that technological progress is an important factor to improve economic efficiency and green efficiency [33]. The influencing factors of marine carbon sink fishery regulation mainly include the policy regulation of pollution control and emission. When the regulation intensity of the protection policy and pollution control quota exceeds a specific value, the production efficiency of mariculture will increase [34]. The marine carbon sink fishery can achieve this level of efficiency.
2.4. Literature Review
Scholars have basically reached a consensus on the important role of seaweed culture. Seaweed culture is an environmentally friendly industry based on the concept of sustainability, which can achieve the dual effects of economic and ecological benefits. A low-carbon and high-efficiency sustainable green road is the key to green research of seaweed culture. Existing studies at home and abroad have gradually improved the input–output efficiency of mariculture, but the calculation of mariculture efficiency lacks consideration of carbon emission factors. The total amount of carbon sinks cannot accurately reflect the impact of seawater shellfish culture on marine negative emissions, and the net amount of carbon sinks after deducting carbon emissions can accurately evaluate the contribution of seawater shellfish culture to carbon sinks.
Therefore, this paper will collate the panel data of seaweed culture in seven coastal provinces of China from 2008 to 2020 from the perspective of net carbon sink ecology and measure the green efficiency of seaweed culture by using the data envelopment model. The related factors that affect the likelihood of seaweed culture to improve the net carbon sink through the input–output redundancy rate provide China with giving full play to the function of marine carbon sink and sequestration, strengthening the protection and repair of marine ecosystems, accelerating the realization of the dual-carbon goal and promoting a global low-carbon economy.
3. Research Methods and Data
The original data of seaweed aquaculture production in this paper are from the China Fishery Statistics Yearbook from 2009 to 2021, and the panel data of seven coastal seaweed cultivation provinces (Liaoning, Shandong, Jiangsu, Zhejiang, Fujian, Guangdong and Hainan) in China from 2008 to 2020 are collated. In 2020, the production of seaweed aquaculture in coastal areas was 2.6151 million tons, accounting for 12.85% of the total amount of seaweed aquaculture in China, and eight varieties of kelp, wakame, seaweed, jiangbei and other algae (sheep chiff, stone cauliflower, unicorn and moss) were selected for seaweed culture, accounting for 66.10%, 9.03%, 8.89%, 14.77% and 1.22% of the total seaweed culture, respectively.
3.1. Influence Mechanism of Seaweed Culture on Green Efficiency
Based on the three core points of resource input, economic growth and link influence in the theoretical model of factors affecting the green efficiency of seaweed culture, the influence mechanism of seaweed culture on green efficiency is analyzed according to the output scale effect, structure effect, technological progress effect, incentive effect and organization management effect.
- (1)
- Inverted U effect of input scale
The most basic production factors of the marine carbon sequestration fishery are production factors such as area and labor force and fixed assets investment scale such as fishing boats and facilities. The inverted U effect means that the input of basic production factors of the marine carbon sequestration fishery makes the carbon sequestration capacity of the marine carbon sequestration fishery show an inverted U trend; that is, the output growth brought by the input has an upper limit, and the output will fall back down when it reaches a certain height. Under the condition that other input resource indexes are unchanged, the input will increase the yield of shellfish and algae culture, and the carbon sequestration will also follow. Algae carbon sequestration photosynthesis has the characteristics of a CO2 fertilization and concentration mechanism [35,36]; that is, algae photosynthesis needs CO2 participation, but if the culture density is too high, it will exceed the threshold of CO2 required for algae photosynthesis, which will lead to problems in algae growth rate and yield level [37]. Therefore, it is concluded that the green efficiency can be effectively improved by planning the scale and density of the seaweed culture.
- (2)
- Structural effect
The structural effect is used to optimize the resource allocation through the output structure, which can effectively produce output and enhance the carbon sequestration capacity of marine carbon sinks. The carbon sequestration coefficient is an important index of carbon sequestration in seaweed culture. The carbon sequestration coefficient of different shellfish and algae is quite different. A reasonable seaweed culture structure can lead to poor economic benefits, caused by a single culture category, and poor ecological benefits, caused by too high a proportion of economic culture crops. Therefore, rational algae and internal culture structures are beneficial to improve green efficiency.
- (3)
- Technological progress effect
The effect of technological progress means that improving the culture technology of the marine carbon sequestration fishery can promote the utilization rate of marine resources and the productivity of the marine carbon sequestration fishery and improve the economic scale of seaweed culture. The aquaculture technology of the marine carbon sequestration fishery can be divided into the extension of fishery technology, and the higher the proportion of fishery science and technology professionals, the higher the fishery productivity, which can promote the improvement of the output and quality of marine fishery products. Ecological aquaculture and intensive scale aquaculture technology can improve the output scale of algae, and energy utilization technology can improve the energy utilization rate, so that the carbon emission of fishing boats and the improvement of scientific and technological conversion rate of water pollution can directly promote the growth of seaweed culture. Therefore, it is considered that improving the level of mariculture technology and suitable mariculture can positively improve the green efficiency value.
- (4)
- Regulation effect
Among the influencing factors, the pollution of sea area, the use of fishery drugs and fishery disasters will lead to the decline of the green efficiency of aquatic products, while the carbon sequestration capacity will directly affect the expected output level. The link regulation effect is used to improve the carbon sequestration capacity of seaweed culture by controlling the influencing factors such as pollution control and emission, including incentive type and command control type. Incentive type can improve the efficiency of pollution control and control input, and command control type can directly achieve the level of unexpected output of its own pollution and carbon emission. Therefore, actively improving the management planning and policy of marine aquaculture protection can effectively protect the marine ecosystem, improve the algae culture space and improve the green efficiency of algae culture.
- (5)
- Organizational management effect
Organizational management effect means that, through external organization and management, it can promote the standardization of the marine carbon sequestration fishery, promote the production efficiency of the marine carbon sequestration fishery, promote the rationality of its organization and management, and control the formation of a standardized system for the scale and structure of seawater shellfish and algae culture. The control attribute of external organization and management can maintain the feasibility of the industry under the profit-seeking of market capital, improve the quality and production efficiency of seaweed culture and promote its green transformation. Therefore, this paper argues that the implementation of fishery management laws and regulations and industrial organization planning and other external organization management is conducive to the high promotion of the marine carbon sequestration fishery industry, and the efficiency of seaweed culture is conducive to the promotion of green efficiency.
3.2. The Definition of the Model
Based on the perspective of green efficiency, the core indicators of marine carbon sequestration fisheries are net carbon sequestration and economic output. While economic growth, net externality, is the main feature of carbon sequestration attributes. In this paper, the green efficiency of marine carbon sequestration fisheries is calculated by measuring the input–output ratio of seawater algae culture; that is, the efficiency ratio between the input resources and economic output of seawater algae culture, ecological output and ecological pollution caused by seawater algae culture, and the influencing factors of the green efficiency of seawater algae culture are affected by the input–output redundancy ratio. The data envelopment model (DEM) is a mathematical programming model that can select effective decision-making units in input–output indexes and sort them. Therefore, this paper selects the super-SBM model in the data envelopment model to measure the green efficiency of seaweed culture. The non-angle and non-radial setting of super-efficiency can avoid setting errors. This paper selects the demand effective decision-making units and their effectiveness degree as evaluated by multi-input and multi-output indexes [38]. According to the empirical results, we can quantify the rationality of the input–output structure and the balance between expected output and non-expected output in seaweed culture and the influence degree of input–output factors on the green efficiency of seaweed culture.
The mathematical expression of the super-SBM model with undesired output indicators in 2001 is as follows:
Among them, represents the green development efficiency value of the decision unit; denotes the expected output index and the unexpected output index of input index, respectively, represent input indicators, expected output indicators and non-expected output indicators; are relaxation variables; represents the redundancy of inputs; indicates the insufficient expected output; indicates the excess of undesired output, when , the decision unit is relatively efficient, and when , the decision unit produces efficiency loss.
3.3. Input–Output Indicator Selection
The expected output indicators and unexpected output indicators are based on the impact mechanism of seaweed cultivation on green efficiency and by referring to the selection of input–output indicators for seaweed aquaculture efficiency models by Qin H. et al. [25] and Zhang X X. et al. [28]. The four aspects of land, labor, capital and technology are used as the secondary indicators of input, and the area of mariculture, the number of mariculture professionals, the number of mariculture fishing boats at the end of the year, and the training intensity of mariculture fishermen are selected as the indicators of economic output and ecological production. As the second-level indicator of expected output, the economic output value of seaweed farming and the total amount of carbon that can be removed from seaweed farming are selected specifically; ecological pollution is used as the second-level indicator of non-expected output, and the carbon emissions of seaweed farming are specifically selected.
The description of specific indicators and variables of seaweed culture are shown in Table 1, and the correlation coefficient and calculation formula of total carbon sink and carbon emission of seaweed culture are explained.

Table 1.
Evaluation index system of green development efficiency of seaweed farming.
- (1)
- Aggregate carbon from seaweed farming
According to the mechanism of carbon sequestration in marine ecosystem, the total carbon sequestration of seaweed culture can be divided into three types: soluble organic carbon released by algae, particulate organic carbon, and biodetritus carbon released by algae [39]. Because it is difficult to evaluate carbon sequestration in the form of soluble organic carbon, particulate organic carbon and biodetritus carbon, this paper only takes the carbon sequestration of seaweed culture as the total carbon sequestration index of seaweed culture. At present, there are some disputes over the accounting rules of the carbon sequestration capacity of marine carbon sinks. Scholars at home and abroad usually use the biomass method and stock method to calculate carbon sequestration capacity based on carbon conversion efficiency and carbon parameters [39]. Therefore, this paper chooses a material assessment method to calculate the removable carbon sequestration capacity of the marine carbon sequestration fishery. The calculation of carbon sequestration in seaweed culture is carried out according to the dry and wet weight specific gravity method. The dry weight conversion coefficient of algae is 20%. The specific coefficient of algae correlation refers to that expressed by Guo B. [40], Zhou Y. et al. [41] and J Y. et al. [42]. For detailed values, see Table 2. The calculation formula of total carbon sequestration in seaweed culture is as follows:
Table 2.
Table of correlation coefficients for calculating carbon sequestration by algae.
- (2)
- Carbon emissions from seaweed farming
Carbon emissions from seaweed culture include direct and indirect carbon emissions. Direct carbon emissions refer to the carbon dioxide emissions from combustion of diesel oil consumed by fishing boats. Indirect carbon emissions refer to the carbon dioxide emissions caused by oxygen supply and electricity supply in seawater ponds and industrial culture [26]. In this paper, the carbon emission coefficient of diesel power is determined according to the China Energy Statistics Yearbook 2005, etc., and the conversion coefficient of diesel consumption of fishing boats is determined according to the calculation of oil consumption subsidy of domestic motorized fishing boats. Reference Xu H. et al. [34] was used to determine the conversion coefficient of pond and factory culture power consumption. The correlation coefficient of carbon emission of seaweed culture based on the material assessment method is shown in Table 3 and Table 4. The calculation formula is as follows:
Table 3.
Table of carbon emission coefficients for mariculture.
Table 4.
Table of transformation coefficients of mariculture consumption.
4. Results
4.1. Calculation Results and Analysis of Green Development Efficiency of Seaweed Farming in China
4.1.1. From the National Point of View
Using the MaxDEA8.0 software platform, based on (1), the super-SBM data envelopment analysis model containing undesired output indicators is used for calculation. The green development efficiency of seaweed farming in China from 2008 to 2020 is shown in Figure 1.
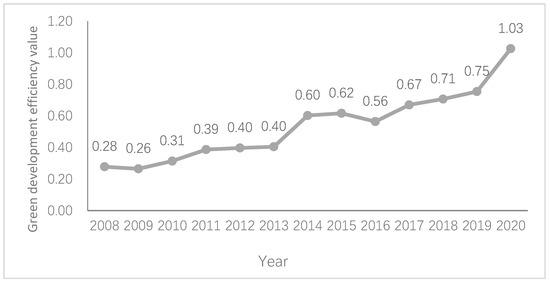
Figure 1.
Time distribution of green development efficiency of seaweed farming in China, 2008–2020.
It can be seen from Figure 1: (1) The average green development efficiency of seaweed aquaculture in China from 2008 to 2020 was 0.54, and its green development efficiency was generally at a medium level, indicating that there was an efficiency loss in seaweed farming. The input–output structure of seaweed farming was relatively not optimized, and it was still in a relatively uncoordinated state in grasping the balance between reducing non-expected output (reducing carbon emissions) and increasing expected output (increasing output value and carbon sequestration). (2) The green development efficiency value of seaweed aquaculture in China from 2008 to 2020 is constantly fluctuating, indicating that the input–output structure of seaweed aquaculture is not always single and unchanged. The development of marine aquaculture industry in 2008–2015 was more focused on improving economic benefits, and the focus has shifted to the increase of ecological benefits from 2016 to 2020. (3) From 2008 to 2020, the overall green efficiency of seaweed culture in China showed an upward trend, and the efficiency value in 2020 was four times that of the lowest efficiency value in 2009, which indicated that the input–output structure of seaweed culture in China had been greatly optimized, and the ecology and economy of the seaweed culture industry gradually tended to coordinate. The overall improvement of green efficiency of seaweed culture is mainly due to the fact that China’s mariculture industry tends to be economically and ecologically beneficial. The common country’s governance of mariculture is constantly increasing. In recent years, it has strongly supported the green transformation of the mariculture industry. In 2016, the national “Thirteenth Five-Year Plan” for ecological protection spread the concept of marine ecological protection. In 2017, the national marine economy “Thirteenth Five-Year Plan” clearly requires the improvement of marine industry planning. In 2019, the Ministry of Agriculture and Rural Affairs issued a national marine pasture demonstration zone construction plan (2017–2025). For the first time, it is required to transform marine fisheries and jointly focus on promoting marine economy and ecological civilization. The synergy between economic benefits and ecological benefits of the mariculture industry is the future trend.
4.1.2. From a Regional Point of View
The green development efficiency of seaweed farming in China was analyzed from the provincial level, and the results of green development efficiency of seaweed farming in seven coastal provinces in China from 2008 to 2020 are shown in Table 5 and Figure 2.
Table 5.
The average efficiency of green development of seaweed farming in 7 provinces in China from 2008 to 2020.
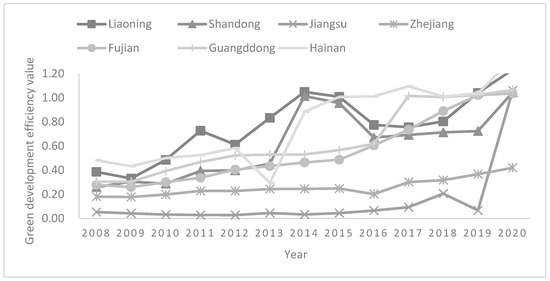
Figure 2.
Time distribution of green development efficiency of seaweed farming in seven coastal provinces in China from 2008 to 2020.
- (1)
- The average green development efficiency of seaweed aquaculture in Hainan Province and Liaoning Province is between 0.7 and 0.8, and the input–output structure is in a relatively coordinated state, which can better grasp the balance between expected output and non-expected output and control carbon emissions while improving economic output value and carbon sequestration. Among them, the green development efficiency of seaweed farming in Hainan Province maintained a small growth rate of medium level from 2008 to 2012, a sudden decrease in 2013, and a high efficiency value in 2014, and a small fluctuation of a high level from 2015 to 2020. The green development efficiency value of seaweed farming in Liaoning Province continued to increase in 2008–2014, began to decrease in 2014–2018 and began to recover from 2018 to 2020.
- (2)
- The average green development efficiency of seaweed aquaculture in Guangdong, Shandong and Fujian Provinces was between 0.5 and 0.7, and the input–output structure of seaweed aquaculture was relatively not optimized enough, and the balance between expected output and non-expected output could not be well controlled. From 2008 to 2020, the green development efficiency of seaweed in Guangdong Province and Fujian Province maintained a stable growth trend, and the average efficiency value of Fujian Province was slightly lower than that of Guangdong Province. The efficiency value of seaweed green development in Shandong Province increased significantly in 2014 and 2015, and the efficiency time distribution in other years was similar to that in Fujian Province. On the whole, although the average green development efficiency of the three provinces is at the lower middle level, they all maintain an upward trend, and the green development efficiency value has increased greatly from 2008 to 2020.
- (3)
- The average green development efficiency of seaweed aquaculture in Zhejiang Province and Jiangsu Province was between 0.1 and 0.3, indicating that the overall level of green development of the seaweed aquaculture industry was very low. The input–output structure of seaweed aquaculture was very unreasonable, and excessive attention was paid to the economic benefits of seaweed farming in the process of seaweed farming. From 2008 to 2020, the green development efficiency values of seaweed farming in Zhejiang Province and Jiangsu Province remained slightly fluctuating at a low level, and the average efficiency value of Zhejiang Province was slightly higher than that of Jiangsu Province, but on the whole, the efficiency time distribution of the two provinces still showed a weak upward trend, and the green development efficiency value of seaweed in Jiangsu Province increased greatly in 2020.
4.2. Analysis of the Causes of Loss of Efficiency in Green Development of Seaweed Farming
The input redundancy rate is the relaxation variable divided by the input amount x, and the output redundancy rate is the relaxation variable and divided by the corresponding output amount . The input–output redundancy rate of seaweed aquaculture can reflect the specific influence of each input–output factor and the degree of impact when there is efficiency loss in green development efficiency. Additionally, it can quantitatively analyze the rationality of the input–output structure of seaweed farming in China and the balance between expected output and non-expected output. The average redundancy rate of input–output factors and the net carbon sinks of seaweed farming in seven provinces in China from 2008 to 2020 are shown in Table 6 and Table 7.
Table 6.
Average redundancy rate of input–output indicators of green development efficiency of seaweed farming in China in 2008–2020 (%).
Table 7.
Net carbon sink of seaweed farming in seven provinces of China from 2008 to 2020 (103 tons).
- (1)
- From a national point of view
The temporal distribution of net carbon sinks in seaweed farming in China continued to increase from 2008 to a relatively high level in 2014 and then began to decline, fluctuating until 2017 and increasing until 2019, with fluctuations similar to green development efficiency values. From the perspective of the input–output redundancy rate of seaweed development in China, the main factors causing the loss of green development efficiency of seaweed aquaculture in China from 2008 to 2020 are, in order, excessive input factors such as training intensity, number of fishing vessels, breeding labor and area, and redundancy of carbon emission output factors. The economic output value output factors basically reach the target value, and the carbon aggregate output factors are only insufficient in individual regions. The “Thirteenth Five-Year Plan” ecological environmental protection plan released in 2015 promoted the focus of China’s mariculture development from rapid economic expansion to ecological environmental protection. China’s synchronous coupling development stage of marine aquaculture ecological benefits and economic efficiency has transitioned from the growth period to the transition period; that is, the economic development of China’s mariculture industry has maintained a certain level, and the market has begun to pay attention to ecological environmental protection, but the effect of relying solely on policies to improve environmental externalities is short-lived. The transformation of production mode also lags behind the growth of economic benefits, so the ecological and economic benefits of seaweed farming in China after 2016 have shown a downward trend.
- (2)
- From the regional point of view
(1) The average net carbon sink of seaweed aquaculture in Liaoning and Shandong provinces in the Huangbohai Sea area was the highest among the three sea areas, and the average green development efficiency was the second. In 2020, the aquaculture area accounted for 26% of the total area of the total sea area, the output accounted for 44% of the total output of the total sea area, the output value accounted for 11% of the total output value of the whole sea area, and the carbon sequestration accounted for 44% of the carbon sequestration in the whole sea area. The main factors contributing to the loss of green development efficiency in the Huangbohai Sea are training intensity, number of fishing vessels, aquaculture area, carbon emissions and aquaculture labor. Shandong Province is one of the high carbon sequestration and high emission provinces, the net carbon sink that can be contributed annually is relatively high among the seven provinces, the average green development efficiency is at a medium level, and its seaweed aquaculture industry structure has been relatively stable since 2008. The main aquaculture species are kelp (83%), wakame (8%), Jiangbei (7%), and its efficiency loss is mainly concentrated in input factors and high redundancy of carbon emissions. Liaoning Province is one of the high carbon sequestration and low emission provinces, the net carbon sink that can be contributed annually is relatively high among the seven provinces, and the average green development efficiency is high. Since 2008, seaweed culture varieties are kelp (62%) and wakame (38%), the output value per unit area is low, and the loss of seawater shellfish culture efficiency is mainly due to the redundancy of input factors and carbon emissions. The seaweed culture varieties in the Huangbohai Sea area are relatively stable, with the characteristics of northern seaweed culture varieties, and the high proportion of kelp and wakame culture makes its expected output carbon sequestration the highest among the three seas. The yield per unit area is high, but the output value per unit area is low, and the ecological and economic benefits are in a relatively high level of equilibrium.
(2) The average net carbon sink value of seaweed aquaculture in Jiangsu, Zhejiang and Fujian provinces in the East China Sea ranks second among the three sea areas, and the green development efficiency value is the last three of the seven provinces. In 2020, the aquaculture area accounted for 73% of the total area of the whole sea area, the output accounted for 54% of the total output of the total sea area, and the output value accounted for 87% of the total output value of the total sea area. Similar to Shandong Province, Fujian Province is also a province with high carbon sequestration and high emissions. The net carbon sink that can be contributed annually is the highest among the seven provinces, the average green development efficiency is low, the seaweed aquaculture industry structure has changed little since 2008, there is large-scale planting of kelp (70%), seaweed (23%) and Jiangbei (6%), and the main factors for the loss of green development efficiency are the high redundancy of input factors and excessive carbon emissions. The average net carbon sink of seaweed farming in Zhejiang Province is negative, the average green development efficiency is low, the industrial structure of seaweed aquaculture has its unique location, ecology and diversity characteristics, and the aquaculture species are kelp (65%), seaweed (18%) and sheep (17%), and excluding input factors, the main reason for the loss of green development efficiency is the high redundancy of carbon emissions. Jiangsu Province is the only province with low carbon sequestration and high emissions, the net carbon sink and green development efficiency of seaweed farming are the lowest among the seven provinces, and its seaweed aquaculture industry structure is single. Since 2008, only large-scale seaweed has been cultivated, the area has increased by 2.1 times and the output has increased by 1.9 times. The main factors causing the loss of green development efficiency in the seven provinces are only found in provinces with a high rate of expected output of seaweed farming. Seaweed cultivation in the East China Sea has the largest scale and the highest total economic output value, but the high number of cultivated economic seaweed varieties leads to excessive carbon emissions, low output per unit area, that is, unreasonable input area, and relatively uncoordinated ecological and economic benefits.
(3) The average net carbon sink of seawater shellfish culture in Guangdong and Hainan provinces in the South China Sea is the lowest among the three sea areas, and the average green development efficiency is the highest. In 2020, the aquaculture area accounted for 1.78% of the total sea area, the output accounted for 2.77% of the total output of the whole sea area, the output value accounted for 2.67% of the total output value of the whole sea area, and the output of pond mariculture accounted for 38% of the total output in the South China Sea. The main factors contributing to the loss of green development efficiency in the South China Sea are, in order, training intensity, aquaculture labor, number of fishing vessels, aquaculture area and carbon emissions. Similar to Zhejiang Province, the carbon sequestration and carbon emissions of Guangdong Province and Hainan Province are relatively close, the net carbon sink contribution of seaweed farming is relatively low, but the green development efficiency value is relatively high, the seaweed culture species in the South China Sea are mainly Jiangqi and Kirin vegetables, among which the seaweed aquaculture industry structure in Guangdong Province is relatively stable, small-scale cultivation of Jiangqi (71%) and seaweed (23%), and the main reason for the loss of green development efficiency is the excessive input factors and carbon emissions. The seaweed aquaculture industry structure in Hainan Province changed from mainly cultivated Jiangbei varieties to cultured Kirin vegetables, and the cultured varieties in 2020 were Kirin (83%) and Jiang Bei (17%), and the main factors for efficiency loss were the high redundancy of input factors such as training intensity and breeding labor. The seaweed aquaculture industry in the South China Sea started late and developed slowly, and the scale and technical development level of seaweed cultivation were low, but the output value per unit area was in a high position, and the ecological and economic benefits were in a relatively high equilibrium state.
5. Conclusions and Suggestions
5.1. Conclusions
Using the super-SBM model to measure the green efficiency of seaweed cultivation based on the bio-assessment method, we conducted an empirical study on the influencing factors of marine carbon sequestration fishery green efficiency in seven seaweed cultivation provinces in China from 2011 to 2020. This study provides a feasible reference for China to lay the foundation for realizing the dual-carbon goal and promote the global low-carbon economy. The main conclusions of this paper are as follows:
- (1)
- From 2008 to 2020, the time distribution of net carbon sinks and green efficiency of seaweed culture in China is similar, and the overall level shows an increasing trend: both of them increase slightly from 2008 to peak in 2014 and then begin to decline, but after 2016, the efficiency value shows an obvious upper-body trend. The net carbon sinks fluctuate greatly between 40 and 81 tons, and the green efficiency fluctuates between 0.26 and 1.03. The main factors causing efficiency loss are capital investment (number of fishing boats, breeding labor and breeding area), technical input (training intensity of fishermen) and ecological pollution (carbon emission). In the expected output factors, the total carbon sinks have little influence on the efficiency value, and the total output value has no influence on the efficiency value. Lack of optimization of seaweed culture structure, lack of innovation of seaweed culture technology and an imperfect carbon sink trading system are still the main reasons that restrict the green transformation of mariculture industry in China.
- (2)
- Influenced by index factors and non-index factors, such as marine resources, economy and planning, the level of algae culture and green efficiency in the three major sea areas in China is different: from 2008 to 2020, the order of algae culture green efficiency in the three major sea areas in China is South China Sea > Yellow Sea and Bohai Sea > East China Sea > South China Sea. The main reasons for the loss of green efficiency in the Yellow Sea and Bohai Sea are capital investment (number of fishing boats, breeding area and breeding labor), technical investment (training intensity of fishermen) and ecological pollution (carbon emission), and redundant seaweed breeding ecological benefits and economic benefits are in a relatively coordinated state. The main reasons for the loss of green efficiency in the East China Sea are excessive capital investment (number of fishing boats, breeding labor and breeding area), technical investment (training intensity of fishermen), ecological pollution (carbon emission) and insufficient total carbon sinks. The ecological benefits and economic benefits of seaweed culture are in an uncoordinated state. The main reasons for the loss of green efficiency in the South China Sea are excessive capital investment (the number of aquaculture labor, the number of fishing boats and the area of aquaculture), excessive technical investment (the intensity of fishermen’s training) and redundant ecological pollution (carbon emissions). The ecological benefits and economic benefits of seaweed culture are relatively coordinated.
- (3)
- Influencing factors of green efficiency of seaweed culture are different in each study area: the net carbon sink and green efficiency of seawater shellfish culture in seven provinces of China are quite different. According to the average value of net carbon sink, Fujian, Shandong, Liaoning, Guangdong and Hainan are positive, and the average value of Zhejiang and Jiangsu is negative. According to the green efficiency, Hainan, Liaoning, Guangdong, Shandong, Fujian, Zhejiang and Jiangsu, and in turn Shandong and Fujian, are provinces with high carbon sequestration and high emission, which can contribute to higher net carbon sinks. Fujian Province has a higher output value per unit area, and the ecological and economic benefits of seaweed culture are in a general equilibrium state. Liaoning is a province with high carbon sequestration and low emission, which can contribute higher net carbon sink and higher yield per unit area. The ecological and economic benefits of seaweed culture are in a relatively coordinated state. Jiangsu Province is a province with low carbon sequestration and high emission, and the ecological and economic benefits of seaweed culture are extremely uncoordinated. Guangdong, Hainan and Zhejiang are provinces with similar carbon sequestration and carbon emission, both of which have high output value per unit area and low net carbon sink contribution, but the ecological and economic benefits of seaweed culture in Guangdong and Hainan are in a relatively coordinated state, and the coordination between ecological and economic benefits in Zhejiang Province is the lowest.
- (4)
- The empirical results show that the improvement of green efficiency can promote the greening of the seaweed culture industry in China. The research and popularization of seaweed culture structure, culture technology and regulatory policies are the key factors affecting the green efficiency of seaweed culture. The input–output scale effect plays a decisive role in the green efficiency of seaweed development. The effect of structure and technological progress are effective on a certain scale, whereas the incentive effect and organization management effect are obviously insufficient.
5.2. Suggestions
Based on the above research conclusions, under the dual-carbon goal, the focus of the marine carbon sink fishery should take into account the finding that high levels of protection, economic benefits and ecological benefits go hand in hand. In order to further promote the global low-carbon economy and protect the regional ocean, accelerate the green transformation of mariculture and provide a high efficiency marine carbon sink fishery for the world, China puts forward the following countermeasures and suggestions.
5.2.1. Optimizing Seaweed Culture Structure and Constructing Fishery Carbon Sink Ecology
Seaweed culture may bring about a series of problems, such as halogenated hydrocarbons, ozone layer, excessive density of seaweed, invasion of alien species, attachment of seaweed to prototype equipment, maintenance cost, capture of microplastics in the ocean by seaweed and spread through food chain, etc. In the face of pollution such as excessive nitrogen and phosphorus in coastal marine ecology, heavy metal pollution, etc., seawater shellfish polyculture can effectively improve polluted seawater and promote the integration of the marine fishery and carbon sink industry and the balance of ecological and economic benefits of seawater shellfish culture. The expansion of overload culture scale is one of the main reasons for the loss of green efficiency of seaweed culture in various provinces. Guangdong, Shandong, Liaoning and other provinces in the primary stage of seaweed culture should scientifically control the density of algae culture and realize the large-scale production of the seaweed culture industry; thereby decreasing the possibility of seawater eutrophication and harmful algae appearance while high temperature and disease-resistant algae improve aquaculture yield. Optimizing the structure of seaweed culture, three-dimensional culture can effectively promote the formation of fishery carbon sink ecology with nitrogen and phosphorus pollution and carbon emission ecological pollution, and at the same time stimulate the carbon sink potential of seaweed to promote the marine carbon sink fishery. In addition to offshore mariculture, promoting the construction of modern marine pastures, high-scale ecological and intelligent aquaculture management can make full use of marine space resources. Mariculture fishing boats can improve the economic benefits such as mariculture output and products while restoring marine ecology, so that the marine carbon sink fishery can truly become the “blue granary” of mankind.
5.2.2. Innovating Seaweed Culture Technology to Promote High Industry
Low investment in technical training is one of the important reasons for the loss of green efficiency of marine shellfish culture in various provinces. For Shandong, Zhejiang, Jiangsu and other provinces with highly redundant technical investment and Guangdong and Hainan provinces with low levels of aquaculture technology, training should be carried out according to the technical needs of different aquaculture subjects, technical training should be improved, scientific research on aquaculture technology and investment in technical invention funds should be increased, industrial scientific and technological innovation ability should be improved, and the mariculture industry should be promoted. For example, seaweed culture can be used as an emission capture and utilization technology to set up a “seaweed climate fund” to achieve positive marine impact, learn the technology of planting seaweed in the desert from foreign enterprises and realize the economy and benefit of seaweed culture.
5.2.3. Improve Carbon Sink Trading Policy and Promote the Operation of the Carbon Trading Market
The carbon sink trading market can maximize the economic value of carbon sinks, improve the ecological benefits of seaweed carbon sinks, establish a marine fishery carbon sink trading platform, improve the carbon sink trading policy and build a national blue carbon trading system, which can promote the synchronous coupling growth of ecological benefits and economic benefits of seawater shellfish culture in China Fujian, Shandong and other provinces that can promote the construction system of marine fishery carbon sinks in view of the higher net carbon sinks in seawater shellfish and algae culture. The implementation of a number of projects can promote the scientific research achievements of marine fishery carbon sink construction and gradually realize the ecological value of marine carbon sinks.
5.2.4. Strengthen the Training of Carbon Sink Talents and Improve the Construction of the Discipline System
As a major national strategic demand, marine carbon sequestration research needs the integration of different disciplines. Carbon sequestration fishery, as a new industry, urgently needs a large number of relevant talents in the exploration of carbon sequestration, such as mariculture products, carbon sequestration, low-carbon emission reduction technology and equipment, marine pastures, etc. Colleges and universities, especially Ocean University which aims at the construction of first-class talents in first-class disciplines, should be duty-bound to undertake the obligation of training industrial and social talents through the input of ecological education concepts, the adaptation of talents training objectives, the gradual improvement of education curriculum design, the combination of theoretical and practical links, and so on, and accelerate the training of compound talents in carbon sequestration management and trading. As a result, the new agricultural and new engineering discipline system can better cultivate qualified talents welcomed by the social industry to promote the benign feasibility of the carbon sink fishery and carbon sink trading.
Author Contributions
Resources, data curation, writing—review and editing, supervision, funding acquisition, J.L.; methodology, software, validation, formal analysis, writing—original draft preparation, visualization, Y.W. All authors have read and agreed to the published version of the manuscript.
Funding
This research was funded by the National Natural Science Foundation of China Youth Program of China, grant number 72103134, and the Ministry of Education Humanities and Social Sciences Youth Program of China, grant number 21YJC790139.
Institutional Review Board Statement
The study was conducted according to the guidelines of the Declaration of Helsinki.
Informed Consent Statement
Informed consent was obtained from all subjects involved in the study.
Data Availability Statement
The data used to support the findings of this study are included in the article.
Conflicts of Interest
The authors declare no conflict of interest.
References
- Jiao, N.Z. Research and development of marine “negative emissions” technology to support the national demand for “carbon neutrality”. Bull. Chin. Acad. Sci. 2021, 36, 179–187. [Google Scholar]
- Zhang, Y.; Zhao, M.X. Carbon sink process, regulatory mechanism and sink enhancement model of offshore ecosystems. Sci. China Earth Sci. 2017, 47, 4. [Google Scholar]
- Tang, Q.S. Carbon sink of fishery and developing modern fishery fast and well. Jiangxi Aquat. Sci. Technol. 2011, 2011, 5–7. [Google Scholar]
- Dai, G.Q.; Liu, Y.D. Analysis of the contribution of algae in helping to achieve the goal of “dual carbon”. China Fish. 2022, 2, 68–70. [Google Scholar]
- Fisheries and Fisheries Administration Bureau of the Ministry of Agriculture and Rural Affairs; National Fisheries Technology Extension Station, Chinese Fisheries Society. China Fishery Yearbook; China Agriculture Press: Beijing, China, 2021. [Google Scholar]
- UNEP; FAO; IOC/UNESCO. Blue Carbon: The Role of Healthy Oceans in Binding Carbon [EB/OL]. Available online: https://www.grida.no/publications/145 (accessed on 22 May 2022).
- Wang, X.J.; Zhang, H.B.; Han, G.X. Carbon cycle and blue carbon potential in China’s coastal zone and offshore. Proc. Chin. Acad. Sci. 2016, 31, 1218–1225. [Google Scholar]
- Qiu, G.L.; Lin, X.Z.; Li, Z.S.; Fan, H.Q.; Zhou, H.L.; Liu, G.H. Carbon sequestration mechanism and contribution of seaweed ecosystem. J. Appl. Ecol. 2014, 25, 1825–1832. [Google Scholar]
- Gao, K.S.; McKinley, K.R. Use of macroalgae for marine biomass production and CO2 remediation: A review. J. Appl. Phycol. 1994, 6, 45–60. [Google Scholar] [CrossRef]
- Orr, J.C.; Sarmiento, J.L. Potential of marine macroalgae as a sink for CO2: Constraints from a 3-D general circulation model of the global ocean. Water Air Soil Pollut. 1992, 64, 405–421. [Google Scholar] [CrossRef]
- Johnston, A.M.; Maberly, S.; Raven, J.A. The acquisition of inorganic carbon by four red macroalgae from different habitats. Oecologia 1992, 92, 317–326. [Google Scholar] [CrossRef]
- Duarte, C.M.; Middelburg, J.J.; Caraco, N. Major role of marine vegetation on the oceanic carbon cycle. Biogeosciences 2005, 2, 1–8. [Google Scholar] [CrossRef]
- Beer, S.; Israel, A. Photosynthesis of Ulva fasciata. IV. pH, carbonic anhydrase and inorganic carbon conversions in the unstirred layer. Plant Cell Environ. 1990, 1990, 555–560. [Google Scholar] [CrossRef]
- Hu, A.G.; Zhou, S.J. Green: Function Definition Mechanism and Strategy. China Popul. Resour. 2014, 2014, 14–20. [Google Scholar]
- Li, J.; Li, M.D.; Gong, P.H.; Guang, C.S. Research progress on carbon sink of marine pasture fishery. Adv. Fish. Sci. 2022, 43, 142–150. [Google Scholar]
- Cao, Y.M.; Wu, Q. Research on the mechanism of China’s marine carbon sink trading under the goal of “double carbon”. China Manag. 2022, 14, 44–51. [Google Scholar]
- Salvanes, A.G.V. Ocean Ranching. In Encyclopedia of Ocean Sciences; Elsevier Pte Ltd.: Singapore, 2016; pp. 146–155. [Google Scholar]
- Seaman, W.; Lindberg, W.J. Artificial Reefs. In Encyclopedia of Ocean Sciences; Elsevier Pte Ltd.: Singapore, 2016; pp. 226–233. [Google Scholar]
- Vassdal, T.; Holst, H.M.S. Technical Progress and Regress in Norwegian Salmon Farming: A Malmquist Index Approach. Mar. Resour. Econom. 2011, 26, 329–341. [Google Scholar] [CrossRef]
- Ji, J.; Wang, P. Research on China’s Aquaculture Efficiency Evaluation and Influencing Factors with Undesirable Outputs. J. Ocean Univ. China 2015, 14, 569–574. [Google Scholar] [CrossRef]
- Wang, P.; Ji, J. Research on China’s Mariculture Efficiency Evaluation and Influencing Factors with Undesirable Outputs—An Empirical Analysis of China’s Ten Coastal Regions. Aquac. Int. 2017, 25, 1521–1530. [Google Scholar] [CrossRef]
- Martinezcordero, F.J.; Leung, P. Sustainable Aquaculture and Producer Performance: Measurement of Environmentally Adjusted Productivity and Efficiency of a Sample of Shrimp Farms in Mexico. Aquaculture 2004, 241, 249–268. [Google Scholar] [CrossRef]
- Qian, Z.M.; Liu, X.C. Research on Regional Differences and Convergence of Green Economic Efficiency in China. J. Xiamen Univ. (Philos. Soc. Sci. Ed.) 2014, 1, 110–118. [Google Scholar]
- Ji, J.Y.; Zeng, Q. Temporal and spatial evolution analysis of green technology efficiency in China’s marine aquaculture industry based on global DEA. China Manag. Sci. 2016, 24, S1. [Google Scholar]
- Qin, H.; Zhang, Y.; Lu, Y.Y. Measurement of eco-economic efficiency of marine aquaculture in China based on SBM model. Agrotech. Econ. 2018, 9, 2018. [Google Scholar]
- Xu, J.J.; Qin, T.T. An empirical analysis of marine aquaculture production efficiency in Guangdong Province based on Malmquist index. Mar. Dev. Manag. 2018, 35, 98–103. [Google Scholar]
- Shao, G.L.; Kong, H.Z.; Li, C. Net carbon sink of marine aquaculture in China and its coupling relationship with economy. Resour. Sci. 2019, 2, 2019. [Google Scholar]
- Zhang, X.X.; Zheng, S.; Yu, L.H. Green efficiency measurement of marine carbon sink fisheries in China and its spatial spillover effects. China R. Econ. 2020, 10, 2020. [Google Scholar]
- Ban, L.; Yuan, X.L. Differences in green economic efficiency and spatial impact mechanism in eight major regions of China. J. Xi’an Jiaotong Univ. 2016, 36, 22–30. [Google Scholar]
- Sun, K.; Cui, Q.Q.; Su, Z.X. Temporal and spatial evolution and influencing factors of economic value of carbon sinks in mariculture in China. Geogr. Res. 2020, 39, 2508–2520. [Google Scholar]
- Xu, J.J.; Zhang, J.; She, C.H. Evaluation of green economy spillover effect of marine carbon sink fishery. China Popul. Resour. 2020, 30, 136–145. [Google Scholar]
- Yang, L.; Hao, X.Y.; Shen, C.L.; An, D. Assessment of carbon sink capacity and potential of China’s marine fisheries under the goal of carbon neutrality. Resour. Sci. 2022, 44, 716–729. [Google Scholar]
- Zhao, G.D. Measuring China’s Regional Green Efficiency-Also on the New Path of Green Efficiency Evaluation. J. Tangshan Univ. 2017, 4, 100–108. [Google Scholar]
- Xu, C.L. Industrial green level and influencing factors in underdeveloped areas-A case study of Linyi City, Shandong Province. Econ. Forum 2017, 8, 45–50. [Google Scholar]
- Xu, H.; Liu, H.; Zhang, J.H.; Ni, Q.; Shen, J.; Jiang, L. Estimation of fishery energy consumption in China. China Fisher. 2007, 11, 74–76. [Google Scholar]
- Elizabeth, S.; Rosenzweig, F.; Xu, B.; Cuellar, K.L.; Martinez-Sanchez, A.; Schaffer, M.; Strauss, M.; Cartwright, H.N.; Ronceray, P.; Plitzko, J.M.; et al. The Eukaryotic CO2-Concentrating Organelle is Liquid-like and Exhibits Dynamic Reorganization. Cell 2017, 171, 148–162. [Google Scholar]
- William, P.; Hobbie, F. The microbial loop: In a sea of microbes. Oceanography 2007, 20, 28–33. [Google Scholar]
- Ren, L.H.; Zhang, J.H.; Niu, Y.L.; Zhang, Y.T.; Li, J.Q.; Zhang, M.L. Stable isotope evidence for the sediment impacts on bio deposits from long-line cultured Crassostrea gigas in Sango Bay. Mar. Sci. 2015, 39, 79–85. [Google Scholar]
- Yue, D.D.; Wang, L.M. Marine shellfish culture in Yangtze River Delta based on direct carbon sink accounting. Shandong Agric. Sci. 2012, 44, 133–136. [Google Scholar]
- Guo, B. Study on Assessment of Carbon sequestration potential of marine shellfish culture in China. Mod. Agric. Sci. Technol. 2015, 19, 226–228. [Google Scholar]
- Zhou, Y.; Yang, H.S.; Liu, S.L.; He, Y.C. Chemical composition and net organic production of cultivated and fouling organisms in Forty Mile Bay and their ecological effects. J. Fish. China 2002, 26, 21–27. [Google Scholar]
- Ji, J.Y.; Wang, P.P. Research on China’s mariculture carbon sink capacity and influencing factors. Mar. Environ. Sci. 2015, 34, 871–878. [Google Scholar]


Disclaimer/Publisher’s Note: The statements, opinions and data contained in all publications are solely those of the individual author(s) and contributor(s) and not of MDPI and/or the editor(s). MDPI and/or the editor(s) disclaim responsibility for any injury to people or property resulting from any ideas, methods, instructions or products referred to in the content. |
© 2023 by the authors. Licensee MDPI, Basel, Switzerland. This article is an open access article distributed under the terms and conditions of the Creative Commons Attribution (CC BY) license (https://creativecommons.org/licenses/by/4.0/).