Abstract
Accelerating the “double carbon” transformation of the manufacturing industry is the key to achieving the strategic goal of “double carbon” in China, among which the low-carbon development of the Beijing manufacturing industry is the top priority. To achieve high-quality development of the manufacturing industry in Beijing, the main task is to reduce carbon emissions and improve efficiency. Therefore, on the basis of the Global Malmquist–Luenberger (GML) index and the system dynamics (SD) method, this study analyzes the green total-factor energy efficiency trends of 25 manufacturing sub-sectors in Beijing from 2006 to 2020 and incorporates the GML index as a key variable into the construction of the SD model. It then explores the path optimization of Beijing’s manufacturing low-carbon development in the 14th Five-Year Plan period via scenario simulation and offers policy recommendations for the green-oriented transition of Beijing’s manufacturing industry. The study finds that Beijing’s manufacturing industry needs to prioritize energy structure optimization and efficient energy utilization and give full play to the city’s advantages in technological innovation and investment while supporting high-end scientific research and innovation projects to confirm the capital city’s strategic position.
1. Introduction
China’s green development has reached a new plateau since the “double carbon” objective was formally introduced in 2020, and it became one of the keynotes of China’s socioeconomic development over the next few decades. During the 14th Five-Year Plan period, carbon reduction is the primary strategic objective for China’s ecological civilization construction. Since manufacturing is both the backbone of China’s economic growth and the country’s primary source of CO2 emissions, the green-oriented transition of the manufacturing industry has become a key element to achieve the goal of “carbon neutrality” and promote high-quality economic development. The report of the 20th CPC National Congress, held in December 2022, reiterated previous statements that the real economy should be prioritized in the process of economic development and that the manufacturing should be promoted to develop a more sophisticated, intelligent, and environmentally friendly future.
As the capital of China, Beijing needs to promote the green-oriented transition of its manufacturing industry by relying on its location advantage and technological innovation capability. In the 14th Five-Year Plan period, the main task of Beijing’s manufacturing industry to achieve a green and low-carbon transition is to improve energy efficiency and reduce carbon emissions. Therefore, it is important to explore the low-carbon transition path suitable for Beijing’s manufacturing industry from the perspective of green total-factor energy efficiency.
Against the above background, this study analyzes the changes in Beijing manufacturing green total-factor energy efficiency on the basis of the manufacturing low-carbon transition plan of the 14th Five-Year Plan and the long-range objectives of carbon neutrality. It builds the Beijing manufacturing low-carbon development SD model by elucidating the system’s feedback mechanism and the influence between factors, then conducts a study on the green-oriented transition path of Beijing’s manufacturing industry. This research has theoretical value and practical significance for the government to formulate low-carbon policies for the manufacturing industry and to promote the implementation of Beijing’s requirements on carbon peak, carbon neutrality, pollution prevention, and green manufacturing.
Currently, the measurement of energy efficiency is based mainly on the total-factor productivity (TFP). In 1978, Charnes et al. proposed the data envelopment analysis (DEA) model to quantify total-factor productivity (TFP) by gauging the relative productivity of decision-making units (DMU) [1]. Then, Tone improved DEA by proposing a slack-based measure (SBM) approach based on slack variables [2]. To analyze the variation of TFP, Caves et al. constructed the Malmquist productivity index by the ratio of distance functions [3]. Hu and Wang used the total-factor analysis framework to study energy efficiency and initiatively applied DEA to conduct energy efficiency in China [4]. Since then, scholars have widely applied the improved models of DEA and the Malmquist index to measure total-factor energy efficiency and its change in various areas and industries of China [5,6,7,8,9].
Two primary concepts guide studies of the relationship between energy efficiency and economic growth. First, the analysis is carried out from the perspective of the transformation of development dynamics. Newell et al. [10], Li Lianshui and Zhou Yong [11], Shi Dan et al. [12], and Zheng Lilin et al. [13] found that improving energy efficiency is conducive to reducing energy factor inputs and increasing the contribution of technological innovation to economic output, which is beneficial for the transformation and upgrading of development dynamics. On the other side, some scholars explore the relationship from the perspective of industrial structure. Due to differences in productivity levels and growth rates among industries, energy factors will be transferred from low-productivity sectors to high-productivity sectors, according to research by Maddison [14] and Zhang Weishi [15], which will cause a shift in industrial structure toward a low-input, high-efficiency, innovation-driven model.
The system dynamics (SD) approach is widely used in the study of low-carbon economic development paths [16,17,18,19,20,21,22]. Li Jian et al. considered three scenarios to explore the green growth path of the Beijing–Tianjin–Hebei industrial zone [23]. To simulate the sustainable development level of cities in the Beijing–Tianjin–Hebei region from 2005 to 2035, Yang Zhenshan et al. developed a comprehensive urban sustainability index system based on the SD model [24]. Zhang Junrong et al. investigated the inner operation mechanism of the carbon emissions trading system and its impact on the economy and environment by sorting out the correlation mechanism among carbon trading, CO2 emissions, and GDP [25]. To forecast the trend of resource supply and demand, Li Guijun et al. built a water–energy–grain sustainable development SD model for Beijing [26].
Based on the previous studies, there are the following research limitations. First, current DEA-related models pay insufficient attention to their impact on the transformation of economic development mode. Second, regarding the use of the SD approach for low-carbon development modeling and simulation, most models lack a basis in the selection of the system’s influencing factors, especially the selection of low-carbon technological progress indicators. Third, the selection of factors in the SD model requires data support, while a single DEA approach struggles to describe the impact of energy efficiency on the transition of economic development mode [27,28]. Therefore, it is necessary to integrate DEA and SD to explore the influencing factors and specific paths of low-carbon development [29,30].
Therefore, the possible contributions of this study are as follows: (1) Combining the green total-factor energy efficiency index with the SD model to construct the Beijing manufacturing low-carbon development model and explore the feedback mechanism within the system and (2) Setting up different scenarios and carrying out simulation analysis to explore the green-oriented path of Beijing’s manufacturing industry in the 14th Five-Year Plan period, with the aim of providing ideas for The People’s Government of Beijing Municipality to formulate low-carbon policies.
2. Measurement of Green Total-Factor Energy Efficiency
2.1. Models and Methods
2.1.1. The SuperSBM Model
Tone proposed the slack-based measure of super-efficiency (SuperSBM) based on the slack-based measure (SBM) model [31]. SBM is a non-radial and non-oriented method of efficiency measure that directly uses slack variables to calculate efficiency. This method can avoid the effects caused by differences in radial and angular selection. Moreover, the SuperSBM, which improved upon the SBM and can cause the calculated efficiency value to exceed 1, enables the energy efficiency of SBM-effective DMUs (efficiency value reaches 1 in the SBM model) to be compared with each other. Furthermore, the GML index is based on the distance function of SuperSBM.
Setting the number of decision-making units (DMUs) as , the number of inputs as , the number of desirable outputs as , and the number of undesirable outputs as , the SuperSBM model can be expressed as follows:
2.1.2. The GML Index
The SuperSBM model measures only the relative efficiency among DMUs in a given period. Therefore, this efficiency is not comparable across periods. To further analyze the dynamic changes of green total-factor energy efficiency, this work uses the GML index based on the SuperSBM model to calculate the total-factor productivity of 25 manufacturing sub-sectors in Beijing, which is constructed on the basis of the global benchmark technology and can effectively avoid the infeasibility problem of the linear program. Referring to Oh’s method [32], the GML index is defined by Equation (2):
where the directional distance function is defined on the global technology set , direction vector determines the direction of the outputs, and determines the multiplying power of output change.
If , it means more desirable output and less undesirable output. In contrast, if , it means less desirable output and more undesirable output.
Furthermore, the GML index can be decomposed as Equation (3):
where measures the approaching extent of the present technology frontier from to . means that technological efficiency is improved and has a positive impact on improving total-factor productivity; is the best practice gap change between and and measures the extent of technical progress; and means positive technical change, and it benefits the growth of total-factor productivity.
2.2. Indicator Selection and Data Sources
Total-factor energy efficiency is based on the total-factor productivity theory, which believes that multiple input factors in production are subject to the substitution effect, to a certain degree. This means that energy efficiency is not only determined by an energy input indicator but also by a combination of multiple factors of production. Therefore, when using the SuperSBM model, multiple input and output indicators should be considered comprehensively. Meanwhile, when using the SuperSBM-GML model to calculate the green total-factor energy efficiency, the number of input and output indicators should be smaller than the number of decision-making units (DMUs) to improve the validity of the results. Therefore, considering data availability and indicator selection of past research, three input indicators and two output indicators are chosen in Table 1. The raw data of these indicators are from the Beijing Statistical Yearbook, Beijing Almanac of Science and Technology, and China Energy Statistical Yearbook.

Table 1.
The Input and Output Indicators of SuperSBM-GML Model.
- 1.
- Capital Indicator—Annual Average Balance of Net Fixed Assets.
Capital stock is usually selected as a capital indicator; however, the data resource comes from estimation, not obtained directly. Meanwhile, the based year of capital stock is 1952 or 1978, which brings about the problem of different statistical calibers and leads to distortion of capital stock estimation. In addition, Wu Qi et al. proposed that not all capital stock is used for the energy process, and methods which use capital stock as an input indicator ignore the capital utilization efficiency [33]. Therefore, this paper uses the annual average balance of net fixed assets as the capital indicator. The equation is as follows:
where is the annual average balance of net fixed assets in year, and is the net fixed assets at the end of year .
- 2.
- Labor Indicator—Annual Average Number of Employees.
The annual average number of employees from 2006 to 2020 is used as the labor indicator in this paper.
- 3.
- Energy—Total Energy Consumption.
Total energy consumption includes end-use energy consumption, loss during the process of energy conversion, and energy loss; this indicator is better than the single energy consumption indicator. Therefore, this paper takes total energy consumption as the energy input indicator.
- 4.
- Desirable Output—Industrial Gross Output.
This paper selects the industrial gross output of 25 industrial sub-sectors as the desirable output indicator.
- 5.
- Undesirable Output—CO2 Emissions.
This paper takes the physical volume of manufacturing final energy consumption as the basis to calculate CO2 emissions with reference to Equation (5).
where represents the estimated CO2 emissions (in tons) in year, represents the types of consumed energy used in this paper, represents the consumption of specific energy sources in year, is the average low calorific value, is the carbon emission factor, is the carbon oxidation factor, and 44 and 12 are the relative molecular mass of CO2 and carbon, respectively.
In addition, Table 2 presents the parameters for CO2 emissions estimation. Since electricity is secondary energy, its direct use does not produce CO2 emissions. At the same time, from the Beijing energy balance table (physical volume), heat and electricity are almost never obtained from the production of primary energy in Beijing, so they are not included in the calculation [34]. Finally, raw coal (weighted mean value) [35], coke, crude oil, gasoline, kerosene, diesel, fuel oil, liquefied petroleum gas, and natural gas are selected to estimate CO2 emissions.
Table 2.
The Parameters for CO2 Emission Estimation.
2.3. Empirical Results
In this section, we calculate the green total-factor energy efficiency of 25 manufacturing sub-sectors in Beijing from 2006 to 2020. Table 3 shows the annual average values and cumulative values of the GML index and its decomposed components of energy efficiency growth: EC and TC. The results show that technological progress is the main driver of green total-factor energy efficiency improvement, while technical efficiency hinders the improvement of green total-factor energy efficiency. Compared with the average annual values, the cumulative values are more suitable to reflect the dynamic change level. Meanwhile, energy efficiency is an important factor affecting the energy intensity (Energy consumption per 10k Chinese Yuan (CNY) of industrial added value in this paper is defined as energy intensity, and the unit is 10 kt of standard coal equivalent (SCE)/10k CNY.), which is closely related to the low-carbon development of Beijing’s manufacturing industry [36]. Therefore, the cumulative values of EC and TC will be entered into the SD model in Section 3 as important influencing variables for model construction.
Table 3.
The GML Index and its Decomposition of Manufacturing Sub-sectors.
3. Modeling of Beijing Manufacturing Low-Carbon Development System Based on Green Total-Factor Energy Efficiency
This study innovatively constructs the Beijing Manufacturing Low-Carbon Development System on the basis of the perspective of green total-factor energy efficiency. Firstly, EC and TC, which are calculated by the GML index model, are incorporated as key variables into the system. These two variables allow us to study the impact of energy-saving and low-carbon technologies in terms of both technical efficiency and technical progress, and they can make the setting of the technology factor more well-founded. Secondly, after considering the actual operation of the Beijing Manufacturing Low-Carbon Development System and the input–output indicators for calculation of green total-factor energy efficiency, the complete SD model is constructed for further simulation. Finally, the green low-carbon transition path of Beijing’s manufacturing industry in the 14th Five-Year Plan period can be explored through multi-scenario simulations.
3.1. Boundary and Influencing Factors of the System
To simulate the low-carbon development in Beijing’s manufacturing industry, it is necessary to abstract and simplify the real world. Since there are many sub-sectors in the manufacturing industry, it would be complicated to subdivide it into specific sub-sectors when modeling, so the model is constructed by taking the entire manufacturing industry as the research object. In addition, since the low-carbon development of the manufacturing industry is influenced by policies, fixed asset investment, R&D investment, energy consumption, energy efficiency, and low-carbon technology progress, etc., this paper divides the Beijing manufacturing low-carbon development system into three subsystems: economic development, energy consumption, and carbon emission subsystem, which can facilitate modeling and analysis. The subsystem division is shown in Figure 1.
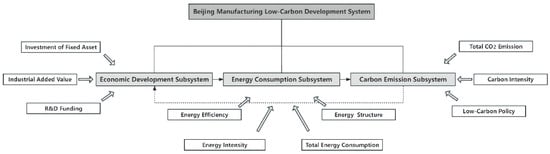
Figure 1.
The Hierarchical Structure of Beijing’s Manufacturing Low-Carbon Development System. The factors located at the beginning of the arrow are components of each subsystem.
The subsystems do not exist in isolation from each other, they are interconnected and influence each other. In particular, the economic development of Beijing’s manufacturing drives the increase of its energy consumption, then the level of energy consumption directly affects CO2 emissions, which, in turn, affects the level of economic development through low-carbon policies [37]. In this paper, the causal loop diagram, the stock-flow diagram, and specific parameters analysis will be used to reveal the operation mechanism of the system.
3.2. Causal Feedback Analysis of the System
By analyzing and refining the relationships among variables within the system, the causal loop diagram can be determined [38,39,40,41]. It is an important method to reveal the loop mechanism, which is then used to construct models. It contains multiple variables, and arrows connect them for marking the causal relationships. Each causal chain has its polarity. A positive causal chain means that if the causal variable changes, the outcome variable to which the arrow points will change in the same direction, while the negative causal chain represents that the outcome variables will change in the opposite direction. The causal loop of the Beijing manufacturing low-carbon development system is shown in Figure 2.
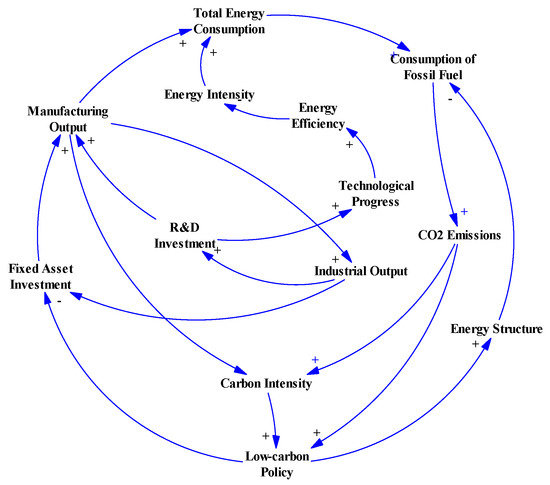
Figure 2.
The Causal Loop Diagram of the System.
3.3. Stock-Flow Relationship Analysis of the System
On the basis of the causal loop diagram, this study further constructs the stock-flow diagram (Figure 3). In this figure, arrows connect different variables and show the functional relationship between them by built-in equations. To focus on the priority questions of this research, the diagram simplifies the real situation, including a total of 38 resulting variables.
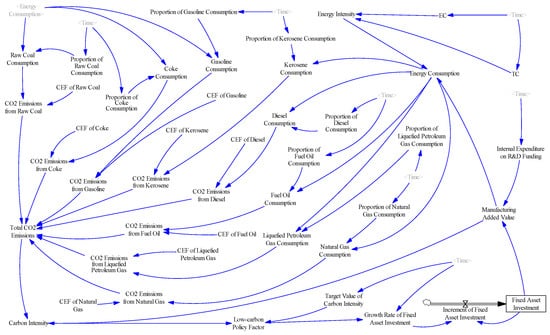
Figure 3.
The Stock-Flow Diagram of the System.
3.4. Parameter Setting of the System
The characteristic equation is introduced to determine the functional relationship among variables; it is the basis of the SD model and its information transfer. In this paper, based on the GML index, the required equations of the system are obtained by considering historical data, related research results, regression analysis results, and lookup functions in the SD model.
Since the variable relationships in the system are complicated, we analyze only four parts in this section: the variables’ initial values and several important characteristic equations of three subsystems.
3.4.1. Initial Value
For simulation, this paper assigns the initial value of the Beijing manufacturing fixed asset investment. In addition, the values of other variables are obtained from the characteristic equations to minimize the influence of subjectivity.
3.4.2. Parameter Setting of Economic Development Subsystem
Industrial added value refers to the new value added in the production process of industrial enterprises. The increase in capital investment can drive the development of the industry and improve revenue, which, in turn, promotes the increase of added value. Meanwhile, R&D investments can increase the technology intensity in products. Therefore, the higher the R&D costs invested in an industry, the higher its technological innovation capacity, and the greater the resulting added value of the industry should be [42]. From the above theoretical analysis, it is clear that the manufacturing industry added value is influenced by fixed asset investment and R&D investment. In addition, in the economic development subsystem, the growth rate of fixed asset investment has been regulated by low carbon policy to form a loop in this system.
- 1.
- The manufacturing industry added value
Manufacturing industry added value (), investment of fixed asset (), and internal expenditure on R&D funding () are selected as variables, and the regression equations are as follows:
where is the constant, and are the coefficients of explanatory variables, and is the stochastic error.
This study takes 2006–2020 as the investigation period and conducts the “OLS (Ordinary Least Square) + robust standard error” regression analysis of Equation (6). The results are shown in Table 4: the variance inflation factors (VIFs) of all explanatory variables are less than 10, indicating that there is no multicollinearity problem between and . The regression results show that the coefficients of the explanatory variables are significant, which proves that they are important factors influencing .
Table 4.
The Regression Results of Industrial Added Value and its Influencing Factors.
3.4.3. Parameter Setting of Energy Consumption Subsystem
The development of industry requires massive energy consumption as the basis [43], and there is a strict equation among manufacturing energy consumption, industrial added value, and energy intensity. Meanwhile, the improvement of energy efficiency can reduce energy intensity, thus having an impact on the energy consumption of the manufacturing industry [44].
- 1.
- The Manufacturing Energy Consumption
In this paper, referring to the methods of most relevant studies, to prevent the influence of initial values on the simulation results, total energy consumption () is not set as a box variable, but as an auxiliary variable in the SD model, expressed by multiplying industrial added value () and energy intensity (), as in Equation (7).
- 2.
- The Energy Intensity
Energy efficiency is an important factor affecting energy intensity. In this paper, we consider the decomposed components of the GML index, and , as measuring variables of energy efficiency and use them as explanatory variables to explore the relationship between them and . The regression equation is as follows:
where is the constant, and are the coefficients of explanatory variables, and is the stochastic error.
The empirical results calculated by the “OLS + robust standard error” model are shown in Table 5, where the F-value is significant at the 1% level, and the model fits well; the results of VIF indicate that multicollinearity problem does not exist. Meanwhile, the regression results show that the regression coefficients of explanatory variables are significant, proving that EC and TC are important factors affecting energy intensity.
Table 5.
The Regression Results of Energy Intensity and its Influencing Factors.
3.4.4. Parameter Setting of Carbon Emission Subsystem
In the manufacturing production process, energy consumption is accompanied by CO2 emissions. Moreover, various types of energy have different carbon emission factors; therefore, the energy consumption structure in the manufacturing industry also affects the amount of CO2 emission. In addition, there is also an interactive relationship between carbon intensity (CO2 emission per 10k CNY of industrial added value in this paper is defined as carbon intensity, and the unit is 10 kt/10k CNY) and low-carbon policies in this subsystem [45,46,47].
- 1.
- The Manufacturing CO2 Emissions
This study uses data from the Beijing Statistical Yearbook, then measures CO2 emissions from Beijing manufacturing final energy consumption concerning Equation (5).
- 2.
- The Carbon Intensity
Equation (9), which calculates carbon intensity () by CO2 emissions () and , is defined as follows:
3.5. Assumptions
The SD system cannot completely reconstruct the real world. To make the simulation results more accurate while simplifying the SD system, we propose the following assumptions:
- Assumption 1: In the initial scenario of the system, to obtain the predicted value of variables during the 14th Five-Year Plan period, the energy consumption structure is maintained at the same level as year 2020, and all other variables that require input values use the average annual growth rate to calculate predicted values.
- Assumption 2: Investment of fixed assets and R&D investment are the main influencing factors for the change of manufacturing added value.
- Assumption 3: The Beijing manufacturing final consumption of coke will hold at zero during the 14th Five-Year Plan period.
- Assumption 4: All CO2 emissions calculated in the model are produced by fossil fuel and are emitted as CO2.
- Assumption 5: Simulation is performed only using the variables within the system.
3.6. Model Validity Test
The SD model uses Vensim PLE for simulation. Following the simulation, it is vital to test the validity of the model to verify whether the Beijing manufacturing low-carbon development SD model can reflect the essential characteristics and operation laws of the system. This paper compares the historical values and the simulated values of IAV, E, and C from 2006 to 2020, and results show that the relative errors are all within ±15%. This indicates that the model is valid and meets the requirements of SD modeling. Therefore, it can be used to simulate the evolutionary trajectory of Beijing’s manufacturing low-carbon development.
4. Simulation and Analysis of Beijing Manufacturing Low-Carbon Development System
On the basis of government low-carbon objectives, this study will simulate the SD model and analyze the results in this section. According to the Action Plan for Green-oriented Development of Beijing’s Manufacturing Industry in the 14th Five-Year Plan, the Outline for the 14th Five-Year Plan for Beijing’s Economic and Social Development and Long-Range Objectives through the Year 2035, and the Beijing Energy Development Plan in the 14th Five-Year Plan, the low-carbon targets of Beijing manufacturing industry in 2025 are set as follows:
- Target 1: energy intensity reduction rate ≥12%.
- Target 2: carbon reduction rate ≥20%.
- Target 3: the proportion of manufacturing added value in GDP is back up to 13%, striving to reach approximately 15%.
4.1. Scenario Setting of the System
Exploring alternative narratives and scenarios is the next step of the present work given that it requires a more complex analysis with a broader set of hypotheses for some important variables [48]. In order to compare the trends of variables under different adjustment scenarios, this study takes the structural characteristics of the SD model and the actual operation of Beijing manufacturing low-carbon development as the basis and finally selects energy consumption structure, RD, IFA, EC, and TC as the control variables. Then, this study simulates different patterns of Beijing manufacturing low-carbon development by adjusting the values of each control variable or combinations of several control variables to conduct scenario simulations. The time boundary is from 2006 to 2025.
This paper summarizes four representative scenarios as follows:
- Scenario 1 (initial model): the energy structure is maintained at the level of 2020 and all other variables are projected using average annual growth rates.
- Scenario 2 (energy restructuring priority model): comparing the 2025 energy consumption target value with the actual value in 2020 and considering the Beijing 14th Five-Year Plan of “reducing coal, stabilizing gas, and reducing oil”, the final parameter is set to reduce coal consumption while maintaining the proportion of oil and gas consumption at the level of 2020. Other variables are maintained at the same level as the initial model.
- Scenario 3 (industrial investment priority model): manufacturing R&D investment is prioritized, with fixed asset investment concerning the year-on-year growth rate of real data in 2020 and 2021 to determine the parameters. Other variables are maintained at the level of the initial model.
- Scenario 4 (low-carbon technological progress priority model): the green total-factor energy efficiency index calculated in Section 2 is used as a proxy variable for low-carbon technological progress. Systematic changes in this scenario are examined by increasing the average annual growth rates of the EC and TC index. In addition, other variables are maintained at the level of the initial model.
- Scenario 5 (comprehensive development model): this scenario conducts integrated and optimal regulation of energy consumption restructuring, industrial investment, and low-carbon technological progress.
The parameter adjustment settings for the five scenarios are shown in Table 6.
Table 6.
The Parameter Settings of Simulation Considering Average Annual Growth (AAG) Rate.
4.2. Results of Simulation
- Scenario 1 (initial model): In the initial scenario, the energy intensity in Beijing’s manufacturing industry will be reduced to 3.16 × 10⁻⁵ 10 kt of SCE per 10k CNY by 2025, down 11.58% from 2020, and the carbon intensity will drop to 1.01 × 10⁻⁵ 10 kt per 10k CNY by 2025, which also cannot reach the target value. In addition, due to the low average annual growth rate of R&D investment and fixed asset investment, the proportion of manufacturing added value to GDP in 2025 is 8.45% (The predicted value of GDP in 2025 is calculated on the basis of the Outline for the 14th Five-Year Plan for Beijing’s Economic and Social Development and Long-Range Objectives through the Year 2035), which cannot rise back to the expected level of 13%.
- Scenario 2 (energy restructuring priority model): With regard to energy restructuring priority, the energy consumption structure is regulated concerning the projects of energy development in the Beijing Energy Development Plan for the 14th Five-Year Plan Period. The simulation results show that with the reduction of coal consumption, CO2 emissions, and carbon intensity decrease. Under this scenario, the CO2 emissions of Beijing in 2025 will be 2,723,200 tons, which is 23.13% lower than that in 2020; additionally, the carbon intensity in 2025 will reach 6.96 × 10⁻⁶ 10 kt per 10k CNY, which is 39.26% lower than that in 2020, and it will reach the target value. However, the model still has some shortcomings preventing the manufacturing economic output from reaching the planned value.
- Scenario 3 (industry investment priority model): In 2020 and 2021, the real data in Beijing Statistic Book show that R&D and fixed asset investment in Beijing’s manufacturing industry grows rapidly over the years, so this paper refers to historical data for selecting parameter settings. In this scenario, the manufacturing added value will increase to 599.70 billion CNY, and its proportion of GDP will reach 13.02%, which can achieve the requirements of Target 3. However, the increase in R&D and fixed asset investment promotes the rise in manufacturing added value while the increase in the manufacturing added value is accompanied by higher levels of energy consumption, which further leads to a higher level of CO2 emissions. The results show that regulation from a single investment perspective still has many drawbacks.
- Scenario 4 (priority model for technological progress in energy conservation and emission reduction): When focusing on technological progress in energy conservation and emission reduction, the energy intensity will be reduced to 3.12 × 10⁻⁵ 10 kt of SCE per 10k CNY in 2025, which is 12.62% lower than that in 2020; however, this scenario can only satisfy Target 1. Thus, multi-variable regulation for optimization is still required.
- Scenario 5 (system coordination development model): This scenario is the comprehensive optimization scenario of Scenarios 2, 3, and 4. It considers the coordination relationship among all the selected variables and is determined after several simulations. As shown in Figure 4, Figure 5 and Figure 6, in this scenario, energy intensity decreases by 12.36%, carbon intensity decreases by 21.00%, and the share of added value in GDP rebounds to 13.94%, which means all low-carbon targets are achieved.
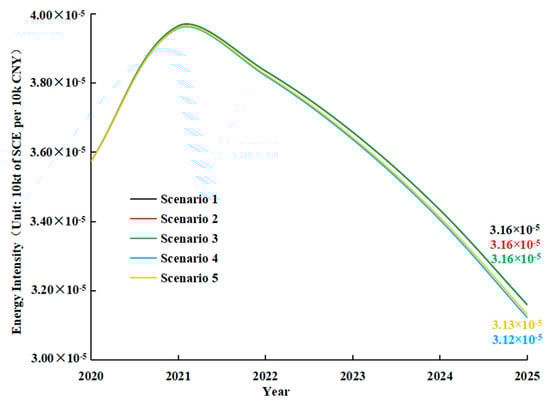 Figure 4. The Simulation Curve of Energy Intensity.
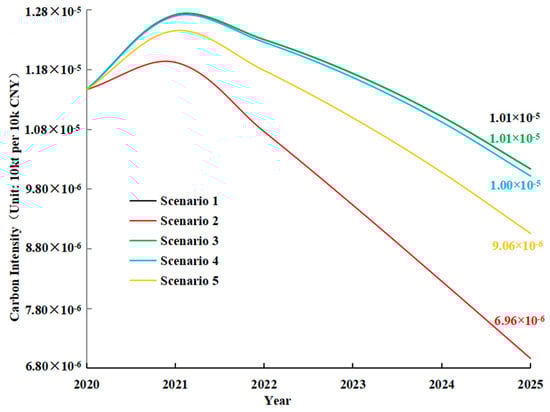 Figure 5. The Simulation Curve of Carbon Intensity.
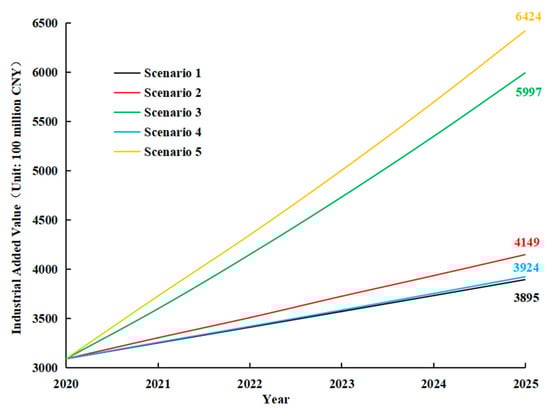 Figure 6. The Simulation Curve of Industrial Added Value.
Overall, Scenario 5 is the optimal development path for Beijing manufacturing low-carbon development in the 14th Five-Year Plan period. This scenario can effectively reduce energy and carbon intensity while ensuring the continuous and rapid growth of manufacturing added value. Overall, it is in line with the inevitable requirement of saving energy, reducing carbon emissions, and increasing the energy efficiency of Beijing’s manufacturing industry in the new development stage.
5. Conclusions and Policy Implications
This paper concludes that although the regulation of a single variable is helpful to achieve the specific targets set in Section 4, it still has practical limitations. Therefore, the achievement of Beijing manufacturing low-carbon development targets necessitates comprehensive regulation from a variety of variables. Under the guidance of government planning, this paper proposes a comprehensive development path that considers the interaction among multiple variables. During the 14th Five-Year Plan period, in terms of energy consumption structure, coal’s share should decrease by 1.2% in 2025 compared with 2020, while oil and natural gas maintain at the level of 2020. Regarding investment, the annual average growth rate of R&D investment is required to reach 15%, and fixed asset investment should grow by an average rate of 30% per year. For low-carbon technology progress, it is appropriate to let the annual average growth rate of EC and TC reach—2.80% and 4.40%, respectively. Under this scenario, all targets can be met by 2025: energy intensity will decrease by 12.36%, while carbon intensity will decline by 21.00%. In addition, the manufacturing added value share of Beijing’s GDP will increase to 13.94%.
The following policy implications can be drawn from above.
- 1.
- Adjust the energy structure and synchronically promote green technology to help the manufacturing industry save energy and reduce carbon.
Adjusting the energy structure can improve energy efficiency, reduce carbon emissions, and promote the development of new manufacturing, which is crucial for the low-carbon transition. Beijing should reduce the proportion of coal consumption, strengthen the development and utilization of clean energy and renewable energy resources in manufacturing enterprises [49], promote the use of electricity to replace fossil fuels in an orderly manner in enterprises with conditions, and increase the proportion of renewable energy, such as photovoltaic, solar thermal, and geothermal. Simultaneously, Beijing manufacturing should promote advanced technologies for energy saving and consumption reduction, develop advanced energy gradient utilization methods, and eliminate the technical roadblocks from energy conservation and consumption reduction thus far.
- 2.
- Increase investment in fixed assets and R&D funds to promote the development of high-end and green-oriented manufacturing.
During the 14th Five-Year Plan period, Beijing should adjust the investment structure of the manufacturing industry and focus on energy conservation, environmental protection, new energy, new materials, and digital environmental protection based on the long-range objectives of carbon neutrality. Meanwhile, it is vital to support high-end scientific research and innovation projects conforming to the capital city’s strategic position. Additionally, it is necessary to improve the investment management mechanism to enhance the vitality of manufacturing investment, increase the investment of financial funds, and encourage each investment body to take the advanced manufacturing industry as the key direction of investment. In addition, it should increase R&D investment and continue to promote the construction of innovative industrial cluster demonstration areas in Beijing E-Town and Shunyi District to build a new system of high-precision industries in Beijing’s manufacturing industry for the future.
- 3.
- Tackle key problems in technology while providing targeted assistance in certain manufacturing sub-sectors to improve energy efficiency.
Improving energy efficiency is the key task for the green-oriented transition of Beijing’s manufacturing industry. The results of the GML index show that technological progress is the key driver of energy efficiency improvement. Therefore, R&D investment should be increased, the allocation mechanism of R&D expenditure should be improved, and the technical transformation of the energy-saving and carbon-reducing side should be promoted in an orderly manner relying on technological innovation. On the other side, Beijing’s manufacturing should improve technological efficiency by promoting the diffusion of common technologies among industries, and updating production equipment, thereby improving energy efficiency. In addition, it is vital to avoid the uniform control of energy consumption among different manufacturing sub-sectors. Beijing should help to rectify the low-energy-efficient manufacturing sub-sectors by formulating specific industry plans and industry policies. Meanwhile, it should implement the energy efficiency “top runner” policy to make the high-energy-efficient sub-sectors drive the development of low-energy-efficient sub-sectors.
Additionally, limitations also exist in this paper. Firstly, due to the change of statistical caliber and data missing problems, this paper selects only 2006–2020 as the time range. This can affect the simulation results of the SD model to some extent. Further research will focus on seeking suitable statistical data estimation methods to solve the problem of the inconsistent statistical caliber of data in different years. Secondly, this paper simplifies the Beijing manufacturing low-carbon development system and subdivides it into energy, economy, and environmental subsystems, but the real Beijing manufacturing low-carbon development system is an open dynamic system, and the components of the system may not be considered comprehensively in the SD model. Therefore, this model should be improved and expanded in the future, such as considering the impact of market factors, especially carbon emissions trading.
Author Contributions
Conceptualization, Y.C. (Yuanying Chi), S.X. and J.L.; methodology and software, S.X.; validation and translation, X.Y., X.Z. and J.L.; formal analysis, S.X. and X.Z.; investigation S.X.; resources and data curation, J.L. and S.X.; writing—original draft preparation, S.X.; writing—review and editing, Y.C. (Yahui Chen) and X.Z.; funding acquisition, Y.C. (Yuanying Chi). All authors have read and agreed to the published version of the manuscript.
Funding
This research was funded by a major project of the National Natural Science Foundation of China “Research on the construction of China’s economic transformation mode for carbon neutrality” (72140001); by the Ministry of Education Humanities and Social Sciences Planning Fund project (21YJA790009); and by the Beijing Social Sciences Fund decision-making consultation key project (21JCB106).
Data Availability Statement
Not applicable.
Conflicts of Interest
The authors declare no conflict of interest.
References
- Charnes, A.; Cooper, W.W.; Rhodes, E. Measuring the efficiency of decision making units. Eur. J. Oper. Res. 1978, 2, 429–444. [Google Scholar] [CrossRef]
- Tone, K. A slacks-based measure of efficiency in data envelopment analysis. Eur. J. Oper. Res. 2001, 130, 498–509. [Google Scholar] [CrossRef]
- Caves, D.W.; Christensen, L.R.; Diewert, W.E. The Economic Theory of Index Numbers and the Measurement of Input, Output, and Productivity. Econometrica 1982, 50, 1393–1414. [Google Scholar] [CrossRef]
- Hu, J.L.; Wang, S.C. Total-factor energy efficiency of regions in China. Energy Policy 2006, 34, 3206–3217. [Google Scholar] [CrossRef]
- Liu, Y. Does international trade degrade total-factor energy efficiency: An empirical analysis in China. China Popul. Resour. Environ. 2018, 28, 20–29. [Google Scholar]
- Wu, J.; Li, M.; Zhu, Q.; Zhou, Z.; Liang, L. Energy and environmental efficiency measurement of China’s industrial sectors: A DEA model with nonhomogeneous inputs and outputs. Energy Econ. 2019, 78, 468–480. [Google Scholar] [CrossRef]
- Jiang, L.; Zhou, H.; He, S. Does energy efficiency increase at the expense of output performance: Evidence from manufacturing firms in Jiangsu province, China. Energy 2021, 220, 119704. [Google Scholar] [CrossRef]
- Gong, X.; Mi, J.; Wei, C.; Yang, R. Measuring Environmental and Economic Performance of Air Pollution Control for Province-Level Areas in China. Int. J. Environ. Res. Public Health 2019, 16, 1378. [Google Scholar] [CrossRef]
- Sueyoshi, T.; Liu, X.; Li, A. Evaluating the performance of Chinese fossil fuel power plants by data environment analysis: An application of three intermediate approaches in a time horizon. J. Clean. Prod. 2020, 277, 121992. [Google Scholar] [CrossRef]
- Newell, R.G.; Jaffe, A.B.; Stavins, R.N. The Induced Innovation Hypothesis and Energy-Saving Technological Change. Q. J. Econ. 1999, 114, 941–975. [Google Scholar] [CrossRef]
- Li, L.; Zhou, Y. Can Technological Progress Improve Energy Efficiency?-Empirical Test Based on China’s Industrial Sub-Sectors. J. Manag. World 2006, 10, 82–89. [Google Scholar] [CrossRef]
- Shi, D.; Wu, L.X.; Fu, X.X.; Wu, B. Research on Regional Differences of China’s Energy Efficiency and Its Cause-Variance Decomposition Based on Stochastic Frontier Production Function. J. Manag. World 2008, 2, 35–43. [Google Scholar] [CrossRef]
- Zheng, L.L. Energy Efficiency, Factor Inputs and Economic Growth-An Empirical Analysis Based on Panel Threshold Regression. J. Cent. Univ. Financ. Econ. 2012, 9, 48–53. [Google Scholar]
- Angus, M. Growth and Slowdown in Advanced Capitalist Economies: Techniques of Quantitative Assessment. J. Econ. Lit. 1987, 25, 649–698. [Google Scholar]
- Zhang, W.S. Energy Efficiency, Industrial Structure and Regional Economic Development Gap in China. J. Shanxi Financ. Econ. Univ. 2010, 32, 28–34. [Google Scholar] [CrossRef]
- Wan, L.; Zhang, Y.; Qi, S.; Li, H.; Chen, X.; Zang, S. A study of regional sustainable development based on GIS/RS and SD model-Case of Hadaqi industrial corridor. J. Clean. Prod. 2016, 142, 654–662. [Google Scholar] [CrossRef]
- Xiao, S.; Dong, H.; Geng, Y.; Tian, X.; Liu, C.; Li, H. Policy impacts on Municipal Solid Waste management in Shanghai: A system dynamics model analysis. J. Clean. Prod. 2020, 262, 121366. [Google Scholar] [CrossRef]
- Bai, J.; Nie, L. Energy Efficiency, Environmental Pollution and the Transformation of China’s Economic Development Mode. J. Financ. Res. 2018, 10, 1–18. [Google Scholar]
- Tong, H.; Yang, Y.; Wang, J.; Feng, Y. Modeling China’s Green Economy 2050: Scenario Analysis Based on the System Dynamics Model. China Soft Sci. Mag. 2015, 6, 20–34. [Google Scholar]
- Liu, C.; Tu, G. The Analysis and Simulation of National Strategy on Low Carbon Energy Development Based on System Dynamics. Syst. Eng. 2015, 33, 100–106. [Google Scholar]
- Luo, L.; Wu, J.; Hu, H.; Chen, Y.; Xu, Z. Analysis and forecast of water supply and demand in Beijing through system dynamics modeling. Urban Water J. 2020, 17, 512–524. [Google Scholar] [CrossRef]
- Yang, H.; Li, X.; Ma, L.; Li, Z. Using system dynamics to analyse key factors influencing China’s energy-related CO2 emissions and emission reduction scenarios. J. Clean. Prod. 2021, 320, 128811. [Google Scholar] [CrossRef]
- Li, J.; Sun, K. Research on the Industrial Green Development of Beijing-Tianjin-Hebei Based on System Dynamics. Soft Sci. 2018, 32, 113–119. [Google Scholar] [CrossRef]
- Yang, Z.; Yang, H.; Sun, D. Simulation of urban sustainability based on System Dynamics: A case study of Beijing-Tianjin-Hebei region. Sci. Geogr. Sin. 2021, 41, 1515–1524. [Google Scholar] [CrossRef]
- Zhang, J.; Wang, Z.; Tang, L.; Yu, A. The Simulation of Carbon Emission Trading System in Beijing-Tianjin-Hebei Region: An Analysis Based on System Dynamics. Chin. J. Manag. Sci. 2016, 24, 1–8. [Google Scholar] [CrossRef]
- Li, G.; Li, Y.; Jia, X.; Du, L.; Huang, D. Establishment and Simulation Study of System Dynamic Model on Sustainable Development of Water-Energy-Food Nexus in Beijing. Manag. Rev. 2016, 28, 11–26. [Google Scholar] [CrossRef]
- Chen, S. Energy Consumption, CO2 Emission and Sustainable Development in Chinese Industry. Econ. Res. J. 2009, 44, 41–55. [Google Scholar]
- Xu, G.; Deng, X.; Chen, X. Transformation and Upgrading of Manufacturing and High-Quality Economic Development-A Research Based on Total Factor Energy Efficiency. Econ. Theor. Bus. Manag. 2020, 12, 100–110. [Google Scholar]
- Kuang, L.; Han, X.; Liu, G. The Efficiency of Energy Infrastructure Investment and Its Regional Economic Impact. Int. J. Environ. Res. Public Health 2023, 20, 2125. [Google Scholar] [CrossRef]
- Xie, Z.; Li, Y.; Qin, Y. Allocation of control targets for PM2.5 concentration: An empirical study from cities of atmospheric pollution transmission channel in the Beijing-Tianjin-Hebei district. J. Clean. Prod. 2020, 270, 122545. [Google Scholar] [CrossRef]
- Tone, K. A slacks-based measure of super-efficiency in data envelopment analysis. Eur. J. Oper. Res. 2002, 143, 32–41. [Google Scholar] [CrossRef]
- Oh, D.H. A metafrontier approach for measuring an environmentally sensitive productivity growth index. Energy Econ. 2010, 32, 146–157. [Google Scholar] [CrossRef]
- Wu, Q.; Wu, C. Research on Evaluation Model of Energy Efficiency Based on DEA. J. Manag. Sci. 2009, 22, 103–112. [Google Scholar]
- Zhao, M.; Zhang, W.; Yu, L. Carbon Emissions from Energy Consumption in Shanghai City. Res. Environ. Sci. 2009, 22, 984–989. [Google Scholar] [CrossRef]
- Chen, S. Reconstruction of Sub-industrial Statistical Data in China (1980–2008). China Econ. Q. 2011, 10, 735–776. [Google Scholar] [CrossRef]
- Zeng, S.; Li, G.; Wu, S.; Dong, Z. The Impact of Green Technology Innovation on Carbon Emissions in the Context of Carbon Neutrality in China: Evidence from Spatial Spillover and Nonlinear Effect Analysis. Int. J. Environ. Res. Public Health 2022, 19, 730. [Google Scholar] [CrossRef] [PubMed]
- Meng, Z.; Wang, H.; Wang, B. Empirical Analysis of Carbon Emission Accounting and Influencing Factors of Energy Consumption in China. Int. J. Environ. Res. Public Health 2018, 15, 2467. [Google Scholar] [CrossRef] [PubMed]
- Chu, H.; Lai, C. Abatement R&D, market imperfections, and environmental policy in an endogenous growth model. J. Econ. Dyn. Control 2014, 41, 20–37. [Google Scholar] [CrossRef]
- Grimaud, A.; Tournemaine, F. Why can an environmental policy tax promote growth through the channel of education? Ecol. Econ. 2007, 62, 27–36. [Google Scholar] [CrossRef]
- Hamaguchi, Y. Pollution havens and agglomeration: The effect of globalization and technological spillover. Appl. Econ. 2023. [Google Scholar] [CrossRef]
- Nakada, M. Does environmental policy necessarily discourage growth? J. Econ. 2004, 81, 249–275. [Google Scholar] [CrossRef]
- Li, Q.; Zhang, L. The Path of China’s Industrial Structure Adjustment from the Perspective of Added Value. Macroeconomics 2016, 7, 60–72+150. [Google Scholar] [CrossRef]
- Li, G.; Zeng, S.; Li, T.; Peng, Q.; Irfan, M. Analysing the Effect of Energy Intensity on Carbon Emission Reduction in Beijing. Int. J. Environ. Res. Public Health 2023, 20, 1379. [Google Scholar] [CrossRef]
- Huang, R.; Zhang, S.; Wang, P. Key areas and pathways for carbon emissions reduction in Beijing for the “Dual Carbon” targets. Energy Policy 2022, 164, 112873. [Google Scholar] [CrossRef]
- Zhang, P.; Wang, H. Do provincial energy policies and energy intensity targets help reduce CO2 emissions? Evidence from China. Energy 2022, 245, 123275. [Google Scholar] [CrossRef]
- Zeng, S.; Jin, G.; Tan, K.; Liu, X. Can low-carbon city construction reduce carbon intensity? Empirical evidence from low-carbon city pilot policy in China. J. Environ. Manag. 2023, 332, 117363. [Google Scholar] [CrossRef] [PubMed]
- Song, Y.; Chen, X.; Li, Z.; Zeng, Z.; Zhang, M. Exploring the effect of a low-carbon city pilot policies on carbon dioxide emission intensity: Based on the PSM-DID method. Chin. J. Popul. Resour. Environ. 2022, 20, 209–216. [Google Scholar] [CrossRef]
- Vicente, S.E.; Javier, F.; Jaime, M.; Luis, J.M.; Margarita, M. Analysis of energy future pathways for Ecuador facing the prospects of oil availability using a system dynamics model. Is degrowth inevitable? Energy 2022, 259, 124963. [Google Scholar] [CrossRef]
- Hu, Y.; Chi, Y.; Zhou, W.; Li, J.; Wang, Z.; Yuan, Y. The interactions between renewable portfolio standards and carbon emission trading in China: An evolutionary game theory perspective. Energy 2023, 271, 127047. [Google Scholar] [CrossRef]


Disclaimer/Publisher’s Note: The statements, opinions and data contained in all publications are solely those of the individual author(s) and contributor(s) and not of MDPI and/or the editor(s). MDPI and/or the editor(s) disclaim responsibility for any injury to people or property resulting from any ideas, methods, instructions or products referred to in the content. |
© 2023 by the authors. Licensee MDPI, Basel, Switzerland. This article is an open access article distributed under the terms and conditions of the Creative Commons Attribution (CC BY) license (https://creativecommons.org/licenses/by/4.0/).