Article

Emission Characteristics of Particle Number from Conventional Gasoline and Hybrid Vehicles

1
State Environmental Protection Key Laboratory of Vehicle Emission Control and Simulation, Chinese Research Academy of Environmental Sciences, Beijing 100012, China
2
Vehicle Emission Control Center, Chinese Research Academy of Environmental Sciences, Beijing 100012, China
*
Authors to whom correspondence should be addressed.
Sustainability 2024, 16(1), 12; https://doi.org/10.3390/su16010012
Submission received: 28 November 2023 / Revised: 14 December 2023 / Accepted: 18 December 2023 / Published: 19 December 2023
(This article belongs to the Special Issue Aerosols and Air Pollution)

Abstract

:
Vehicular particle number (PN) emissions have garnered increasing attention. In this study, nine light-duty vehicles, involving conventional internal combustion engine gasoline vehicles (ICEVs) and hybrid electric vehicles (HEVs), underwent testing on a chassis dynamometer to elucidate key factors influencing PN emissions. We found that with more stringent emission standards Gasoline Direct Injection (GDI) vehicles exhibited a reduction in PN emission factors. Higher PN emissions for GDI vehicles than vehicles with Multi-Port Fuel Injection (PFI) engines were observed; meanwhile, HEV showed lower PN emissions than ICEVs. PN emissions for cold start consistently exceeded warm start across vehicles with different standards and technologies. Notably, China VI HEV exhibited a substantial 19.2-fold increase in PN emissions for cold start compared to warm start. Analysis on a second-by-second basis revealed that cold-start emissions concentrated in low speed, while warm-start emissions were prominent in extra-high speed. Concerning vehicle specific power (VSP), the lowest mean PN emission rate occurred during idle conditions. PN emissions for China IV-VI ICEVs with GDI engines would increase with the increasing VSP, whereas China VI ICEVs with PFI engines and HEV with GDI engines showed varied patterns of PN emissions, especially under cold start. Our study would further facilitate formulating effective strategies for vehicular PN emissions.

1. Introduction

Particulate matter (PM) has become a significant concern for public health and environmental protection due to its toxicity, as evidenced by a consistent increase in elevated fasting blood glucose and even daily mortality with increasing PM concentration [1,2]. Vehicular exhaust emissions have been reported to be an important source of carbonaceous aerosols, particularly for the ultrafine particles (UFPs) in the fine size range with an aerodynamic diameter below 0.1 μm [3,4]. Although UFPs may dominate the particle number from vehicular emission, they contribute little to particle mass or volume [5]. Hence, for the sustainable development of human society, vehicular emission standards have gradually incorporated particle numbers into the control system based on particle mass emission control, and proposed measurement techniques and emission limit values for particle numbers.
Previous studies indicated that heavy-duty diesel vehicles contribute the vast majority of vehicular tailpipe particulate emissions, and, thus, research on vehicular particulate emissions has been focused on diesel vehicles. The UFPs from diesel vehicles have been reported to be significantly higher than gasoline vehicles [6]. Chen et al. [7] found that particle emissions of diesel vehicles were four times higher than gasoline vehicles. Nevertheless, with the upgrading of emission standards, gasoline direct injection (GDI), with high fuel economy and low hydrocarbon emissions, has emerged as a newly developed engine technology, swiftly supplanting traditional multi-port fuel injection (PFI) in numerous markets. Although GDI engines can provide lower regulated pollutant emissions compared to the traditional PFI, finer particles are generated more easily in GDI engines as the injection pressure of gasoline injection increases, which has been reported in prior studies [3,8]. Research on PN emission characteristics from gasoline vehicles was also in full swing. As for the influence of emission standards, Shen et al. [3] reported the UFPs emissions of light-duty gasoline trucks based on on-road measurements, along with a decrease in PN as the standards updated. To mitigate particle emissions from GDI vehicles, gasoline particulate filters (GPF) have been developed and equipped in the vehicles. The effect of particle filters and passive regenerations on particle emissions has been assessed [9].
Under different conditions, distinct vehicles exhibit varied PN emission characteristics. Chen et al. [10] identified the starting conditions of vehicles as a pivotal factor influencing PN emissions, revealing that in NEDC cycle testing, the cold-start emissions of GDI vehicles constitute over 50% of PN emissions, whereas PFI vehicles contribute approximately 70% under cold start. He et al. [11] compared the PN emission factors of gasoline vehicles at low, medium, high, and extra-high speeds, finding the highest PN emission factor during the low-speed phase. These studies collectively underscore the profound impact of a vehicle’s operating state on PN emissions. Additionally, Zhu et al. [12] investigated the influence of ambient temperature on PN emissions, observing that GDI vehicles exhibited higher PN emissions than PFI vehicles at 30 °C, while PFI and GDI vehicles demonstrated comparable PN emission factors in cold-start tests at −7 °C. Moreover, the effect of fuel types (gasoline, diesel, liquefied petroleum gas, compressed natural gas, etc.) on PN emissions was explored [13,14,15,16]. Nevertheless, the majority of studies were under real-world driving conditions [3,13,17]. The assessment of influencing factors on vehicular PN emissions based on chassis dynamometer tests with easily controlling and reproducibility is lacking, particularly for the in-use vehicles that meet the latest national standard, limits, and measurement methods for emissions from light-duty vehicles (China VI).
To further explore the effects of emission standards, engine techniques, start-up stages, and driving conditions on vehicular particular emissions, we studied the PN measurements from nine light-duty vehicles, including eight conventional internal combustion engine gasoline vehicles (ICEVs) and one hybrid electric vehicle (HEV), representing various emission standard categories and mainstream engine techniques based on chassis dynamometer tests. Our study will be beneficial for vehicular particulate matter emission control, which will further contribute to the sustainability of air quality and human health. Overall, the following will be reported in this study:
  • Comparison of PN emission characteristics from China IV, China V, and China VI vehicles (Section 3.1).
  • Impact of mainstream engine techniques on PN emissions for China VI vehicles complying with the latest emission standards in China (Section 3.1).
  • Effects of start-up stages on PN transient emissions (Section 3.2).
  • Influences of driving conditions on PN emissions (Section 3.3).

2. Methodology

2.1. Test Vehicles and Fuels

A total of nine in-use light-duty vehicles were evaluated for the PN emission characteristics in this study. The specifications and fuel consumption of the tested vehicles are summarized in Table 1 and Table S1 in the Supplementary Information. To explore the effect of different influencing factors on PN emission characteristics, we further selected vehicles from the perspective of emission standards, fuel injection, and powertrain, including eight ICEVs (vehicle #1 to #8) and one HEV (vehicle #9). The ICEVs are gasoline vehicles and comprised two China IVs with gasoline direct injection (GDI) engines, two China Vs with GDI engines, two China VIs with GDI engines, and two China VIs with port fuel injection (PFI) engines, covering a wide range of emission standard categories (model years from 2011 to 2022) and the majority of engine technologies. The HEV with model year of 2022 is compliant with the China VI emission standard and equipped GDI engine. HEVs are considered an intermediate technology towards pure electric vehicles. The tested HEV in our study is a non-plug-in hybrid vehicle, which does not use external charging equipment to charge the power battery, in which the electric motor could be used as an alternator. It does not have a charging port; all the power in the battery comes from the vehicle itself. The vehicle is driven by the electric motor at low-speed conditions and driven by the engine at medium- and high-speed conditions; meanwhile, the electric motor could be driven to generate electricity when the engine is working. Overall, this operation mode might cause lower fuel consumption and exhaust emissions [18]. All the tested vehicles were equipped with a Three-Way Catalytic Converter (TWC) to control exhaust emissions (mainly carbon monoxide (CO), hydrocarbon (HC), and nitrogen oxides (NOx)) and without gasoline particulate filters (GPF).
To minimize the potential effect of variations in gasoline components on emissions, conventional gasoline (RON 92 gasoline) with the same composition was utilized in this study. The specifications of the RON 92 gasoline are shown in Table S2. The utilized RON 92 gasoline, a standard product from the automobile testing center, complies with national standards in China, ensuring the consistency of gasoline composition throughout all driving cycles in this study.

2.2. Experimental Protocol and Driving Cycles

All the driving tests were conducted in the China Automotive Technology and Research Center (CATARC), which has been introduced in detail in previous studies [19,20,21,22]. The driving cycles were operated based on a chassis dynamometer, and throughout these cycles, the exhaust sampling system and exhaust analyzer were operational. A constant volume sampling (CVS) system was used to conduct certification-quality emissions measurements. The instantaneous concentrations of regulated species (CO, NOx, HC, carbon dioxide (CO2), and PM) were instantaneously measured with a time resolution of 1 s. Based on the measured pollutant concentrations, pollutant densities, exhaust flows, and vehicle speeds, the mileage-based emission factors are calculated.
For the driving cycles of light-duty vehicles, the New European Driving Cycle (NEDC) in China V regulation has been replaced by the Worldwide Harmonized Light Vehicles Test Cycle (WLTC) in China VI regulation [23]. Here, the protocol adopted is the WLTC, which contains 1800 s and could be further segmented into four phases (Phase 1–4): low speed (589 s), medium speed (433 s), high speed (455 s), and extra high speed (323 s). The maximum speeds for Phase 1–4 are 56.5 km/h, 76.6 km/h, 97.4 km/h, and 131.3 km/h, respectively. We tested both the cold start and warm start for vehicles to explore the effect of startup modes on PN emissions. For the cold start mode, each vehicle was soaked for at least 12 h in the room of the chassis dynamometer with a constant temperature of 23 °C.
For the PN measurement, the measurement process is based on the China 6 procedure, as outlined in previous studies [22]. The amount of solid particulate matter above 23 nm was measured using a PN counter, and PN emission factors are calculated as Equation (1).
PN = t = 1 1800 C pt × f pt × V t d
where PN with the unit of #/km is the mileage-specific PN emission; C pt is the instantaneous PN volume concentration for the second t, and the unit is #/cm3; f pt is the instantaneous dilution factor for second t; V t denotes the instantaneous dilution exhaust volume for the second t, and the unit is cm3.
Moreover, we adopted the vehicle specific power (VSP), a comprehensive parameter considering speed, acceleration, road gradient, tire rolling resistance, and aerodynamic resistance, offering a holistic representation of different vehicle driving condition. The calculation for VSP is defined using Equation (2) [3,24]. When VSP < 0 kW/t, the vehicle is identified to be in low-load conditions such as deceleration or downhill driving. Conversely, when VSP ≥ 0 kW/t, the vehicle is characterized in high-load conditions, such as acceleration or uphill driving. To simplify data analysis and facilitate a more intuitive exploration of results, we categorize VSP into 14 modes, as delineated in Table S3 in the Supplementary Information [3,24].
VSP = ν 1.1 a + 98.1 atan sin θ + 0.132 + 0.000302 ν 3
where VSP denote the vehicle specific power and the unit is kW/t; ν denotes the instantaneous vehicle speed with unit of m/s; a denotes the instantaneous acceleration with unit of m/s2; and θ denotes the road gradient.

3. Results and Discussion

3.1. Effect of Technology Upgrades on PN Emissions

Figure 1 illustrates the emission factors based on mileage of PN for the tested vehicles, employing different emission standards and engine technologies. As the emission standards are upgraded, PN emission factors show a significant decreasing trend. Under cold-start conditions, the China IV, China V, and China VI vehicles with GDI engines exhibit average PN emission factors of 2.97 × 10¹², 9.37 × 10¹¹, and 6.30 × 10¹¹ #/km, respectively. In comparison to China IV ICEVs, China V ICEVs demonstrate a substantial 68.4% reduction in PN emissions, while China VI ICEVs exhibit a 32.8% decrease compared to China V. Notably, the transition from China IV to China V shows a more pronounced reduction in PN emission for GDI ICEVs than the transition from China V to China VI. For warm-start conditions, ICEVs with GDI engines under China IV, China V, and China VI standards display average PN emission factors of 2.43 × 10¹², 6.33 × 10¹¹, and 1.83 × 10¹¹ #/km, respectively. This emission trend during warm-start conditions for ICEVs with GDI engines under different standards mirrors that observed during cold-start conditions. Notably, the warm-start PN emission factors for China V ICEVs exhibit a significant reduction of 74.0% compared to China IV ICEVs, while China VI ICEVs demonstrate a 71.1% reduction compared to China V. At this condition, there is a notable decrease in PN emissions during both transitions, from China IV to V and from China V to VI.
The PN emission factors obtained in this study and other studies are compared in Table 2. Our study indicates a significant reduction in PN emissions from ICEVs with GDI engines as the emission standards updated (from China IV to China VI). The trend of PN emission decreasing with updating emission standards in this study is similar to that reported by Shen et al. [3]. This decrease may be attributed to the enhanced combustion efficiency of engines and the effective control of after-treatment devices, resulting from the standard upgrade. However, our research results differ from the conclusions drawn by Yu et al. [8]. According to their results from RDE testing, China V ICEVs with GDI engines exhibited that on-road PN emissions were not lower than those from China IV ICEVs with GDI engines. This disparity could stem from differences in driving conditions and environmental factors between laboratory tests and real-world driving situations [8].
Regarding the influence of engine techniques in PN emissions, herein, we selected China VI ICEVs with two mainstream technologies involving GDI and PFI. Both the vehicles exhibited lower PN emission levels than China V and China IV vehicles. The ICEVs with PFI engines showed PN emission factors of 5.25 × 10¹⁰ and 2.19 × 10¹⁰ #/km during cold and warm starts, while PN emission factors of vehicles with GDI engines were 6.3 × 10¹¹ and 1.8 × 10¹¹ #/km during cold and warm starts, respectively. It is demonstrated that PN emissions for GDI engines were 12 times and 8 times higher than PFI engines during cold and warm starts. Higher PN emissions for GID engines have been observed in numerous previous laboratory test results [10,12,25,26,27]. Typically, GDI engines employ direct fuel injection into the combustion chamber to reduce the time available for mixture preparation and generate more partially rich fuel zones, thereby enhancing PN production [28].
Table 2. PN emission factors in this study and other studies.
Emission StandardsEngine TechniquesTesting MethodsPN Emission Factors (#/km)References
China IIIPFIreal driving emission8.56 × 1010[3]
China IVPFIreal driving emission1.67 × 1010[3]
1.2 × 10¹¹–7.9 × 10¹¹[8]
chassis dynamometer tests3.62 ×1011–1.13 × 10¹²[11]
GDIreal driving emission7.5 × 1010–1.4 × 10¹²[8]
chassis dynamometer tests2.5 × 1012–3.91 × 10¹²[11]
1.76 × 10¹²–3.74× 10¹²This study
China VPFIreal driving emission1.01 × 1010[3]
6.1 × 10¹⁰–7.7 × 10¹¹[8]
chassis dynamometer tests3.35 × 1013[27]
GDIreal driving emission1.01 × 1011[3]
2.4 × 10¹¹–3.9 × 10¹²[8]
chassis dynamometer tests4.62 × 1012[27]
6.31 × 10¹¹–1.02 × 10¹²This study
China VIPFIreal driving emission6.0 × 1010–9.7 × 10¹⁰[11]
chassis dynamometer tests2.44 × 1013[27]
1.85 × 10¹⁰–5.25 × 10¹⁰This study
GDIreal driving emission2.1 × 1011–3.5 × 10¹¹[11]
chassis dynamometer tests1.17 × 1012[27]
1.84 × 10¹¹–6.30 × 10¹¹This study
Furthermore, the HEV vehicle equipped with a GDI engine demonstrated a PN emission factor of 1.2 × 10¹⁰ #/km during warm start, indicating a 93.3% reduction compared to China VI gasoline ICEVs with GDI engines under similar conditions. Additionally, during cold starts, the PN emission factor was 2.2 × 10¹¹ #/km, signifying a 65.1% decrease compared to ICEVs with GDI engines under cold-start. Under equivalent operating conditions, HEVs emitted less PN compared to gasoline ICEVs, consistent with the findings of previous studies [13,29]. However, Zhai et al. [30] and Yang et al. [31] observed that the PN emissions from hybrid vehicles surpassed those from gasoline vehicles with the same engine type. This is attributed to the smaller displacement of the gasoline engine in hybrid vehicles, leading to a higher engine load and frequent occurrences of start–stop events.

3.2. Effect of Start-Up on PN Emissions

From Figure 1, it is evident that cold-start PN emissions are higher than the warm-start emissions for ICEVs employing different emission standards and engine technologies. From different emission stages, the ratios of PN emissions under cold and warm start conditions for ICEVs with GDI engines under China IV, China V, and China VI were 1.22, 1.48, and 3.44, respectively. The sensitivity of PN emissions to technology upgrades under cold and warm start conditions also exhibits differences. Compared to China IV, China V ICEVs with GDI engines experienced a reduction of 68.4% and 74.0% in average PN emissions under cold and warm starts, respectively. In comparison, China VI ICEVs with GDI engines, when contrasted with China V, demonstrated a reduction of 32.8% under cold start and 71.1% under warm start. Throughout the standard upgrade process, the reduction in PN emissions under warm start is more pronounced than that under cold start.
For China VI ICEVs with PFI engines, the ratio of PN emissions under cold and warm start was 2.40, and the difference in PN emissions between cold and warm start is more significant for China VI ICEVs with GDI engines compared to China VI ICEVs with PFI engines. For conventional internal combustion engine vehicles, during cold start, insufficient air is supplied to the engine for combustion, leading to the absence of an optimal fuel–air mixture and relatively low combustion chamber temperatures. Consequently, this condition results in the formation of a significant amount of particulate matter [32]. In comparison to PFI vehicles, GDI vehicles, which are more prone to generating particulate matter due to higher injection pressures, are more susceptible to the impact of cold start.
In contrast, the disparity in PN emissions during cold and warm starts is most pronounced in the China VI hybrid vehicles. The PN emissions under cold start for China VI hybrid vehicle are 19.2 times higher than those under warm start. Perhaps the findings from the study by Zhai et al. [30] could provide an explanation for the significant difference in PN emissions between cold and warm starts in hybrid vehicles. They observed that during cold start, hybrid vehicles require a longer engine warmup time compared to gasoline vehicles. However, during warm starts, there is no need for the engine startup phase.
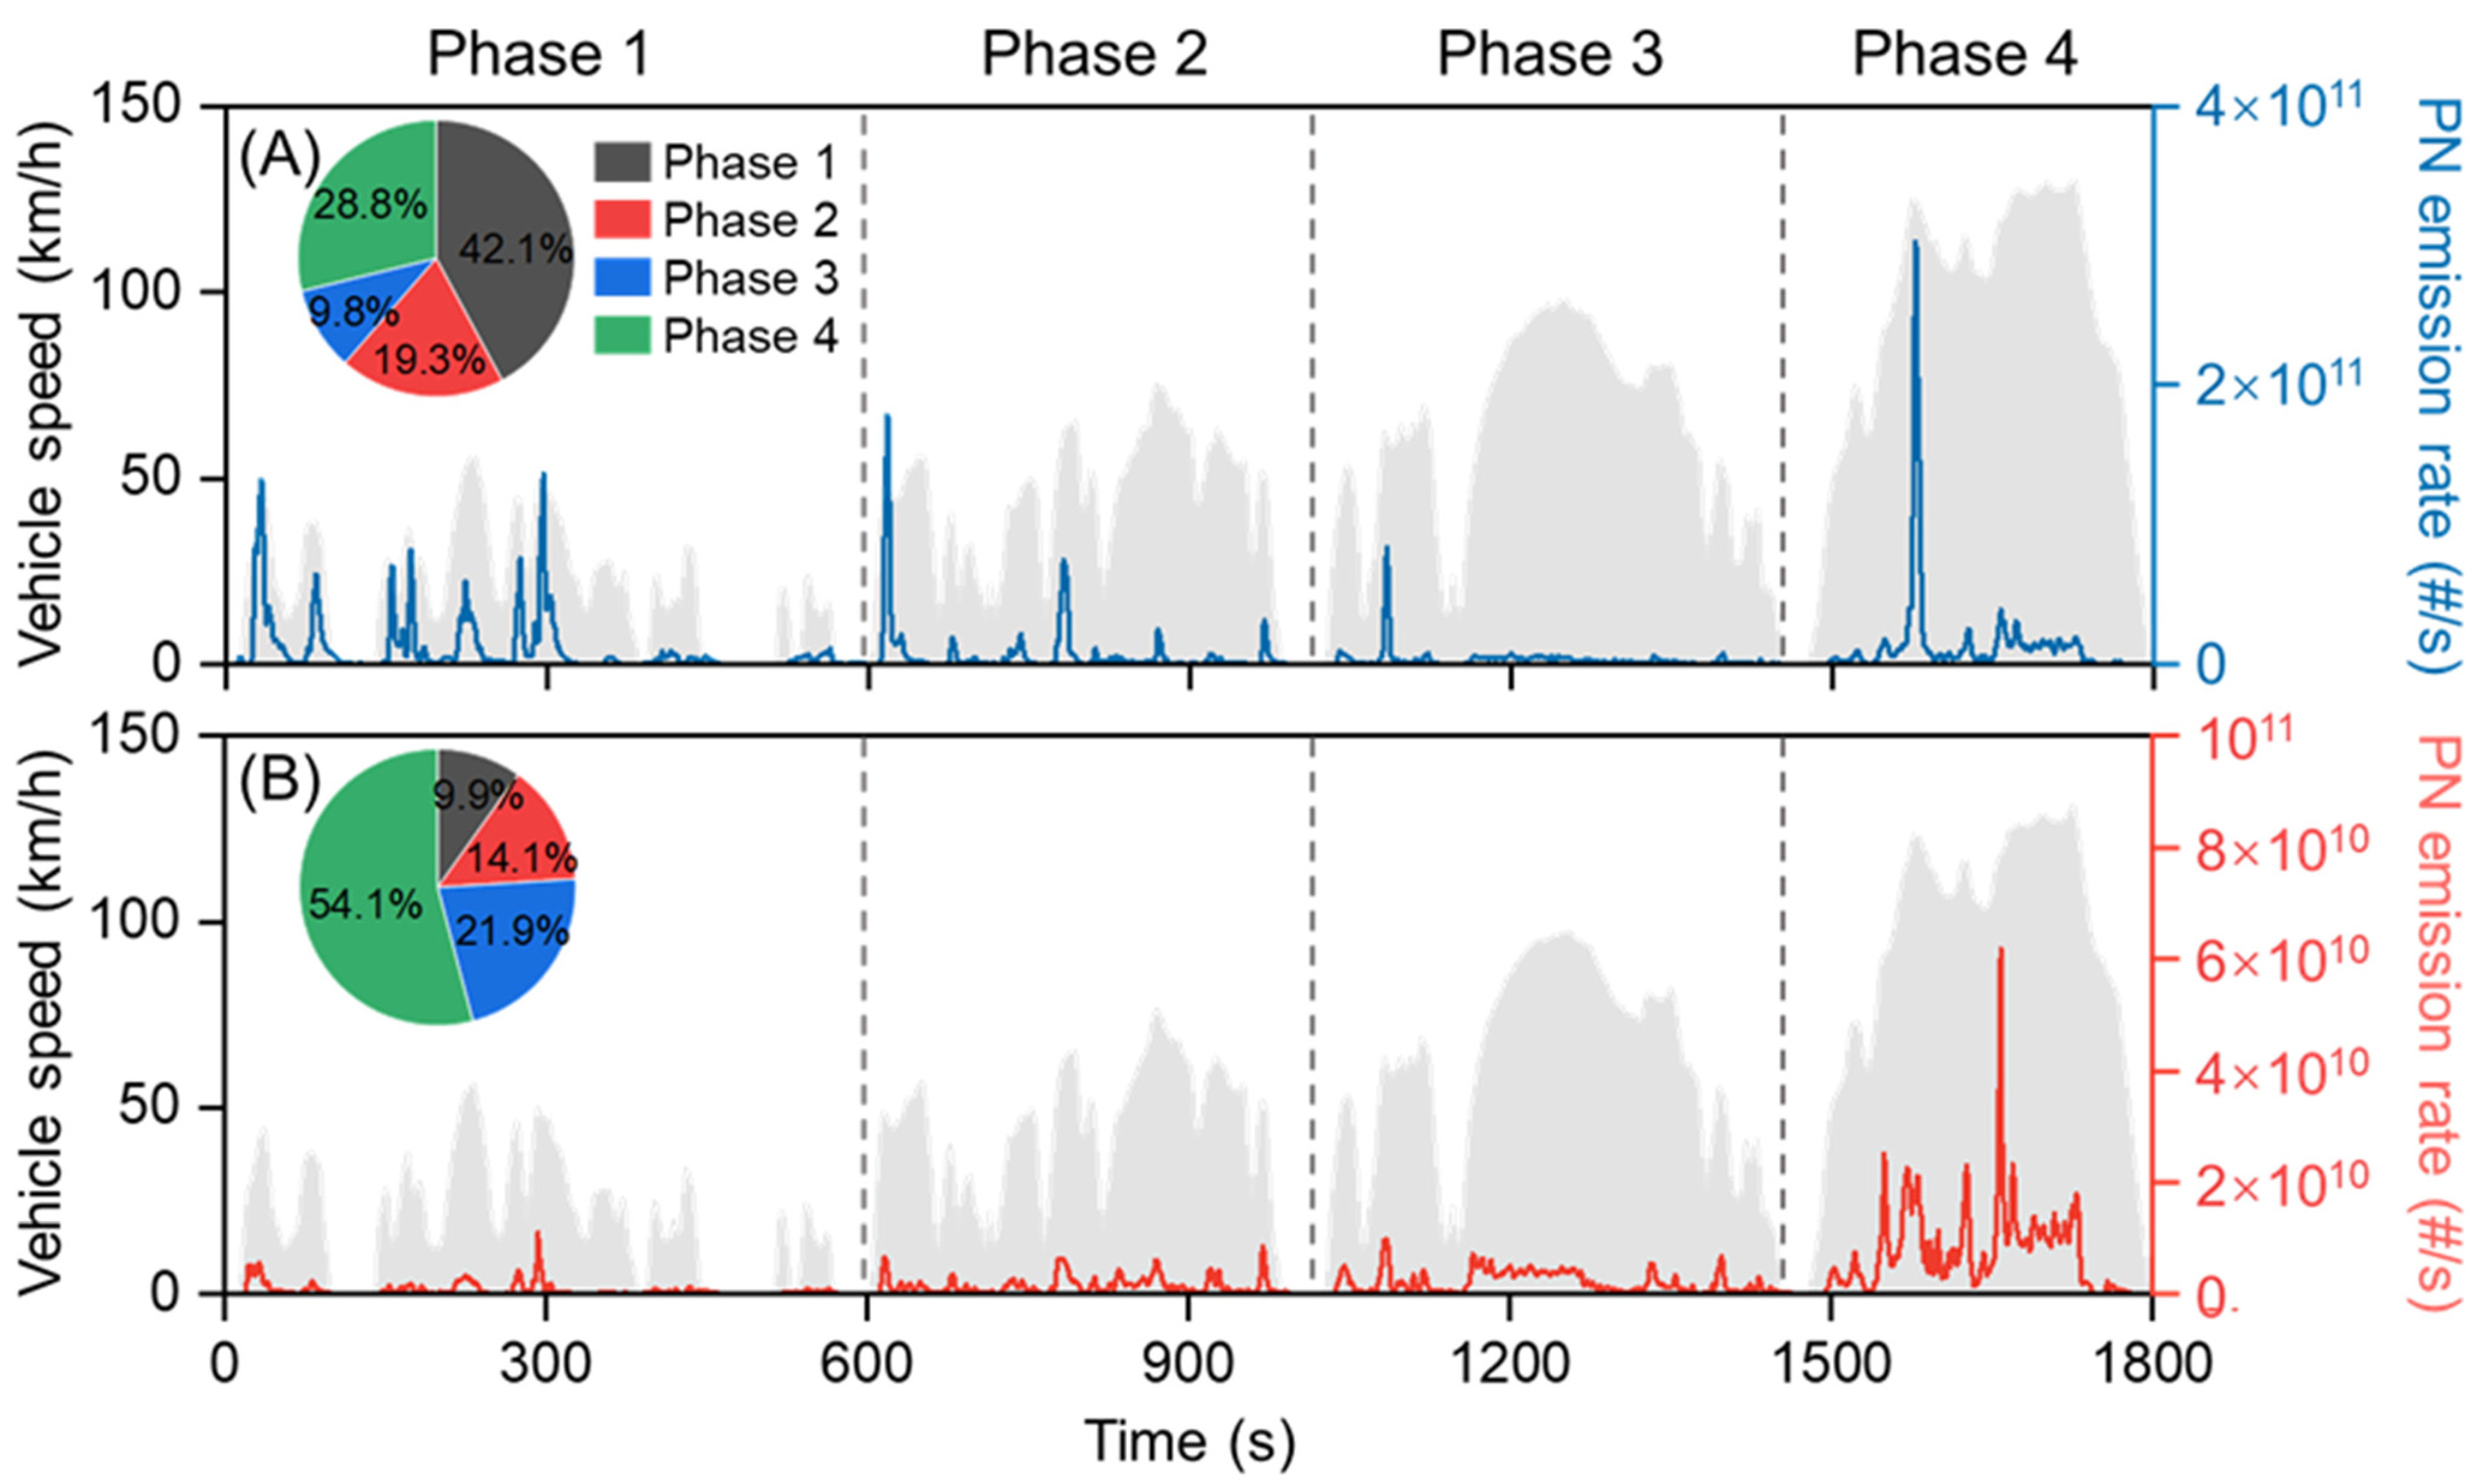
In order to further investigate the differences in PN emissions under cold- and warm-start conditions, we conducted a detailed assessment of per-second PN emissions. Figure 2 presents the PN emission rates and cumulative emission distribution of China VI ICEVs with GDI engines during the WLTC cycle under cold- and warm-start conditions. Under cold start, PN emissions exhibit substantial fluctuations, closely resembling the speed profile. The peaks of emission rates predominantly occur in the first phase characterized by low speeds and short periods of idle. However, the highest instantaneous emission rate with a unit of #/s occurs in the fourth phase representing extra-high speeds, exceeding 2 × 10¹¹ #/s. In contrast, under warm-start conditions, PN emissions remain relatively stable from the first to the third phases, with a significant fluctuation observed in the fourth stage. The highest instantaneous emission rate during warm start exceeds 6 × 10¹⁰ #/s, considerably lower than the peak rate under cold start. The disparities in emission rates under cold- and warm-start conditions result in distinct cumulative emissions distributions. For cold starts, the cumulative emissions are concentrated in the first phase, accounting for 42.1% of the total. In contrast, for warm start, the cumulative emissions are predominantly concentrated in the fourth phase, constituting 54.1% of the total emissions.
The PN emission rates and distribution under cold- and warm-start conditions for China IV ICEVs with GDI engines, China V ICEVs with GDI engines, China VI ICEVs with PFI engines, and China VI HEV with GDI engines in the WLTC cycle are presented in Figures S1–S4, respectively. Distinct emission-process differences are observed among the different vehicle types. For China IV ICEVs with GDI engines, significant fluctuations in PN emissions occur throughout the entire cycle under both cold- and warm-start conditions. The highest instantaneous emission rate exceeds 8 × 10¹¹ #/s, with emission distribution being relatively uniform across the four phases. In contrast, China V ICEVs with GDI engines exhibit comparatively stable trends of PN emissions under both cold and warm start conditions throughout the entire WLTC cycle. Peaks in PN emissions occur in the first phase, with a peak instantaneous emission rate of nearly 6 × 10¹¹ #/s. Under cold-start conditions, significant fluctuations are observed, contributing notably to PN emissions of the first phase at 47.5% for the entire process. Conversely, for warm start, fluctuations are less pronounced in the first phase with the highest instantaneous emission rate not exceeding 2 × 10¹¹ #/s, while a stable occurrence of high values becomes prominent in the fourth phase, constituting the phase with the highest contribution to overall PN emissions at 38%.
Notably, the distribution of PN emissions in China VI ICEVs with PFI engines exhibits similarities to that in China VI ICEVs with GDI engines. During cold start, PN emissions predominantly concentrate in the initial 150 s of the startup phase (phase 1), contributing to 63.2% of the total, and display notable fluctuations, while PN emissions are mainly concentrated in the extra-high-speed phase (phase 4) under warm-start conditions. In contrast, China VI HEV with GDI engine show a pronounced difference in emission distribution under cold start, with PN emissions contributing as high as 75.3% during the first phase, representing one-third of the entire cycle. However, despite the high contribution rate during this first phase, the actual PN emissions (4.19 × 10¹¹) from China VI HEV with GDI engine remain lower than those from China VI ICEVs with GDI engines (6.14 × 10¹²). This is attributed to the hybrid vehicles primarily operating with the electric motor in the low-speed range, only gradually transitioning to the engine as the speed increases.
Considering the velocity profile of the WLTC cycle, we hypothesize that ICEVs experience a greater impact from frequent stopping and starting under cold start, while warm starts are more influenced by high-speed driving. This also indirectly corroborates the above proposal that, due to the higher likelihood of particle emissions during the engine start phase, cold-start PN emissions surpass those observed under warm start. Therefore, for effective control of PN emissions, particular attention should be given to PN emission rate control during start–stop phases and high-speed driving to achieve better regulation.

3.3. Effect of Driving Condition on PN Emissions

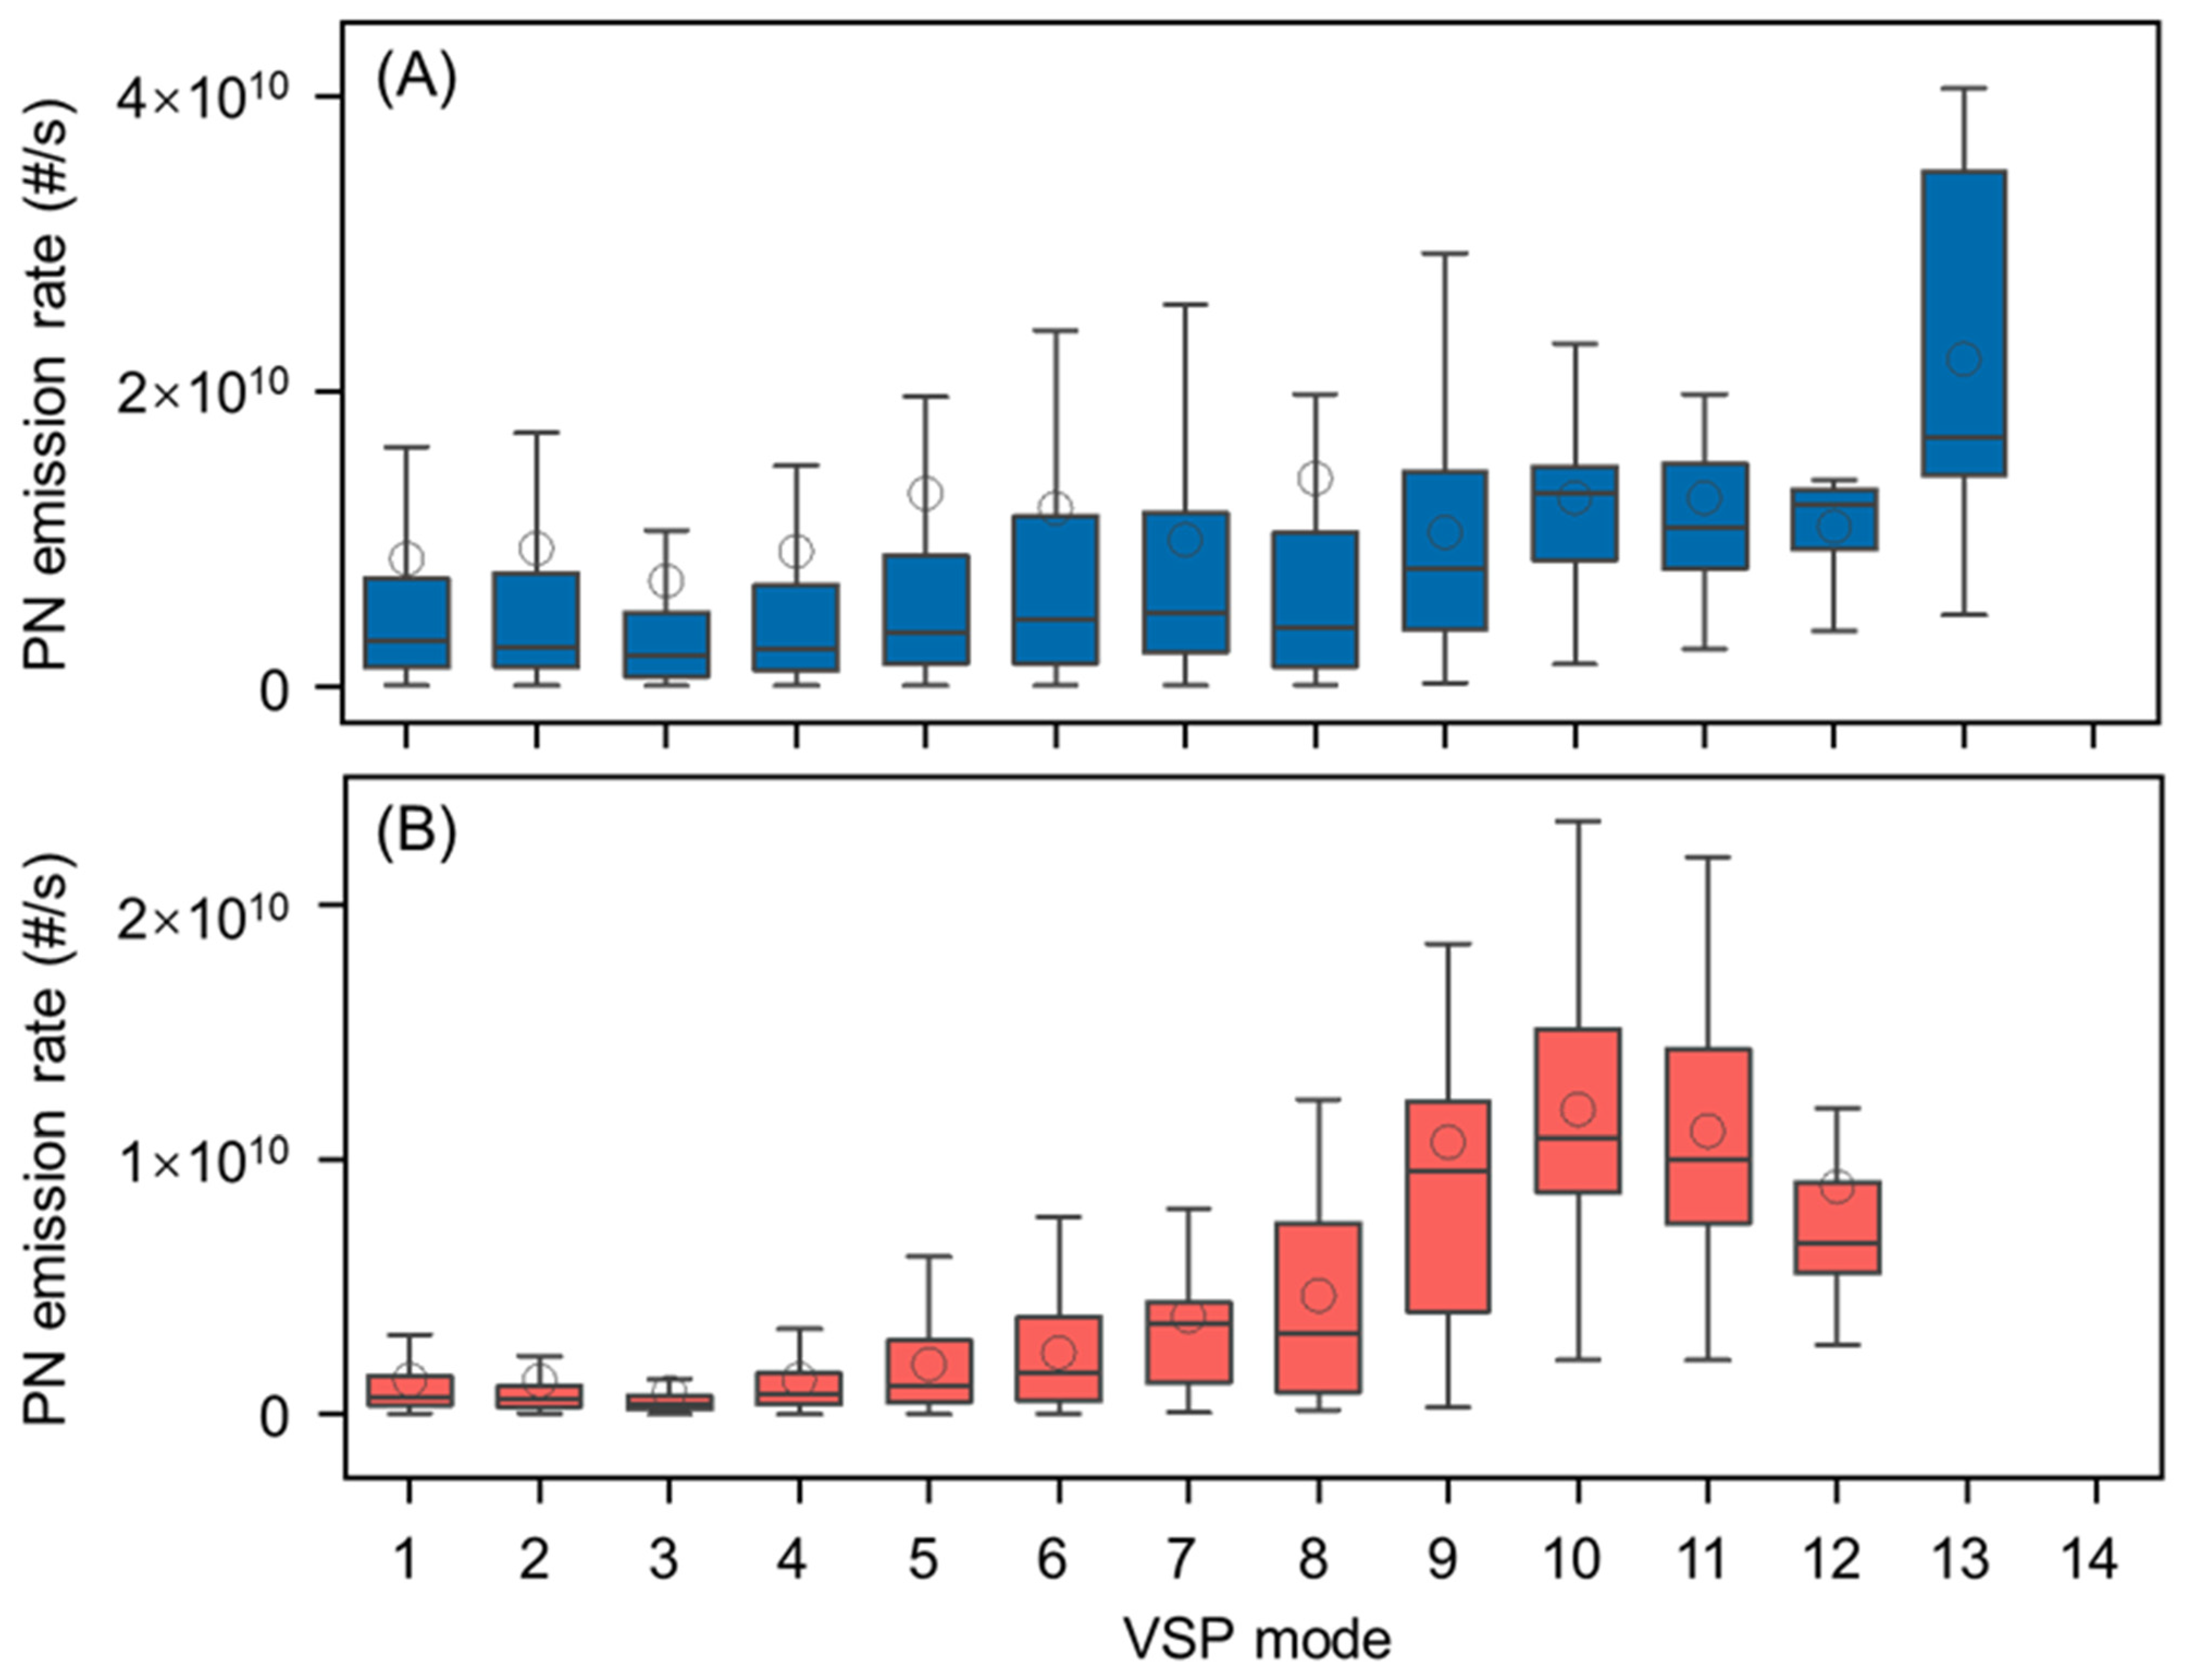
Based on the aforementioned research findings, driving characteristics emerge as a crucial factor influencing PN emissions. In this section, we delve deeper into the impact of driving conditions on PN emissions. Figure 3 depicts the PN emission rates of China VI ICEVs with GDI engines under different VSP modes under cold- and warm-start conditions based on the second-by-second operating conditions obtained in the chassis dynamometer test in this study. The missing mode 13 or 14 in Figure 3 is due to none of the VSP values being distributed in the interval corresponding to these VSP modes. The relationship between VSP and PN emission rates for China VI vehicles with GDI engines varies significantly under different start conditions. Under cold-start conditions, the mean PN emission rates exhibit a fluctuating rise with increasing VSP. In mode 13, the PN emission rate reaches its maximum, with a mean value of 2.22 × 10¹⁰ #/s. In contrast, under warm-start conditions, the PN emission rate initially increases and then decreases with rising VSP, reaching its maximum in mode 10 with a mean value of 1.20 × 10¹⁰ #/s. It is noteworthy that, regardless of cold or warm start conditions, the lowest average PN emission rates occur during idle (mode 3), rather than in low-load conditions such as deceleration (mode 1 or mode 2). The observed phenomenon arises during deceleration fuel cut-off when a portion of previously injected fuel diffuses into the cylinder walls and piston surfaces, undergoing incomplete oxidation to form fine particles [33,34,35].
In comparison, the PN average emission rates of China IV vehicles with GDI engines exhibit relatively consistent behavior during both cold- and warm-start conditions. Minimal variations in PN emission rates occur in modes 1–7 and modes 8–13, except for a conspicuous increase during the transition from mode 7 to mode 8 (Figure S5). China V vehicles with GDI engines exhibit PN emissions influenced by vehicle VSP in a manner akin to China VI vehicles with GDI engines, except for the stabilization of PN emission rates post mode 10 during warm start (Figure S6).
Yu et al. [8] reveals that, for China IV vehicles, both PFI and GDI vehicles exhibit an increase in PN emission rates with the rise of VSP modes. Notably, the PN emission rate variation in PFI models is more substantial compared to that in GDI models. Shen et al. [3] find a consistent relationship between 14 VSP modes and PN emission rates for PFI vehicles across China III, IV, and V standards. These findings are consistent with our results. However, for China VI PFI ICEVs and GDI HEVs, the median and mean PN emission rates in the same mode display substantial differences, indicating significant fluctuations in PN emission within the same mode (Figures S7 and S8). This discrepancy suggests a need for further investigation into the variability of PN emission rates within specific VSP modes.

4. Conclusions

This study employed PN emissions of nine in-use light-duty vehicles conforming to China IV, China V, and China VI emission standards covering mainstream engine techniques and different powertrain systems. Eight ICEVs and one HEV was selected in the chassis dynamometer tests by following the WLTC protocol involving low speed (Max. speed 56.5 km/h), medium speed (Max. speed 76.6 km/h), high speed (Max. speed 97.4 km/h), and extra-high speed (Max. speed 131.3 km/h). The results contribute to supplementing the PN emission factor database for Chinese vehicles, further enhancing our comprehension of vehicle PN emissions and providing a scientific foundation for sustainable development. Mileage-based emission factors, characterizing the emission levels of corresponding vehicles, are predominantly influenced by technical upgrades and cold/warm-start conditions. Further exploration was conducted on vehicular PN emission rates under different startup conditions and VSP modes.
As emission standards become more stringent, PN emission factors for ICEVs with GDI engines decrease, with a more pronounced reduction observed under warm start compared to cold start. Notably, PN emissions of China IV to China VI vehicles decreased by 74.0% and 71.1% under warm start. For China VI vehicles, ICEVs with PFI engines and HEVs with GDI engines exhibit lower PN emissions than ICEVs with GDI engines. The ratios of PN emission under cold and warm start are between 1.22 and 19.2, and the PN emissions during cold start are generally higher than those under warm start, particularly notable for China VI GDI HEVs. Further investigation into per-second PN emissions under cold and warm start conditions revealed that PN emissions for cold start are generally concentrated in the low speed, while those for warm start are typically focused on ultra-high speed. Additionally, vehicle driving conditions represented by VSP, play a crucial role in influencing PN emissions. For all the tested vehicles in this study, it is consistent that the lowest average PN emission rate occurs during idling (mode 3). For the modes above three, China IV, China V, and China VI ICEVs with GDI engines exhibited a trend of increasing PN emissions with increasing modes. However, different trends for China VI ICEVs with PFI engines and China VI HEV with GDI engines were observed, especially for cold start.
Nevertheless, there are still several limitations in this study. Firstly, the sample size for tested vehicles, especially hybrid vehicles, is relatively small, necessitating an expansion in future studies to enhance the representativeness and generalizability of our conclusions. Secondly, while our study predominantly concentrated on PN emission amounts and rates, future research could delve into a more detailed analysis of the chemical composition of particulate matter. It holds the potential to offer valuable insights into the sources and characteristics of particulate matter emissions. Additionally, it is crucial to explore the impact of additional factors, such as fuel properties, to enrich our understanding of PN emissions within the evolving automotive landscape. A more detailed evaluation of the emission characteristics of vehicles with different power types would be helpful for the sustainable development of new energy vehicles, further contributing to the formulation of effective strategies aimed at mitigating vehicular PN emissions and enhancing air quality.

Supplementary Materials

The following supporting information can be downloaded at: https://www.mdpi.com/article/10.3390/su16010012/s1.

Author Contributions

Conceptualization, X.Y. and M.F.; methodology, Y.Z., X.Y. and M.F.; formal analysis, Y.Z.; writing—original draft, Y.Z.; writing—review and editing, X.Y. and M.F.; visualization, X.Y.; supervision, X.Y. and M.F. All authors have read and agreed to the published version of the manuscript.

Funding

This work was supported by the National Key Research and Development Project of China (No, 2022YFC3701805).

Institutional Review Board Statement

Not applicable.

Informed Consent Statement

Not applicable.

Data Availability Statement

The data used in this study are available from the corresponding authors.

Conflicts of Interest

The authors declare that they have no conflict of interest.

References

  1. Yao, Y.; Chen, X.; Chen, W.; Gao, K.; Zhang, H.; Zhang, L.; Han, Y.; Xue, T.; Wang, Q.; Wang, T.; et al. Transcriptional pathways of elevated fasting blood glucose associated with short-term exposure to ultrafine particles: A panel study in Beijing, China. J. Hazard. Mater. 2022, 430, 128486. [Google Scholar] [CrossRef] [PubMed]
  2. Liu, C.; Chen, R.; Sera, F.; Vicedo-Cabrera, A.M.; Guo, Y.; Tong, S.; Coelho, M.S.Z.S.; Saldiva, P.H.N.; Lavigne, E.; Matus, P.; et al. Ambient Particulate Air Pollution and Daily Mortality in 652 Cities. N. Engl. J. Med. 2019, 381, 705–715. [Google Scholar] [CrossRef] [PubMed]
  3. Shen, X.; Shi, Y.; Kong, L.; Cao, X.; Li, X.; Wu, B.; Yao, X.; Yao, Z. Particle number emissions from light-duty gasoline vehicles in Beijing, China. Sci. Total Environ. 2021, 773, 145663. [Google Scholar] [CrossRef] [PubMed]
  4. Pant, P.; Harrison, R.M. Estimation of the contribution of road traffic emissions to particulate matter concentrations from field measurements: A review. Atmos. Environ. 2013, 77, 78–97. [Google Scholar] [CrossRef]
  5. Kittelson, D.B.; Watts, W.F.; Johnson, J.P. Nanoparticle emissions on Minnesota highways. Atmos. Environ. 2004, 38, 9–19. [Google Scholar] [CrossRef]
  6. Yang, H.-H.; Dhital, N.B.; Wang, L.-C.; Hsieh, Y.-S.; Lee, K.-T.; Hsu, Y.-T.; Huang, S.-C. Chemical Characterization of Fine Particulate Matter in Gasoline and Diesel Vehicle Exhaust. Aerosol Air Qual. Res. 2019, 19, 1439–1449. [Google Scholar] [CrossRef]
  7. Chen, F.; Hu, W.; Zhong, Q. Emissions of particle-phase polycyclic aromatic hydrocarbons (PAHs) in the Fu Gui-shan Tunnel of Nanjing, China. Atmos. Res. 2013, 124, 53–60. [Google Scholar] [CrossRef]
  8. Yu, F.; Zhong, Z.; Wang, Q.; Liao, S.; Zhu, M.; Sha, Q.e.; Liu, J.; Zheng, J. Characterizing the particle number emissions of light-duty gasoline vehicles under different engine technologies and driving conditions. Environ. Res. 2022, 213, 113648. [Google Scholar] [CrossRef]
  9. Chan, T.W.; Hendren, J.; Brezny, R.; Gunter, G.C.; Lax, D.; Kubsh, J. Assessment of particle and gaseous emissions and reductions from gasoline direct injection passenger car and light-duty truck during passive regeneration. Sci. Total Environ. 2022, 843, 156994. [Google Scholar] [CrossRef]
  10. Chen, L.; Liang, Z.; Zhang, X.; Shuai, S. Characterizing particulate matter emissions from GDI and PFI vehicles under transient and cold start conditions. Fuel 2017, 189, 131–140. [Google Scholar] [CrossRef]
  11. He, L.; Hu, J.; Zhang, S.; Wu, Y.; Zhu, R.; Zu, L.; Bao, X.; Lai, Y.; Su, S. The impact from the direct injection and multi-port fuel injection technologies for gasoline vehicles on solid particle number and black carbon emissions. Appl. Energy 2018, 226, 819–826. [Google Scholar] [CrossRef]
  12. Zhu, R.; Hu, J.; Bao, X.; He, L.; Lai, Y.; Zu, L.; Li, Y.; Su, S. Tailpipe emissions from gasoline direct injection (GDI) and port fuel injection (PFI) vehicles at both low and high ambient temperatures. Environ. Pollut. 2016, 216, 223–234. [Google Scholar] [CrossRef] [PubMed]
  13. Kontses, A.; Triantafyllopoulos, G.; Ntziachristos, L.; Samaras, Z. Particle number (PN) emissions from gasoline, diesel, LPG, CNG and hybrid-electric light-duty vehicles under real-world driving conditions. Atmos. Environ. 2020, 222, 117126. [Google Scholar] [CrossRef]
  14. Zinsmeister, J.; Storch, M.; Melder, J.; Richter, S.; Gaiser, N.; Schlichting, S.; Naumann, C.; Schuenemann, E.; Aigner, M.; Osswald, P.; et al. Soot formation of renewable gasoline: From fuel chemistry to particulate emissions from engines. Fuel 2023, 348, 128109. [Google Scholar] [CrossRef]
  15. Liu, S.; Zhang, H.; Fan, Q.; Wang, W.; Qi, Y.; Wang, Z. Investigation of combustion and particle number (PN) emissions in a spark induced compression ignition (SICI) engine for ethanol-gasoline blends. Fuel 2022, 316, 123155. [Google Scholar] [CrossRef]
  16. Dimaratos, A.; Toumasatos, Z.; Triantafyllopoulos, G.; Kontses, A.; Samaras, Z. Real-world gaseous and particle emissions of a Bi-fuel gasoline/CNG Euro 6 passenger car. Transp. Res. Part D-Transp. Environ. 2020, 82, 102307. [Google Scholar] [CrossRef]
  17. Gao, J.; Wang, Y.; Chen, H.; Laurikko, J.; Liu, Y.; Pellikka, A.-P.; Li, Y. Variations of significant contribution regions of NOx and PN emissions for passenger cars in the real-world driving. J. Hazard. Mater. 2022, 424, 127590. [Google Scholar] [CrossRef]
  18. Prati, M.V.; Costagliola, M.A. Real driving emissions of Euro 6 electric/gasoline hybrid and natural gas vehicles. Transp. Res. Part D Transp. Environ. 2022, 113, 103509. [Google Scholar] [CrossRef]
  19. Blickwede, J.; Tousen, M.; Droste, T.; VDI Berichte. C-NCAP vs. EuroNCAP—First experiences and estimations. In Proceedings of the 6th International VDI Congress on Car Safety, Berlin, Germany, 18–19 October 2007; pp. 219–229. [Google Scholar]
  20. Liu, Y.; Wu, Z.X.; Zhou, H.; Zheng, H.; Yu, N.; An, X.P.; Li, J.Y.; Li, M.L. Development of China Light-Duty Vehicle Test Cycle. Int. J. Automot. Technol. 2020, 21, 1233–1246. [Google Scholar] [CrossRef]
  21. Zhou, B.; Chen, C.; Zhao, S.; Wang, Y.; Zhao, Q.; Zhao, R. A Research on the Establishment of Automated Driving Scenario Database using Natural Language Processing Method. In Proceedings of the International Conference on Image, Video Processing and Artificial Intelligence, Shanghai, China, 21–23 August 2020. [Google Scholar]
  22. Wu, X.; Zhang, S.; Guo, X.; Yang, Z.; Liu, J.; He, L.; Zheng, X.; Han, L.; Liu, H.; Wu, Y. Assessment of ethanol blended fuels for gasoline vehicles in China: Fuel economy, regulated gaseous pollutants and particulate matter. Environ. Pollut. 2019, 253, 731–740. [Google Scholar] [CrossRef]
  23. Wang, Y.; Hao, C.; Ge, Y.; Hao, L.; Tan, J.; Wang, X.; Zhang, P.; Wang, Y.; Tian, W.; Lin, Z.; et al. Fuel consumption and emission performance from light-duty conventional/hybrid-electric vehicles over different cycles and real driving tests. Fuel 2020, 278, 118340. [Google Scholar] [CrossRef]
  24. Frey, H.C.; Rouphail, N.M.; Zhai, H. Speed- and Facility-Specific Emission Estimates for On-Road Light-Duty Vehicles on the Basis of Real-World Speed Profiles. Transp. Res. Rec. 2006, 1987, 128–137. [Google Scholar] [CrossRef]
  25. Saliba, G.; Saleh, R.; Zhao, Y.L.; Presto, A.A.; Larnbe, A.T.; Frodin, B.; Sardar, S.; Maldonado, H.; Maddox, C.; May, A.A.; et al. Comparison of Gasoline Direct-Injection (GDI) and Port Fuel Injection (PFI) Vehicle Emissions: Emission Certification Standards, Cold-Start, Secondary Organic Aerosol Formation Potential, and Potential Climate Impacts. Environ. Sci. Technol. 2017, 51, 6542–6552. [Google Scholar] [CrossRef] [PubMed]
  26. Li, C.G.; Swanson, J.; Pham, L.; Hu, S.H.; Hu, S.S.; Mikailian, G.; Jung, H.S. Real-world particle and NOx emissions from hybrid electric vehicles under cold weather conditions. Environ. Pollut. 2021, 286, 10. [Google Scholar] [CrossRef]
  27. Lv, Z.; Peng, J.; Zhang, J.; Yang, L.; Guo, D.; Wei, N.; Wu, Y.; Fang, T.; Song, A.; Fan, C.; et al. Particulate emissions from gasoline vehicles using three different fuel injection technologies. J. Clean. Prod. 2023, 418, 138123. [Google Scholar] [CrossRef]
  28. Jose, J.V.; Ramesh, A.; Mittal, M.; Bhat, S.S.; Parsi, A. Effect of Fuel Injection Timing on the Mixture Preparation in a Small Gasoline Direct-Injection Engine. In Proceedings of the Small Engine Technology Conference and Exhibition, Dusseldorf, Germany, 6–8 November 2018. [Google Scholar]
  29. Favre, C.; Bosteels, D.; May, J. Exhaust Emissions from European Market-Available Passenger Cars Evaluated on Various Drive Cycles. In Proceedings of the International Conference on Engines and Vehicles, Naples, Italy, 15–19 September 2013. [Google Scholar]
  30. Zhai, Z.Q.; Xu, J.S.; Zhang, M.Q.; Wang, A.; Hatzopoulou, M. Quantifying start emissions and impact of reducing cold and warm starts for gasoline and hybrid vehicles. Atmos. Pollut. Res. 2023, 14, 13. [Google Scholar] [CrossRef]
  31. Yang, Z.; Ge, Y.; Thomas, D.; Wang, X.; Su, S.; Li, H.; He, H. Real driving particle number (PN) emissions from China-6 compliant PFI and GDI hybrid electrical vehicles. Atmos. Environ. 2019, 199, 70–79. [Google Scholar] [CrossRef]
  32. Qian, R. Particulate matter emissions from hybrid gasoline vehicles. Atmos. Environ. 2018, 199, 70–79. [Google Scholar]
  33. Mohsin, R.; Longfei, C.; Felix, L.; Shiting, D. A Review of Particulate Number (PN) Emissions from Gasoline Direct Injection (GDI) Engines and Their Control Techniques. Energies 2018, 11, 1417. [Google Scholar]
  34. Attar, M.A.; Xu, H. Correlations between particulate matter emissions and gasoline direct injection spray characteristics. J. Aerosol Sci. 2016, 102, 128–141. [Google Scholar] [CrossRef]
  35. Fushimi, A.; Kondo, Y.; Kobayashi, S.; Fujitani, Y.; Saitoh, K.; Takami, A.; Tanabe, K. Chemical composition and source of fine and nanoparticles from recent direct injection gasoline passenger cars: Effects of fuel and ambient temperature. Atmos. Environ. 2016, 124, 77–84. [Google Scholar] [CrossRef]
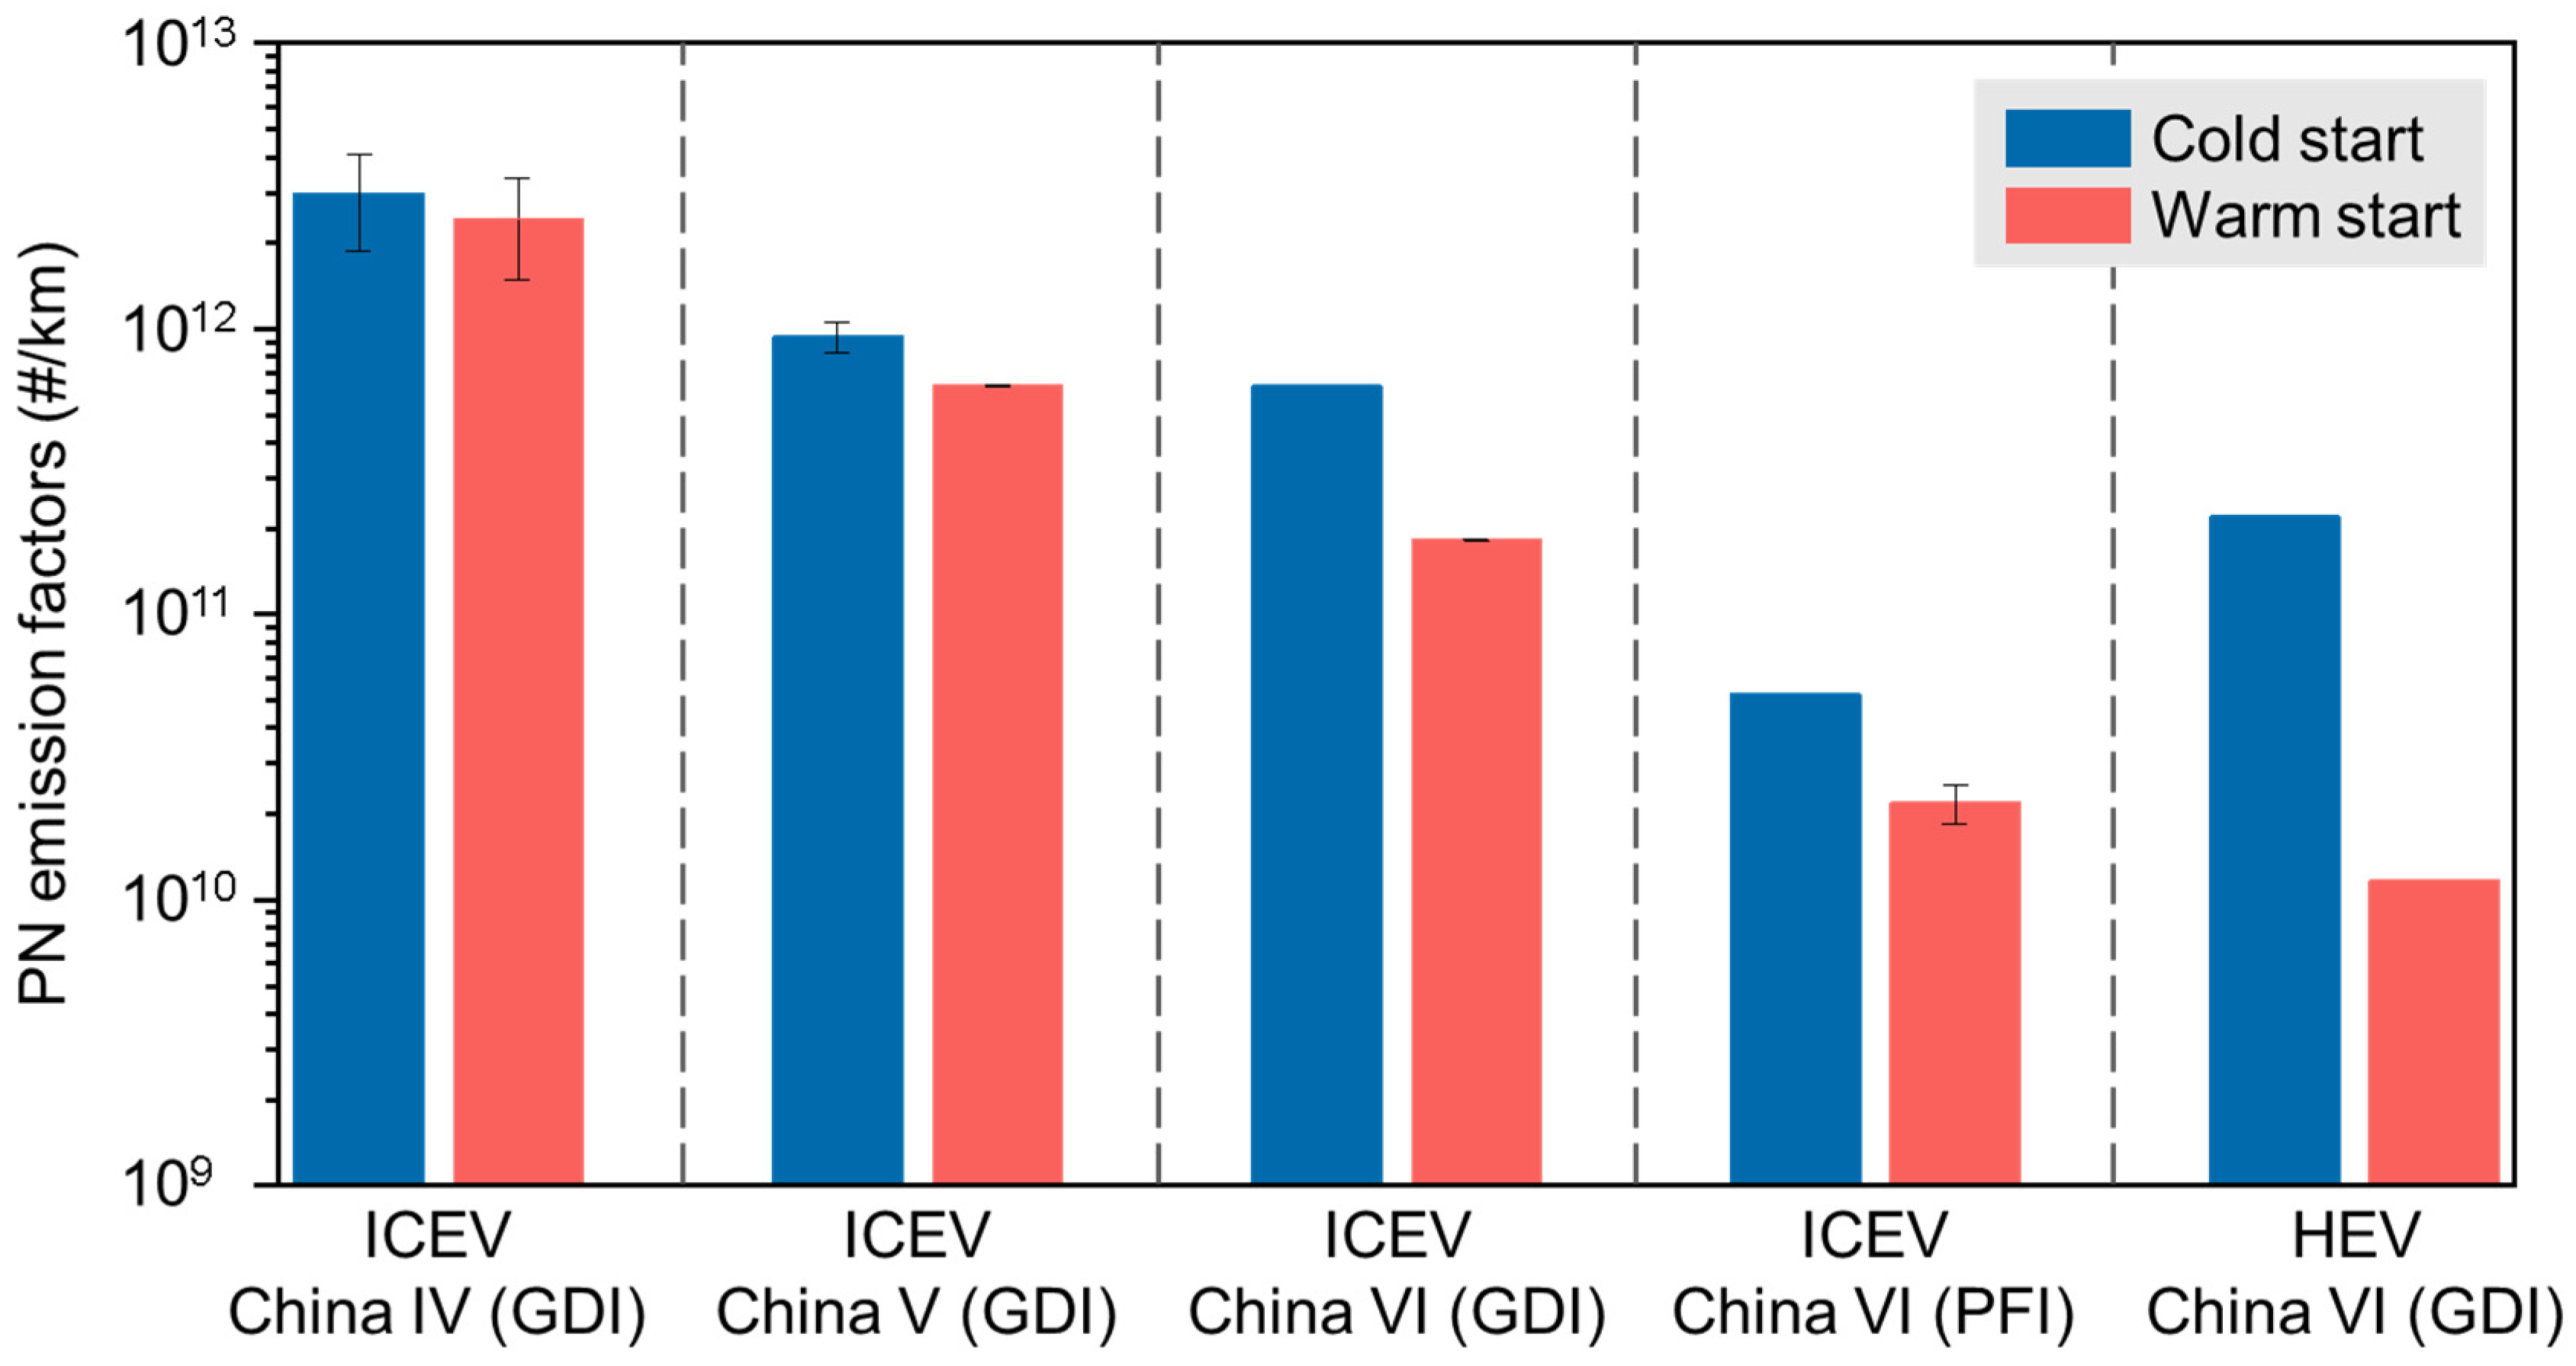
Figure 1. PN emission factors based on mileage for the tested vehicles covering different emission standards, engine techniques, powertrains, and startup stages.
Sustainability 16 00012 g001
Figure 2. Instantaneous PN emission rate and vehicle speed for China VI ICEV with GDI engines at cold-start (A) and warm-start (B) stages. The pie charts represent the distribution of cumulative emissions for the four speed phases in the entire WLTC.
Sustainability 16 00012 g002
Figure 3. Emission rate under different vehicle specific power modes for China VI ICEVs with GDI engines at cold-start (A) and warm-start (B) stages. The box-whisker plots give the median, the 75th and 25th percentiles, and 1.5 times Inter-Quartile Range (IQR). The circles show the mean values of PN emissions.
Sustainability 16 00012 g003
Table 1. Specifications of the light-duty vehicles in this study. Some information for vehicle #3 was missing.
Vehicle IDCategoryModel YearEmission StandardEngine TechnologyDisplacement
(mL)
Mileage
(104 km)
Max. Net Engine Power (kW)Max. Authorized Mass (kg)After Treatment
#1ICEV2011China IVGDI179822.11182000TWC
#2ICEV2011China IVGDI139012.6961930TWC
#3ICEV--China VGDI17988.0----TWC
#4ICEV2018China VGDI179814.71322100TWC
#5ICEV2022China VIGDI14902.9891740TWC
#6ICEV2022China VIGDI14905.2891740TWC
#7ICEV2021China VIPFI14986.6831725TWC
#8ICEV2021China VIPFI14985.5831725TWC
#9HEV2022China VIGDI17982.7721845TWC
Disclaimer/Publisher’s Note: The statements, opinions and data contained in all publications are solely those of the individual author(s) and contributor(s) and not of MDPI and/or the editor(s). MDPI and/or the editor(s) disclaim responsibility for any injury to people or property resulting from any ideas, methods, instructions or products referred to in the content.