Article

Experimental Study on Thermo-Mechanical Behavior of a Novel Energy Pile with Phase Change Materials Using Fiber Bragg Grating Monitoring

Key Laboratory of Coastal Urban Resilient Infrastructures of the Ministry of Education, College of Civil and Transportation Engineering, Shenzhen University, Shenzhen 518060, China
*
Author to whom correspondence should be addressed.
Sustainability 2024, 16(1), 206; https://doi.org/10.3390/su16010206
Submission received: 30 October 2023 / Revised: 20 December 2023 / Accepted: 21 December 2023 / Published: 25 December 2023

Abstract

:
The combination of phase change materials (PCMs) with building materials is a flourishing technology owing to the low-temperature change of the materials during phase change and the potential for enhanced heat storage and release. In this study, a new type of PCM energy pile, in which 20 stainless steel tubes (22 mm in diameter and 1400 mm in length) filled with paraffin were bound to heat exchange tubes, was proposed. An experimental system monitored by a fiber Bragg grating (FBG) to study the thermo-mechanical behavior of energy piles and surrounding soil was established. Both the PCM pile and the ordinary pile, with the same dimensions, were tested under the same experimental conditions for comparison. The results indicate that the temperature sensitivity coefficient calibration results of the FBG differ from the typical values by 8%. The temperature variation is more obvious in the ordinary pile and surrounding soil. The maximum thermal stress of the ordinary energy pile is 0.5~0.6 times larger than that of the PCM pile under flow rates ranging from 0.05 m3/h to 0.25 m3/h. The magnitudes of the pore water pressure and soil pressure variations were positively correlated with the flow rates.

1. Introduction

An energy pile is a typical geothermal structure that can simultaneously carry superstructure loads and pile-soil heat transfer [1]. Compared to conventional ground-source heat pumps, energy piles are a kind of improved ground-source heat pump system in which pipes are buried in the pile foundation instead of a complex network of heat transfer pipes in the soil. This technology can save drilling costs and protect heat transfer pipes, showing great application potential in global energy conservation and carbon emission reduction.
Through field tests or laboratory experiments, the thermal response of energy piles and surrounding soils has been studied by many experts [2,3,4,5]. In the field tests, Laloui et al. [6] conducted an experimental study of the stress-strain characteristics of piles under coupled temperature-structure loading and found that the additional thermal stress exceeded the maximum internal stress of the pile when the superstructure load was applied due to thermal effects. Faizal et al. [7,8] conducted a temperature cyclic loading study on energy piles in a 6-story building and found that the pile axial stresses were mainly caused by axial thermal strains, and the magnitude of the axial stresses depended on the pile end restraint. Brandl et al. [1] found that not only does the pile temperature change during heat transfer, but also the pile-soil interface might cause engineering problems during heat transfer from the pile to the soil. Laloui et al. [9] investigated the pile-soil interface interaction and group pile response during temperature changes through a combination of laboratory and field tests. Yang et al. [10] also investigated the thermo-mechanical behavior of an energy pile group operated in heat release mode. Murphy et al. [11] found that the frictional resistance of piles is clearly affected by temperature variations and suggested that different restraint conditions would result in different internal force distributions in the pile. Suryatriyastuti et al. [12] analyzed the variation pattern of pile thermal friction resistance under different pile-soil contact interface conditions through numerical simulations; their results were consistent with those of field tests conducted by Bourne–Webb [13] at Lambeth College, UK. Xiong et al. [14] conducted field tests on super-long energy piles of 1 m in diameter and 44 m in length to investigate the thermo-mechanical behavior of the energy piles buried in clay under temperature loading. They found that significant excess pore water pressure was induced in the continuous heating process, and the pore water pressure changed more obviously when the soil permeability was small. According to the above study, it was found that the pile temperature and the magnitude of pile deformation generated during the heat exchange process are large, which will potentially adversely affect the structural safety of energy piles.
Recently, phase change materials (PCMs) have been widely used in building energy efficiency owing to their ability to store or release large amounts of energy during the phase change process without significant temperature changes [15,16,17,18,19]. Furthermore, several researchers have incorporated PCM into the backfill materials of ground-source heat pump systems and investigated their thermo-mechanical response owing to the high energy density of PCM [20,21,22,23]. The results indicate that incorporating PCM can reduce the radius of the thermal influence of the heat pump, reduce the required soil heat transfer area, save underground space resources, and improve the amount of exchange heat to a certain extent. PCM energy piles were proposed by Bao et al. [24], and Yang et al. [25] added PCM to a cementitious base to develop a cementitious composite for energy piles and study its thermal properties. Han et al. [26] performed numerical calculations and found that the addition of PCM to ordinary energy piles can significantly improve their thermal performance and remarkably reduce the number of piles required for heat exchange. Mousa et al. [27] studied the influence of operating conditions on the thermal storage capacity of PCM energy piles through small-scale model experiments and numerical calculations; the results revealed that the thermal storage capacity of PCM piles is 2.4 to 2.6 times higher than that of ordinary piles. Therefore, adding PCM to ordinary piles is a potential solution to the challenges that have prevented the adoption of energy pile technology. However, a review of previous research on energy piles reveals that experimental investigations on the incorporation of PCM into energy piles are limited, especially the lack of research on the thermal response of the PCM energy pile and surrounding soils. Simultaneously, the limited experimental studies on PCM energy piles suffer from deficiencies, such as the small size of the test piles and the model boxes being susceptible to boundary disturbances.
On the other hand, strain sensors used in structural health monitoring are usually affected by temperature variations. Less attention was paid to the adverse effects of temperature variations on the measurement results when using strain sensors. Nevertheless, the temperature change of energy piles varies considerably during operation. Most of the strain transducers in the pile are made of heat-sensitive materials; the temperature effect on the strain transducers should be calibrated to eliminate incorrect temperature output caused by changes in room temperature during measurement. Additionally, different types of strain sensors have different degrees of sensitivity to temperature and influencing factors. For example, conventional electrical resistance strain (ERS) gauges are highly sensitive to temperature changes. The monitoring results are influenced by the thermal expansion of the electrical resistance of the resistive sensor itself, the temperature characteristics of the resistivity of the material, and the thermal expansion of the wire. These factors are mixed together, and it is not easy to compensate for the temperature of ERS gauges. Therefore, suitable sensors for strain monitoring in energy piles should be selected, and the thermal effects of sensor measurements should be examined. Newly developed measurement techniques, such as fiber-optic sensors, have been used to monitor strains in structures [28,29]. Compared to conventional sensors, such as vibro-wire strain gauges (VWSG) and ERS, fiber optic sensors are a better alternative. The advantages of fiber optic sensors include resistance to electromagnetic fields, resistance to water, simultaneous multi-point sensing, and the potential for reliable long-term monitoring [30].
Therefore, based on the above considerations, this study focuses on investigating the thermo-mechanical performance of a novel PCM energy pile buried in saturated sand, utilizing a large-scale model experiment. A new method for integrating PCM into an energy pile was introduced. The thermal response of a model PCM energy pile is compared to that of an ordinary energy pile to examine the differences. The PCM is securely enclosed within steel tubes and connected to heat exchange pipes, resulting in a practical and cost-effective solution for implementation in pile engineering. Furthermore, a specially designed self-aware rebar equipped with FBG (Fiber Bragg Grating) sensors was developed. The FBG sensors were calibrated for temperature and strain readings to guarantee the accuracy and reliability of the monitoring data. Heating tests were conducted on both the PCM energy pile and the ordinary pile under identical working conditions to facilitate meaningful comparisons. The objective of this study is to provide valuable insights for the engineering application of PCM energy piles to improve the utilization efficiency of shallow geothermal energy.

2. Description of Model Experiments

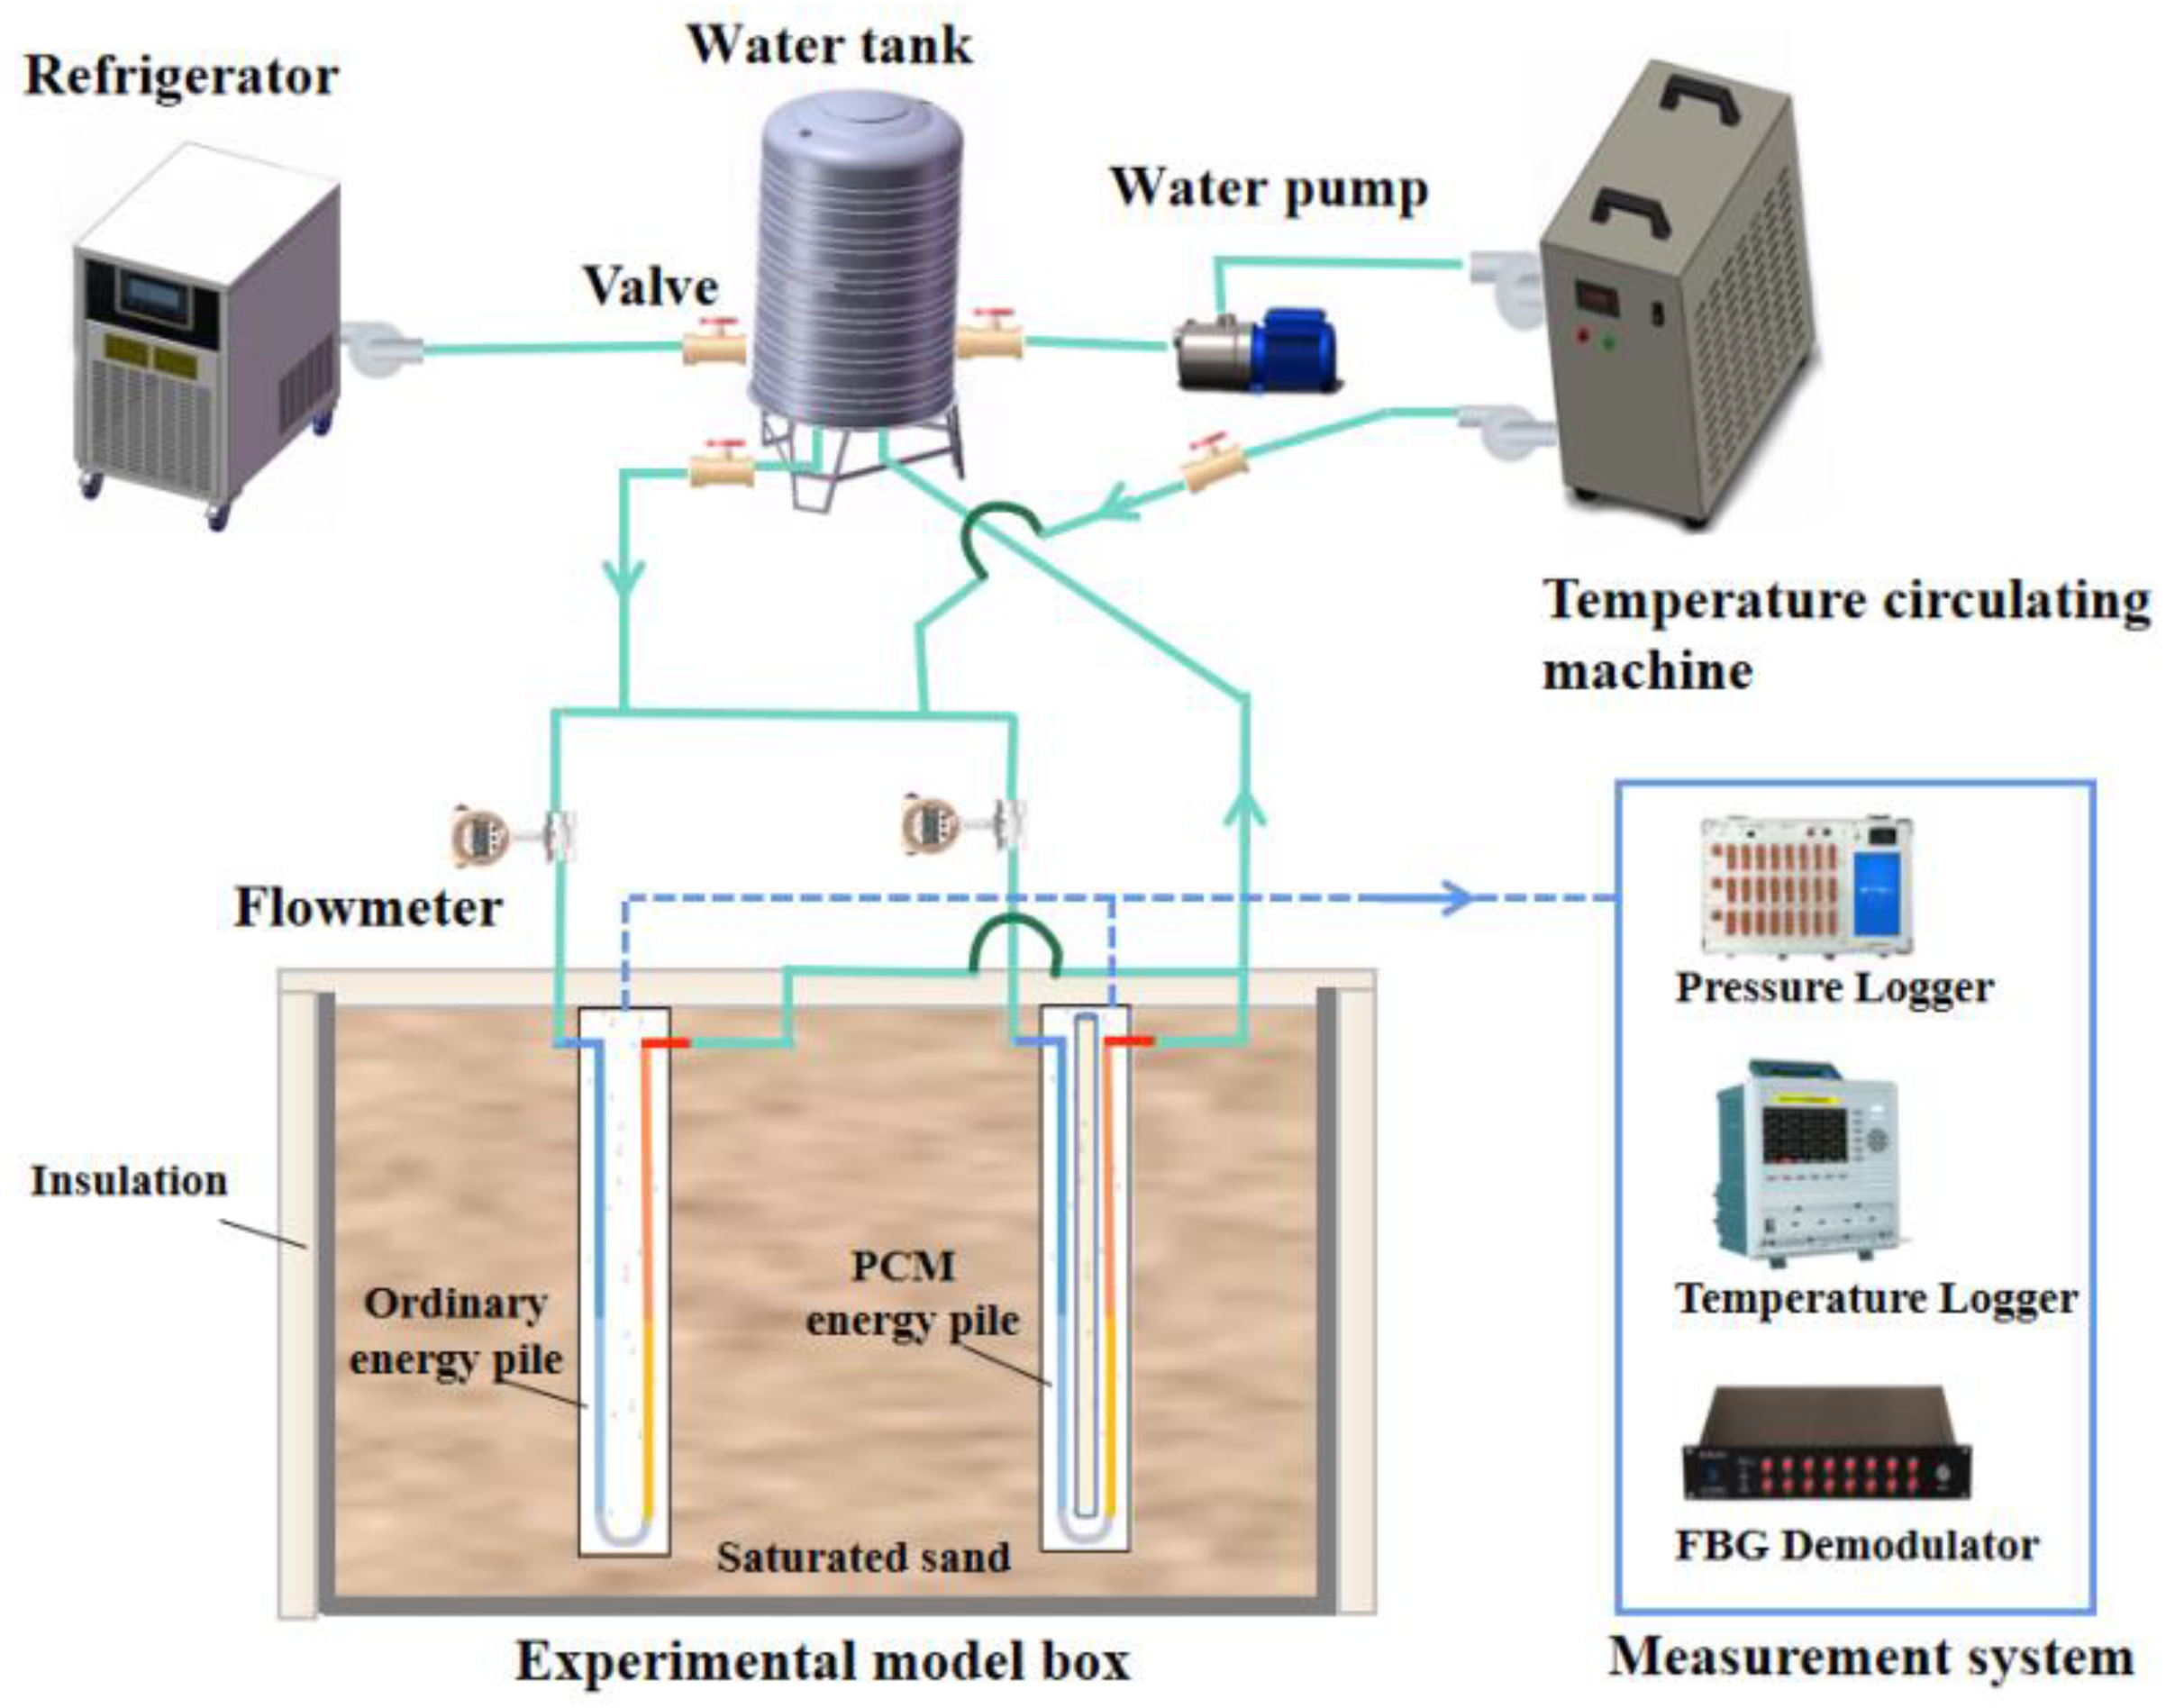
2.1. Experimental Systems

The model experimental system includes a model tank to fill soil and piles, a temperature-controlled circulation system, and a measurement system, as shown in Figure 1. The outside and top of the model tank (2.5 m in length, 2.5 m in width, and 2.0 m in height) are laminated with a 5 cm thick insulation material. The temperature-controlled circulation system consists of a cooling machine, heating machine, water pump, water tank, and circulating fluid. The temperature range of the heating machine was 20–120 °C, and that of the cooling machine was 5–35 °C; both have a control accuracy of 0.1 °C. The water temperature in the control chamber could be precisely controlled by operating the control panel. The temperature in the piles and soil were measured through thermocouples, and the soil pressure and pore water pressure in the soil surrounding the piles were also measured. FBG was selected for the strain measurement of piles. FBG data acquisition were completed by the FBG acquisition instrument produced by NanZee Sensing Technology, which can accurately output the wavelength change of FBG. After the reinforcement steel used in piles is laser grooved, the FBG sensors are embedded in the reinforcement steel of the pile and encapsulated with epoxy resin, as shown in Figure 2.

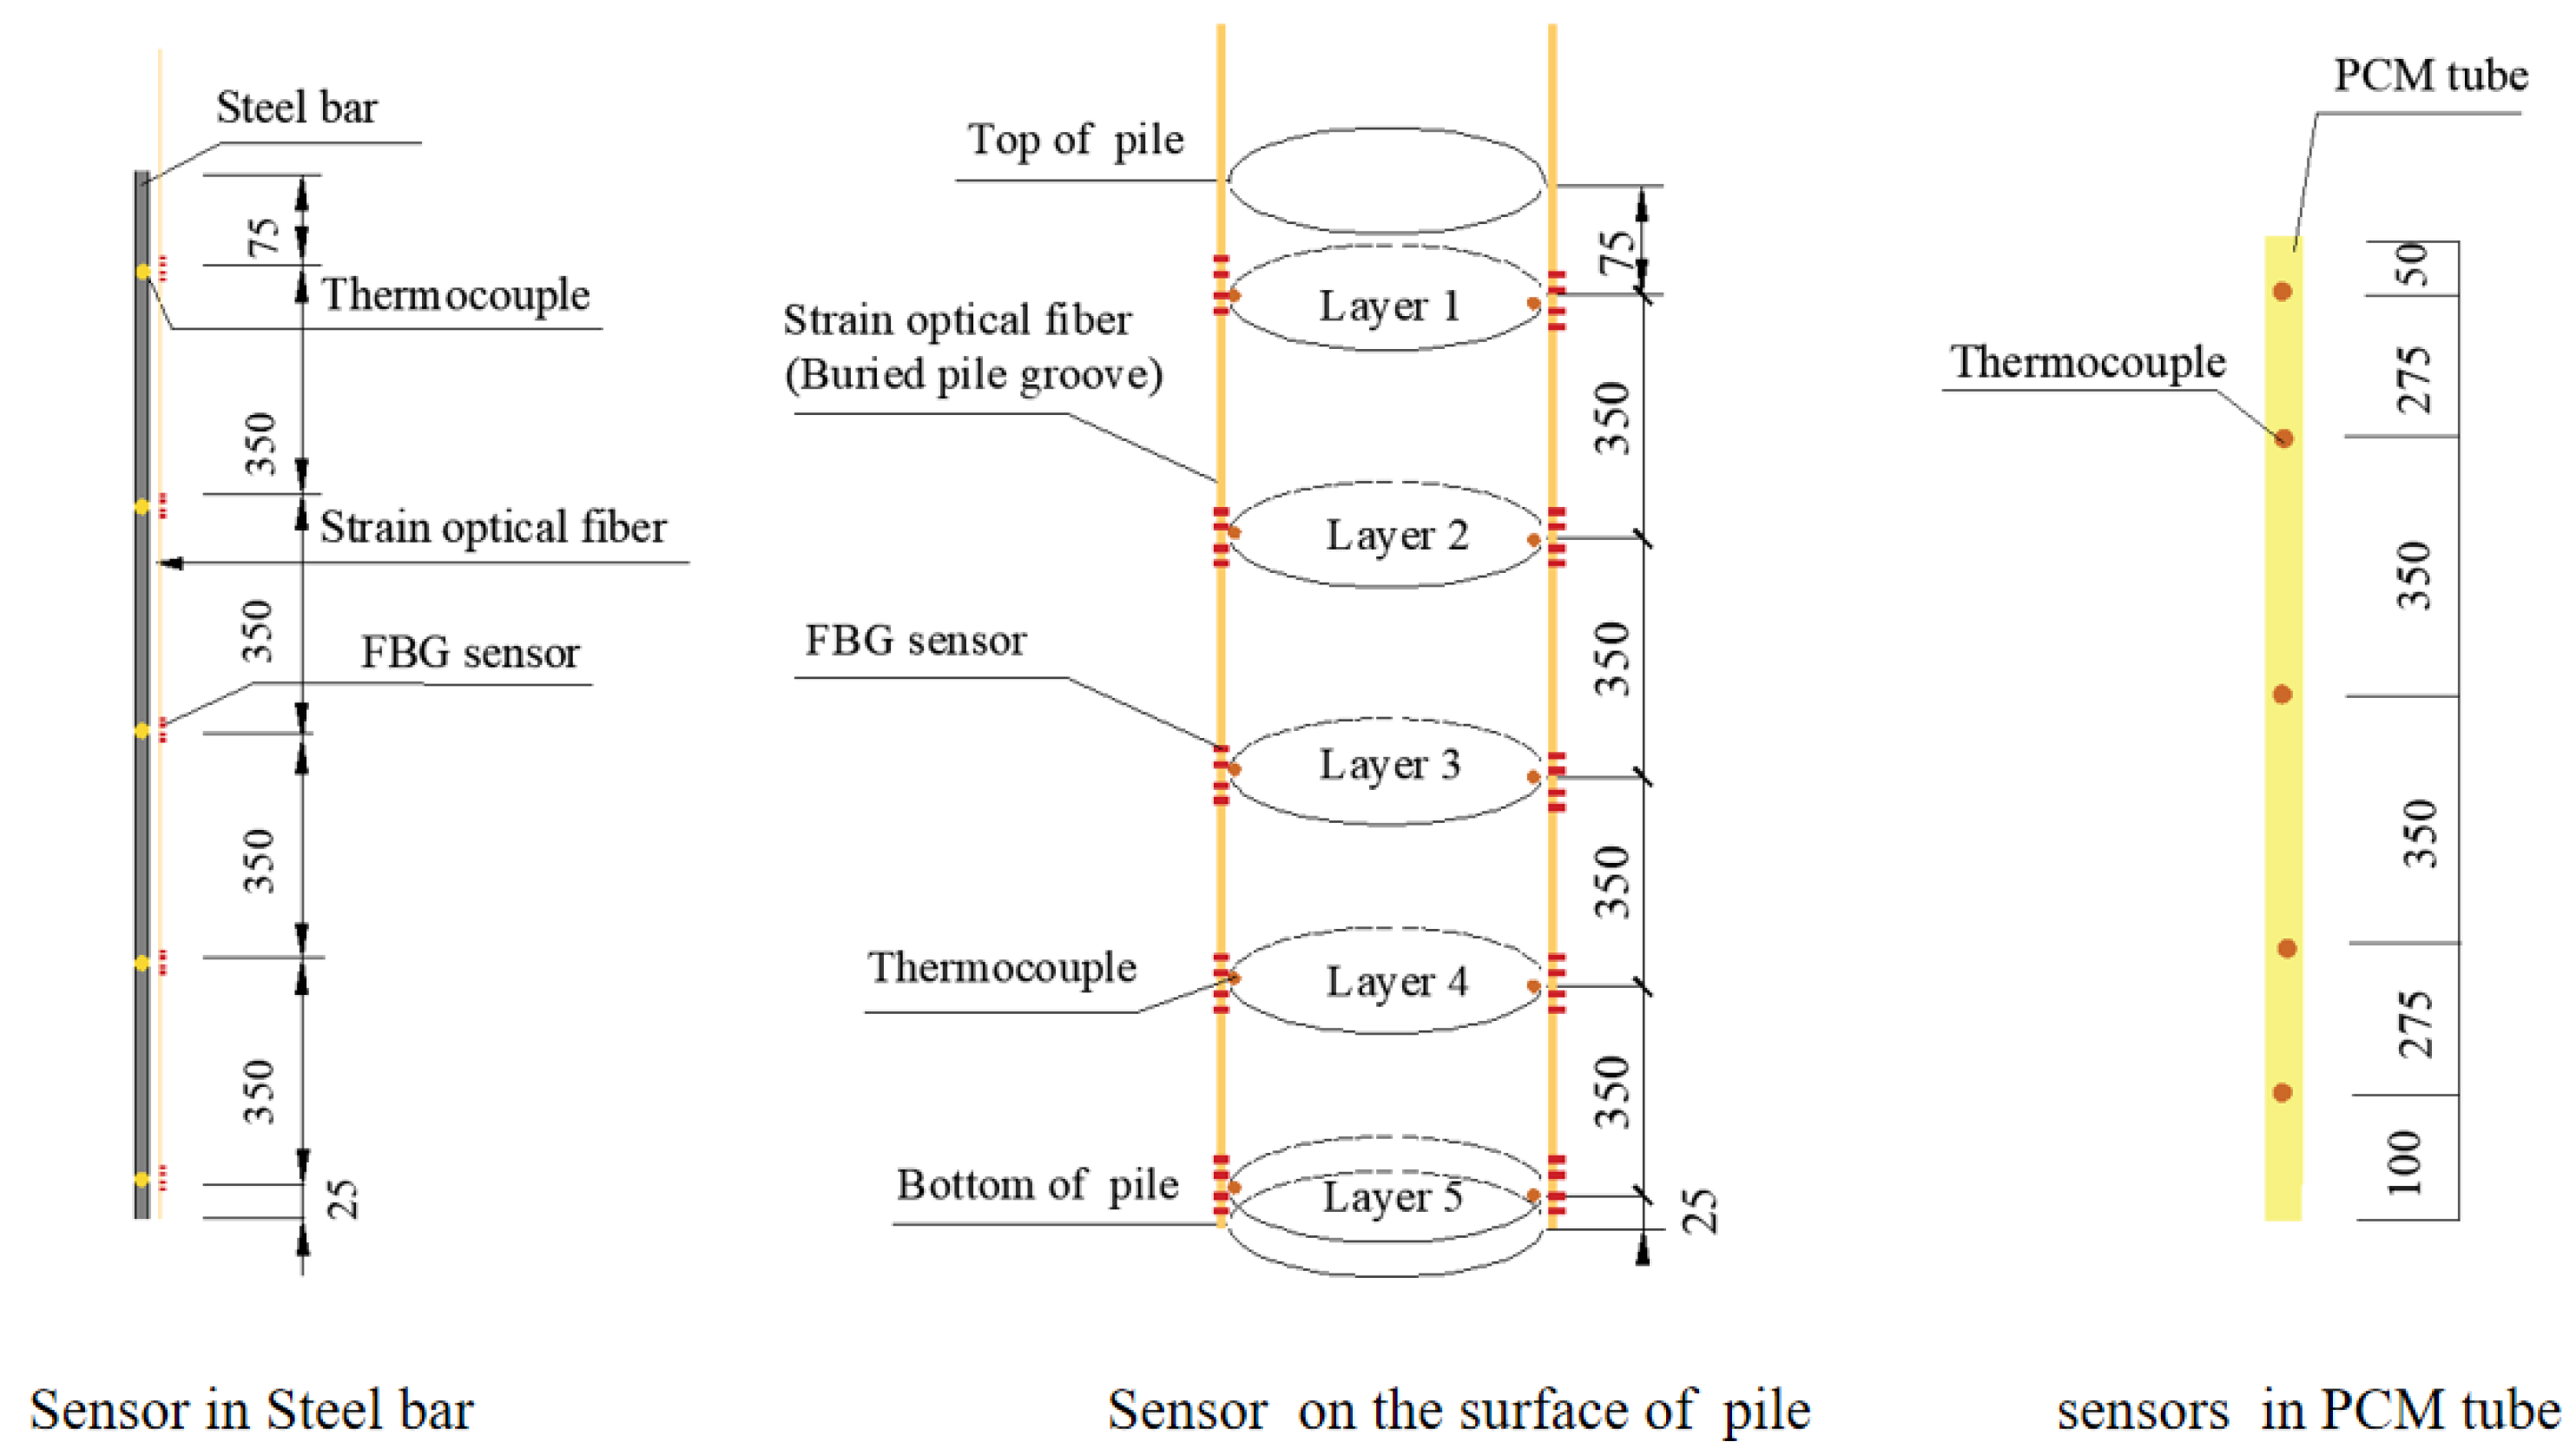
2.2. Model Piles and Sensor Arrangements

Two model piles were tested in the experiment to make a comparison. One was an ordinary concrete pile without PCM, and the other was a PCM energy pile in which 20 tubes (22 mm in diameter, 1.5 mm in thickness, made of stainless steel) filled with PCM were bonded to the steel in the pile. The concrete mixes for the two types of energy piles are shown in Table 1. The cross sections of the PCM pile and ordinary pile are shown in Figure 3. The two piles had the same dimensions: a diameter of 200 mm and a length of 1500 mm. Each pile was arranged with four steel bars (green in Figure 3) of 8 mm in diameter to fix the FBG strain sensors and temperature sensors. Each model pile contained a parallel, double-U-shaped heat exchange tube with a diameter of 20 mm (see color in Figure 3). A small amount of steel fiber was added to the PCM pile to improve the heat exchange. When making the PCM pile, sensors were first attached to the reinforcement steel bar; then, the steel bar and PCM tubes (yellow color in Figure 3) were fixed to the double U-shaped heat exchange tube, and finally, the steel bar, PCM tubes, and heat exchange tubes were placed together in a PVC mold. The prepared steel fiber concrete was poured into the PCV mold to form the pile. The same steps were followed to create an ordinary concrete pile. The process of making the energy piles is shown in Figure 4.
Thermocouples and FBG strain sensors were arranged inside and on the surface of the pile to monitor the temperature and strain changes of the pile. The sensors inside the pile were mainly located in the four reinforcement steel bars, as shown in Figure 3. Each reinforcement steel was grooved by a laser machine with a groove size of 0.6 mm (width height), followed by FBG strain sensors buried in the groove of the reinforcement steel. The FBG strain sensors on each reinforcement steel bar had five measurement points, as shown in Figure 5, and thermocouples near each measurement point for temperature compensation of the FBG sensors and temperature monitoring inside the pile were attached. To understand the phase change of the PCM inside the PCM tubes, five thermocouples were inserted inside the tubes to monitor the temperature change, as shown in Figure 5. Figure 6a shows the arrangement of the temperature sensors in the soil. Figure 6b shows the arrangement of soil pressure cells and pore pressure gauges. It is worth noting that the side length of the model box was 2450 mm and its diagonal length was 3465 mm. The sensors for monitoring the thermal response of the soil were arranged along the diagonal of the model box.

2.3. Calibration of Sensors

2.3.1. Temperature Calibration of FBG

When the external temperature changes, the central wavelength ( λ B ) of the FBG shifts. There are two main aspects: (1) the thermal expansion effect, that is, the thermal expansion of the optical fiber material due to temperature changes; (2) the thermo-optical effect, that is, the change in the optical properties of the fiber due to temperature changes. When the central wavelength change is caused only by the change in the room temperature ( T ) without external forces, the FBG fiber sensitivity ( K T ) is given by:
K T = λ B T · λ B = α + ξ    
where λ B is the wavelength variation. Commonly, for germanium-doped quartz fibers, the thermal expansion coefficient α of the bare fiber is approximately 0.5 × 10⁻⁶/°C, and the thermal-optical coefficient ξ of the fiber at room temperature is approximately 6.7 × 10⁻⁶/°C [31], which gives an estimated typical sensitivity ( K T ) of 7.2 × 10⁻⁶/°C for FBG at room temperature. The FBG temperature-sensitivity coefficient for a central wavelength of λ B   is = KT∙λB. Combined with Equation (1), the wavelength variation ( λ B ) is given by
λ B = α T · T
where T is the variation in room temperature. Thus, it can be found that the offset of the FBG wavelength changes linearly with the temperature change. However, the temperature sensitivity coefficients of fiber-optic gratings vary in practice owing to the different fiber writing and annealing processes. In general, when using a fiber-optic grating sensor, the temperature sensitivity coefficient should first be calibrated.
The temperature calibration experiments used the high- and low-temperature test chamber produced by Guangzhou-GWS Environmental Equipment Co., Ltd. (Guangzhou, China) for the temperature calibration of the optical fibers, as shown in Figure 7a. The temperature measurement range of the chamber was −40 to +150 °C. Before the temperature calibration tests, a bare fiber with five measurement points was placed in the test chamber. The temperature in the test chamber was monitored using a thermocouple. In the tests, the temperature in the chamber first rose to 60 °C and then decreased to 0 °C, as shown in Figure 7b. The wavelength range of the five measurement points of the bare fiber in the calibration experiment was 1533–1553 nm. Therefore, =0.01110 nm/°C is the average value of the theoretical calculation of the sensor sensitivity coefficient. Figure 8 shows the linear fit curve for the temperature characteristics of the FBG for the calibration experiment. It can be seen that the FBG sensor exhibits a well-fitted linear relationship from 0 to 60 °C. However, α T , a c t u a l = 0.01021 nm/°C is the average value of the sensitivity factor obtained from the test, as listed in Table 2. Compared with the typical value, the actual measured value was 8% smaller, indicating that temperature calibration of the FBG is essential.

2.3.2. Strain Calibration of FBG

When considering only the axial stress on the fiber, the formula for the wavelength variation and strain is given by
α ε = λ B · K ε = λ B ( 1 P e ) = λ / ε
where λ B is the reflected central wavelength of the FBG, ε is the strain, P e is the effective photoelastic coefficient of the fiber core, K ε is the FBG sensitivity, and α ε is the sensitivity coefficient for the central wavelength λ B . Generally, for quartz fibers, P e ≈ 0.22 [31], and K ε can be calculated as 0.78, according to Equation (3). Therefore, for the FBG with a central wavelength of 1510 nm, the sensitivity coefficient is = 0.78 × 10−6 × 1510 × 103 = 1.1778 pm/με; whereas for the FBG with a central wavelength of 1520 nm, the sensitivity factor is = 0.78 × 10−6 × 1520 × 103 = 1.1856 pm/με.
The experimental system for the strain calibration of the FBG includes a tensile machine, strain collector, and FBG demodulator, as shown in Figure 9a. A reinforcement steel of 50 cm in length and 8 mm in diameter was used as the sample. A bare fiber with two measurement points was buried in the reinforcement steel recess, and a strain gauge (size 42 mm) was attached near each measurement point of the FBG for a comparative study. As shown in Figure 9b, the two measurement points of the strain fiber were FBG1 and FBG2, and the center wavelength of FBG1 was 1510 nm and that of FBG2 was 1520 nm. The two strain gauges were ERS1 and ERS2, and the role of the strain gauges was to compare the measurement results with the FBG strain sensor [32].
Figure 10 shows the loading path for the experiment with three cycles of loading and unloading. The loading path is 1 kN-2 kN-3 kN-4 kN, and then it is gradually discharged in reverse. The grating wavelength variation data and tensioner loading data were plotted according to three loading and unloading cycles, as shown in Figure 11. It can be observed that the central wavelength of the FBG increases as it is loaded and decreases as it is unloaded. It is consistent with the theoretical increase in the wavelength of the grating under tension and the decrease in the wavelength under pressure. Moreover, it can be seen that the wavelength change and load vary linearly over the three cycles of the test. Figure 12 shows the relationship between the wavelength change and strain. The sensitivity coefficient of FBG1 is 1.1773 pm/°C, and the theoretical value is 1.1778 pm/°C, with a difference of 0.04%. The fitted correlation coefficient is 0.9988. The sensitivity coefficient of FBG2 is 1.18 pm/°C, and the theoretical value is 1.1856 pm/°C, with a difference of 0.4%. The fitted correlation coefficient is 0.9995. This indicates that the experimental measurement coefficients and the typical values are almost the same. Figure 13 shows a comparison between the FBG strain measurements and the strain gauge measurements. The FBG strain measurement and strain gauge measurement are very close to the typical values, further supporting that K ε = 0.78 can be used as the sensitivity of the strain fiber.

2.4. Phase Change Material

The PCM can absorb and release significant amounts of thermal energy during the phase change process. The latent heat storage phase has the advantage of a smaller temperature change when its volume change is negligible compared with sensible heat storage. In the tests, paraffin was selected as PCM and filled into tubes. The latent heat of paraffin was measured using differential scanning calorimetry (DSC), and the results are shown in Figure 14. The phase transition interval for the PCM used in this study was approximately 24–27 °C, and the latent heat of the PCM was measured to be 159.39 J/g. In this experiment, one hollow steel pipe contained 0.291 kg of PCM. 20 steel tubes, containing a total of 5.82 kg of PCM, were encapsulated in the phase change energy pile.

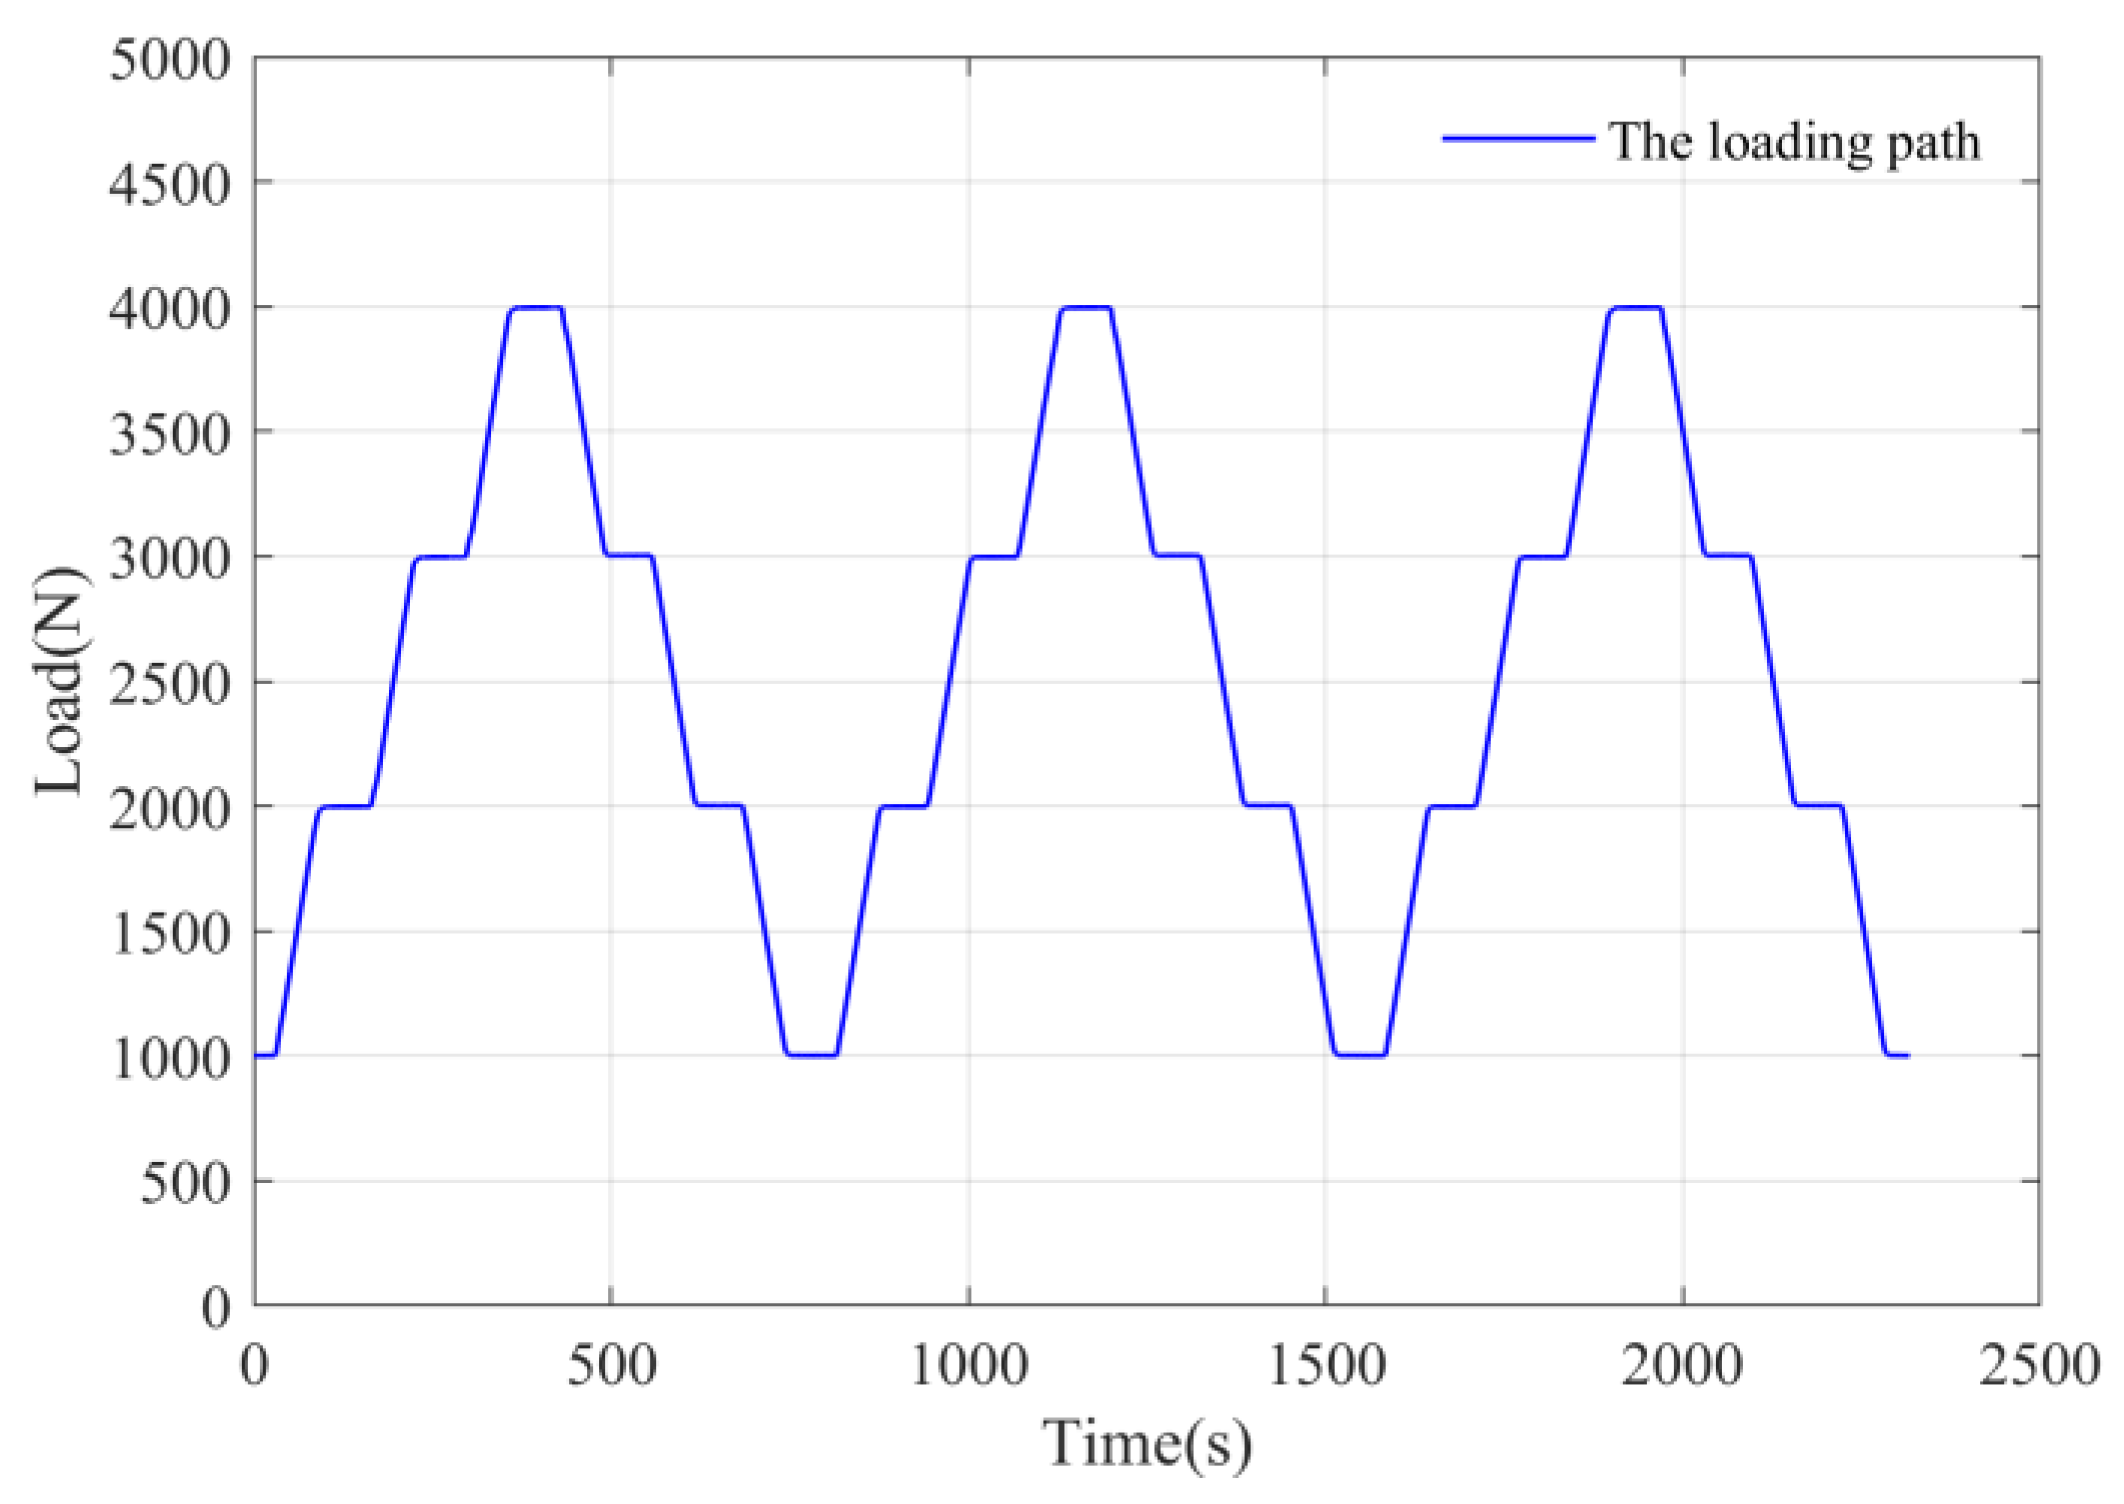
2.5. Tests Procedure

The tests were conducted on the PCM pile and the ordinary pile simultaneously, buried in saturated sand with a relative density of 60%. A small amount of silica was added to standard sand. The particle sizes are shown in Table 3. The maximum dry density of the used sand was 1.713 g/cm3, and the minimum dry density was 1.442 g/cm3. The sand was filled into the model tank layer by layer. A total of 15 layers were compacted to achieve the same soil density in each layer (Figure 15a). After each layer of filling was completed, samples were taken to calculate the density of the sand. The aim is to control the compactness of the soil in each layer at the designed relative density of 60%. The influence of the flow rate was investigated by running three different flow rates of 0.05 m3/h, 0.15 m3/h, and 0.25 m3/h. Approximately 9 h of heating and 15 h of recovery were performed with an inlet water temperature of 35 °C at the three flow rates. The average room temperature during the three flow conditions (0–24 h) was similar, at approximately 13 °C. However, when operating the 0.15 m3/h flow condition, a little variation of approximately 2 °C in room temperature was observed, with a variation compared to the other two conditions throughout the process, as shown in Figure 16b. In the stage of B-C in Figure 15b, flow is stopped for recovery.

3. Results

3.1. Temperature Change of the Piles

Figure 16a shows the temperature variation curves of the ordinary and PCM piles under different flow conditions, which represent the average temperature variation of the pile. For both the PCM pile and the ordinary pile, it was observed that the magnitude of temperature change increased with the increase in flow rates. Additionally, the temperature changed differently between the ordinary and PCM piles under the same flow condition. At the end of heating, the temperature increased by 8.1 °C for the PCM pile and 9.7 °C for the ordinary pile under the low flow condition of 0.05 m3/h, while the temperature increased by 12.2 °C for the PCM pile and 12.6 °C for the ordinary pile under the high flow condition of 0.25 m3/h. To gain a deeper understanding of the temperature variation rate of the pile during different stages of the heating transfer, the temperature change amplitude per hour, which represents the difference between two adjacent hours, was plotted and illustrated in Figure 16b. By analyzing the temperature change rate over time, valuable insights can be obtained regarding the dynamic changes in the pile’s temperature during the heating process. The maximum rate can be seen during 0–1 h, while the pile temperature variation rate was almost zero during 4–9 h. Figure 16c shows the temperature variation of the phase change material in the pile under different working conditions. It can be observed that the smaller the flow rate, the longer it took for the PCM to complete the phase change process, with 2.18 h under the 0.05 m3/h, 1.1 h for the 0.15 m3/h, and 0.88 h for the 0.25 m3/h working conditions, respectively. Furthermore, the PCM utilized in this experiment is an industrial-grade paraffin wax, and when the temperature reaches 24 °C, it initiates the phase change process. The phase transition interval for the PCM occurs within the range of 24–27 °C during the heating process.

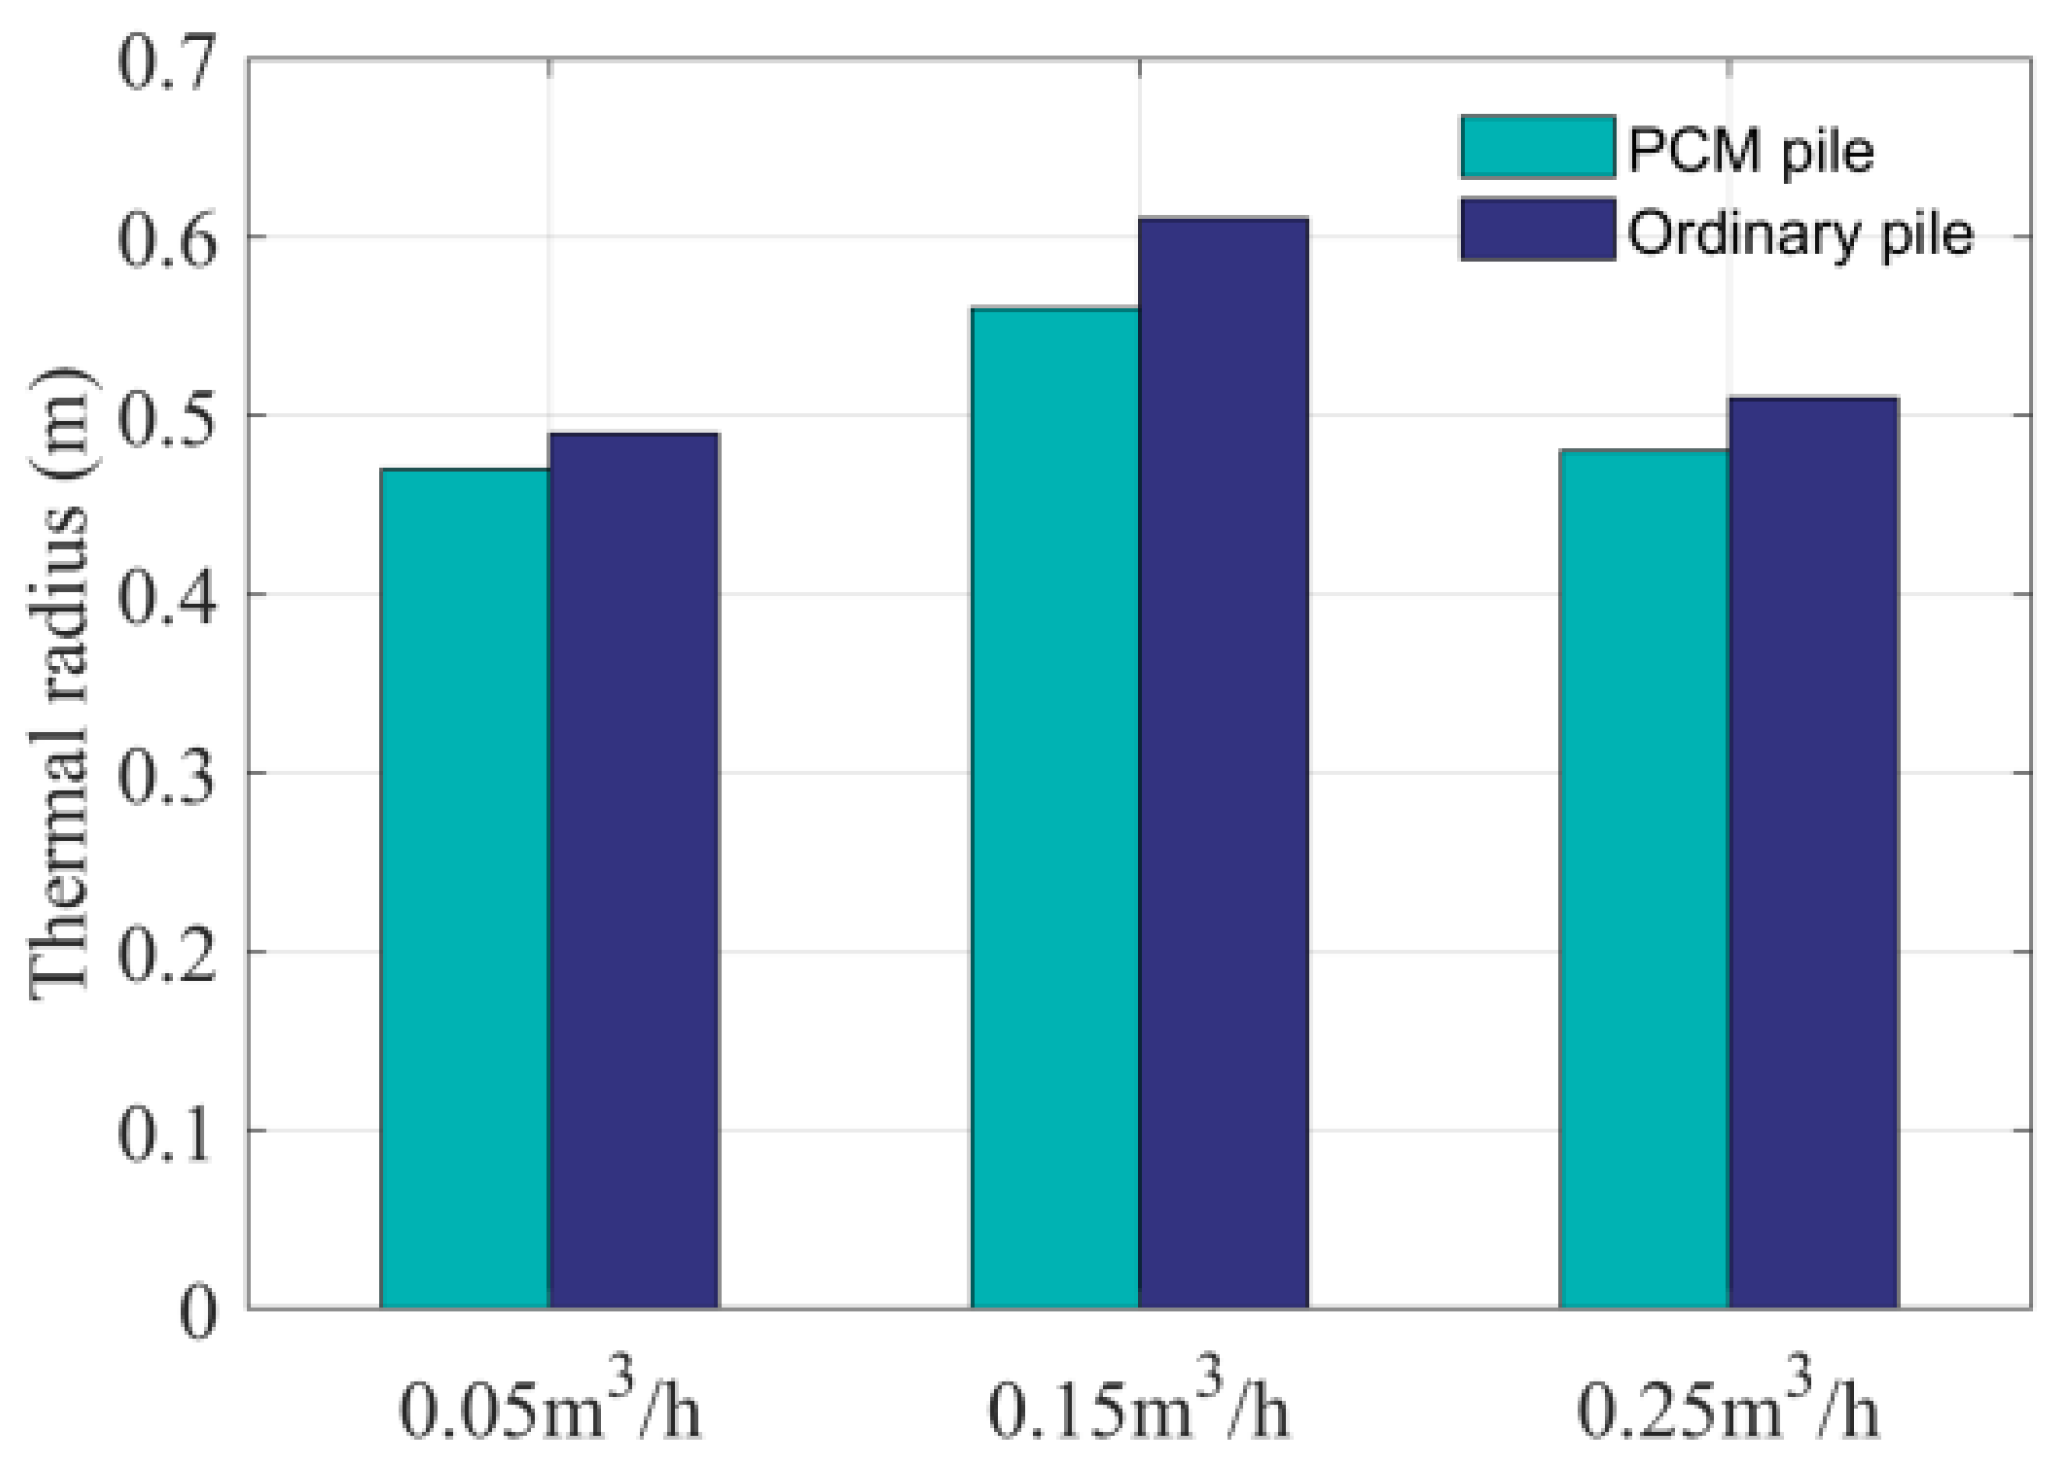
3.2. Thermal Influence Range

Figure 17 presents the radial temperature changes inside and outside the pile at 0, 0.5, 1, 3, 9, and 24 h at a burial depth of 0.775 m for both the ordinary and PCM piles under different working conditions. The position 0 in the coordinates indicates the center of the pile. During the heating process, the soil temperature around both the ordinary and PCM piles gradually increased, but slower than the pile temperature. The thermal resistance of the soil leads to a gradual decrease in soil temperature as the radial distance from the heat source increases. Comparing the different flow conditions of the ordinary pile, it can be seen that there is a faster and larger temperature rise in the pile at a relatively high flow rate of 0.25 m3/h compared to the other two flow conditions, with temperature changes of 13.5 °C, 14.1 °C, and 14.4 °C at 1, 3, and 9 h, respectively. In the pile center position, the temperature difference was only 0.9 °C from 1 h to 9 h, showing that the temperature change in the pile body was particularly small during the heating process after 1 h. This indicates that the heat exchange between the heat transfer fluid and the pile body gradually decreased. A relatively good heat exchange was still maintained under the other two flow conditions from 1 h to 3 h. Similar performance was observed for the PCM pile as well.
To assess the effect of heat transfer from the pile to the soil under different flow conditions, the thermal radius was defined as the radius at which the soil temperature satisfies the following equation [33]:
T S |   x = x r T 0 T 0 0.5 %
where T S |   x = x r is the soil temperature at r m from the center of the pile, and T 0 is the initial soil temperature.
Figure 18 shows the thermal radius of the ordinary and PCM energy piles under different flow conditions. The thermal radius results were obtained at the end of heating (9 h) under different flow conditions. The thermal radius of the ordinary pile was 1.04, 1.09, and 1.06 times that of the PCM pile under the three flow conditions, respectively. It indicates the thermal effect of the PCM energy pile on the soil decreased, and the thermal radius was slightly reduced.

3.3. Thermal Strains

The pile deforms under thermal loads, and if there is no external restraint, the pile will expand freely towards the ends when heated. However, if considering the pile friction resistance and pile tip restraint, the deformation of the pile will be restricted, and the observed thermal strain will be smaller than the strain value of freely expanding. The fiber optic grating sensor was embedded in a recess within the steel bar and subsequently encapsulated with epoxy resin. Supplementary temperature sensors were positioned alongside the FBG sensors to monitor temperature fluctuations. By offsetting the impact of temperature variation, temperature compensation was obtained. The method can be expressed by the following functions:
ε = 1 α ε   ( λ α T   ·   T )
where λ and ε are the wavelength shift and strain measured by the FBG sensor placed at the steel bar, respectively; α ε is the strain-sensitivity coefficient for the central wavelength λ B ; α T is the temperature-sensitivity factor for a central wavelength of λ B   .
Figure 19 shows the observed thermal strain curves of the pile at different times measured by the FBG strain sensors under different flow conditions. It can be seen that the thermal strain increased with increasing flow rates for both the ordinary and PCM piles. Under the flow conditions of 0.05 m3/h, the thermal strain of the ordinary and PCM piles can almost recover to the initial state (at 0 h), while under the flow conditions of 0.15 m3/h and 0.25 m3/h, the thermal strain cannot recover to the initial state. Under all three conditions, the PCM pile exhibited a lower thermal strain than the ordinary pile in the 0–1 h period, while the opposite was observed in the 3–9 h period.

3.4. Thermal Stress

Rather than being free to expand when heated, the energy piles are constrained by the soil. To obtain the binding force on the pile, additional thermal stress can be calculated using the following equation:
σ T = E ( ε T α 1 T )
where ε T is the strain measured by the FBG sensors; α 1 is the thermal expansion coefficient of the pile, which is measured to be 12.05 με/°C for the ordinary pile and 12.49 με/°C for the PCM pile; It is important to highlight that the thermal expansion coefficients of the energy piles were determined through unconstrained laboratory tests. During these tests, the energy piles were enveloped by a 5 cm thick insulation material, ensuring nearly uniform temperatures across all locations of the piles. E is the elasticity modulus of the pile, which is tested to be 32.77 GPa for the ordinary pile and 37.48 GPa for the PCM pile; T is the amount of temperature change; and σ T is the thermal stress. Figure 20 shows the axial thermal stresses at the end of heating (9 h) under different flow conditions. The negative values represent compressive stresses. It is clear that heating caused additional axial compressive stresses inside the pile, with the values being small at the top and bottom and large in the middle. The thermal stresses in the ordinary and PCM piles increased with the rise of the flow rate. Under the high flow condition of 0.25 m3/h, the maximum axial thermal stresses reached 1228.8 kPa in the ordinary pile and 792.5 kPa in the PCM pile at the middle part of the pile. The maximum axial thermal stress in the ordinary pile was 0.55 times higher than that in the PCM pile. This implies that less thermal stress on the pile occurred when using the PCM.

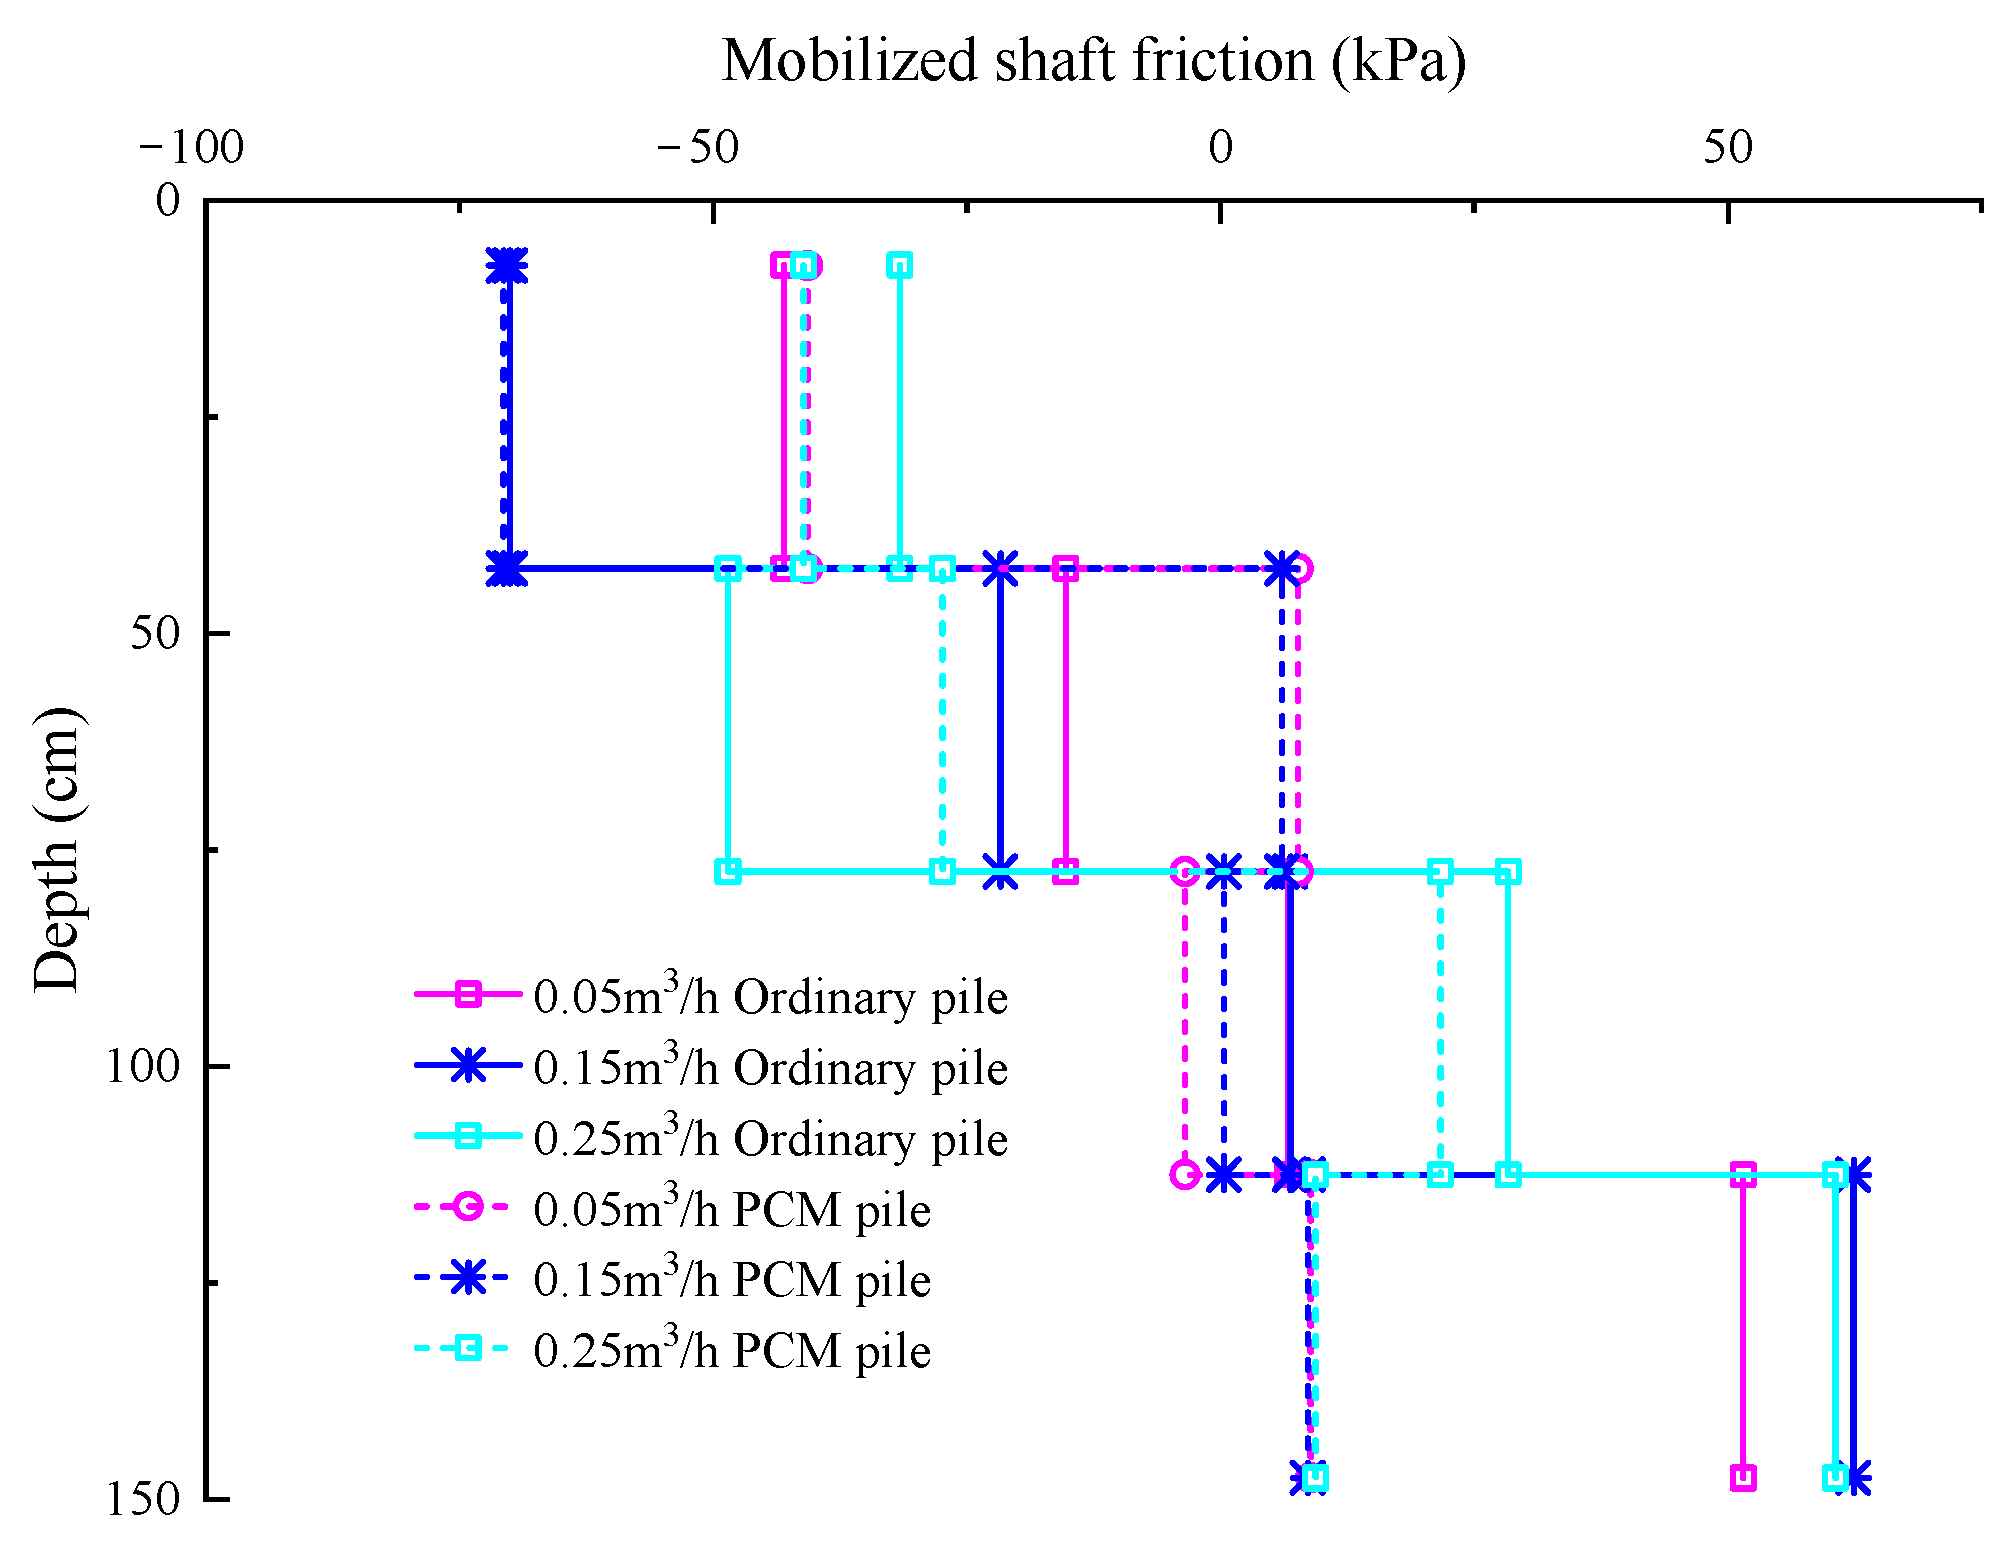
3.5. Thermal Friction Resistance

A frictional resistance was generated due to the relative displacement between the pile and soil when thermal expansion of the pile occurred. The pile tends to expand at both ends, and the direction of frictional resistance changes along the pile depth. The formula used to estimate the frictional resistance between the two adjacent sections of the energy pile is as follows:
f s , m o b , j = D 4 l ( σ T , j σ T , j 1 )
where D is the pile diameter, l is the distance between two adjacent points of the strain sensors, and j = 1, 2, 3, … indicates the cross-section from the top of the pile to its bottom, where the FBG strain sensors are located. The value of friction resistance is defined as negative downward and positive upward.
Figure 21 shows the distribution of the frictional resistance of the ordinary and PCM piles at the end of heating (9 h) under different flow conditions. Generally, the negative frictional resistance occurs at the upper part of the pile, and the positive frictional resistance occurs at the bottom part of the pile. The maximum negative frictional resistance of the ordinary pile occurred at a depth of 0–42.5 cm below the soil surface, and the maximum positive frictional resistance mainly occurred at a depth of 112.5–147.5 cm. The pile-side friction resistance was smaller at the neutral point in the middle part of the pile. For the PCM pile, the maximum negative frictional resistance was distributed at the top of the pile, while the frictional resistance at the bottom of the pile was very small, almost close to zero. The reason for this phenomenon may be attributed to the relatively small temperature change and the smaller relative displacement of the pile. In this experiment, the soil surrounding the pile was classified as medium-dense sand. Referring to China’s JGJ 94-2008 code [34] for construction pile foundations and considering the empirical relationship between the physical properties of the soil used in the experiment and the bearing capacity parameters, the standard value of the ultimate lateral resistance of the pile can be calculated as 66 kPa. Based on this standard, it was found that the positive frictional resistance of the lower part of the pile in the experiment was less than 66 kPa. To estimate the vertical ultimate bearing capacity of the pile, Equation (8) is employed.
Q u k = Q s k + Q p k = μ 1 q s k l i + q p k A p
where Q u k is the vertical bearing capacity of the pile foundation, Q s k indicates the standard value of the side resistance. Q p k   is the standard value of the end resistance. μ 1 denotes the peripheral length of the pile, l i indicates the pile length of each section of each soil layer, q s k represents the lateral resistance of the soil around the pile in layer l i . q p k denotes the unit pile-end bearing capacity, and A p denotes the cross-sectional area of the pile tip.
Based on calculations, the ordinary pile exhibits frictional pile behavior when not subjected to a temperature load, with the self-weight being lower than the shaft resistance. However, the introduction of a temperature load causes thermal expansion of the pile body, leading to a relative displacement between the pile and soil, resulting in negative friction resistance and the appearance of a neutral point. As depicted in Figure 21 at the flow condition of 0.15 m3/h, the maximum positive frictional resistance on the side of the ordinary energy pile is measured to be 62 kPa, which is below the standard value of the ultimate lateral resistance. Furthermore, it is observed that the bottom of the ordinary pile bears a portion of the load. But the total load accounts for only approximately 27% of the ultimate bearing capacity (including shaft resistance and tip resistance), ensuring structural safety under the temperature load of the ordinary pile. Similarly, the total load carried by the PCM energy pile is only 19.3% of the ultimate bearing capacity due to the small pile displacement. This finding indicates that the safety factor of the PCM energy pile is higher compared to that of the ordinary energy pile.

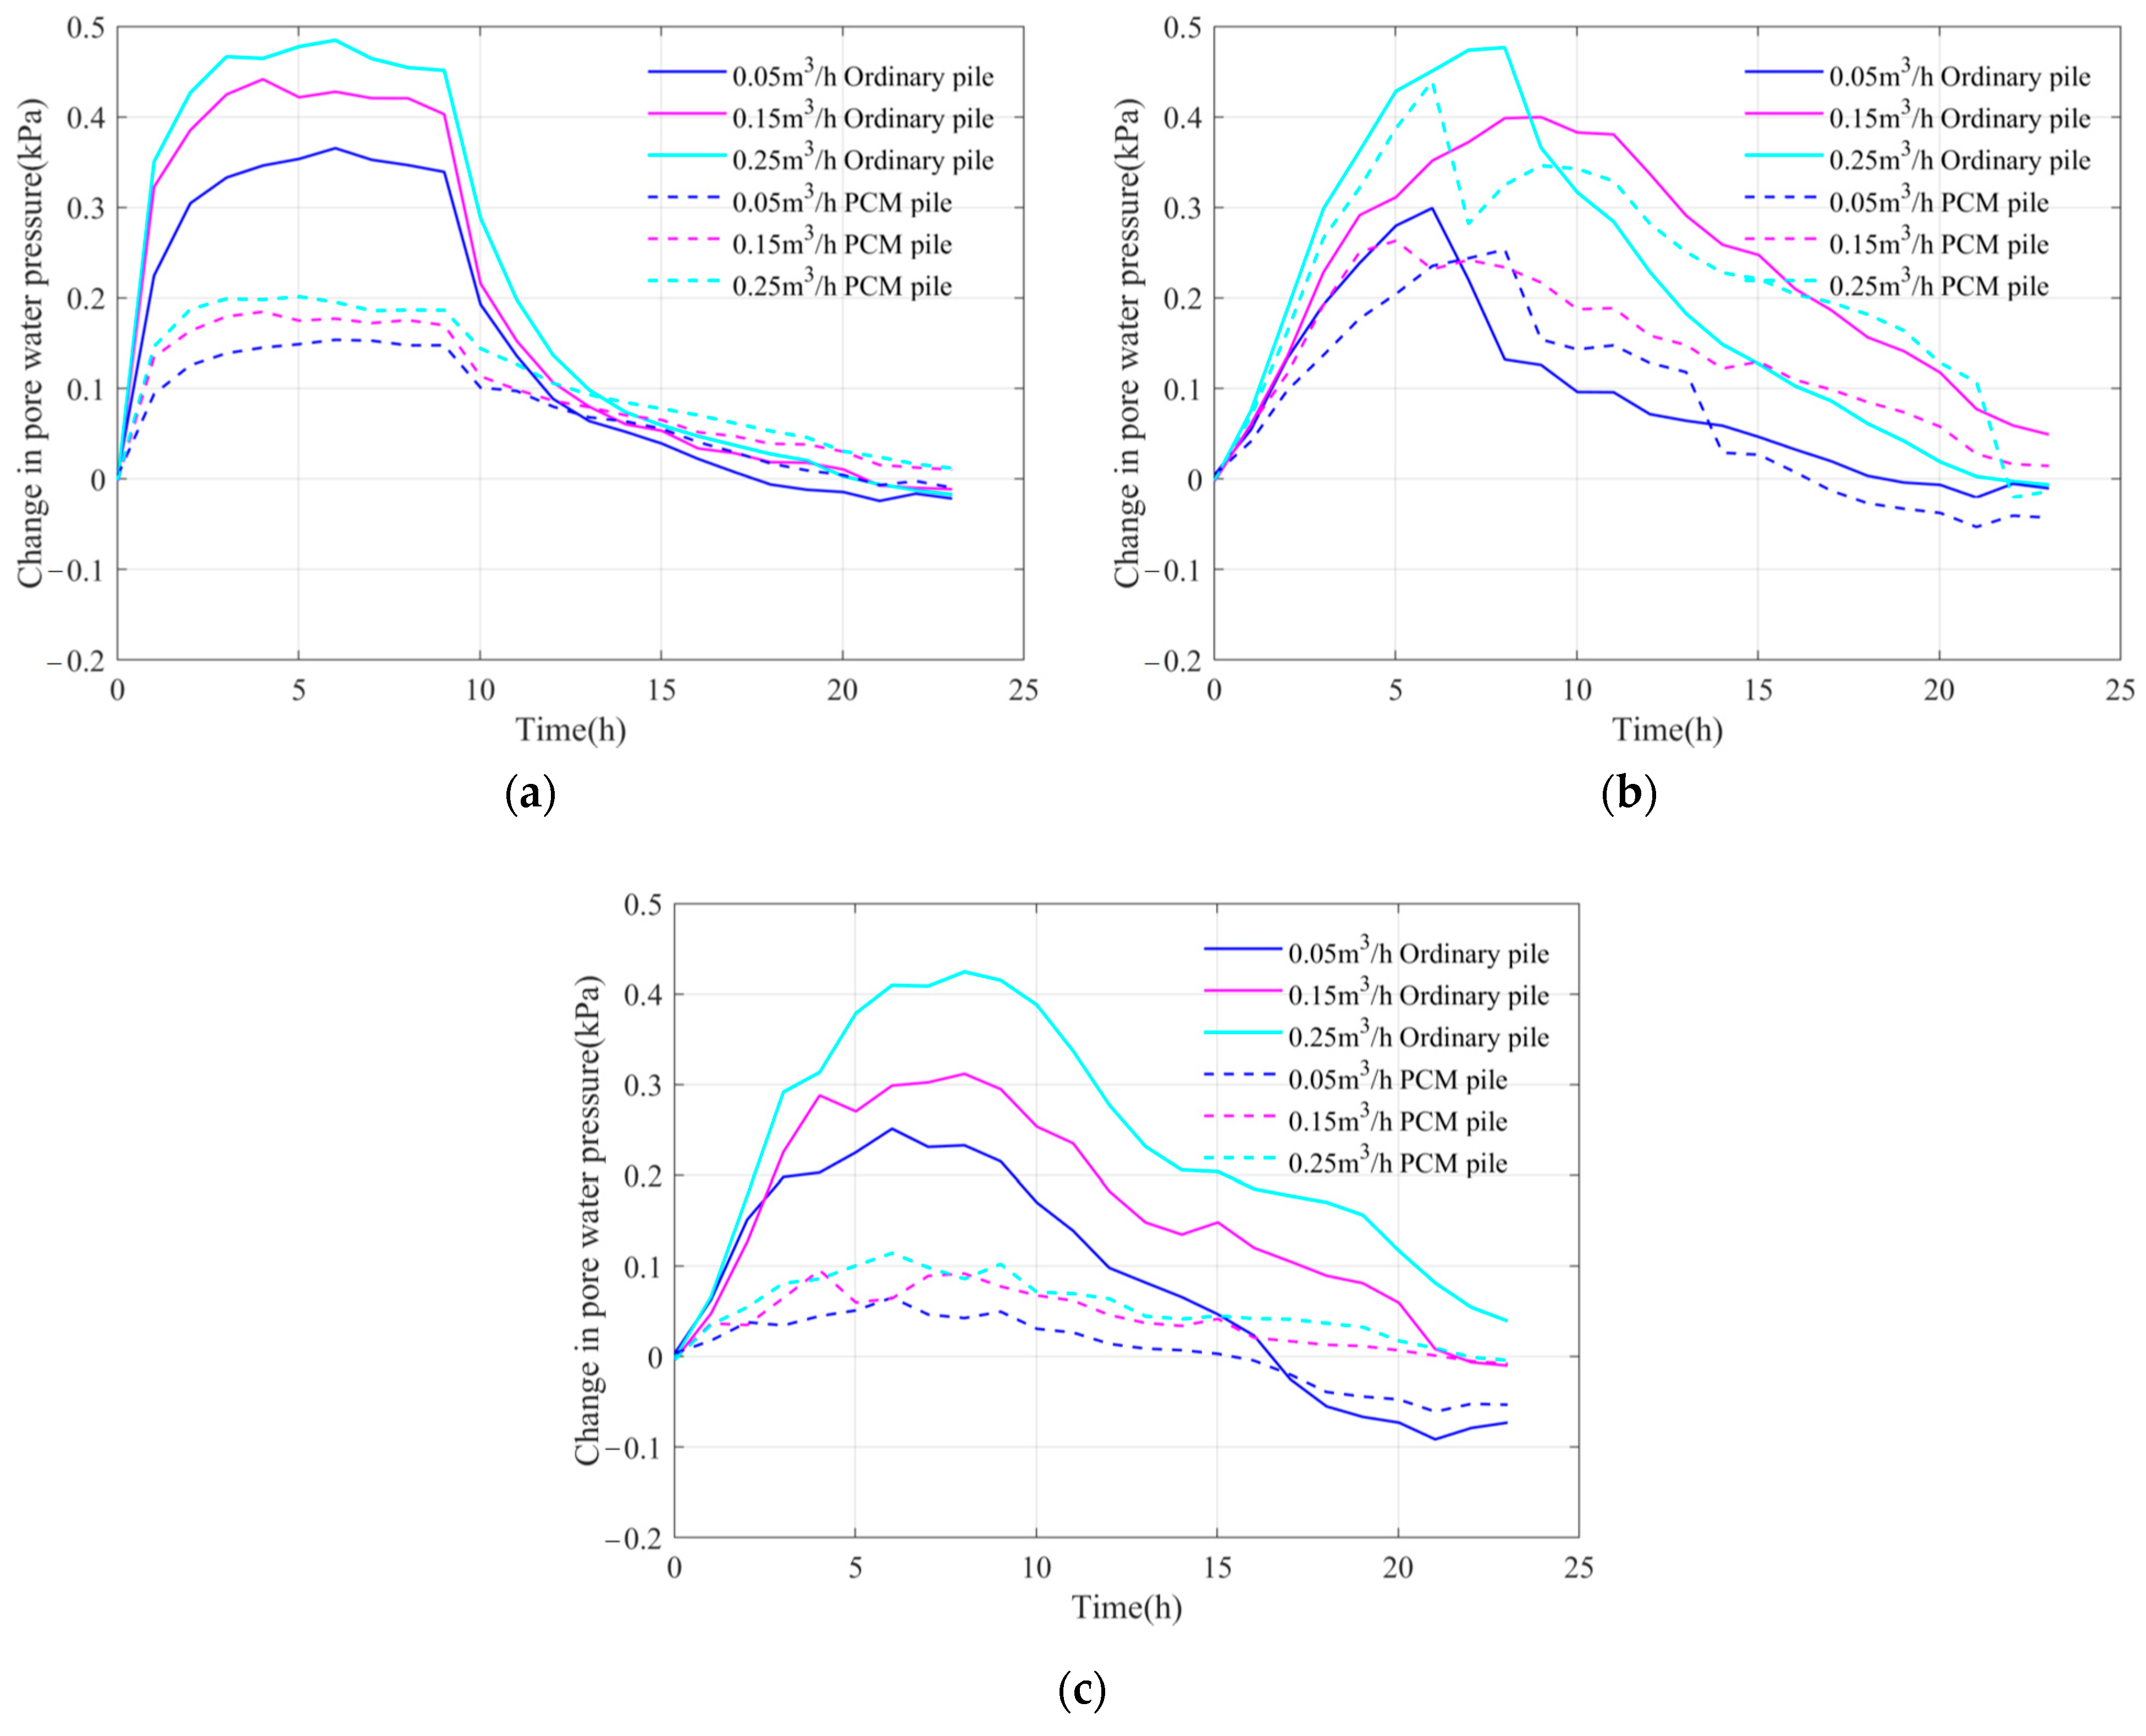
3.6. Pore Water Pressure

In the experiment, the pore pressure gauges were arranged as shown in Figure 6b. Figure 22 shows the theoretical initial pore pressure measured by the pore gauges after the soil has been saturated, with a depth of 160 mm being the burial depth at the bottom of the pile. The measured pore water pressures are almost identical to the theoretical values.
Figure 23 shows the time history of pore pressure at different locations around the ordinary and PCM piles under three different flow conditions. As shown in Figure 23a, at a depth of 112.5 cm and 0 D (XU2/PU2 in Figure 6b) from the pile side (D is the pile diameter of 20 cm, 0 D means 0 mm from the surface of the pile), the maximal pore pressure variation of the ordinary and PCM piles under 0.05 m3/h working conditions was 0.153 kPa and 0.365 kPa, respectively, while the maximal pore pressure variation of the ordinary and PCM piles under 0.25 m3/h working conditions was 0.2 kPa and 0.485 kPa, respectively. Obviously, the pore pressure variation in the soil around the PCM pile was smaller than that in the soil around the ordinary pile. Figure 23b,c show the pore pressure variation curves at a depth of 112.5 cm and 0.5 D (XU3/PU3 in Figure 6b) from the side of the pile and at depths of 160 cm and 0.5 D from the bottom of the pile, respectively. A similar trend that pore pressure changed more obviously around the ordinary pile was observed from the figures. The change in pore water pressure had an influence on the effective stress in the soil, which was detrimental to soil stability. The PCM pile had the advantage of reducing the pore pressure change owing to the smaller change in temperature of the surrounding soil compared to the ordinary pile.

3.7. Soil Pressure

The soil pressure around the pile significantly contributed to the pile friction and pile bearing capacity. In the experiment, soil pressure sensors were installed at a depth of 112.5 cm at 0 D (XS2/PS2 in Figure 6b), 0.5 D (XS3/PS3 in Figure 6b), and 1 D (XS4/PS4 in Figure 6b) from the pile to measure the lateral soil pressure variation. However, the soil pressure sensor at the 0 D position on the surface of the PCM energy pile was damaged. Figure 24 shows the variation in soil pressure at different radial distances from the pile. As can be seen in Figure 24a–c, the higher the flow rate, the greater the change in soil pressure. The magnitude of the soil pressure change in the lateral direction decreased with increasing radial distance. This change is similar to the study of Wang et al. [35]. From Figure 24b, it can be seen that the maximal soil pressure under the small flow of 0.05 m3/h was 3.77 kPa for the ordinary pile and 0.66 kPa for the PCM pile. The soil pressure variation around the PCM pile was only 17.5% of that around the ordinary energy pile. Under a high flow of 0.25 m3/h, the maximum change in soil pressure was 6.57 kPa for the ordinary pile and 1.7 kPa for the PCM pile. The soil pressure variation around the PCM energy pile was 25.8% of that at the ordinary energy pile. In general, under the same flow conditions, the thermal stress of the soil around the PCM pile was far less than that around the ordinary pile.

4. Discussion

4.1. Thermal Influence of the Piles and Soil

In Figure 16 a,b, it was clear that the heat rise of the PCM pile was less than that of the ordinary pile, mainly because the phase change process occurred and part of the heat was absorbed by the phase change material, thus reducing the temperature rise of the pile. According to the result of the temperature change rate from fast to slow in Figure 16b, this phenomenon can be explained by Fourier’s law of conduction as follows:
q = k T
where q is the heat flux from the heat transfer fluid to the pile, k is the thermal conductivity of the pile, and T is the temperature gradient. As a result, the temperature gradient between the heat transfer fluid and the pile was relatively large during the 0–1 h period, resulting in a higher heat flux and a faster temperature rise. The temperature gradient gradually decreased and resulted in an almost zero rate of temperature variation during the 4–9 h period.
As it can be seen in Figure 16c, during the phase change, the thermal conductivity of the material decreases while absorbing latent heat. As a result, the temperature change becomes slower. However, as the PCM transformed from a solid to a liquid state, the dominant heat transfer mechanism changed from conduction to convective heat transfer [36,37,38,39]. This change leads to continuous temperature variations within the phase change period during the heating process. Once the temperature exceeded 27 °C, the phase change process was completed, and the heat absorption and storage in PCM were saturated. A rapid temperature increase occurred within the PCM when heat transfer continued. In most previous studies about PCM concrete [40,41], its embedding in the structure is usually scattered and small, so it is difficult to quantify and compare the phase transition process. In this study, the volume of PCM added is large and concentrated without significantly affecting the performance of concrete. It is convenient to compare the effect of the phase transition process on heat transfer performance, which is different from previous studies. In the study of MOUSA et al. [42], the volume of phase change materials was also very large, so a similar phenomenon appears.
Notably, the heat influence on the soil temperature can be negligible when the distance is greater than 0.7 m from the pile. Compared with the ordinary pile, the PCM pile exhibited a smaller magnitude of temperature variation. It was attributed to the use of PCM within the pile, which has the ability to absorb and store heat during phase change, maintaining a nearly constant temperature throughout the heat transfer process. This study highlights the advantages of the PCM pile in mitigating thermal effects and reducing temperature fluctuations.
The result in Figure 19 shows that the thermal strain at the bottom of the pile was the lowest for two main reasons: first, the temperature at the bottom of the pile was lower owing to the fact that heat was mainly transferred radially through the pile; second, the bottom of the pile was restrained at the pile tip. Under all three conditions, the PCM pile exhibited a different thermal strain in the 0–1 h and 3–9 h periods than the ordinary pile. This is mainly due to the fact that the PCM pile exerted its phase change at 0–1 h and the pile temperature changed slowly to a small extent.

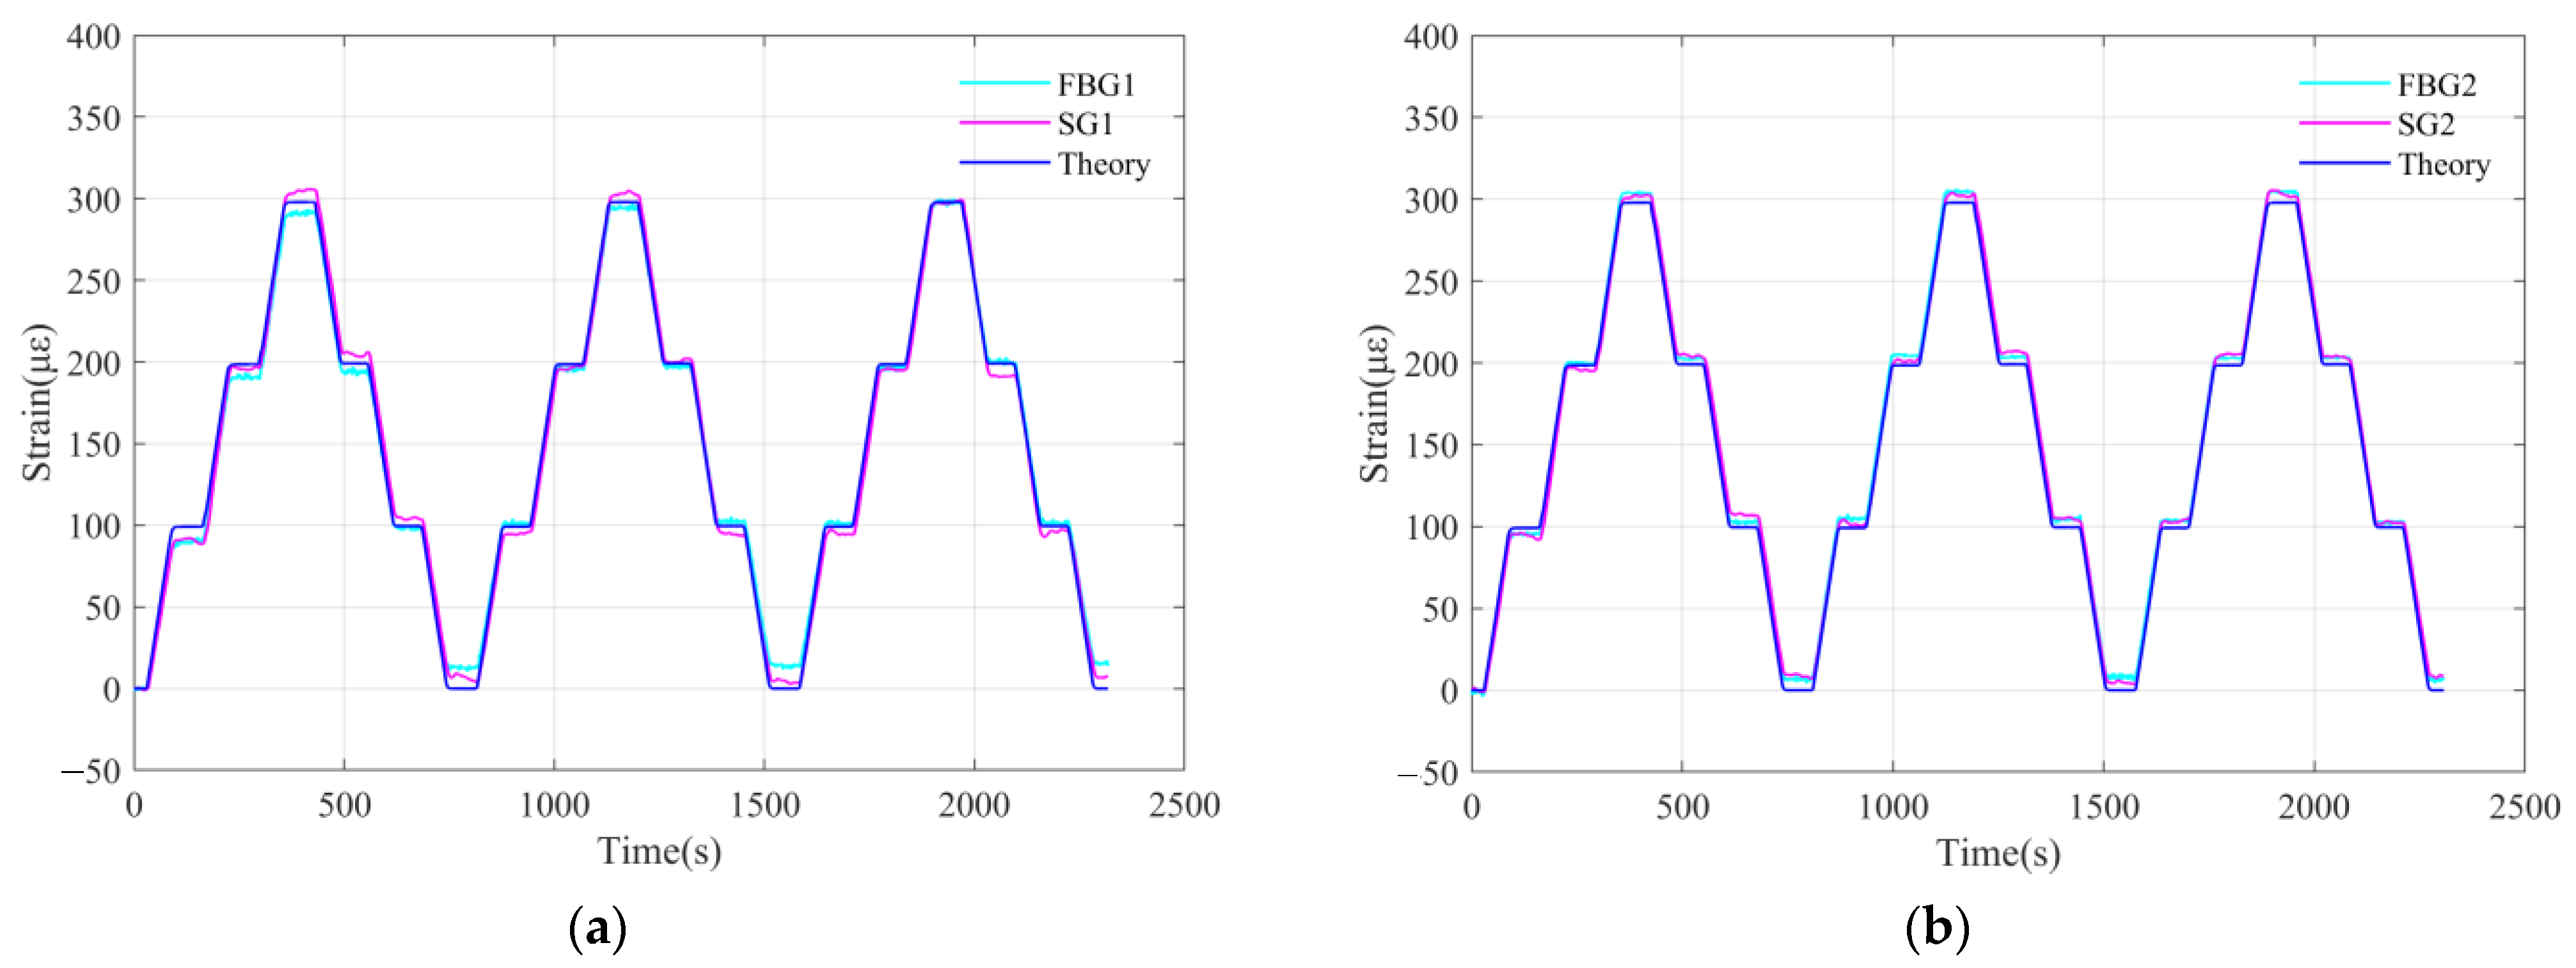
4.2. Data Comparison

Table 4 presents the calculated results of additional thermal stresses from the experiment as well as data from other studies. The change in thermal stress observed in the field experiments ranged from 104 to 199.89 kPa/°C when there was no load applied to the top of the pile. The variation in the change in thermal stress was believed to be influenced by the soil surrounding the pile and the type of pile. In the field experiments conducted by Murphy et al. [11], it was observed that with loads on top of the pile, the change in thermal stress reached 260 kPa/°C. This significant value could be attributed to the fact that the soil surrounding the pile in their experiments was sandstone, which possessed a relatively high confining capacity. The field experiment results also indicated that the thermal stress at the pile head was greater under the loading condition compared to that without loads on top of the pile. The change in thermal stress for the ordinary energy pile in this experiment was 97.5 kPa/°C, which was close to but slightly smaller than the results reported by Laloui et al. [6] and Faizal et al. [43] in their field experiments. This similarity can be attributed to the soil condition surrounding the pile in the experiment, which was similar to Laloui and Faizal’s experiments. However, the slightly smaller results were due to the size of the model and the fact that the soil pressure around the pile was small. Furthermore, the thermal stress of the PCM energy pile was measured to be 65 kPa/°C, which was only 67% of that observed in the ordinary energy pile. The results indicate that the inclusion of PCM in energy piles can effectively reduce the thermal response due to temperature change and enhance structural safety.

4.3. System Error Analysis

In this study, the optical fiber was arranged on the reinforcement bar in the pile, and the top measuring point has a small distance of 50 cm from the top of the pile, so the optical fiber will be constrained by the pile to a certain extent. At the same time, in order to avoid the influence of room temperature, a heat insulation sheet was coved on the top of piles to restrain the free expansion of the pile head. In other words, the top of the pile was not free. Taking the above two factors into consideration, the measured data through fiber near the top of the pile would have certain thermal stress. A similar phenomenon was also observed in a previous study [40].
On the other hand, Equation (7) is a method to estimate the side friction resistance through the pressure difference of different measuring points, which represents the change of the side friction resistance by the thermal-mechanical response, and the accuracy depends on the diameter of the pile and the spacing of the measuring points, which originates from some field experiments. As for the laboratory model test, due to the dual problems of thermal and mechanical, it is usually unable to meet all the similarity theories. This study mainly focuses on the thermal response of a new type of phase-change energy pile and the changes in its mechanical properties. Therefore, in order to meet the thermal performance requirements, the mechanical properties and size ratio of the pile have not been completely similar. This makes it convenient to observe the thermal response, but at the same time magnifies the mechanical response and further makes the calculated side friction change larger than the expected value.

5. Conclusions

In this study, a model test system was established to investigate the thermal response of a novel energy pile using PCM. In particular, the FBG sensor used to monitor the strain changes in the pile was calibrated, and the temperature sensitivity coefficient was found to be 8% smaller than the theoretical value. The conclusions are summarized as follows:
(1) The temperature variation of both the ordinary and PCM piles increases when the flow rate increases; however, the overall temperature rise rate of the PCM pile, especially in the preliminary heat transfer period, is smaller compared to the ordinary pile. Furthermore, the magnitude of the flow rate affects the phase change duration, with the phase change process completing at 2.18, 1.1, and 0.88 h under the working conditions of three different flow rates.
(2) Compared with ordinary piles, PCM piles can reduce the magnitude of the temperature variation and the thermal radius of the soil around the pile. In this experiment, the thermal radius of an ordinary pile is slightly larger than that of the PCM pile under the working conditions of three different flow rates.
(3) The thermal stress increases with increasing flow rates for both the ordinary and PCM piles. The maximum thermal stress of the ordinary pile is 1.5–1.6 times that of the PCM pile under the working conditions of three flow rates. Moreover, the variations of pore pressure and soil pressure under heating conditions are more obvious around the ordinary pile. The PCM pile exhibits a certain advantage in terms of reducing the additional thermal stresses of the pile and soil.
(4) The thermal responses of the energy pile and soil were investigated under different flow conditions. It is recommended that the energy piles be put into service not only to measure the economic benefits of the flow rate but also to pay attention to whether structural safety is compromised when the flow rate increases.
(5) The limitations of this study include the relatively small number of circulating cycles. The number of cycles should be increased to better investigate the long-term thermo-mechanical behavior of the energy piles and soils, considering loads on top of piles. In addition, further investigation on the heat transfer efficiency of the proposed PCM pile is required to provide references for engineering applications.

Author Contributions

Conceptualization, H.C. and X.B.; methodology, X.X.; validation, H.C., H.L. and J.S.; formal analysis, H.L.; investigation, P.P.; data curation, X.X.; writing—original draft preparation, J.S.; writing—review and editing, H.L. and X.X.; supervision, P.P.; project administration, X.B.; funding acquisition, H.C. All authors have read and agreed to the published version of the manuscript.

Funding

The work in this study was fully supported by the Natural Science Foundation of China (Nos. 51925804, 52008262, and 51938008), and the project was funded by the China Postdoctoral Science Foundation (No. 2022TQ0219).

Data Availability Statement

The data that support the findings of this study are available on request from the corresponding author, [Peng. P], upon reasonable request.

Conflicts of Interest

The funders had no role in the design of this study, in the collection, analysis, or interpretation of data, in the writing of the manuscript, or in the decision to publish the results.

References

  1. Brandl, H. Energy foundations and other thermo-active ground structures. Géotechnique 2006, 56, 81–122. [Google Scholar] [CrossRef]
  2. Moradshahi, A.; Faizal, M.; Bouazza, A.; McCartney, J.S. Effect of nearby piles and soil properties on thermal behaviour of a field-scale energy pile. Can. Geotech. J. 2021, 58, 1351–1364. [Google Scholar] [CrossRef]
  3. You, S.; Cheng, X.H.; Guo, H.X.; Yao, Z.Q. Experimental study on structural response of CFG energy piles. Appl. Therm. Eng. 2016, 96, 640–651. [Google Scholar] [CrossRef]
  4. Ren, L.W.; Xu, J.; Kong, G.Q.; Liu, H.L. Field tests on thermal response characteristics of micro-steel-pipe pile under multiple temperature cycles. Renew. Energy 2020, 147, 1098–1106. [Google Scholar] [CrossRef]
  5. Sutman, M.; Brettmann, T.; Olgun, C.G. Full-scale in-situ tests on energy piles: Head and base-restraining effects on the structural behaviour of three energy piles. Geomech. Energy Environ. 2019, 18, 56–68. [Google Scholar] [CrossRef]
  6. Laloui, L.; Nuth, M.; Vulliet, L. Experimental and numerical investigations of the behaviour of a heat exchanger pile. Int. J. Numer. Anal. Methods Geomech. 2006, 30, 763–781. [Google Scholar] [CrossRef]
  7. Faizal, M.; Bouazza, A.; McCartney, J.S. Thermal resistance analysis of an energy pile and adjacent soil using radial temperature gradients. Renew. Energy 2022, 190, 1066–1077. [Google Scholar] [CrossRef]
  8. Faizal, M.; Bouazza, A.; McCartney, J.S.; Haberfield, C. Effects of Cyclic Temperature Variations on Thermal Response of an Energy Pile under a Residential Building. J. Geotech. Geoenviron. Eng. 2019, 145, 04019066. [Google Scholar] [CrossRef]
  9. Laloui, L.; Sutman, M. Experimental investigation of energy piles: From laboratory to field testing. Geomech. Energy Environ. 2021, 27, 100214. [Google Scholar] [CrossRef]
  10. Yang, W.B.; Zhang, L.J.; Zhang, H.; Wang, F.; Li, X.J. Numerical investigations of the effects of different factors on the displacement of energy pile under the thermo-mechanical loads. Case Stud. Therm. Eng. 2020, 21, 100711. [Google Scholar] [CrossRef]
  11. Murphy, K.D.; McCartney, J.S.; Henry, K.S. Evaluation of thermo-mechanical and thermal behavior of full-scale energy foundations. Acta Geotech. 2015, 10, 179–195. [Google Scholar] [CrossRef]
  12. Suryatriyastuti, M.E.; Mroueh, H.; Burlon, S. Understanding the temperature-induced mechanical behaviour of energy pile foundations. Renew. Sustain. Energy Rev. 2012, 16, 3344–3354. [Google Scholar] [CrossRef]
  13. Bourne-Webb, P.J.; Amatya, B.; Soga, K.; Amis, T.; Davidson, C.; Payne, P. Energy pile test at Lambeth College, London: Geotechnical and thermodynamic aspects of pile response to heat cycles. Géotechnique 2009, 59, 237–248. [Google Scholar] [CrossRef]
  14. Xiong, Z.; Li, X.; Zhao, P.; Zhang, D.; Dong, S. An in-situ experimental investigate of thermo-mechanical behavior of a large diameter over length energy pile. Energy Build. 2021, 252, 111474. [Google Scholar] [CrossRef]
  15. Alam, M.; Zou, P.; Sanjayan, J.; Ramakrishnan, S. Energy saving performance assessment and lessons learned from the operation of an active phase change materials system in a multi-storey building in Melbourne. Appl. Energy 2019, 238, 1582–1595. [Google Scholar] [CrossRef]
  16. Kishore, R.A.; Bianchi, M.; Booten, C.; Vidal, J.; Jackson, R. Optimizing PCM-Integrated Walls for Potential Energy Savings in U.S. Buildings. Energy Build. 2020, 226, 110355. [Google Scholar] [CrossRef]
  17. Oluah, C.; Akinlabi, E.T.; Njoku, H.O. Selection of phase change material for improved performance of Trombe wall systems using the entropy weight and TOPSIS methodology. Energy Build. 2020, 217, 109967. [Google Scholar] [CrossRef]
  18. Mousavi, S.; Gijon-Rivera, M.; Rivera-Solorio, C.I.; Rangel, C.G. Energy, comfort, and environmental assessment of passive techniques integrated into low-energy residential buildings in semi-arid climate. Energy Build. 2022, 263, 112053. [Google Scholar] [CrossRef]
  19. Wang, H.; Lu, W.; Wu, Z.; Zhang, G. Parametric analysis of applying PCM wallboards for energy saving in high-rise lightweight buildings in Shanghai. Renew. Energy 2020, 145, 52–64. [Google Scholar] [CrossRef]
  20. Qi, D.; Pu, L.; Sun, F.T.; Li, Y.Z. Numerical investigation on thermal performance of ground heat exchangers using phase change materials as grout for ground source heat pump system. Appl. Therm. Eng. 2016, 106, 1023–1032. [Google Scholar] [CrossRef]
  21. Wang, J.L.; Zhao, J.D.; Liu, N. Numerical Simulation of Borehole Heat Transfer with Phase Change Material as Grout. Appl. Mech. Mater. 2014, 577, 44–47. [Google Scholar] [CrossRef]
  22. Li, X.; Tong, C.; Duanmu, L.; Liu, L. Study of a U-tube heat exchanger using a shape-stabilized phase change backfill material. Sci. Technol. Built Environ. 2017, 23, 430–440. [Google Scholar] [CrossRef]
  23. Chen, F.; Mao, J.; Li, C.; Hou, P.; Li, Y.; Xing, Z.; Chen, S. Restoration performance and operation characteristics of a vertical U-tube ground source heat pump system with phase change grouts under different running modes. Appl. Therm. Eng. 2018, 141, 467–482. [Google Scholar] [CrossRef]
  24. Bao, X.; Shazim, M.; Yang, H.; Dong, Z.; Cui, H. Thermal Properties of Cement-Based Composites for Geothermal Energy Applications. Materials 2017, 10, 462. [Google Scholar] [CrossRef] [PubMed]
  25. Yang, H.B.; Memon, S.A.; Bao, X.H.; Cui, H.Z.; Li, D.X. Design and preparation of carbon based composite phase change material for energy piles. Materials 2017, 10, 391. [Google Scholar] [CrossRef] [PubMed]
  26. Han, C.; Yu, X.B. An innovative energy pile technology to expand the viability of geothermal bridge deck snow melting for different United States regions: Computational assisted feasibility analyses. Renew. Energy 2018, 123, 417–427. [Google Scholar] [CrossRef]
  27. Mousa, M.M.; Bayomy, A.M.; Saghir, M.Z. Phase change materials effect on the thermal radius and energy storage capacity of energy piles: Experimental and numerical study. Int. J. Thermofluids 2021, 10, 100094. [Google Scholar] [CrossRef]
  28. Lee, W.; Lee, W.J.; Lee, S.B.; Salgado, R. Measurement of pile load transfer using the Fiber Bragg Grating sensor system. Can. Geotech. J. 2004, 41, 1222–1232. [Google Scholar] [CrossRef]
  29. Ge, Y.; Elshafie, M.Z.E.B.; Dirar, S.; Middleton, C.R. The response of embedded strain sensors in concrete beams subjected to thermal loading. Constr. Build. Mater. 2014, 70, 279–290. [Google Scholar] [CrossRef]
  30. Chen, B.; Maher, M.H.; Nawy, E.G. Fiber-Optic Bragg Grating Sensor for Nondestructive Evaluation of Composite Beams. J. Struct. Eng. 1994, 120, 3456–3470. [Google Scholar] [CrossRef]
  31. Hill, K.O.; Meltz, G. Fiber Bragg grating technology fundamentals and overview. J. Light. Technol. 1997, 15, 1263–1276. [Google Scholar] [CrossRef]
  32. Liao, M.; Liang, S.; Luo, R.; Xiao, Y. The cooperative deformation test of an embedded FBG sensor and strain correction curve verification. Constr. Build. Mater. 2022, 342, 128029. [Google Scholar] [CrossRef]
  33. Chen, F.; Mao, J.; Chen, S.; Li, C.; Hou, P.; Liao, L. Efficiency analysis of utilizing phase change materials as grout for a vertical U-tube heat exchanger coupled ground source heat pump system. Appl. Therm. Eng. 2018, 130, 698–709. [Google Scholar] [CrossRef]
  34. JGJ94-2008; Technical Code for Building Pile Foundations. Ministry of Housing and Urban-Rural Development of the People’s Republic of China: Beijing, China, 2008.
  35. Wang, C.L.; Liu, H.L.; Kong, G.Q.; Ng, C.W.; Wu, D. Model tests of energy piles with and without a vertical load. Environ. Geotech. 2016, 3, 203–213. [Google Scholar] [CrossRef]
  36. Shokouhmand, H.; Kamkari, B. Experimental investigation on melting heat transfer characteristics of lauric acid in a rectangular thermal storage unit. Exp. Therm. Fluid Sci. 2013, 50, 201–212. [Google Scholar] [CrossRef]
  37. Francesco, F.; Mario, C.S.; Bernardo, F. Convective Effects in a Latent Heat Thermal Energy Storage. Heat Transf. Eng. 2021, 42, 1–22. [Google Scholar] [CrossRef]
  38. Seddegh, S.; Joybari, M.M.; Wang, X.; Haghighat, F. Experimental and numerical characterization of natural convection in a vertical shell-and-tube latent thermal energy storage system. Sustain. Cities Soc. 2017, 35, 13–24. [Google Scholar] [CrossRef]
  39. Arıcı, M.; Yıldız, Ç.; Nižetić, S.; Shahsavar, A.; Campo, A. Implications of boundary conditions on natural convective heat transfer of molten phase change material inside enclosures. Int. J. Energy Res. 2021, 45, 7631–7650. [Google Scholar] [CrossRef]
  40. Chang, H.; Jiang, S.; Wang, H.; Wu, Q.; Zhao, S. Experimental study on the performance of phase change energy storage concrete for energy piles based on Gum Arabic and PEG-600. Geothermics 2023, 114, 102802. [Google Scholar] [CrossRef]
  41. Yang, W.; Sun, T.; Yang, B.; Wang, F. Laboratory study on the thermo-mechanical behaviour of a phase change concrete energy pile in summer mode. J. Energy Storage 2021, 41, 102875. [Google Scholar] [CrossRef]
  42. Mousa, M.M.; Bayomy, A.M.; Saghir, M.Z. Experimental and Numerical Study on Energy Piles with Phase Change Materials. Energies 2020, 13, 4699. [Google Scholar] [CrossRef]
  43. Faizal, M.; Bouazza, A.; Haberfield, C.; McCartney, J.S. Axial and Radial Thermal Responses of a Field-Scale Energy Pile under Monotonic and Cyclic Temperature Changes. J. Geotech. Geoenviron. Eng. 2018, 144, 04018072. [Google Scholar] [CrossRef]
  44. Lv, Z.X.; Kong, G.Q.; Liu, H.L.; Ng, C.W.W. Effects of Soil Type on Axial and Radial Thermal Responses of Field-Scale Energy Piles. J. Geotech. Geoenviron. Eng. 2020, 146, 06020018. [Google Scholar] [CrossRef]
Figure 1. Experimental system for energy piles.
Sustainability 16 00206 g001
Figure 2. Manufacturing process of FBG sensor-based steel bar.
Sustainability 16 00206 g002
Figure 3. Manufacturing process of FBG sensor-based steel bar; (a) PCM pile; (b) Ordinary pile.
Sustainability 16 00206 g003
Figure 4. Process of making model piles.
Sustainability 16 00206 g004
Figure 5. Arrangement of sensors in piles (unit: mm).
Sustainability 16 00206 g005
Figure 6. Monitoring in the soil (unit: mm); (a) Temperature; (b) Soil pressure and pore pressure.
Sustainability 16 00206 g006
Figure 7. FBG temperature calibration experimental device and temperature change during testing; (a) Test chamber; (b) Temperature change in the calibration test.
Sustainability 16 00206 g007
Figure 8. The results of the temperature calibration experiment.
Sustainability 16 00206 g008
Figure 9. FBG strain calibration system and distribution of sensors on the sample; (a) FBG strain calibration system; (b) FBG and ERS position on steel bar.
Sustainability 16 00206 g009
Figure 10. Loading path.
Sustainability 16 00206 g010
Figure 11. Wavelength variation under loading.
Sustainability 16 00206 g011
Figure 12. Wavelength variation with strain change; (a) FBG1; (b) FBG2.
Sustainability 16 00206 g012
Figure 13. Comparison of strain measurement between FBG and strain gauges: (a) FBG1 and ERS1; (b) FBG2 and ERS2.
Sustainability 16 00206 g013
Figure 14. DSC curve of paraffin.
Sustainability 16 00206 g014
Figure 15. Test preparation: (a) Filling of the ground; (b) Inlet water and room temperature.
Sustainability 16 00206 g015
Figure 16. Temperature variation in the pile under different flow conditions; (a) Average temperature; (b) Change rate; (c) Temperature change of PCM.
Sustainability 16 00206 g016
Figure 17. Distribution of radial temperature change at different times inside and surrounding the two energy piles at a depth of 0.775 m under different flow conditions: (a) 0.05 m3/h; (b) 0.15 m3/h; and (c) 0.25 m3/h.
Sustainability 16 00206 g017
Figure 18. Comparison of the thermal radius between ordinary and PCM piles under different working conditions.
Sustainability 16 00206 g018
Figure 19. Thermal strain in the axial direction of the piles at different times: (a) 0.05 m3/h; (b) 0.15 m3/h; (c) 0.25 m3/h.
Sustainability 16 00206 g019
Figure 20. Distribution of thermal stresses along the pile at the end of heating (9 h) for the ordinary and PCM piles under different flow conditions.
Sustainability 16 00206 g020
Figure 21. Thermal friction resistance of the ordinary and PCM piles under different flow conditions.
Sustainability 16 00206 g021
Figure 22. Hydrostatic pore water pressure in the soil.
Sustainability 16 00206 g022
Figure 23. Time history of pore pressure around the ordinary and PCM piles at different locations: (a) Depth of 112.5 cm and 0 D from the pile; (b) Depth of 112.5 cm and 0.5 D from the pile; (c) Depth of 160 cm and 0.5 D from the pile.
Sustainability 16 00206 g023
Figure 24. Time history of soil pressure at different locations in the soil with a depth of 112.5 cm. (a) 0 D from the pile (ordinary pile); (b) 0.5 D from the pile; (c) 1 D from the pile.
Sustainability 16 00206 g024
Table 1. A 1 m3 concrete mix ratio.
MixWater (kg)Cement (kg)Fly Ash
(kg)
Sand (kg)Gravel
5–10 mm (kg)
Gravel
10–19 mm (kg)
Steel Fiber (kg)Water Reducer (%)
Plain concrete162.840717564911086400.25
Steel fiber concrete162.8407175649974/390.32
Table 2. Sensitivity coefficients and correlation coefficients.
Test PointsNo. 1
(1533)
No. 2
(1538)
No. 3
(1543)
No. 4
(1548)
No. 5
(1553)
Average
α T , a c t u a l *
(nm/°C)
0.0103840.0098930.0102480.0103080.0103620.01021
Correlation coefficients (R2)0.98980.99830.99760.99590.99590.9955
*: α T , a c t u a l   is the value of the temperature sensitivity factor obtained from the test.
Table 3. The grain sizes of used sand.
Particle Size (mm)<2<1<0.75<0.25<0.1<0.075
Percent (%)10010079.4739.301.730.13
Table 4. Comparison of field experiments with the results of this study.
NamesPile TypeLength
(m)
Diameter (m)RestraintsSoil Layer (m) α 1
(με/°C)
E
(GPa)
T
(°C)
σ ¯ T , m a x
(kPa/°C)
Laloui et al. [6]full-scale pile25.80.96~1.17freeAlluvial soil (0–12)
Sandy gravelly moraine (12–21.6)
Bottom moraine (21.6–25.2)
Sandstone (25.2–25.8)
1029.220.9104
Faizal et al. [43]full-scale pile16.10.6freeFill material (0–1.5)
Sandy clay (1.5–2.5)
Sand (2.5–10)
Sand (with traces of clay) (10–16.1)
123022106.3
Bourne-Webb et al. [13]full-scale pile30.00.55~0.61freeFill material (0–1.5)
Sand and gravel (1.5–4)
Hard clay (4–30)
8.54029.4192
Lv et al. [44]full-scale pile240.6freehard clay (0–24)1030.928.6199.9
Murphy et al. [11]full-scale pile15.20.61Grade beamsandy fill with silt, gravel (0–1)
dense sands, silt, gravel (1–2)
Sandstone (2–15.2)
123018260
This
study
ordinary pile
PCM pile
1.5
1.5
0.2
0.2
free
free
Mid-density sand Dr = 0.6 (0–1.5)12.05
12.49
32.77
37.48
12.6
12.2
97.5
65.0
Note: α 1 is the coefficient of pile thermal expansion is the elasticity modulus of the pile, T is the temperature change a n d   σ ¯ T , max is the maximum axial thermal stress.
Disclaimer/Publisher’s Note: The statements, opinions and data contained in all publications are solely those of the individual author(s) and contributor(s) and not of MDPI and/or the editor(s). MDPI and/or the editor(s) disclaim responsibility for any injury to people or property resulting from any ideas, methods, instructions or products referred to in the content.

