Article

A Substitute for Portland Cement: Experiments on Ecofriendly Reinforcement of Large-Scale Calcareous Sand by Microbial-Induced Carbonate Precipitation Spraying Method

1
Hainan Institute, Zhejiang University, Sanya 572025, China
2
Ocean College, Zhejiang University, Zhoushan 316021, China
3
Department of Offshore Energy, Norwegian Geotechnical Institute, Sandakerveien 140, 0484 Oslo, Norway
4
Key Laboratory of Offshore Geotechnics and Material of Zhejiang Province, College of Civil Engineering and Architecture, Zhejiang University, Hangzhou 310058, China
*
Author to whom correspondence should be addressed.
Sustainability 2024, 16(1), 225; https://doi.org/10.3390/su16010225
Submission received: 30 November 2023 / Revised: 16 December 2023 / Accepted: 19 December 2023 / Published: 26 December 2023

Abstract

:
In order to respond to the greenhouse effect and achieve sustainable development, microbial-induced carbonate precipitation (MICP) technology based on the spraying method was used as a substitute for Portland cement to reinforce calcareous sand. In order to simulate the tide and determine the suitable concentration, the effects of the initial water level and cementing solution (CS) concentration on the reinforcement were analyzed. The results showed that the distributions of penetration resistance and equivalent calcium carbonate content mainly include two patterns: monotonically decreasing, and initially increasing and then decreasing. The fully saturated case only showed a dense, thin layer of calcium carbonate on the surface, and in the completely dry case, middle cementation was produced. When the initial water level was 0.5 m, the largest range of 60 cm of effective cementation appeared, and both the equivalent calcium carbonate content and penetration resistance were the highest because the microorganisms were more likely to migrate to the particle connection. The calcium carbonate generated by the MICP reaction played a role in increasing the water retention capacity of the sand. As the degree of cementation increased, the SWRC gradually moved up and the matrix suction corresponding to the same volume water content increased sequentially. Increasing the spraying times and the concentration of CS generated more calcium carbonate. The penetration resistance of higher CS concentrations was larger with the same calcium carbonate content. There was a linear relationship between the normalized penetration resistance and the normalized shear wave velocity.

1. Introduction

Dredged calcareous sand needs to be reinforced to avoid instability and erosions under wave or tidal actions. Portland cement, lime [1], and chemical materials [2] are generally used to reinforce the calcareous sand. However, chemical grouting materials are generally poisonous, and when used for soil reinforcement on islands, they pollute the ground and threaten the fragile ecosystem of the islands. As the most widely used building cementitious material, Portland cement can achieve a higher strength in a short period of time, but its production and use cause severe adverse effects on the island environment. The manufacturing process of Portland cement is extremely energy-intensive due to the requirement of heating clinker at the high temperature of 1500 °C [3]. In addition, the manufacturing process is a major source of carbon dioxide emissions and the greenhouse effect [4,5], accompanied by the emission of harmful substances such as oxides of nitrogen and sulfur [6]. Gu et al., 2022 investigated the effects of cement content and curing period on the engineering properties and hydration reactions of Portland-cemented-calcareous sand [7]. The results of Ismail et al., 2002 showed that samples prepared using Portland cement showed ductile yield and strong dilation afterwards [1]. The mechanical research of nano-SiO2-modified cement-stabilized calcareous sand was carried out by Luo et al., 2022 through an unconfined compression strength test, split tensile strength test, and one-dimensional consolidation test. The results show that when the cement-stabilized calcareous sand was solidified with 4.5‰ nano-SiO2, the unconfined compressive strength reached the maximum after 7–14 days of solidification [8]. The modification effect of graphene oxide on the mechanical properties of calcareous sand cement mortar was analyzed by Hu et al., 2023, and the results showed that graphene oxide promotes the hydration reaction of calcareous sand–cement mortar [9]. Although using Portland cement to reinforce the calcareous sand can achieve greater strength in a short time, the use of Portland cement on the island blocks the pores, greatly reduces the permeability of the calcareous sand, and thereby compresses the living space of organisms and plants. Therefore, it is necessary to seek suitable techniques to improve the engineering characteristics of the calcareous sand.
As an innovative ground improvement technique, bio-grouting based on microbial-induced carbonate precipitation (MICP) has been widely recommended in ground improvement due to its eco-friendly features and sustainable application. The urea hydrolysis takes place when the Sporosarcina pasteurii catalyzes the reaction of urea hydrolysis to produce NH4+ and CO32+. The carbonate ions precipitate in the presence of calcium ions as calcium carbonate crystals, which coat and bond sand particles to improve the mechanical and engineering properties [7,10,11,12,13,14,15]. The reactions are as follows:
CO ( N H 2 ) 2 + 2 H 2 O b a c t e r i a 2 NH 4 + + CO 3 2
CO 3 2 + Ca 2 + CaCO 3
The MICP technique has been reported to reduce soil settlement [16,17], mitigate liquefaction [18,19,20], control internal erosion [13], and improve shear strength and stiffness [21,22,23]. Immersion, grouting, and spraying methods are three methods in the application of the MICP technique. The immersion method can obtain relatively uniform and high-strength samples, but this is more difficult in practical applications. Grouting can achieve deeper soil reinforcement, but grouting pipes need to be installed, which increases the construction difficulties. Surface spraying is preferred for the treatment of large surficial areas [1]; it can create a surface bond layer to resist environmental erosion [24]. The MICP technique was used to produce an anti-erosion layer on the surface of tabia. The results showed that MICP can significantly improve the water resistance of a soil sample by changing the microstructure of the surface [25]. The results of Liu showed that the calcium carbonate crust produced by the spraying method was responsible for the enhanced water stability and mechanical strength of the topsoil [26]. Dagliya evaluated the feasibility of the MICP technique to mitigate wind-induced erosion of desert sand, and the results showed that a lower erosion was observed in all bio-cemented sand samples when compared to untreated sand [27]. As the main product of MICP, calcium carbonate crystals mainly play the role of particle cementation, particle coating, and void filling. The distribution of calcium carbonate determines the effect of spraying reinforcement. There are roughly two distribution patterns of calcium carbonate along the depth by spraying reinforcement: (1) the calcium carbonate content gradually decreases along the depth, and the maximum calcium carbonate content is distributed at the surface layer in this condition [14,28,29,30]; and (2) the calcium carbonate content initially increases and then decreases with the depth, and the maximum calcium carbonate content is located at a certain position below the surface [24]. The key issue in ground improvement by the surface spraying method is the control of reinforcement depth, which depends on the relative ratio of transport rate and reaction rate. To date, a series of related studies have been carried out which indicated the visible application prospects of MICP techniques in ground improvement based on the spraying method. However, some issues still need further investigation: (1) The field conditions are complex and changeable, and the variables are difficult to control accurately, especially the influence of key parameters such as the concentration of cementing solution (CS) and the water level on the penetration resistance and calcium carbonate distribution in the special medium of calcareous sand, which are still unknown. (2) The temporal and spatial evolutions of matrix suction, volumetric water content, and shear wave velocity during spray infiltration are not yet clear. At present, there is no systematic study on the reaction of calcareous sand reinforced by the MICP technique based on the spraying method.
In this study, the reinforcement of calcareous sand by the MICP spraying method was carried out based on self-developed unsaturated infiltration equipment. The effects of initial water level, CS concentration, and spraying times on the penetration resistance and calcium carbonate distribution were analyzed for the first attempt, and the influence of MICP reaction on the soil–water characteristic curve (SWRC) was also discussed. The evolutions of shear wave velocity, volumetric water content, and matrix suction in the complete reaction were monitored.

2. Experimental Setup

2.1. Experimental Equipment

As shown in Figure 1a, the equipment consists of a soil column, sprinkler, and monitoring system. The diameter of the circular sprinkler is about 30 cm, and there are 144 spray holes evenly distributed. A grouting pipe with a diameter of 1 cm was used to connect the sprinkler and the pump, and the spraying rate was controlled at 0~2.77 L/min. In order to ensure the precise control of the spraying rate, all the air in the pipe should be exhausted before the formal test, and all the grouting pipes were filled with the solution. The inner diameter and height of the test device are 30 cm and 100 cm, respectively. Figure 1b,c show the schematic diagram and sensor layout. Four EC-5 moisture sensors (range 0~100%, resolution 0.1%) were installed in the center of the soil column with 20 cm intervals. Four matrix potential sensors (MIK-P300, range −100 kPa~0, resolution ± 0.2%) were also set at the relative positions at the same height as the EC-5 moisture sensors. The sensors were marked as a#, b#, c#, d# from top to bottom. In addition, four pairs of bender elements were arranged at the same height to monitor the evolution of the shear wave velocity. The dried calcareous sand was evenly filled into the device by layered filling method (10 cm/layer), and the diameter and height of the sand sample were 30 cm and 78 cm, respectively. The dry density of the sand sample was controlled to be about 1.278 g/cm3, corresponding to a porosity of 0.545. The d# sensor was 8 cm away from the bottom of the calcareous sand, and the lower part of the device was filled with a 5 cm gravel filter layer to reduce local disturbance of fluids to calcareous sands.

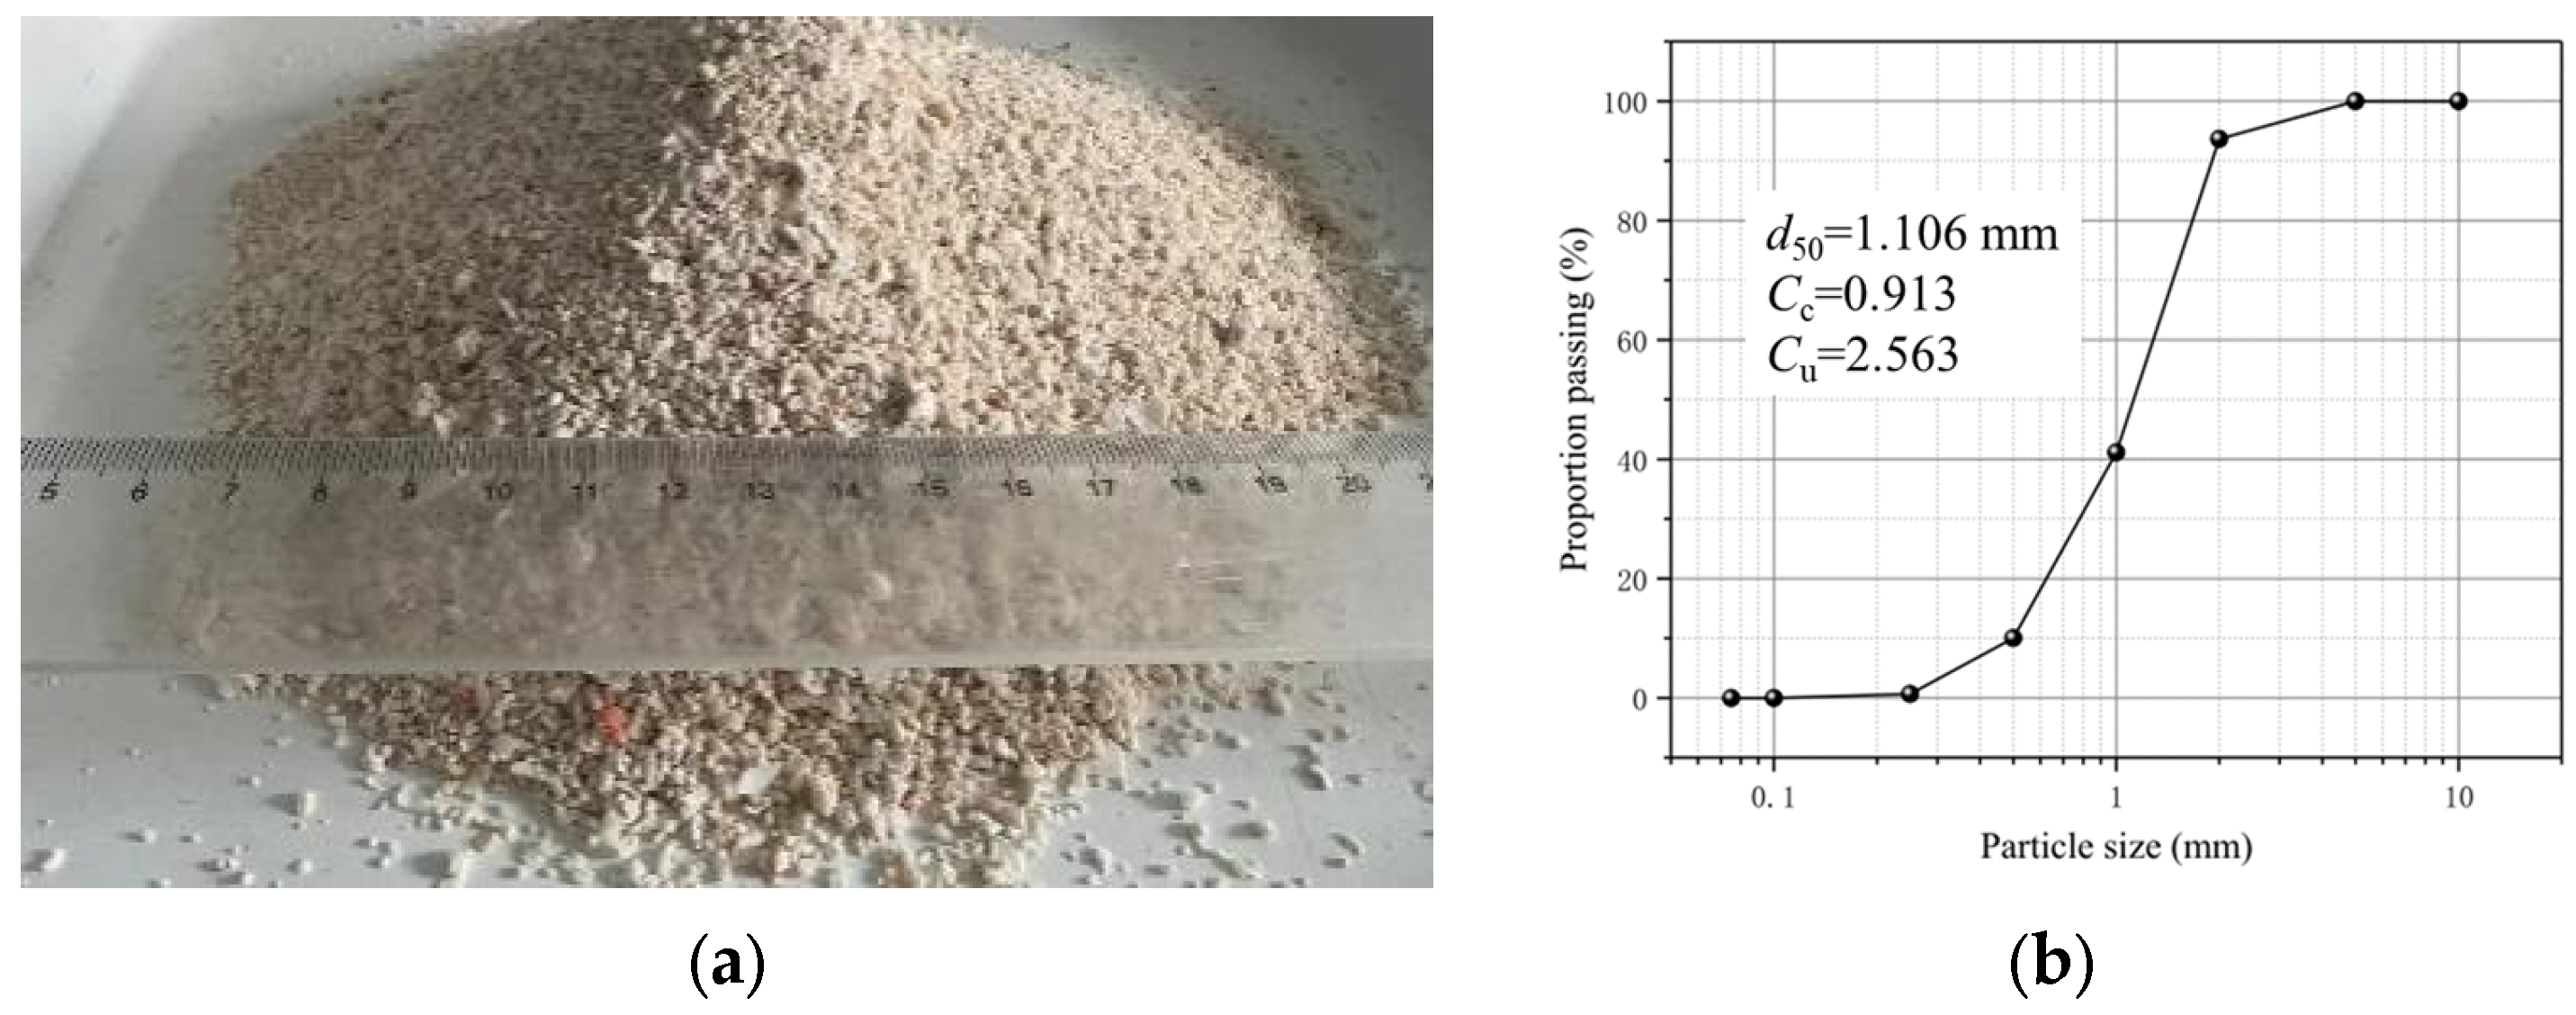
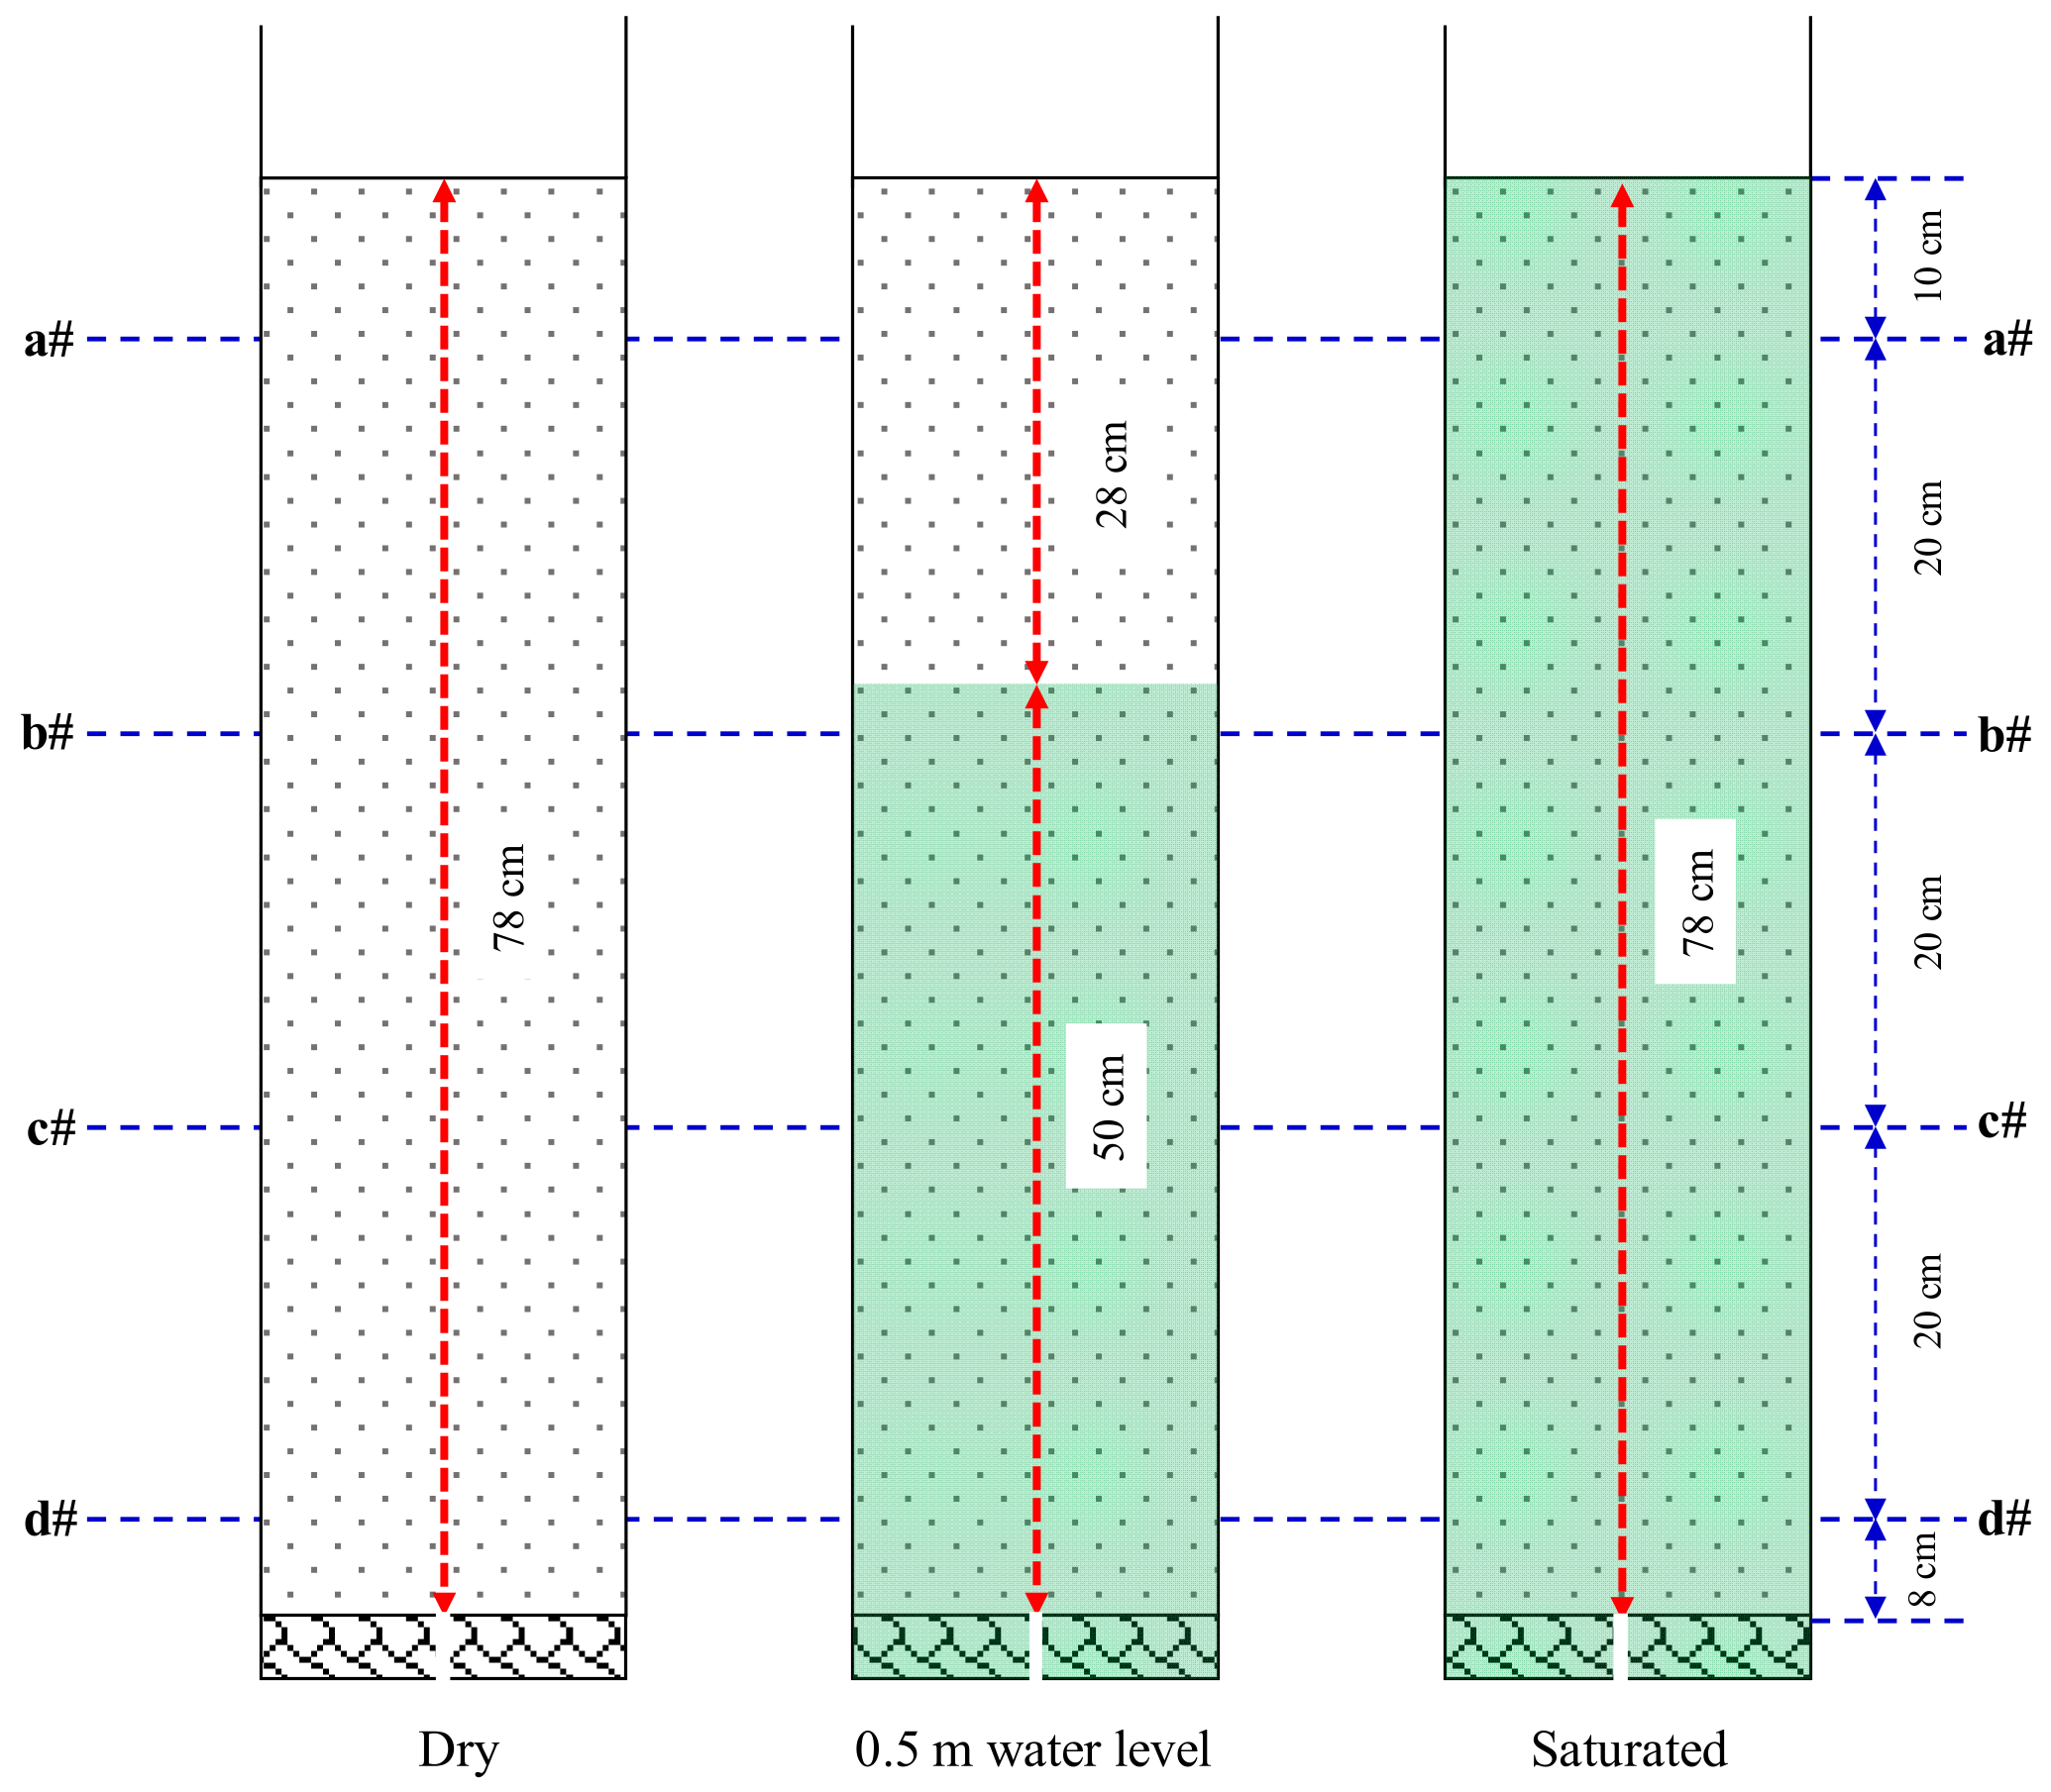
2.2. Experimental Materials and Treatment Process of Spraying Method

As shown in Figure 2, the calcareous sand with irregular particle shapes used in this test was taken from an island in the South China Sea. The calcareous sand underwent an initial purification with distilled water followed by a thorough drying process. The median particle size d50, coefficient of curvature Cc, and coefficient of uniformity Cu were 1.106 mm, 0.913, 2.563, respectively. Sporosarcina pasteurii (ATCC 11859, which was purchased in China General Microbiological Culture Collection Center), a non-pathogenic bacterium, was cultivated under a 2% vaccination ratio in an aerobic batch growth medium, which consisted of 20 g/L yeast extract, 10 g/L ammonia sulfate, and 0.13 mol/L Tris buffer. The bacterial solution (BS) was grown at 30 °C in a shaking incubator (200 rpm) for about 24 h before being harvested at a final optical density (OD600) of approximately 1.725~2.090 and an urease activity of approximately 7.11~9.11 mM urea hydrolyzed/min [31]. The cementing solution (CS) was prepared by equimolar concentration of urea and calcium chloride, and concentrations of 0.5, 1, 2 mol/L were selected in this study. As shown in Figure 3, pure water was slowly injected from the bottom of the sample to simulate different water levels, including the dry state (initial water level was zero), a water level of 0.5 m high (from the bottom of sand sample), the fully saturated state (initial water level was 78 cm). Two-stage spraying method was adopted. First, 0.25 times the pore volume of the BS was sprayed onto the surface of the sand with a rate of 1 L/min, and then 0.25 times the pore volume of the CS was also sprayed onto the surface of the sand with the same rate. Reaction was left to stand for about 23.5 h after that, the interval between two consecutive treatments was 24 h. The water level was controlled by adjusting the valve at the bottom during the spraying process. The detailed design of the test is summarized in Table 1, and a total of 7 sets of model tests were carried out to study the effects of initial water level, CS concentration, and spraying times on cementation effect. Among them, 1, 1-2, 1-2-3 represent the treatments of 1, 2, and 3 spraying times, respectively. All tests were conducted in a conventional indoor environment, with a temperature of approximately 23~27 °C and a humidity of 40~50% RH.

2.3. Assessment Methods

The bender elements were used to collect the shear wave velocity at a certain time interval with test. After the test, the sample was excavated to remove the loose uncemented calcareous sand, and the penetration resistance and equivalent calcium carbonate content were tested at different depths. At least 5 measurements were taken at the same depth to obtain the average value and standard deviation of the penetration resistance, and at least 3 samples were selected at the same depth for the determination of the equivalent calcium carbonate content.
(1)
Shear wave velocity
Four pairs of bender elements were installed at four positions on the transparent cylinder wall, and the distance between the two probes of bender elements was 30 cm. A sine wave with a frequency of 5 kHz and an amplitude of 10 V was excited and received by the bender element. As shown in Figure 4a, red and green waveforms represented excited and received waves, respectively. According to the “start to start” method [32], the propagation time Δt of the shear wave within the range of 30 cm was determined to calculate the shear wave velocity.
(2)
Penetration resistance
Penetration resistance can be used to quickly evaluate the strength of cemented samples, so it has been widely used in the applications of MICP technique [14,33,34,35]. In order to quantify the cementation degree of calcareous sand, the penetration resistances at different depths were measured using the MPT micro-penetrometer shown in Figure 4b. The probe cone angle, range, and resolution were 30°, 0~2660 kPa, ±1%, respectively.
(3)
Equivalent calcium carbonate content
Since the main component of calcareous sand is calcium carbonate, the traditional acid-washing method cannot be used to measure the calcium carbonate content. In this study, the equivalent calcium carbonate content was obtained using a previous method of measuring soil water absorption [36]. The specific operations and calculations included the following: (1) 30~40 g sand samples were taken from the cemented body and subjected to desiccation at 60 °C until a stable mass was achieved; (2) the dry sample was immersed in distilled water for a duration of 24 h, ensuring complete saturation of the specimens; (3) the sample was extracted from the container, any superficial moisture was eliminated using a towel, and the mass of the superficial dried sample was ascertained; (4) the decrease in porosity n of the cemented sample was assumed to be entirely caused by calcium carbonate precipitation, to convert the equivalent calcium carbonate content.
Δ n = n 0 ( m s m d ) / ρ w ( m s m d ) / ρ w + m d / ρ c
C _ CaCO 3 = Δ n × ρ c ρ o
where C_CaCO3 (%), Δn, n0, ms, md, ρw, ρc, ρo represent equivalent calcium carbonate content, porosity reduction, initial porosity, mass of superficial dried sample, mass of dry sample, water density at 4 °C, density of calcium carbonate (taken as 2710 kg/m3 in this study), and initial sand density, respectively.

3. Experimental Results and Analysis

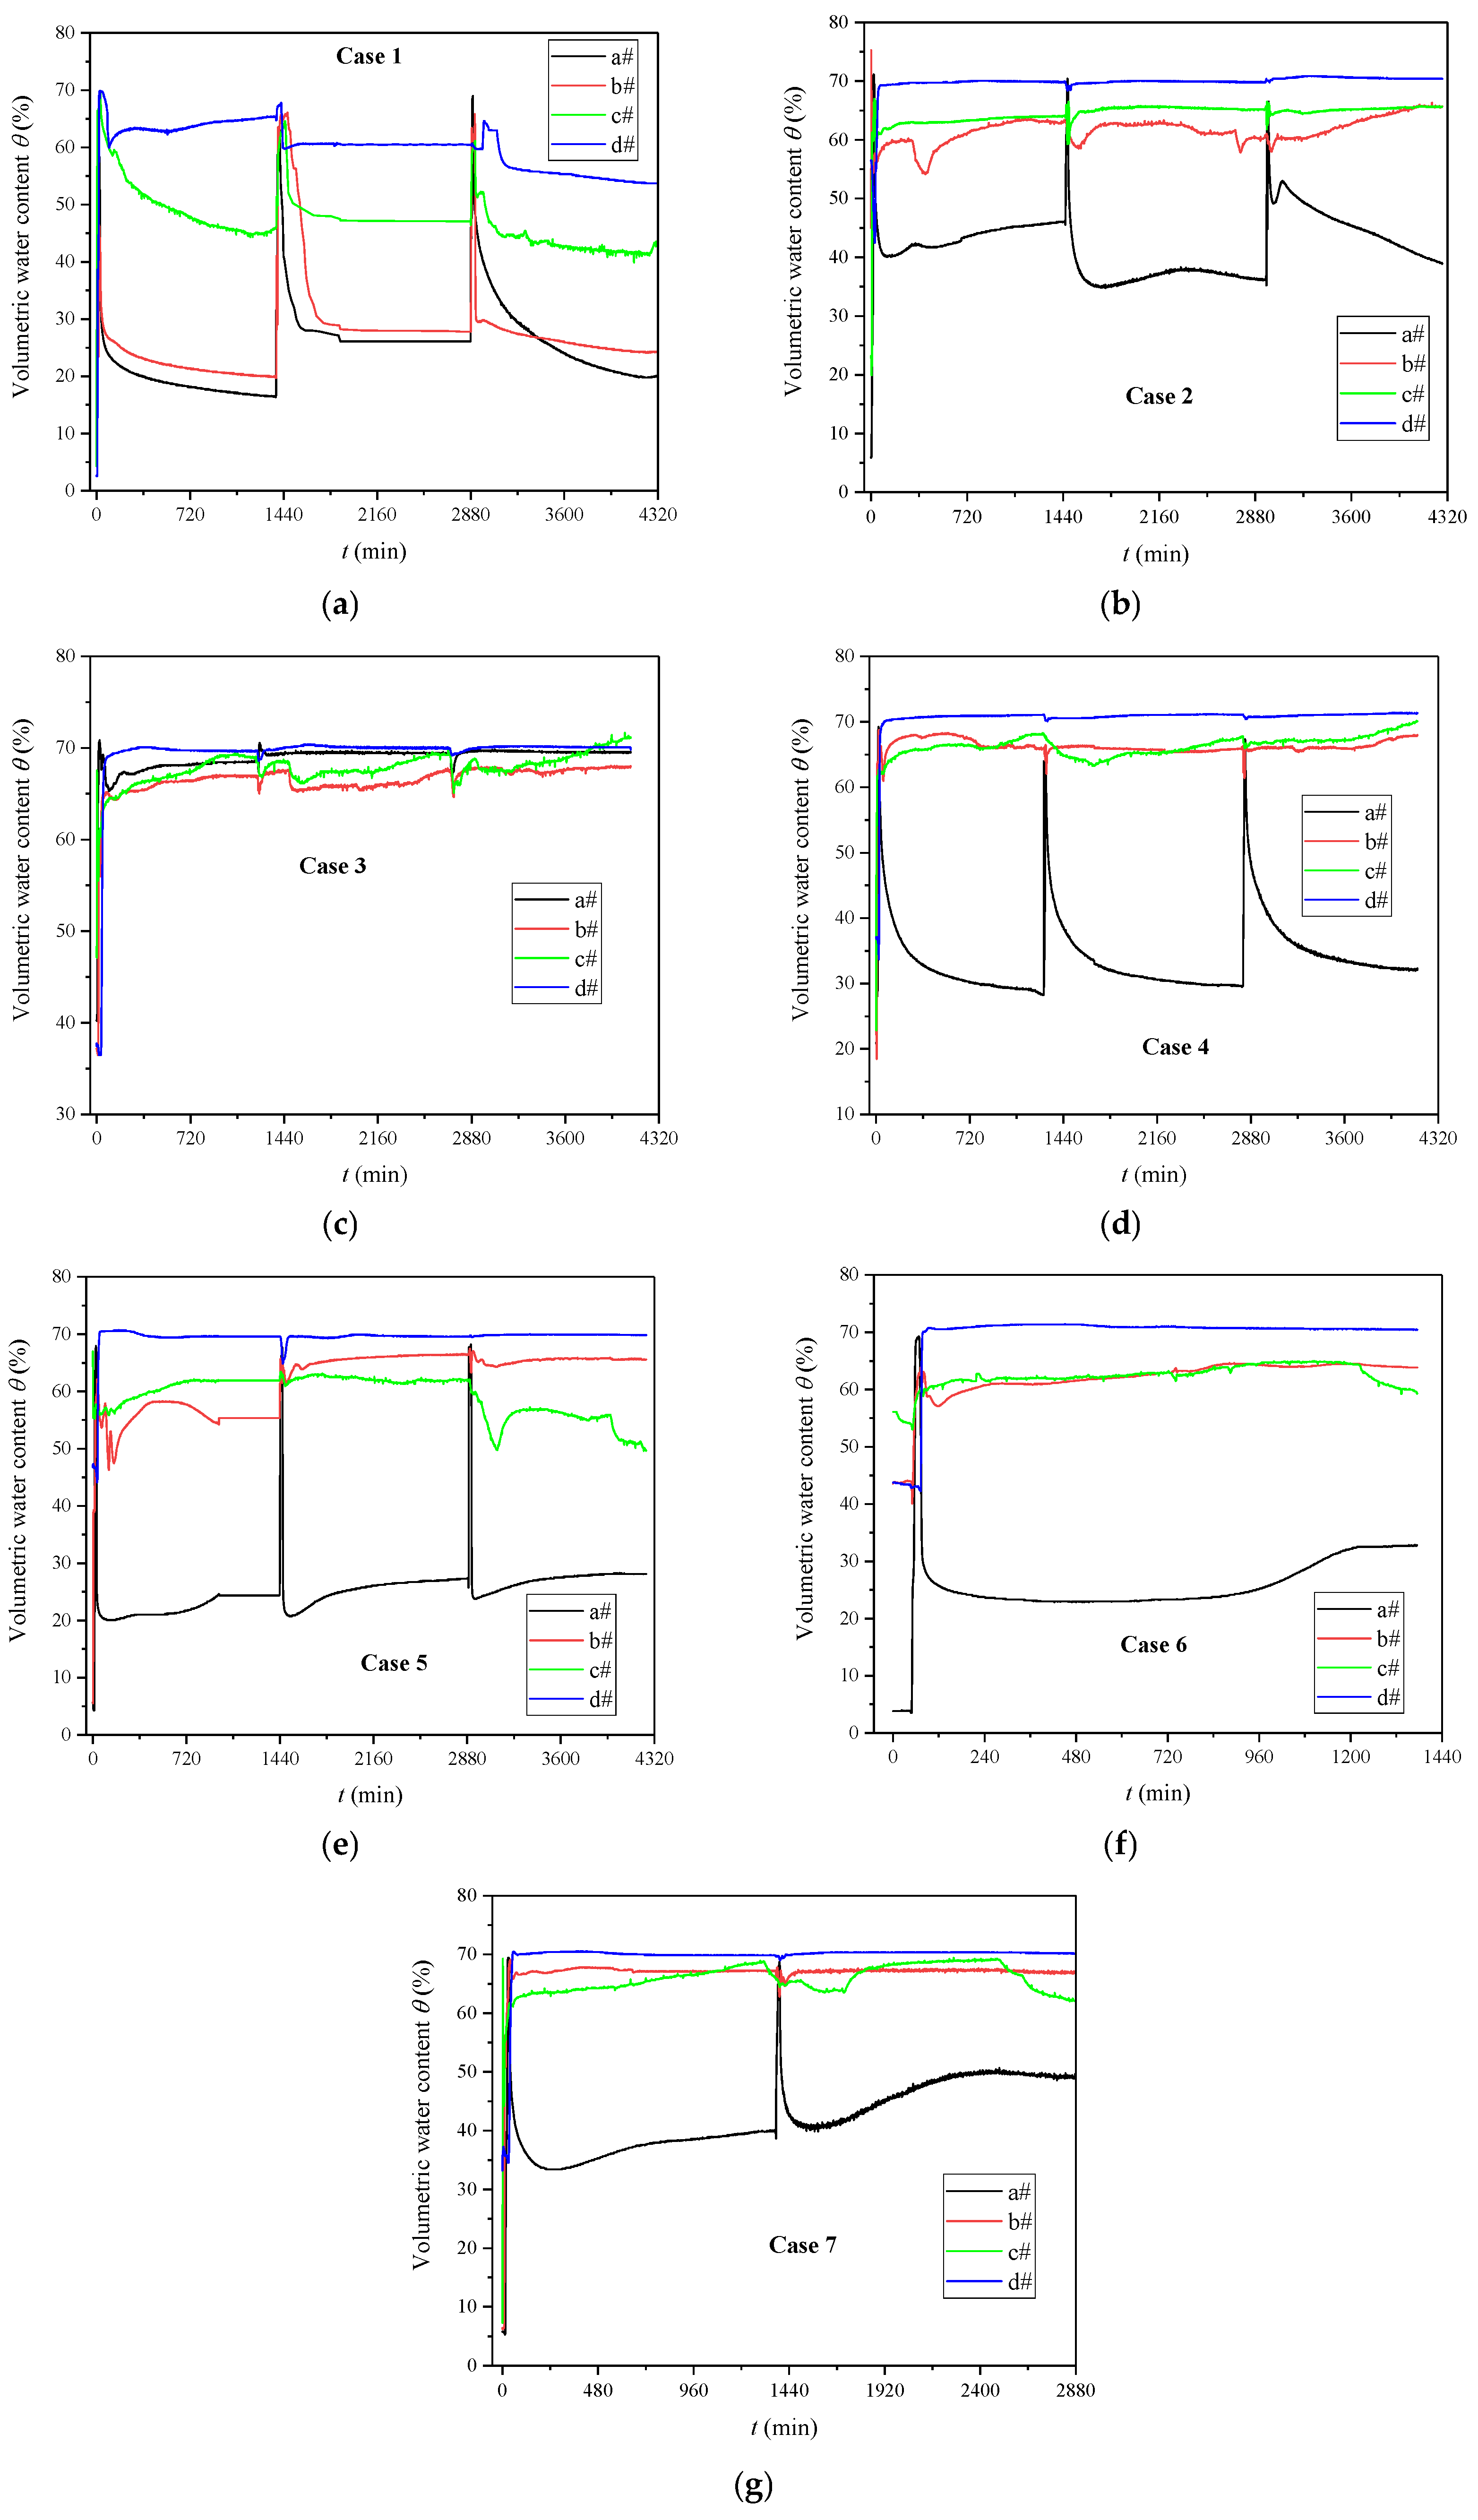
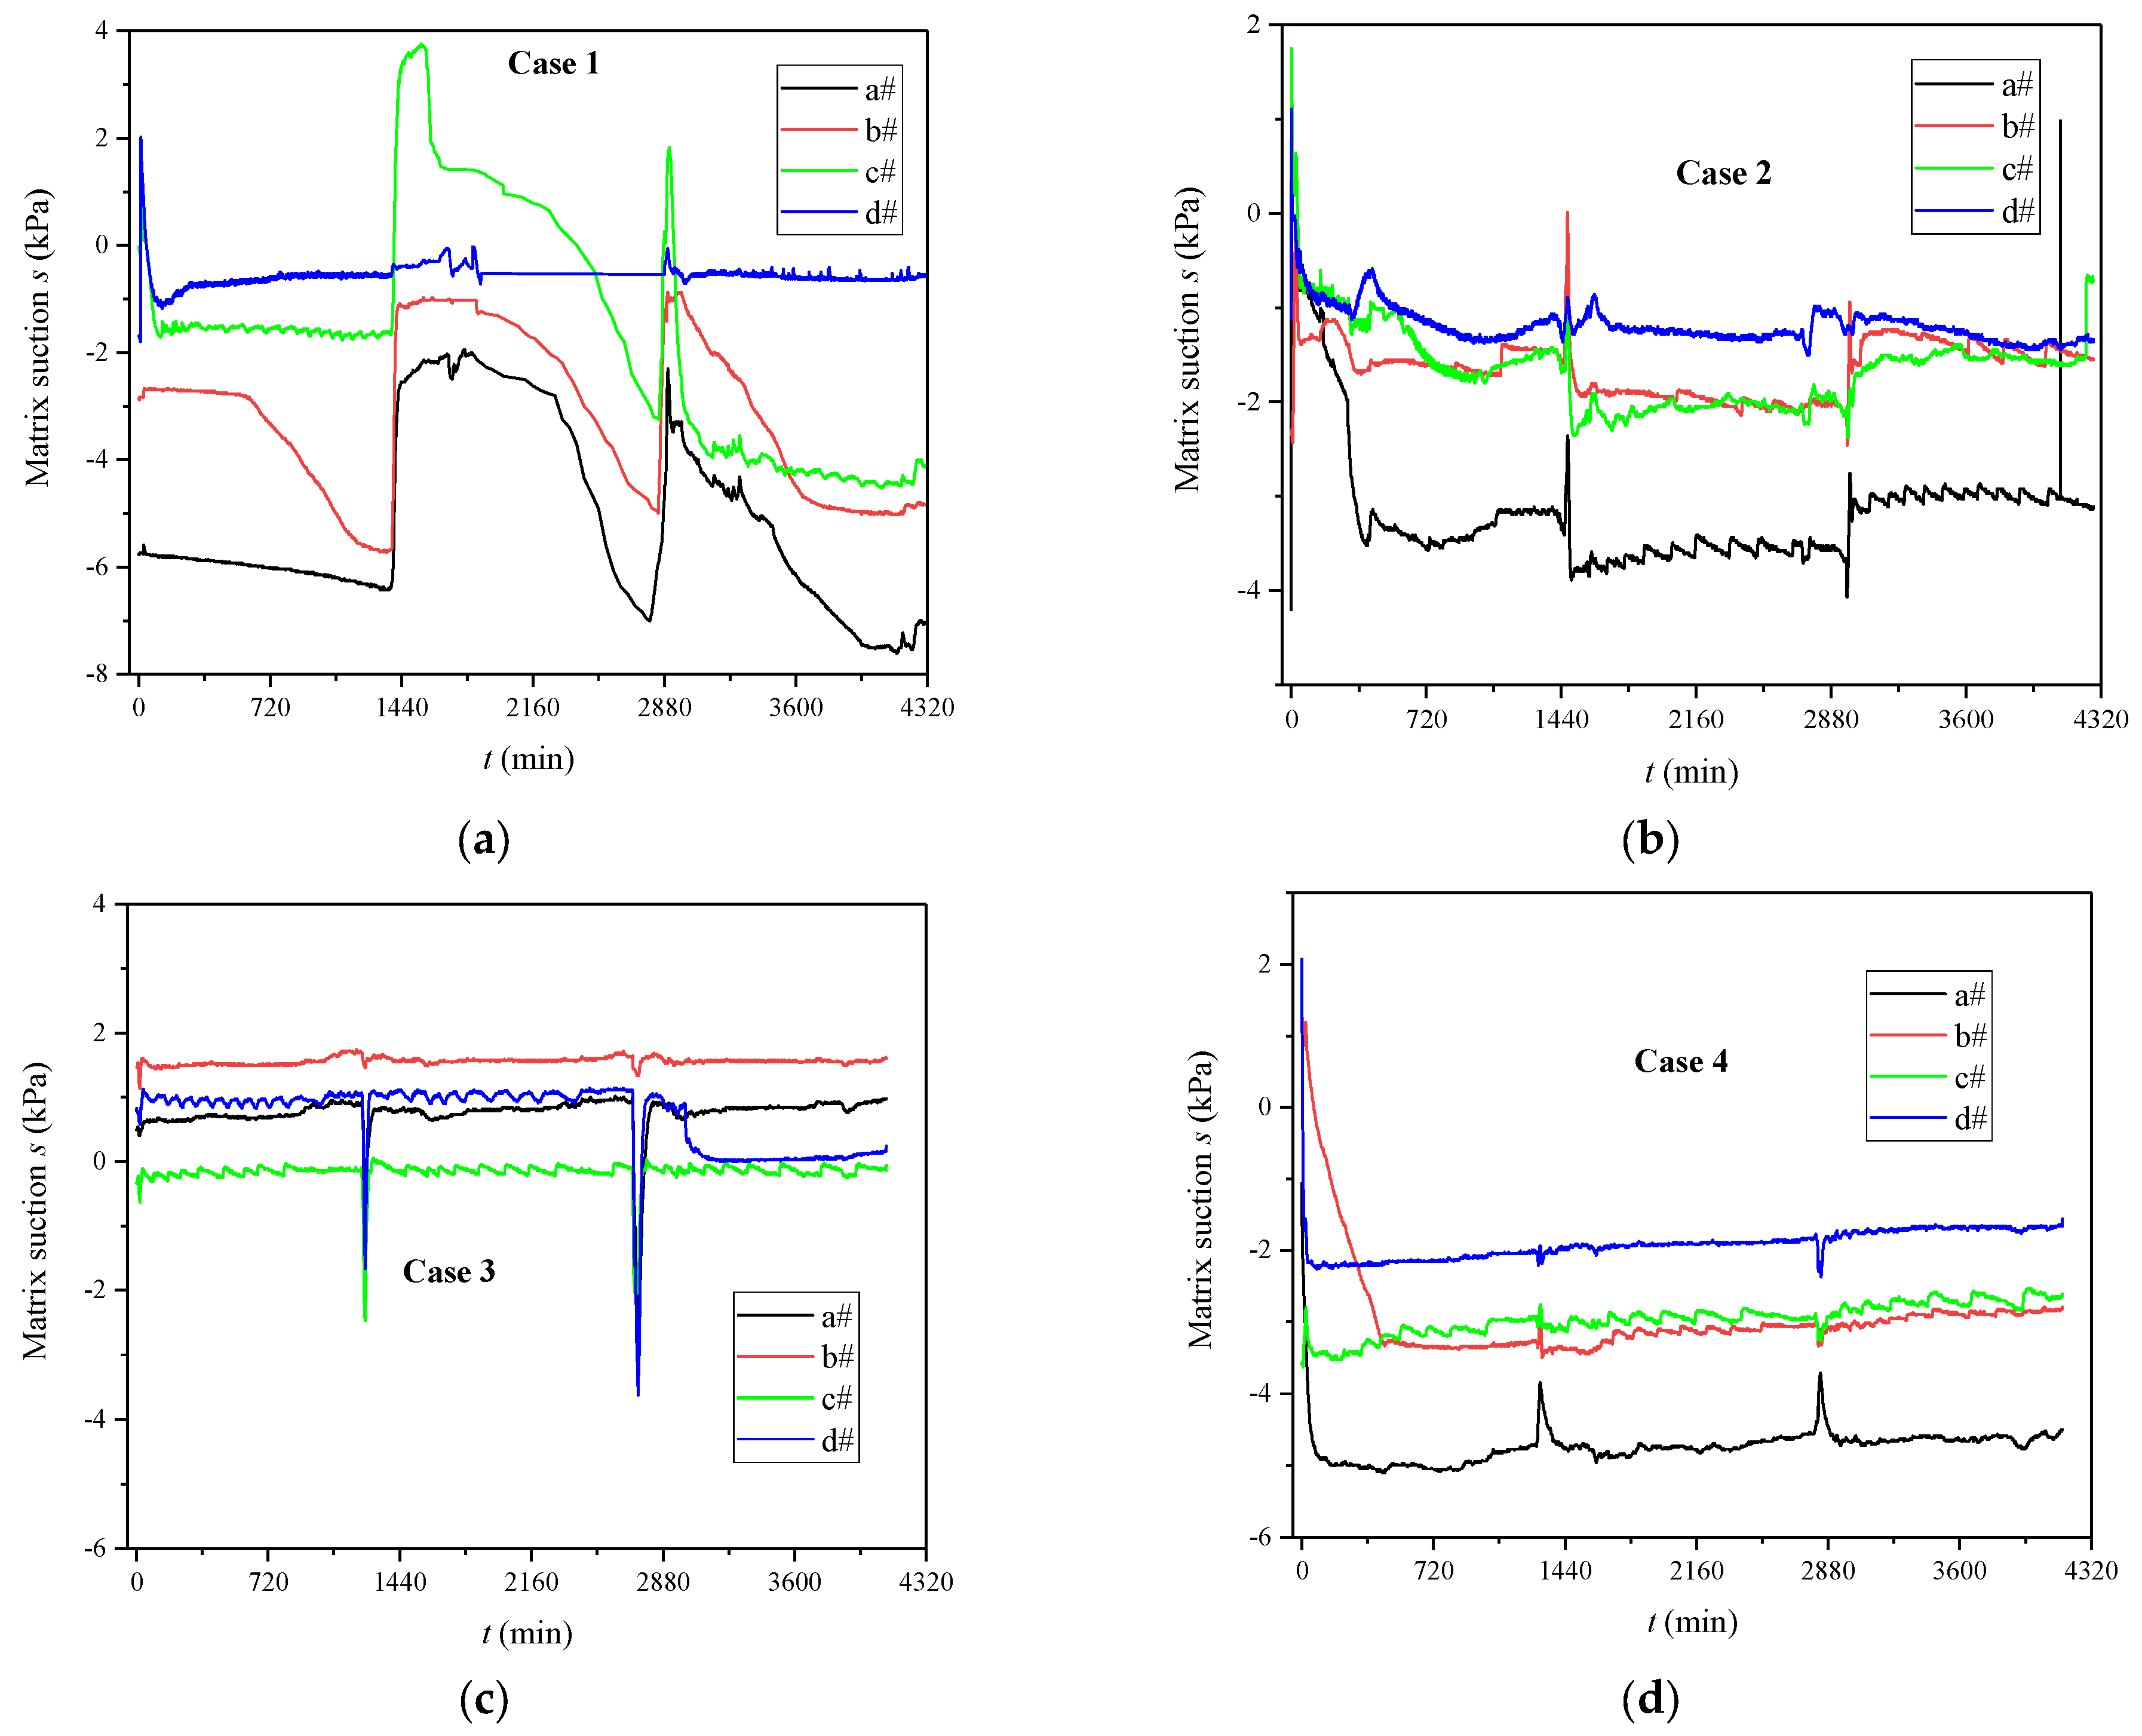
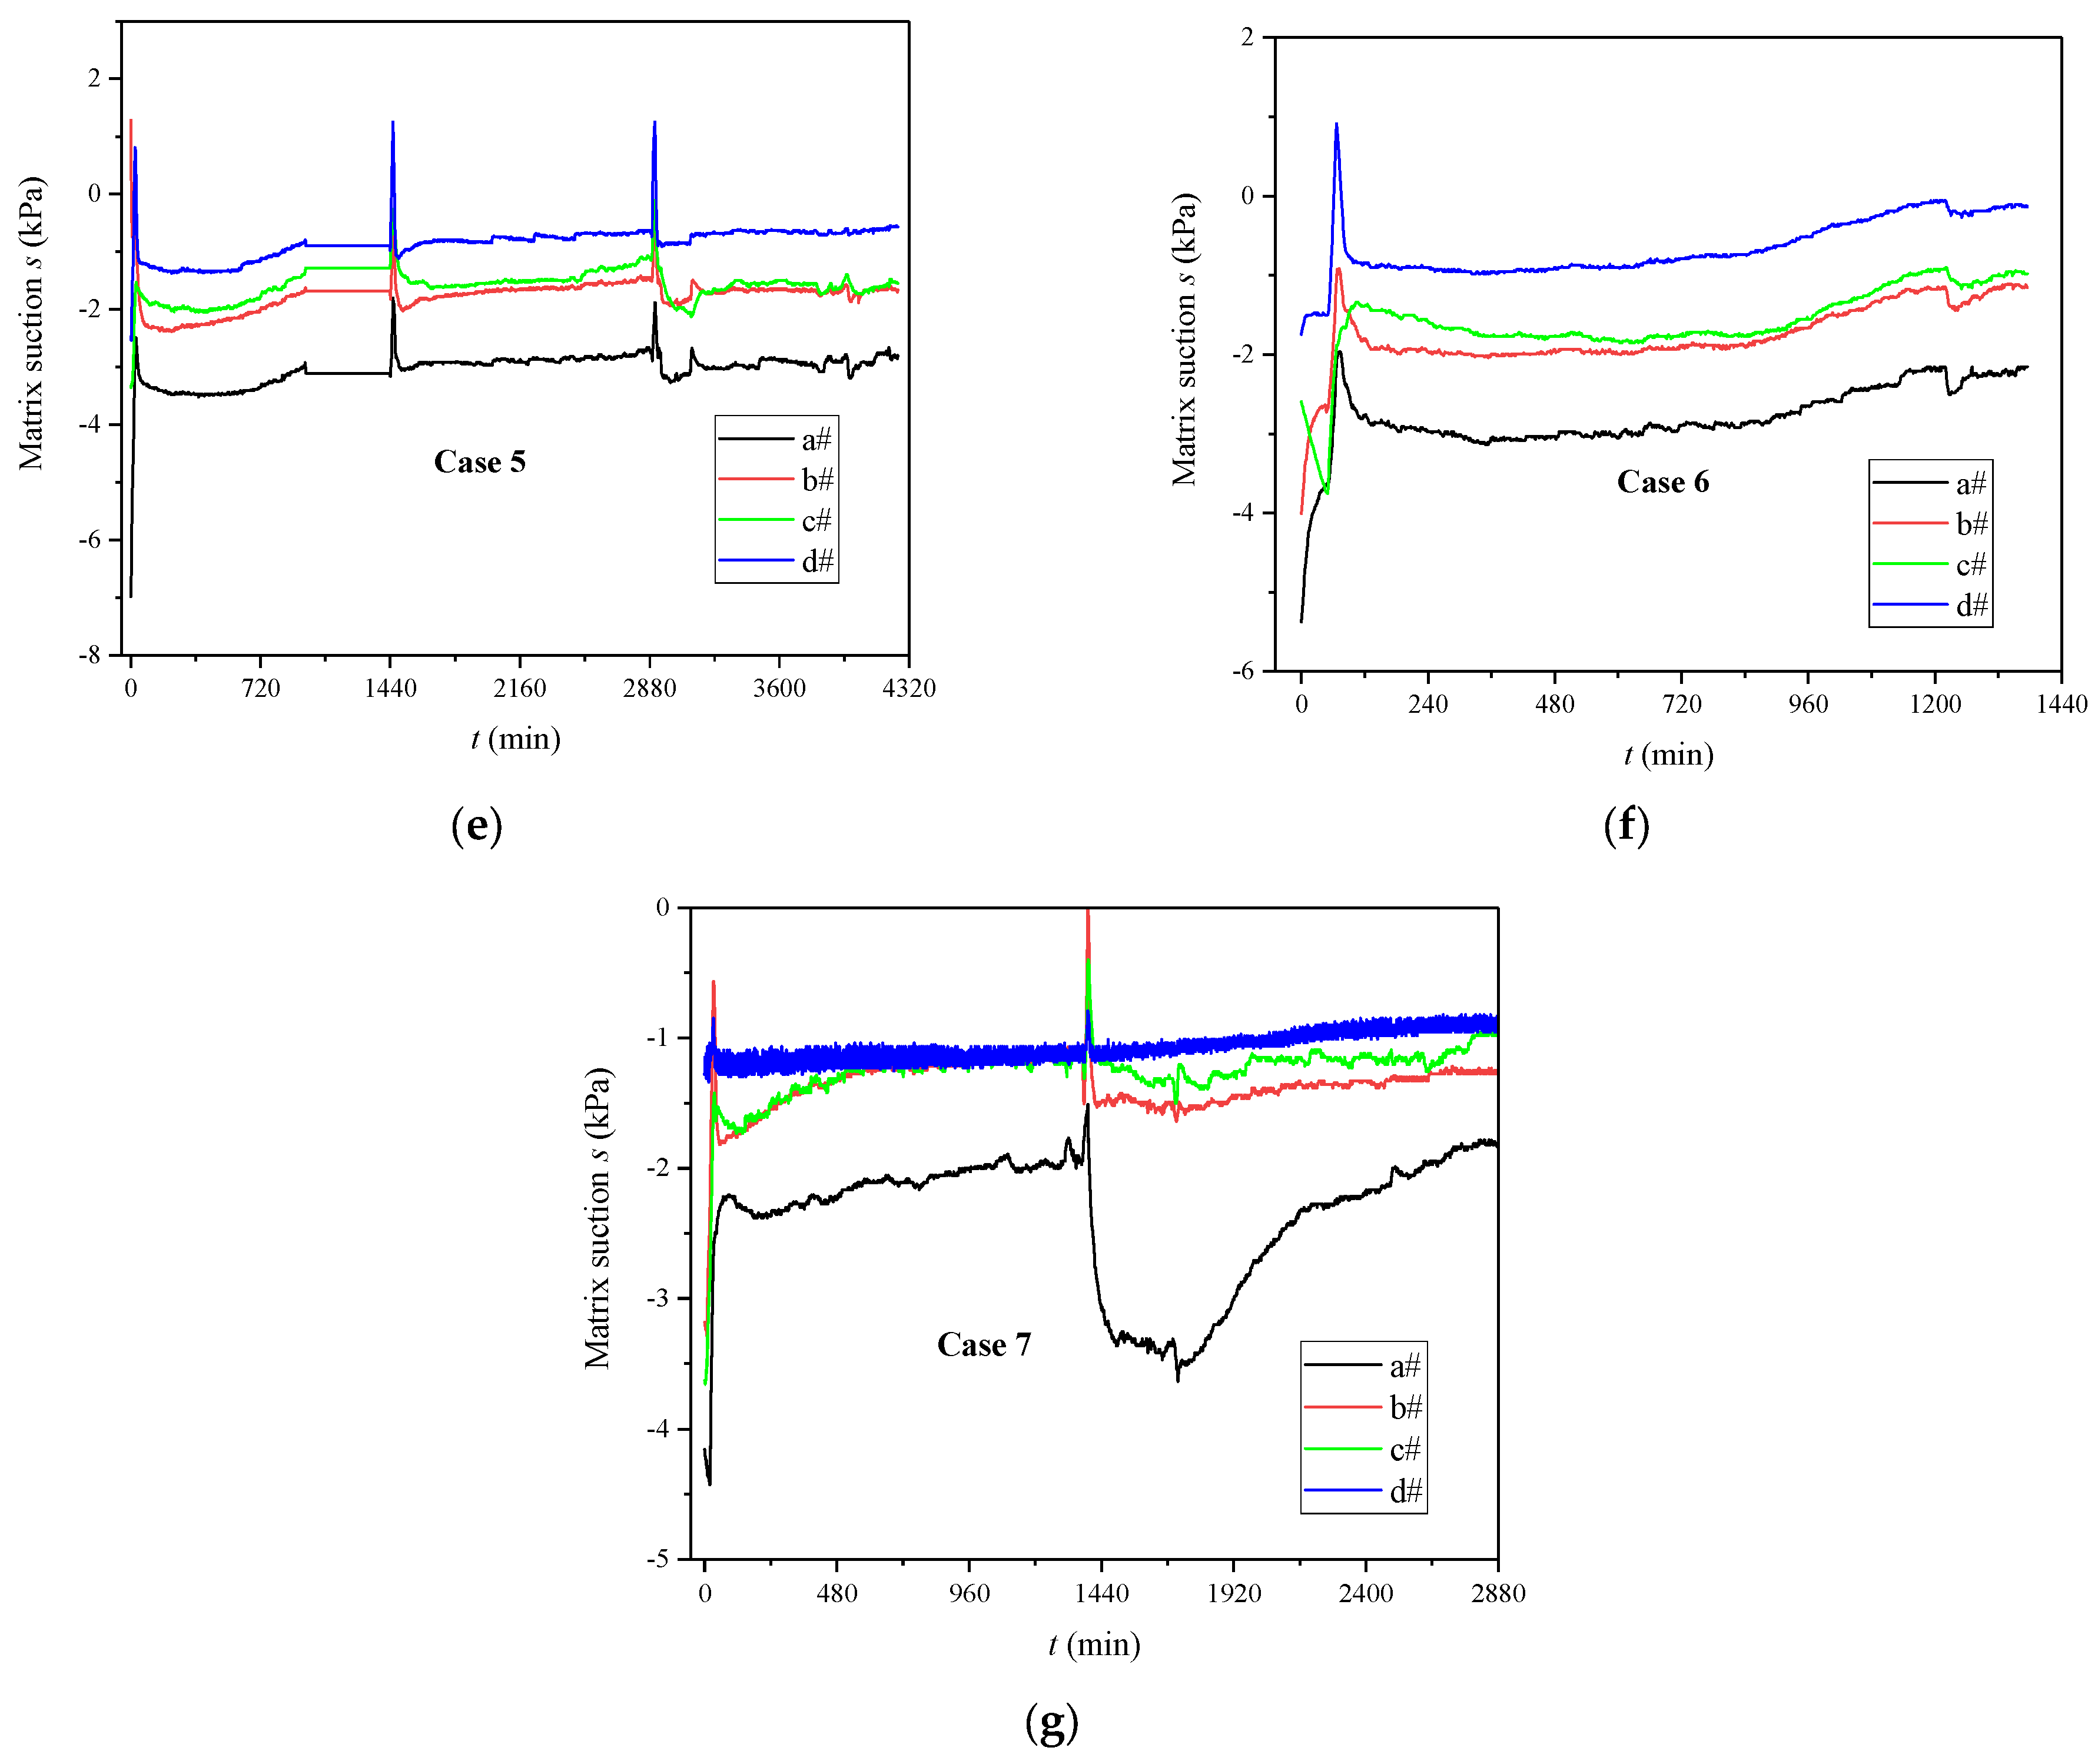
3.1. Evolutions of Volumetric Water Content and Matrix Suction

Figure 5 and Figure 6 show the variations in volumetric water content and matrix suction of all cases during the test period. In general, the volumetric water content gradually increased to the peak value with every spraying operation. After the spraying was stopped, the volumetric water content showed a general trend of first decreasing rapidly and then stabilizing. Then, it increased to the peak value again in the next round of spraying operation. Correspondingly, the matrix suction showed an increase in the spraying stage and then showed a decreasing trend in the standing reaction stage, where negative values represented suction and positive values represented pressure. As shown in Figure 5a–c and Figure 6a–c, the initial water level led to different responses of volumetric water content and matrix suction. When the initial water level was zero, the sensors at the four positions of a#, b#, c#, and d# all showed similar evolution laws, and the a# sensor showed the largest matrix suction value and minimum volumetric water content. As the depth increased, the matrix suction value in the standing reaction stage gradually decreased, and the volumetric water content gradually increased. The d# moisture sensor at the position 8 cm above the bottom of the sand sample showed the highest volumetric water content and the smallest matrix suction. When the initial water level was 0.5 m, the sensors at positions b#, c#, and d# were all located underwater, their water content was relatively high, and the response in every spraying operation was not obvious. But the volumetric water content at position a# changed significantly, where the minimum volumetric water content could reach 35%, corresponding to a matrix suction of about 4.1 kPa. When the specimen was completely submerged in water, the volumetric water contents at all positions were close to the stable value of 70%, while the matrix suction sensor only showed a large suction value during the spraying operation. The concentration of CS showed little effect on the evolution of volumetric water content and matrix suction. As shown in Figure 5d,e and Figure 6d,e, the water content at position a# above the water level showed an obvious rapid increase–rapid decrease–stabilization. The influence of spraying times on the evolutions of volumetric water content and matrix suction is shown in Figure 5f,g and Figure 6f,g, respectively. The fluctuations of sensors at b#, c#, and d# below the water level over time were smaller than those at a#, and the overall law was similar.

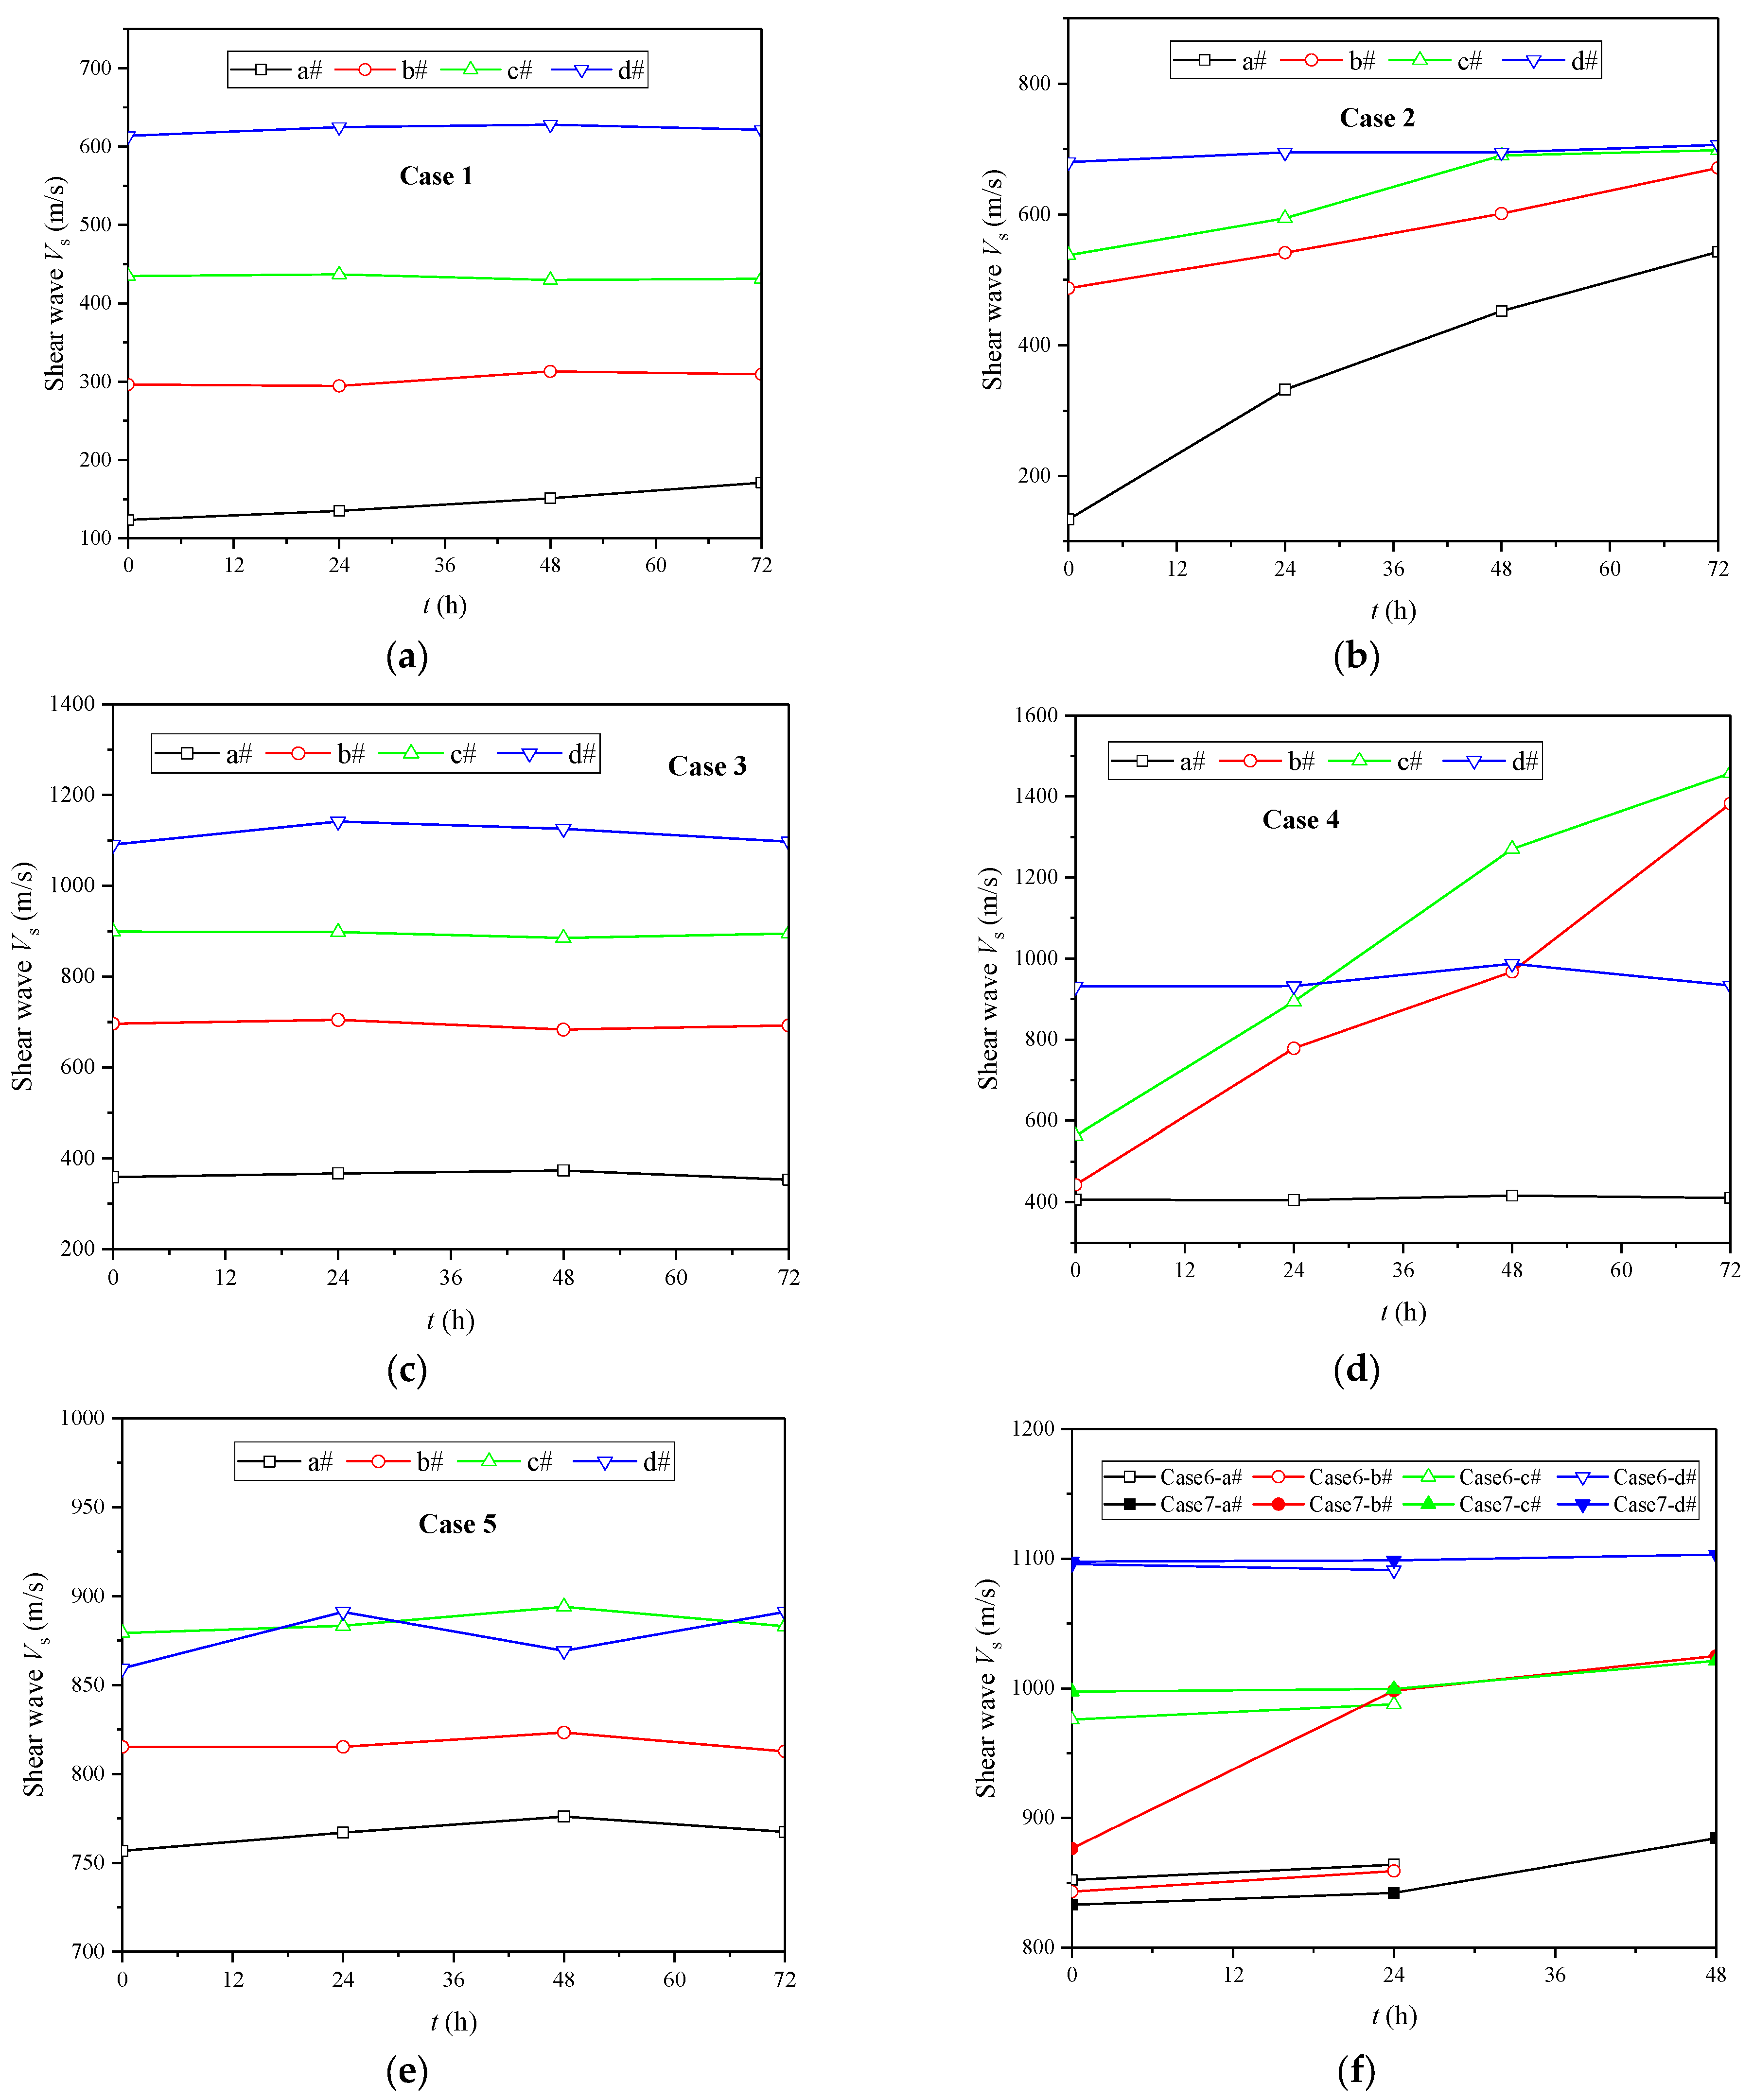
3.2. Evolution of Shear Wave Velocity

Figure 7a–c show the evolutions of the shear wave velocity over time with different initial water levels. When the initial water level was zero, only the shear wave velocity at position a# increased slightly, and no obvious increase in shear wave velocity was detected at the other positions, indicating that the sample below b# did not produce effective cementation. Combined with the volumetric water content and matrix suction, it can be found that only seepage and solute migration without cementation occurred in the part below b#. When the initial water level was 0.5 m, the bender elements at positions a#, b#, and c# all detected a gradually increasing shear wave velocity. The shear wave velocity at the a# position increased from 133.4 m/s to 543.1 m/s, while the shear wave velocity at the d# position did not change much, indicating that there was no obvious cementation. When the sand sample was fully saturated, no obvious shear wave velocity increase signal was detected at a#, b#, c#, and d# positions, indicating that the sand below a# was not cemented. The saturated state had a certain inhibitory effect on the calcium carbonate deposition of MICP reaction. In addition, it can be found that the shear wave velocity value increased correspondingly with the increase in embedding depth.
Figure 7d,e show the evolutions of shear wave velocity over time with CS concentrations of 2 mol/L and 0.5 mol/L. The 0.5 mol/L CS concentration did not produce effective cementation. When the concentration of CS increased to 2 mol/L, the shear wave velocity values at a# and d# did not increase significantly, but the shear wave velocity values at b# and c# approximately showed a linear increase over time. Figure 7f shows the evolutions of shear wave velocity with different spraying times. It can be found that 1 spraying treatment time could not effectively reinforce the calcareous sand, and the shear wave velocity values at the four measuring points did not increase. The reason was that the MICP reaction was relatively slow, and no calcium carbonate deposition occurred within 24 h. After 2 spraying treatment times, the shear wave velocity at a# and b# increased significantly, and the shear wave velocity at b# especially increased from 876.6 m/s to 1025 m/s. This showed that at least 2 spraying treatment times were required to produce certain cementation in this study.

3.3. The Influence of Initial Water Level

Figure 8a summarizes the distribution of penetration resistance with depth for each case with different water levels. When the initial water levels were zero and 0.78 m, the penetration resistance gradually and monotonically decreased with the increase in depth, and the maximum penetration resistance appeared at the surface of the sand. As shown in Figure 8c, a relatively dense protective thin layer with a thickness of about 4–5 mm was formed on the surface of Case 3, which hindered the continuous infiltration of solutes. When the initial water level was 0.5 m, the penetration resistance showed a non-monotonic trend of first increasing and then decreasing over the depth, with a peak value of about 1080 kPa at a depth of 5 cm from the top of the specimen. Case 2 showed a deeper cemented thickness of 60 cm. The cemented range was about 22 cm when the initial water level was zero, while the cemented thickness was only about 3~4 cm at the surface under the fully saturated case.
Figure 8b shows the equivalent calcium carbonate content at different initial water levels. When the initial water level was zero or 0.78 m, the equivalent calcium carbonate content showed a monotonous decrease trend along depth. The surface-equivalent calcium carbonate content in the fully saturated state was higher, reaching 18.6%. The equivalent calcium carbonate in the dry case showed a deeper distribution range than that in the saturated case, and there were calcium carbonate deposits in the depth range of 20 cm below the top in Case 1. When the initial water level was 0.5 m, the maximum calcium carbonate content was 24% at 5 cm below the top of the sand sample. The equivalent calcium carbonate content showed a more significant fluctuation than the penetration resistance. Calcium carbonate deposition was controlled by the relative magnitude of solute infiltration (migration) rate and reaction rate. When the solute migration rate was higher than the reaction rate, there were sufficient solutes to infiltrate into the deeper layer of the sand and react. As the concentration of the pore solute increased, the reaction rate enhanced accordingly, thus consuming more reactants and increasing the deposition rate of calcium carbonate. The generation of calcium carbonate blocked the internal pores of the sand, reduced the permeability coefficient, and hindered the infiltration of solutes. Therefore, the distribution of equivalent calcium carbonate content with depth was the result of the coupled action of infiltration and reaction, resulting in the distribution of penetration resistance, as shown in Figure 8a. In this experiment, the calcium carbonate content showed two typical patterns: the distribution decreased monotonically with depth (reaction was greater than infiltration), and the distribution first increased and then decreased with depth (infiltration–reaction competition).
Figure 8c shows the cemented morphology of the sample after the test. It can be clearly found that there was an obvious cementation of calcareous sand at about 20 cm below the surface in the dry case, while the cementation with a depth of 60 cm was formed under the condition of the 0.5 m water level. When the calcareous sand was fully saturated, a hard crust appeared on the surface of the sample, and only about 5 cm of the surface layer showed obvious cementation. Compared with Case 1 and Case 2, the hard crust layer on the surface of Case 3 was denser. The main reasons were as follows: (1) The oxygen on the sample surface was sufficient, which was conducive to the growth and reproduction of microorganisms. Therefore, most microorganisms accumulated on the surface, thus forming a dense thin layer, thereby inhibiting the migration of solute deeper into the sample. (2) Compared with the completely dry case, the case with the water level of 0.5 m had a larger volumetric water content in the upper 0.28 m of the sample due to capillary action (Figure 5a–c). Microorganisms were more likely to migrate to the meniscus near the contacting position of particles to obtain sufficient water to maintain normal life activities, resulting in more particle bridging rather than particle wrapping, which greatly increased the cementation depth. In addition, it can be seen from Figure 8c that there were still large intergranular pores on the surface of Case 2, which was beneficial for the migration of solutes to greater depths.

3.4. The Influence of Spraying Times

Figure 9a shows the distribution of penetration resistance with depth with different spraying times. The calcareous sand treated by 1 spraying time was found to be in a loose state in all depths during excavation (Figure 9c), so it was difficult to measure the penetration resistance and equivalent calcium carbonate content in Case 6. The penetration resistance of the sample treated by 2 spraying times was distributed in the range of 9 cm to 34 cm and showed a trend of gradually decreasing with depth. The top 0–9 cm and the bottom 34–78 cm were loose uncemented sand, and the maximum penetration resistance was located at a depth of 9 cm, reaching 314 kPa. The penetration resistance increased significantly, the distribution range was larger than that from the 3 spraying treatment times of calcareous sand, and the effective cementation range was about 60 cm. The distribution of equivalent calcium carbonate content with different spraying times is shown in Figure 9b. The calcareous sand treated with 2 spraying times did not appear to be significantly cemented. The equivalent calcium carbonate content of Case 7 showed a trend of gradually decreasing with the increase in depth. The maximum equivalent calcium carbonate content of 10% was distributed at a distance of 9 cm from the sand surface. After 3 spraying treatment times, the equivalent calcium carbonate content increased significantly, and the maximum calcium carbonate content increased to 24%. The top-down distribution pattern changed from decreasing to first increasing and then decreasing. Figure 9c shows the cemented morphology of the specimen after the test. The sample treated by 1 spraying time was still loose, and there was no obvious cementation in the whole depth, while the sample treated by 2 spraying times forms obvious columnar cementation in the middle. When the spraying times increased to 3, there was obvious cementation from the top to a depth of 60 cm. As the sample depth increased, the diameter of the cementation gradually decreased and the cementation became weaker.

3.5. The Influence of Concentration of Cementing Solution

Figure 10a shows the effect of CS concentration on penetration resistance. When the concentration was 0.5 mol/L, the whole sample did not have obvious cementation. As the concentration increased, the penetration resistance measured at the same depth increased correspondingly, but the effective cementation range first increased from 0 to 0~60 cm and then decreased to 22~53 cm. This was mainly due to the facts that the (1) higher concentration led to a faster and greater calcium carbonate deposition, but caused uneven cementation, which was reflected in multi-peak cementation, as shown in Figure 10c; and (2) higher concentration changed the osmotic pressure in the microbial cells in the solution environment and inhibited the metabolism of the microorganisms. Figure 10b summarizes the distribution of equivalent calcium carbonate content with depth with different CS concentrations. When the concentration was 2 mol/L, the equivalent calcium carbonate content was significantly higher than that of 1 mol/L of concentration at the depth of 22~53 cm. There was a trend of first increasing and then decreasing with depth, its fluctuation was slightly larger than that of penetration resistance, and the high concentration of reactants produced more calcium carbonate. As shown in Figure 10c, the concentration of 1 mol/L could not only produce relatively uniform cementation, but also had the largest range of cementation. It was difficult for the concentration of 0.5 mol/L to produce effective cementation, and the concentration of 2 mol/L caused uneven multi-peak cementation.

4. Discussion

4.1. The Influence of MICP Reaction on SWRC

The MICP reaction generated calcium carbonate in the sand pores, which changed the pore structure and particle morphology, and then triggered a corresponding variation in the soil–water characteristic curve (SWRC). The analysis was performed according to the volumetric water content and matrix suction of Case 2 in the BS and CS spraying phases (about 15 min in every treatment). As shown in Figure 11a, the matrix suction of untreated calcareous sand was basically stable at 0.71~0.80 kPa with the increase in the volumetric water content. After 1 spraying treatment time, the calcium carbonate crystals blocked the pores, resulting in a significant increase in the matrix suction during the second spraying infiltration. The matrix suction decreased from 3.41 kPa to 2.37 kPa when the volumetric water content increased from 45.56% to 70.40%. When spraying for the third time, the calcium carbonate content inside the calcareous sand continued to increase, and the intergranular pores continued to decrease, resulting in an increase in the matrix suction of the cemented sand under the same volume water content. This phenomenon is consistent with Liu [28] and Saffari [37], which showed that the SWRC curve shifts to the upper right as the degree of cementation increases. Figure 11b summarizes the SWRC curve comparison of the third spray infiltration under different conditions, where the initial state was taken as the first spraying infiltration of Case 2. It can be found that the SWRC curve gradually moved up with the increase in the calcium carbonate content in the surface layer. This indicated that the water retention capacity of calcareous sand improved with the increase in the calcium carbonate content. In the conventional coordinate system, the distribution of matrix suction with the volumetric water content generally showed two kinds of variation laws: (1) linear decrease or constant, and (2) initial slow decrease to a certain volumetric water content and then rapid decrease.

4.2. Relationship between Equivalent Calcium Carbonate Content, Penetration Resistance, and Shear Wave Velocity

Figure 12a shows the relationship between equivalent calcium carbonate content and penetration resistance at different water levels. When the water level was 0.5 m, the sample showed the highest calcium carbonate content and penetration resistance. Under the same calcium carbonate content, the penetration resistance at an initial water level of 0.5 m was greater than that at a completely dry and fully saturated state. This indicated that the unsaturated state plays a certain role in promoting the MICP reaction in calcareous sand. In addition, except for Case 3, the penetration resistance and calcium carbonate content under other conditions all showed a good power function relationship, and Equation (5) can be used to predict penetration resistance values based on equivalent calcium carbonate content.
q u = a C _ CaCO 3 b
where a and b were fitting parameters.
Figure 12b,c summarize the relationship between equivalent calcium carbonate content and penetration resistance under different spraying times and different concentrations, which can also be described by a power function in the form of Equation (3). The 3 spraying treatment times showed a higher calcium carbonate content and penetration resistance than the 2 spraying times. In the case of the high concentration of CS (2 mol/L), more calcium carbonate was produced and the maximum calcium carbonate content reached 27%. The maximum calcium carbonate content corresponding to 1 mol/L CS was 23%, which was slightly lower than that of 2 mol/L of CS, but the penetration resistance at 2 mol/L of concentration was less than that of 1 mol/L of concentration. This was attributed to the fact that the high concentration of CS produced irregular and weaker cementation, thus exerting poor strength.
As shown in Figure 13, the normalized shear wave velocity and the normalized penetration resistance presented a good linear relationship. When the normalized penetration resistance increased from 1 to 20.3, the normalized shear wave velocity increased linearly from 1 to 4.071, and the relationship can be shown in Equation (6).
V s / V s 0 = 0.155 + 0.16 ( q u / q u 0 )
where Vs, Vs0, qu, and qu0 represent the current shear wave velocity, initial shear wave velocity, current penetration resistance, and initial penetration resistance, respectively. It should be noted that all the normalized penetration resistance values were not selected, but the penetration resistance corresponding to the measuring points with an obvious shear wave velocity increase was selected for normalization with the initial penetration resistance of uncemented sand.

4.3. Comparison of Reinforcement Methods for MICP Applications

There are mainly four methods for the MICP reinforcement of soil: spraying method [14,38], grouting method, prefabricated vertical drain (PVD), and shallow trenches [24]. The spraying method is suitable for the shallow reinforcement of large area. It can be used as an easy and effective method for surficial improvement applications. The grouting and PVD methods can complete deeper soil reinforcement, but the disadvantage is that it requires the installation of grouting pipes or PVDs. The trench method improved both surficial and deeper soil properties, but in a more localized manner (applicable for ditches and canals). Therefore, appropriate reinforcement methods need to be selected according to actual needs in the project.

5. Conclusions

In order to respond to the greenhouse effect and achieve sustainable development, a series of calcareous sand reinforcement tests by the MICP spraying method were carried out based on the self-developed large-scale unsaturated infiltration equipment. The evolutions of shear wave velocity, volumetric water content, and matrix suction in the complete reaction process were monitored. The influence of MICP reaction on the SWRC was also discussed. The following conclusions were drawn:
(1)
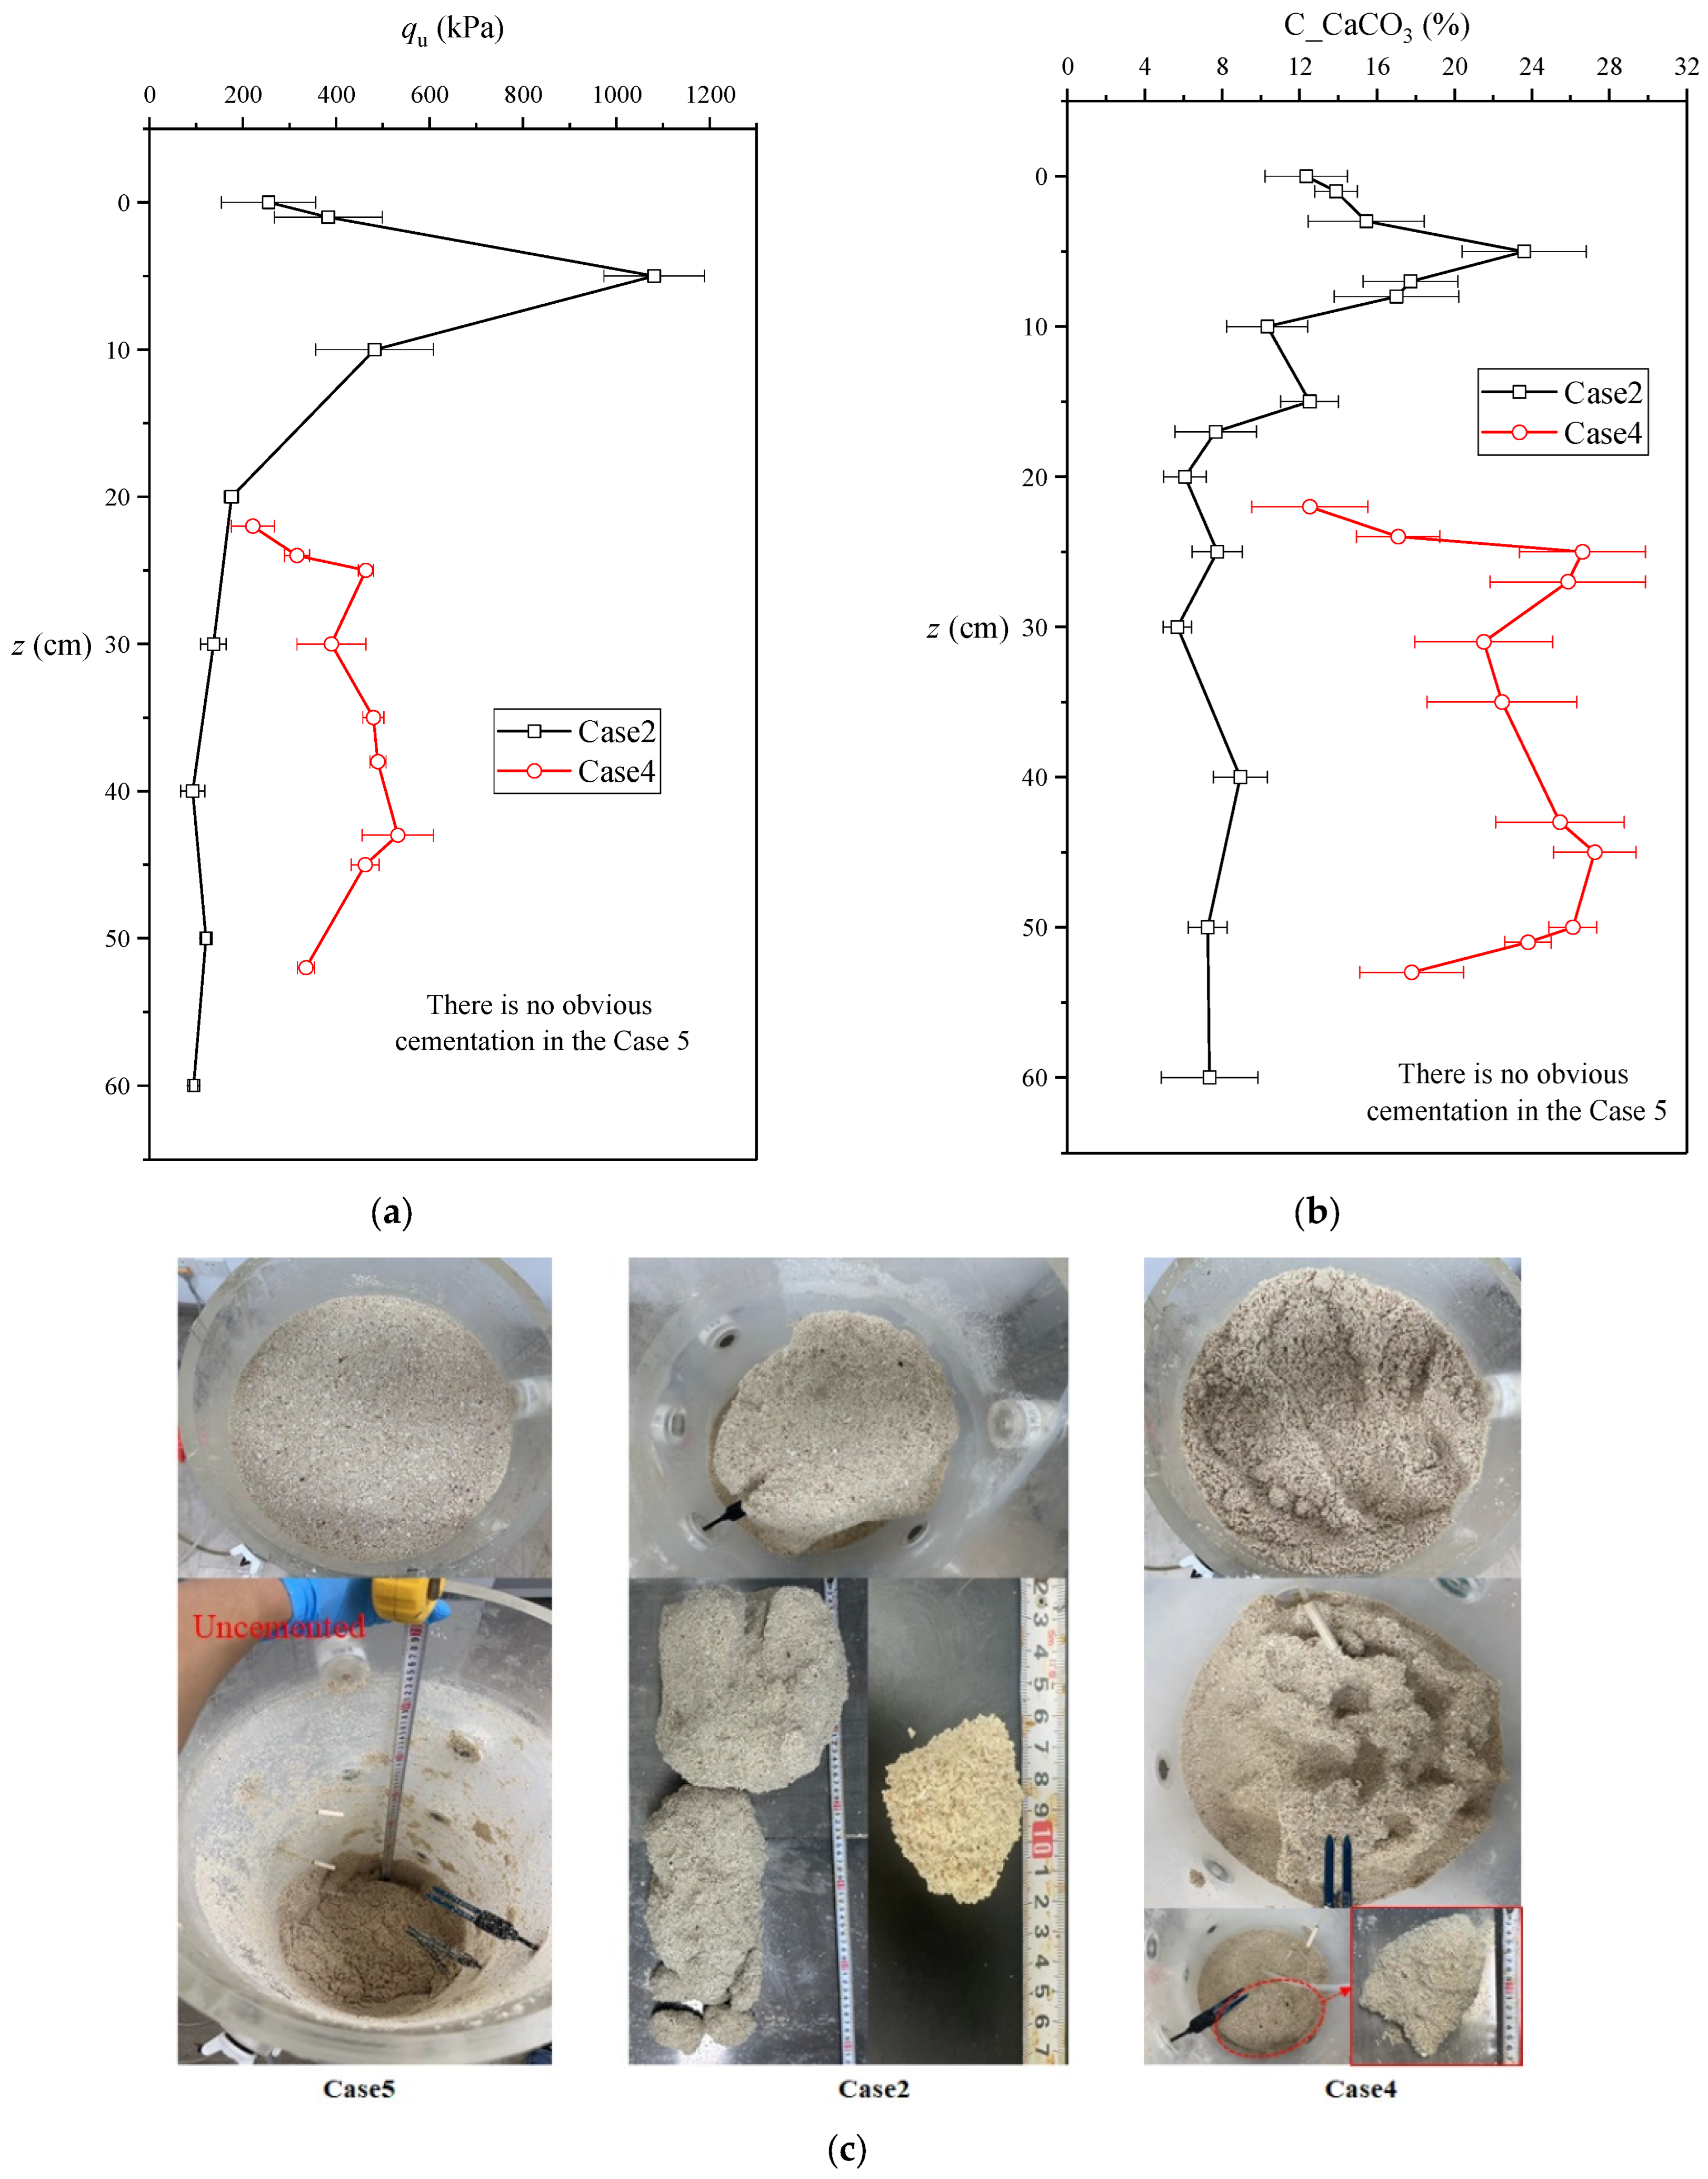
The initial water level, spraying times, and CS concentration showed a significant impact on the equivalent calcium carbonate content, penetration resistance, and effective cementation range, involving the complex competition mechanism of infiltration and reaction. The distributions of penetration resistance and equivalent calcium carbonate content from top to bottom mainly included two patterns: monotonically decreasing, and initially increasing and then decreasing. The fully saturated case only showed a dense thin layer of calcium carbonate on the surface, and the completely dry case produced a middle cementation. When the initial water level was 0.5 m, the largest range of 60 cm effective cementation appeared from top to bottom because the microorganisms were more likely to migrate to the particle connection.
(2)
The calcium carbonate generated by the MICP reaction in the sand played a role in blocking pores and increasing the water retention capacity of the calcareous sand. As the degree of cementation increased, the SWRC curve gradually moved up, and the matrix suction corresponding to the same volume water content increased sequentially.
(3)
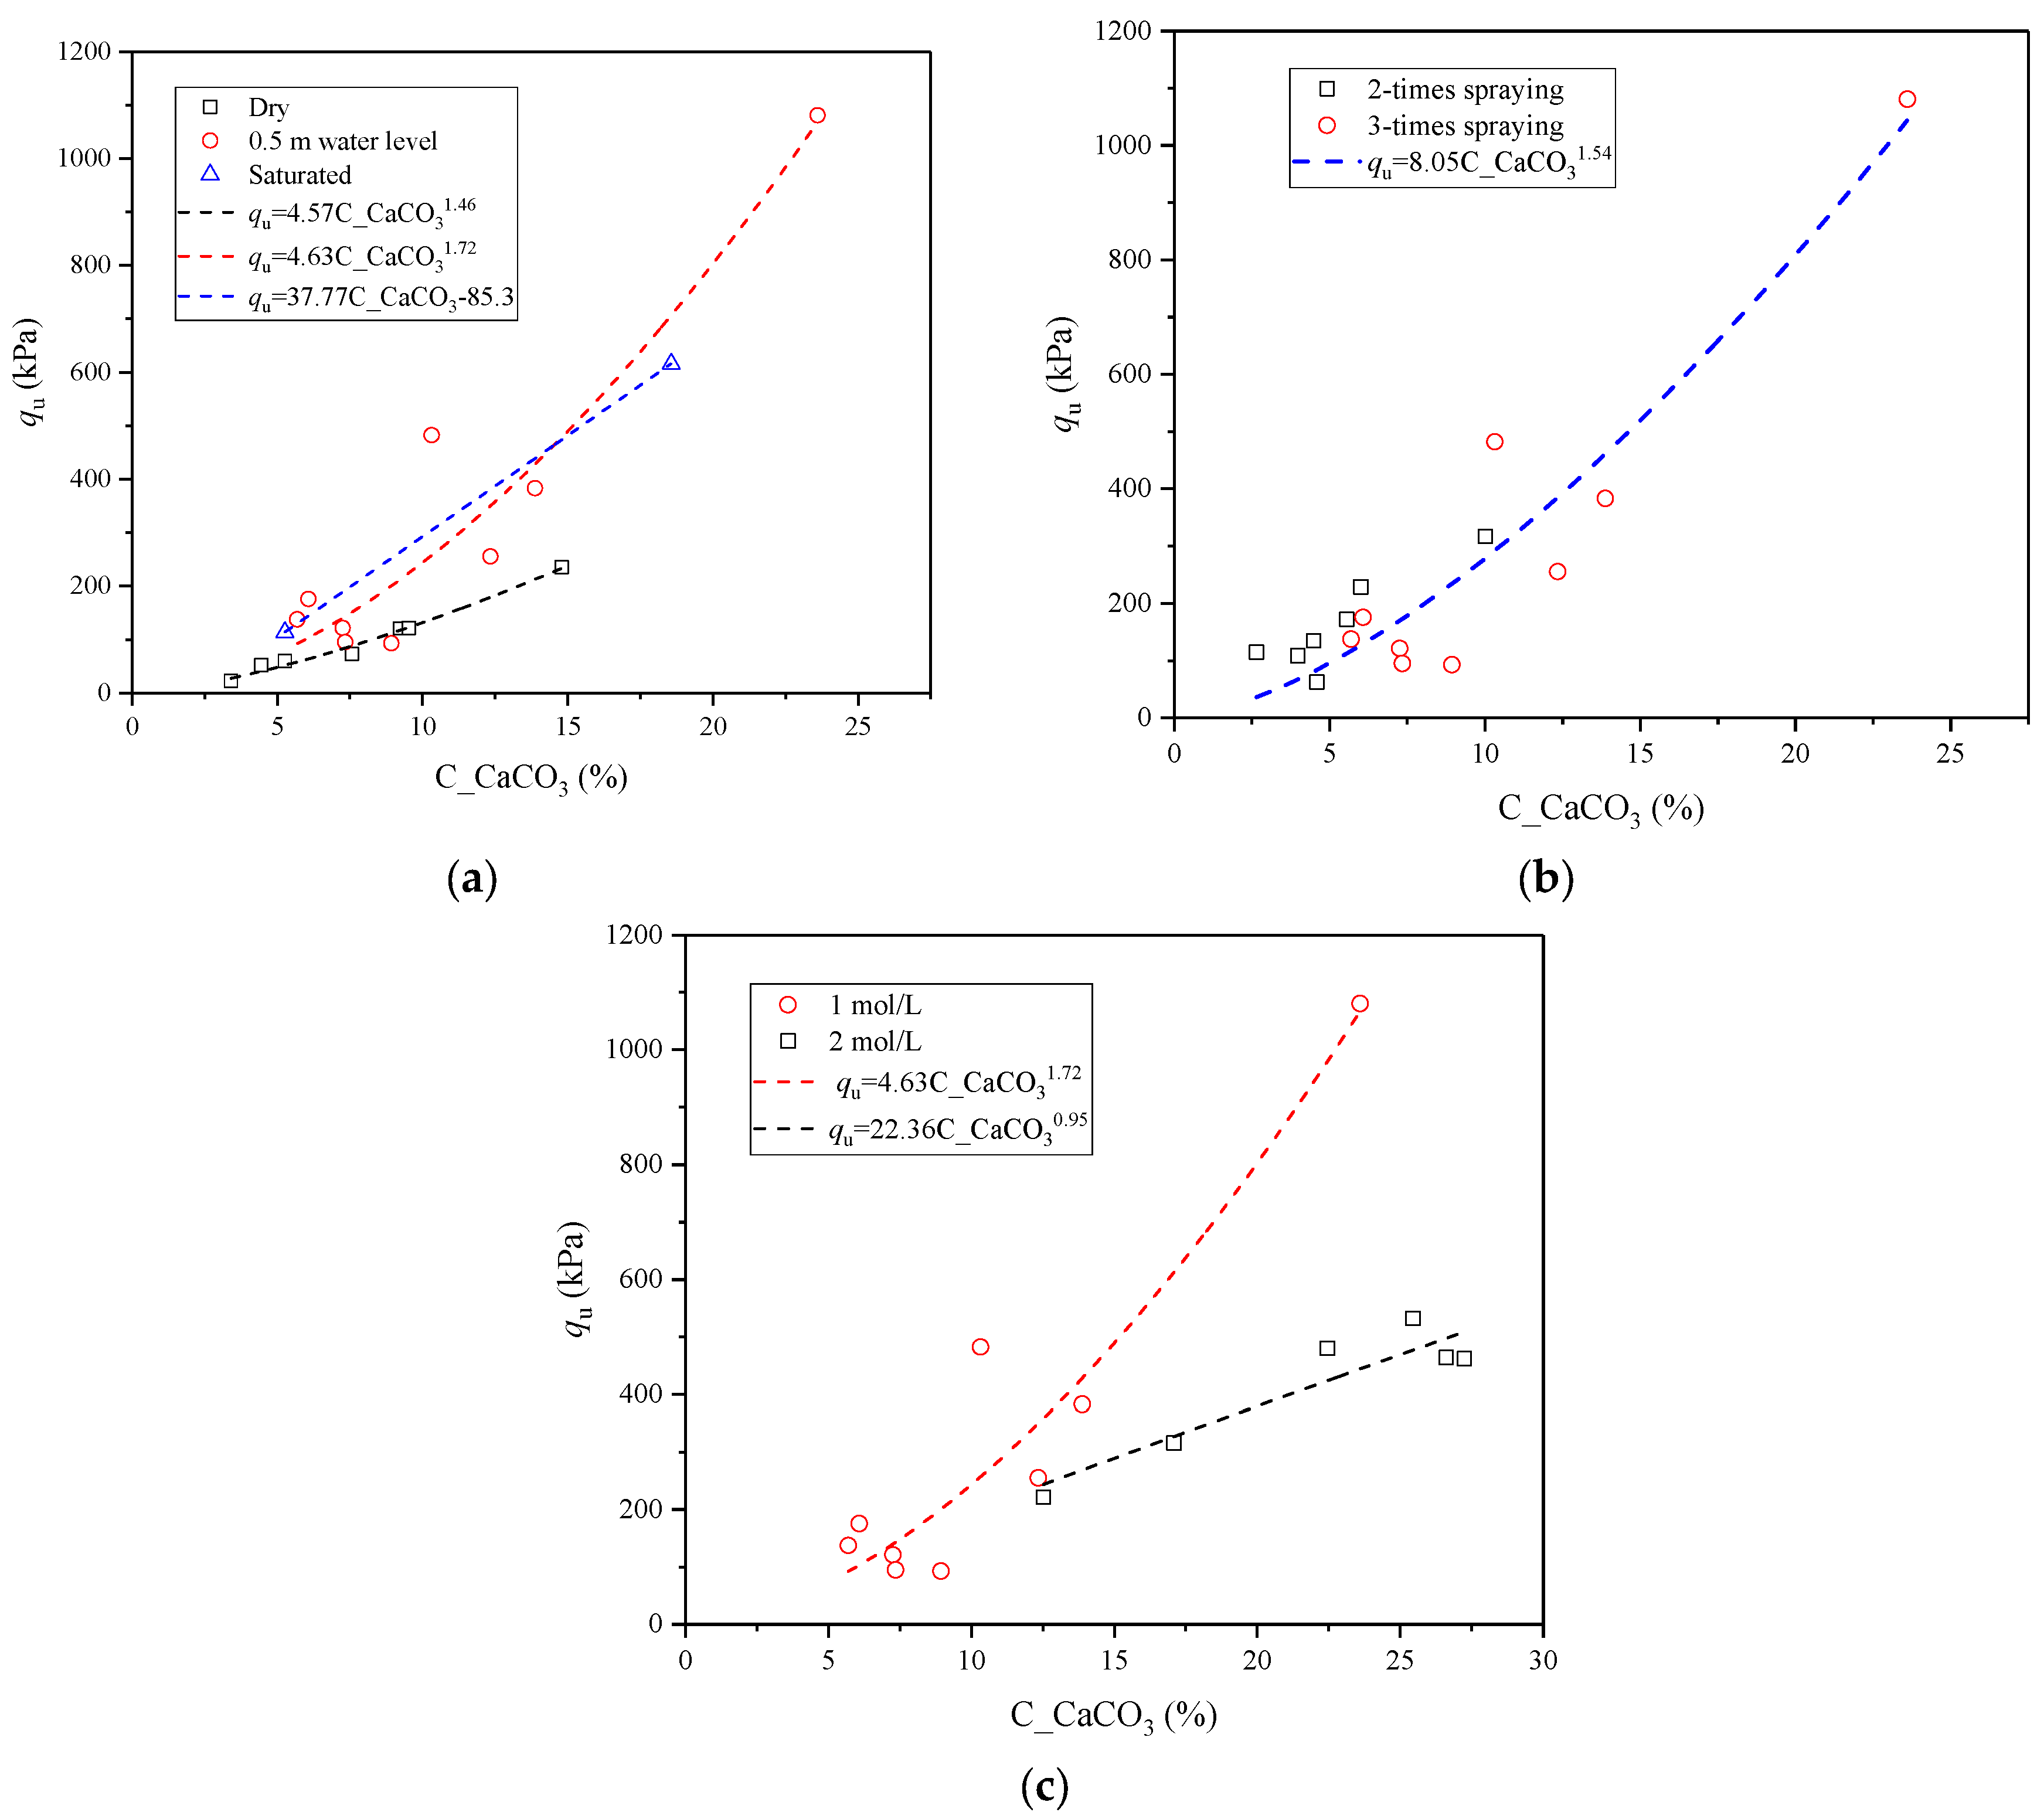
There was an obvious power function relationship between the equivalent calcium carbonate content and the penetration resistance. When the water level was 0.5 m, the equivalent calcium carbonate content and penetration resistance value were highest. Increasing the spraying time and the concentration of CS could generate larger calcium carbonate contents. The measured penetration resistance of 1 mol/L of CS concentration was higher than that of 2 mol/L of CS concentration with the same calcium carbonate content. There was a significant linear relationship between the normalized penetration resistance and the normalized shear wave velocity.
The spraying method has the advantages of simple construction, wider reinforcement zone, and high efficiency, and it is suitable for scenarios where a shallow soil reinforcement is required, such as sand dune protection, dust control, erosion, scour mitigation, and beach reinforcement. Appropriate reinforcement methods need to be selected according to actual needs in the project.

Author Contributions

Conceptualization, Y.L.; Methodology, S.R., L.L., Z.G. and X.S.; Validation, Y.L.; Resources, S.R. and Z.G.; Data curation, Y.L., Z.G. and X.S.; Writing—original draft, Y.L.; Writing—review & editing, S.R., L.L. and Z.G.; Visualization, L.L.; Funding acquisition, L.L. and Z.G. All authors have read and agreed to the published version of the manuscript.

Funding

This research was funded by the Finance Science and Technology Project of Hainan Province (ZDKJ202019), Zhejiang Provincial Natural Science Foundation Public Welfare Project (LGC21E090001), Hainan Special PhD Scientific Research Foundation of Sanya Yazhou Bay Science and Technology City (HSPHDSRF-2022-04-002), and Natural Science Foundation of Zhejiang Province (LR22E080005).

Data Availability Statement

Some or all data, models, or codes that support the findings of this study are available from the corresponding author by request.

Conflicts of Interest

The authors declare that they have no known competing financial interests or personal relationships that could have appeared to influence the work reported in this paper.

Abbreviations

CSCementing solution
BSBacterial solution
MICPMicrobial-induced carbonate precipitation
SWRCSoil–water characteristic curve
CcCoefficient of curvature
CuCoefficient of uniformity
VsCurrent shear wave velocity
Vs0Initial shear wave velocity
quCurrent penetration resistance
qu0Initial penetration resistance

References

  1. Ismail, M.A.; Joer, H.A.; Sim, W.H.; Randolph, M.F. Effect of Cement Type on Shear Behavior of Cemented Calcareous Soil. J. Geotech. Geoenviron. Eng. 2002, 128, 520–529. [Google Scholar] [CrossRef]
  2. Salehzadeh, H.; Hassanlourad, M.; Shahnazari, H. Shear behavior of chemically grouted carbonate sands. Int. J. Geotech. Eng. 2012, 6, 445–454. [Google Scholar] [CrossRef]
  3. Almajed, A.; Abbas, H.; Arab, M.; Alsabhan, A.; Hamid, W.; Al-Salloum, Y. Enzyme-Induced Carbonate Precipitation (EICP)-Based methods for ecofriendly stabilization of different types of natural sands. J. Clean. Prod. 2020, 274, 122627. [Google Scholar] [CrossRef]
  4. Cao, Z.; Shen, L.; Zhao, J.; Liu, L.; Zhong, S.; Sun, Y.; Yang, Y. Toward a better practice for estimating the CO2 emission factors of cement production: An experience from China. J. Clean. Prod. 2016, 139, 527–539. [Google Scholar] [CrossRef]
  5. Zhao, Y.; Peng, L.; Zeng, W.; Poon, C.S.; Lu, Z. Improvement in properties of concrete with modified RCA by microbial induced carbonate precipitation. Cem. Concr. Compos. 2021, 124, 104251. [Google Scholar] [CrossRef]
  6. Schuhmacher, M.; Domingo, J.L.; Garreta, J. Pollutants emitted by a cement plant: Health risks for the population living in the neighborhood. Environ. Res. 2004, 95, 198–206. [Google Scholar] [CrossRef] [PubMed]
  7. Gu, J.; Lyu, H.; Yang, J.; Zeng, C. Effects of cement content and curing period on geotechnical properties of cement-treated calcareous sands. Transp. Geotech. 2022, 33, 100732. [Google Scholar] [CrossRef]
  8. Luo, J.; Zhou, A.; Li, N.; Wang, W.; Hu, J. Mechanical properties and microscopic characterization of cement stabilized calcareous sand modified by nano SiO2. Case Stud. Constr. Mater. 2022, 17, e01636. [Google Scholar] [CrossRef]
  9. Hu, J.; Xu, C.; Cheng, P.; Xiong, H.; Zhou, Y.; Ren, J. Mechanical properties and micromechanics of graphene oxide modified calcareous sand-cement mortar. Mar. Georesour. Geotechnol. 2023, 1–13. [Google Scholar] [CrossRef]
  10. Whiffin, V.S.; van Paassen, L.A.; Harkes, M.P. Microbial carbonate precipitation as a soil improvement technique. Geomicrobiol. J. 2007, 24, 417–423. [Google Scholar] [CrossRef]
  11. Chu, J.; Stabnikov, V.; Ivanov, V. Microbially induced calcium carbonate precipitation on surface or in the bulk of soil. Geomicrobiol. J. 2012, 29, 544–549. [Google Scholar] [CrossRef]
  12. Xiao, Y.; He, X.; Stuedlein, A.W.; Chu, J.; Matthew Evans, T.; Van Paassen, L.A. Crystal growth of MICP through microfluidic chip tests. J. Geotech. Geoenviron. Eng. 2022, 148, 06022002. [Google Scholar] [CrossRef]
  13. Jiang, N.J.; Soga, K. The applicability of microbially induced calcite precipitation (MICP) for internal erosion control in gravel–sand mixtures. Géotechnique 2017, 67, 42–55. [Google Scholar] [CrossRef]
  14. Li, Y.; Guo, Z.; Wang, L.; Yang, H.; Li, Y.; Zhu, J. An innovative eco-friendly method for scour protection around monopile foundation. Appl. Ocean Res. 2022, 123, 103177. [Google Scholar] [CrossRef]
  15. Choi, S.-G.; Chang, I.; Lee, M.; Lee, J.-H.; Han, J.-T.; Kwon, T.-H. Review on geotechnical engineering properties of sands treated by microbially induced calcium carbonate precipitation (MICP) and biopolymers. Constr. Build. Mater. 2020, 246, 118415. [Google Scholar] [CrossRef]
  16. Zamani, A.; Xiao, P.; Baumer, T.; Carey, T.J.; Sawyer, B.; DeJong, J.T.; Boulanger, R.W. Mitigation of liquefaction triggering and foundation settlement by MICP treatment. J. Geotech. Geoenviron. Eng. 2021, 147, 04021099. [Google Scholar] [CrossRef]
  17. Zhang, X.; Chen, Y.; Liu, H.; Zhang, Z.; Ding, X. Performance evaluation of a MICP-treated calcareous sandy foundation using shake table tests. Soil Dyn. Earthq. Eng. 2020, 129, 105959. [Google Scholar] [CrossRef]
  18. O’Donnell, S.T.; Kavazanjian, E., Jr.; Rittmann, B.E. MIDP: Liquefaction mitigation via microbial denitrification as a two-stage process. II: MICP. J. Geotech. Geoenviron. Eng. 2017, 143, 04017095. [Google Scholar] [CrossRef]
  19. Xiao, P.; Liu, H.; Xiao, Y.; Stuedlein, A.W.; Evans, T.M. Liquefaction resistance of bio-cemented calcareous sand. Soil Dyn. Earthq. Eng. 2018, 107, 9–19. [Google Scholar] [CrossRef]
  20. Sun, X.; Miao, L.; Chen, R.; Wang, H.; Wu, L.; Xia, J. Liquefaction resistance of biocemented loess soil. J. Geotech. Geoenviron. Eng. 2021, 147, 04021117. [Google Scholar] [CrossRef]
  21. Zamani, A.; Montoya, B.M. Undrained monotonic shear response of MICP-treated silty sands. J. Geotech. Geoenviron. Eng. 2018, 144, 04018029. [Google Scholar] [CrossRef]
  22. Feng, K.; Montoya, B.M. Influence of confinement and cementation level on the behavior of microbial-induced calcite precipitated sands under monotonic drained loading. J. Geotech. Geoenviron. Eng. 2016, 142, 04015057. [Google Scholar] [CrossRef]
  23. Li, Y.; Guo, Z.; Wang, L.; Ye, Z.; Shen, C.; Zhou, W. Interface shear behavior between MICP-treated calcareous sand and steel. J. Mater. Civ. Eng. 2021, 33, 04020455. [Google Scholar] [CrossRef]
  24. Ghasemi, P.; Montoya, B.M. Field implementation of microbially induced calcium carbonate precipitation for surface erosion reduction of a coastal plain sandy slope. J. Geotech. Geoenviron. Eng. 2022, 148, 04022071. [Google Scholar] [CrossRef]
  25. Liu, S.; Gao, X. Evaluation of the anti-erosion characteristics of an MICP coating on the surface of tabia. J. Mater. Civ. Eng. 2020, 32, 04020304. [Google Scholar] [CrossRef]
  26. Liu, B.; Xie, Y.-H.; Tang, C.-S.; Pan, X.-H.; Jiang, N.-J.; Singh, D.N.; Cheng, Y.-J.; Shi, B. Bio-mediated method for improving surface erosion resistance of clayey soils. Eng. Geol. 2021, 293, 106295. [Google Scholar] [CrossRef]
  27. Dagliya, M.; Satyam, N.; Sharma, M.; Garg, A. Experimental study on mitigating wind erosion of calcareous desert sand using spray method for microbially induced calcium carbonate precipitation. J. Rock Mech. Geotech. Eng. 2022, 14, 1556–1567. [Google Scholar] [CrossRef]
  28. Liu, B.; Zhu, C.; Shi, B.; Tang, C.-S.; Pan, X.-H.; Cheng, Y.-J.; Xu, J.-J. Potential drought mitigation through microbial induced calcite precipitation-MICP. Water Resour. Res. 2021, 57, e2020WR029434. [Google Scholar] [CrossRef]
  29. Cheng, Y.-J.; Tang, C.-S.; Pan, X.-H.; Liu, B.; Xie, Y.-H.; Cheng, Q.; Shi, B. Application of microbial induced carbonate precipitation for loess surface erosion control. Eng. Geol. 2021, 294, 106387. [Google Scholar] [CrossRef]
  30. Gao, Y.; Tang, X.; Chu, J.; He, J. Microbially induced calcite precipitation for seepage control in sandy soil. Geomicrobiol. J. 2019, 36, 366–375. [Google Scholar] [CrossRef]
  31. Whiffin, V.S. Microbial CaCO3 Precipitation for the Production of Biocement. Doctoral Dissertation, Murdoch University, Perth, Australia, 2004. [Google Scholar]
  32. Ogino, T.; Kawaguchi, T.; Yamashita, S.; Kawajiri, S. Measurement deviations for shear wave velocity of bender element test using time domain, cross-correlation, and frequency domain approaches. Soils Found. 2015, 55, 329–342. [Google Scholar] [CrossRef]
  33. Kou, H.-L.; Wu, C.-Z.; Ni, P.-P.; Jang, B.-A. Assessment of erosion resistance of biocemented sandy slope subjected to wave actions. Appl. Ocean Res. 2020, 105, 102401. [Google Scholar] [CrossRef]
  34. Kou, H.-L.; Wu, C.; Jang, B.-A.; Wang, D. Spatial distribution of CaCO3 in biocemented sandy slope using surface percolation. J. Mater. Civ. Eng. 2021, 33, 06021004. [Google Scholar] [CrossRef]
  35. Cheng, L.; Cord-Ruwisch, R. Upscaling effects of soil improvement by microbially induced calcite precipitation by surface percolation. Geomicrobiol. J. 2014, 31, 396–406. [Google Scholar] [CrossRef]
  36. Xie, D.; Zhang, R.; Wang, J. The influence of environmental factors and precipitation precursors on enzyme-induced carbonate precipitation (EICP) process and its application on modification of recycled concrete aggregates. J. Clean. Prod. 2023, 395, 136444. [Google Scholar] [CrossRef]
  37. Saffari, R.; Nikooee, E.; Habibagahi, G.; van Genuchten, M.T. Effects of biological stabilization on the water retention properties of unsaturated soils. J. Geotech. Geoenviron. Eng. 2019, 145, 04019028. [Google Scholar] [CrossRef]
  38. Wang, Y.; Sun, X.; Miao, L.; Wang, H.; Wu, L.; Shi, W.; Kawasaki, S. State-of-the-art review of soil erosion control by MICP and EICP techniques: Problems, applications, and prospects. Sci. Total Environ. 2023, 169016. [Google Scholar] [CrossRef]
Figure 1. Sand column design and sensor placement. (a) Sand column; (b) schematic diagram of sensor layout; (c) actual sensor layout. (the marks a#, b#, c#, d# show that the sensor is 8, 28, 48, 68 cm above the bottom of the sample, respectively).
Sustainability 16 00225 g001
Figure 2. Experimental material. (a) Calcareous sand; (b) particle size distribution.
Sustainability 16 00225 g002
Figure 3. Schematic diagram of different water level heights in sand column (the marks a#, b#, c#, d# show that the sensor is 8, 28, 48, 68 cm above the bottom of the sample, respectively).
Sustainability 16 00225 g003
Figure 4. Evaluation methods. (a) Shear wave velocity determination procedure; (b) MPT micro-penetrometer.
Sustainability 16 00225 g004
Figure 5. Evolution of volumetric water content over time in (a) Case 1; (b) Case 2; (c) Case 3; (d) Case 4; (e) Case 5; (f) Case 6; (g) Case 7.
Sustainability 16 00225 g005
Figure 6. Evolution of matrix suction over time in (a) Case 1; (b) Case 2; (c) Case 3; (d) Case 4; (e) Case 5; (f) Case 6; (g) Case 7.
Sustainability 16 00225 g006aSustainability 16 00225 g006b
Figure 7. Evolution of shear wave velocity over time. (a) Case 1; (b) Case 2; (c) Case 3; (d) Case 4; (e) Case 5; (f) Case 6 and Case 7.
Sustainability 16 00225 g007
Figure 8. The effect of the initial water height on (a) penetration resistance; (b) calcium carbonate content; (c) cementation morphology.
Sustainability 16 00225 g008
Figure 9. The effect of the spraying times on (a) penetration resistance; (b) calcium carbonate content; (c) cementation morphology.
Sustainability 16 00225 g009
Figure 10. The effect of cementing solution concentration on (a) penetration resistance; (b) calcium carbonate content; (c) cementation morphology.
Sustainability 16 00225 g010
Figure 11. The soil–water characteristic curve (SWCC) of (a) Case 2; (b) different cases with calcium carbonate content at surface.
Sustainability 16 00225 g011
Figure 12. The relationship between calcium carbonate content and penetration resistance with different (a) initial water heights; (b) spraying times; (c) cementing solution concentrations.
Sustainability 16 00225 g012
Figure 13. The relationship between normalized penetration resistance and normalized shear wave velocity.
Sustainability 16 00225 g013
Table 1. Test arrangement.
NoInitial Water Level (m)OD600UA (mM Urea/min)Concentration of CS (mol/L)Spraying Times
Case 101.894/1.919/2.0707.78/8.44/7.781.0/1.0/1.01-2-3
Case 20.51.950/2.050/1.9867.77/8.66/7.111.0/1.0/1.01-2-3
Case 30.781.970/1.930/2.0907.67/8.13/7.221.0/1.0/1.01-2-3
Case 40.51.809/1.950/1.8508.23/7.56/8.112.0/2.0/2.01-2-3
Case 50.51.725/1.823/1.9247.11/8.67/7.550.5/0.5/0.51-2-3
Case 60.51.7407.441.01
Case 70.51.914/2.0127.45/9.111.0/1.01-2
Disclaimer/Publisher’s Note: The statements, opinions and data contained in all publications are solely those of the individual author(s) and contributor(s) and not of MDPI and/or the editor(s). MDPI and/or the editor(s) disclaim responsibility for any injury to people or property resulting from any ideas, methods, instructions or products referred to in the content.

