Article

Energy Evolution Law of Sandstone Material during Post-Peak Cyclic Loading and Unloading under Hydraulic Coupling

1
School of Resource, Environment and Safety Engineering, Hunan University of Science and Technology, Xiangtan 411201, China
2
School of Resources and Safety Engineering, Central South University, Changsha 410083, China
*
Author to whom correspondence should be addressed.
Sustainability 2024, 16(1), 24; https://doi.org/10.3390/su16010024
Submission received: 4 November 2023 / Revised: 4 December 2023 / Accepted: 12 December 2023 / Published: 19 December 2023
(This article belongs to the Section Sustainable Engineering and Science)

Abstract

:
The sustainability of rock engineering is an emerging trend in future development, as society increasingly recognizes the importance of environmental conservation and responsible resource utilization. In this context, the field of rock engineering is undergoing a paradigm shift toward more sustainable practices. A significant aspect of this shift is the investigation of energy evolution laws specific to rocks, which assumes paramount importance in ensuring the sustainable utilization of damaged rock roadways. To investigate the impact of confining pressure and pore pressure on the energy evolution characteristics of rock beyond the peak, post-peak cyclic loading and unloading tests were conducted on sandstone specimens under hydraulic coupling conditions using the MTS815 rock mechanical test system. The study encompassed three sets of confining pressures, namely, 10 MPa, 20 MPa, and 30 MPa. Different levels of pore pressure were applied within each confining pressure group. For the 10 MPa confining pressure, the pore pressure values were set at 2 MPa, 4 MPa, 6 MPa, and 8 MPa. Similarly, for the 20 MPa and 30 MPa confining pressures, the corresponding pore pressure values were 2 MPa, 6 MPa, 10 MPa, 14 MPa, 18 MPa, and 22 MPa. The experimental findings indicate that as the confining pressure increases, both the maximum and residual elastic energy densities of the rock gradually increase. The rise in confining pressure impedes the release of elastic energy. Moreover, with increasing confining pressure, the rate of increase in the maximum dissipated energy density diminishes, highlighting the inhibitory effect of confining pressure on energy dissipation and release within the rock. Pore pressure, on the other hand, disrupts the load-bearing structure of the rock and reduces its energy storage capacity. Under a constant confining pressure, for a fixed number of cycles (axial strain), the total input energy density, elastic energy density, and dissipation energy density exhibit a negative correlation with pore pressure. With an increase in the number of cycles (axial strain), the proportion of elastic energy initially rises but subsequently declines, while the proportion of dissipated energy follows the opposite trend. Furthermore, as the confining pressure increases, the peak proportion of elastic energy also tends to increase. This indicates that higher confining pressures promote energy accumulation after rock failure, enhancing the rock’s ability to store elastic energy.

1. Introduction

The hydraulic coupling characteristics of rock constitute essential research topics within the field of geotechnical engineering [1,2,3,4,5,6,7,8]. Rock energy is intimately connected to the control of surrounding rock stability [9,10]. Currently, scholars have extensively investigated rock energy and the hydraulic coupling characteristics of rock. Zhang et al. [11] demonstrated the effect of confining pressure on the evolution and distribution law of elastic energy and dissipation energy in rocks and investigated the energy evolution path of rock mass in mining engineering. The experimental results from Liu et al. [12] indicated that there is an exponential relationship between crack initiation stress, damage stress, elastic energy and dissipation energy at peak stress, and dry–wet cycles. Moreover, Chen et al. [13] revealed the water-softening damage characteristics of deep-buried carbonaceous phyllite and the anisotropy of micro-bedding structures. Additionally, they analyzed the effect of bedding angle and water-bearing state on the energy storage and release mechanisms of phyllite using the energy damage evolution mechanism. Qin et al. [14] conducted experiments on the mechanical properties of sandstone under varying confining pressures and obtained the mechanical characteristics and energy evolution of the rock loading process. Based on the energy balance theory, the energy conversion law of the sandstone loading process under different confining pressures was analyzed, and the relationship between the characteristic stress, crack evolution, and energy dissipation of sandstone under different confining pressures was studied. On the basis of the uniaxial, triaxial, and pore acoustic emission experiments of yellow sandstone, Liu et al. [15] analyzed the strength characteristics and deformation characteristics under the influence of the effective stress. They obtained the energy conversion law of the whole process. Based on the evolution equation of acoustic emission energy, the feedback characteristics of the rock stress state and hydraulic coupling were investigated. In addition, the mechanical behavior and energy evolution law in the process of rock damage and failure were studied, and the damage evolution stage and characteristics of yellow sandstone under different conditions were analyzed. In particular, Zhao et al. [16] discussed the energy evolution characteristics of sandstone under hydraulic coupling. Additionally, the study investigated the applicability of the Mohr–Coulomb criterion and Hoek–Brown criterion under hydraulic coupling by considering effective stress. To explore the mechanical properties and energy evolution of coarse sandstone under cyclic loading conditions, Liu et al. [17] carried out indoor uniaxial compression, conventional triaxial compression, and triaxial graded cyclic loading and unloading tests and compared and analyzed the mechanical properties of sandstone. Meng et al. [18] characterized the energy accumulation, dissipation, and release behaviors of loaded rock samples using characteristic energy density and energy consumption ratio parameters. Their analysis revealed the confining pressure effect on the energy evolution process and distribution law of the loaded rock sample. Yang et al. [19] investigated the energy evolution characteristics after the peak and rock deformation under different loading methods. Lu et al. [20] analyzed the dynamic mechanical properties of sandstone using Hopkinson pressure bar equipment, with a confining pressure device, under varying levels of confining pressure and strain rates. The analysis focused on the effect of strain rate on the uniaxial dynamic compressive strength and specific energy absorption value of sandstone, as well as the mechanical properties of sandstone during an impact loading cycle under confining pressure. Additionally, the relationship between the cumulative specific energy absorption value, incident energy, confining pressure, and other relevant parameters was examined.
The research findings discussed above have significant implications for understanding the relationship between rock energy and the stability of surrounding rock. It is crucial to investigate the energy evolution characteristics of rock during the post-peak cyclic loading and unloading process under hydraulic coupling conditions. This research is particularly relevant because rocks maintain a certain bearing capacity even after reaching their peak strength, and they are subjected to cyclic loading during the repair process of damaged rock roadways [21].
Existing research primarily focuses on cyclic loading and unloading tests conducted prior to rock failure, with limited studies investigating the energy evolution law of rocks under cyclic loading after failure. Furthermore, the influence of pore pressure on energy evolution has not been adequately addressed in the existing literature. To address these gaps, this paper presents a post-peak cyclic loading and unloading test conducted on sandstone specimens under hydraulic coupling conditions. The stress–strain curves of the sandstone samples were obtained under varying pore pressures and confining pressures, and the influence of these factors on the energy evolution law of rocks was thoroughly examined and discussed.

2. Test Method

This research focuses on sandstone as the material of interest [22,23]. The sandstone used in the study was sourced from the field, and it underwent processing to obtain standardized cylindrical specimens with dimensions of Φ50 mm × 100 mm, following the guidelines specified in the national standard GB/T 23561.1-2009 [24]. Then, the sandstone specimens were saturated with water in accordance with the water conservancy and hydropower test procedure SL_T264-2020. The sandstone specimens are shown in Figure 1.
The post-peak cyclic loading and unloading test on sandstone under hydraulic coupling conditions were conducted using the MTS815 rock mechanics test system. The experimental setup is illustrated in Figure 2b, where the specimen is appropriately installed as per the test requirements. The schematic diagram of the test loading process is shown in Figure 3. The confining pressure for this test was varied at three different levels: 10 MPa, 20 MPa, and 30 MPa. Within the 10 MPa confining pressure condition, the pore pressure was incrementally adjusted in 2 MPa intervals. Similarly, for the 20 MPa and 30 MPa confining pressure conditions, the pore pressure was varied in 4 MPa increments. Specifically, under the 10 MPa confining pressure condition, the pore pressure values were set at 2 MPa, 4 MPa, 6 MPa, and 8 MPa. For the 20 MPa confining pressure condition, the corresponding pore pressure values were 2 MPa, 6 MPa, 10 MPa, and 14 MPa. Lastly, under the 30 MPa confining pressure condition, the pore pressure values were set at 2 MPa, 6 MPa, 10 MPa, 14 MPa, 18 MPa, and 22 MPa. The specific test procedures were as follows: (1) an axial force of 3 kN is applied to the specimen to prevent movement of the sandstone rock sample during the pressurization process. (2) The specimen is loaded to the triaxial isobaric state of the experimental design at a loading rate of 0.05 MPa/s( σ 1 = σ 2 = σ 3 ). (3) Apply the designated pore pressure at a loading rate of 0.1 MPa/s and allow the specimen to stabilize for 1.5 h until fully saturated with water. (4) Adopt 0.006 mm/s axial displacement loading rate on the specimen to apply axial force so that the axial force of the specimen is loaded to the peak; the peak determination condition is that the axial force drops by 1 kN. (5) The axial displacement control is used to unload the specimen to the triaxial isobaric state, and the unloading rate is equal to the loading rate. (6) Repeat (4) and (5) until the specimen reaches the residual state and the test is completed.

3. Analysis of Rock Energy Evolution Law

3.1. Energy Calculation Method

Throughout the entire process of loading and unloading a specimen, there is an exchange of energy with the external environment. The work performed by the testing machine on the specimen represents the total input energy, denoted as W. During the loading phase, a portion of this energy is stored as elastic strain within the specimen, known as elastic energy. The remaining energy is utilized for the internal damage and plastic deformation of the rock, referred to as dissipative energy [25,26,27]. According to the first law of thermodynamics, the following equations can be obtained [28]:
W = W d + W e
where   W e   is the elastic energy stored inside the specimen, and W d   is the dissipation energy of internal damage and plastic deformation of the specimen.
As shown in Figure 4, the total input energy of the loaded rock can be obtained by adding the area beneath the loading curve and the work done by σ 2 and σ 3 . Likewise, the elastic energy accumulated in the loaded rock can be determined by summing the area beneath the unloading curve and the work done by σ 2 and σ 3 . The disparity between these two values represents the dissipative energy, which is primarily utilized for the internal damage and plastic deformation of the rock. During the testing process of the rock loading and unloading, there is energy evolution within the rock as it transitions from the initial state to the triaxial isobaric state and the loading state of the pore pressure. However, it is worth noting that the energy change and its impact on the rock during this portion are relatively minor. As a result, this study places its primary focus on investigating the energy evolution, specifically during the loading and unloading stages. During the loading and unloading process of the specimen, σ 1 performs positive work while σ 2 and σ 3 perform negative work. Since the rock is in a hydraulic coupling state, the internal pore pressure will deform the solid skeleton of the rock and do work. Hence, the direction of the pore pressure force opposes the direction of the external loading stress. Currently, the total input energy density, elastic energy density, and dissipation energy density are calculable using the following formulas:
U = 0 ε 1 ( σ 1 P ) d ε + 2 0 ε 3 ( σ 3 P ) d ε
U e = ε 1 ε 1 ( σ 1 P ) d ε + 2 ε 3 ε 3 ( σ 3 P ) d ε
U d = U U e
where   ε 1   and ε 3   are the axial strain value and the circumferential strain value corresponding to σ , respectively; ε 1   and ε 3   are the residual axial strain value and the residual circumferential strain value corresponding to the stress unloading from σ to zero, respectively.

3.2. Stress–Strain Curves for the Entire Process

Figure 5, Figure 6 and Figure 7 display the post-peak cyclic loading and unloading stress–strain curves of sandstone influenced by hydraulic coupling [29]. By analyzing these figures, the following conclusions can be drawn:
(1)
Under varying levels of confining pressure, the stress–strain curves of the specimens exhibit a similar overall pattern. The peak stress is observed during the loading phase as the axial displacement increases. Subsequently, the axial stress is unloaded by reducing the axial displacement, returning to the same value as the confining pressure, thus completing one loading and unloading cycle. The axial stress is then reloaded through further displacement. During the loading phase, the specimen does not reach a residual stage, and the axial stress still exhibits a peak, albeit at a lower magnitude compared to the previous peak. As the axial displacement increases in the final loading process, the axial stress mostly remains constant, indicating that the specimen has entered the residual stage.
(2)
Before reaching the residual stage, the specimen experiences an increase in axial stress and axial strain during each loading cycle. Conversely, the axial strain of the specimen decreases during the unloading process. Notably, at the first cycle, the axial strain resulting from the peak stress of the specimen exceeds the axial strain caused during subsequent cycles when the axial stress reaches the peak stress of the cycle.
(3)
During each cycle of loading and unloading, the unloading curve of the specimen is positioned below the loading curve, forming a concave and convex curve, respectively. The endpoint of the unloading curve cannot coincide with the starting point of the loading curve after unloading to the triaxial isobaric state, resulting in the formation of a hysteresis loop between the two [30]. The area of the hysteresis loop can be characterized as the energy dissipated for the internal damage and plastic deformation of the rock. Additionally, a negative correlation exists between the hysteresis loop’s area and the number of cycles.
(4)
From Figure 5 and Figure 7e,f, it is clear that the specimen experiences a direct transition from axial stress to zero without exhibiting a residual stage during the final stage of the test. This phenomenon can be attributed to the increasing damage level of the rock as the test progresses. As the test progresses, the internal cracks within the rock gradually propagate and multiply. Simultaneously, the pore pressure reaches a high level, which leads to the complete damage of the rock and the loss of its load-bearing capacity.

3.3. Post-Peak Cyclic Loading and Unloading Energy Evolution Curves

By utilizing Formulas (2)–(4) and referring to Figure 5, Figure 6 and Figure 7, it is possible to derive the energy evolution curves of sandstone during the post-peak cyclic loading and unloading process under hydraulic coupling. Based on the obtained energy evolution curves, it is observed that the trends of energy evolution for sandstone are generally consistent throughout the entire stress–strain process under hydraulic coupling. This information is depicted in Figure 8, which illustrates the similarity in the energy evolution curves of sandstone.
The energy evolution curves of sandstone can be analyzed by considering the example of sandstone subjected to various confining pressures (10 MPa, 20 MPa, and 30 MPa) with a constant pore pressure of 2 MPa. Figure 9 illustrates the axial strain–energy density relationship curves of sandstone under the aforementioned confining pressures and pore pressure conditions. Furthermore, Figure 10 presents the energy density evolution curves of sandstone under different confining pressures.
From Figure 9, it is clear that the difference between the dissipated energy produced in the first cycle and that produced in the second cycle is larger than that between the other adjacent cycles. The reason for this phenomenon is that during the first cycle of the loading and unloading process, the primary cracks within the sandstone undergo compaction under axial pressure, resulting in plastic deformation. This plastic deformation cannot be reversed during unloading, resulting in the decreased total strain of the specimen during subsequent loading and unloading processes. During the initial cycle, the structure of the specimen transitions from stable to fractured, gradually weakening the load-bearing capacity of the rock. Subsequent loading and unloading cycles further weaken the load-bearing structure of the specimen, with internal cracks multiplying and connecting until the specimen exhibits a macroscopic fracture surface. After forming the macroscopic fracture surface, the dissipated energy of the specimen is primarily generated by the slip of the macroscopic section. The elastic energy density of the specimen decreases gradually as the number of cycles (axial strain) increases. This phenomenon is the result of an increase in the degree of damage to the specimen and a gradual weakening of its bearing capacity during cyclic loading and unloading, leading to a reduction in the rock’s energy storage capacity.
Figure 10 shows that the energy density evolution curves for rocks under different confining pressures are comparable. The total input and dissipated energy densities of the sample decrease as the number of cycles (axial strain) increases and ultimately reaches a stable state. The total input and dissipated energy density increase significantly in the last cycle due to the increase in the axial plastic strain of the sample.
In the context of rock behavior under cyclic loading, certain definitions are used to characterize the energy aspects. Specifically, the elastic energy density stored in the first cycle of the rock is referred to as the maximum elastic energy density, and the dissipated energy density released in the first cycle is defined as the maximum dissipated energy density. Furthermore, the elastic energy density stored in the last cycle of the rock is known as the residual elastic energy density.
It is evident from Figure 11 that as the confining pressure increases, the maximum and residual elasticity energy density of the rock gradually rise. This phenomenon suggests that confining pressure leads to a less complete release of elastic energy and that confining pressure can suppress the release of elastic energy. Additionally, the maximum dissipation energy density increases with increased confining pressure. Due to the elevated confining pressure, the internal structure of the specimen becomes denser, resulting in heightened friction between particles’ relative displacements on the microstructure. As a result, more energy is required to create cracks [31], leading to increased energy dissipation as the confining pressure rises. The comparison of maximum dissipated energy at different confining pressures reveals a trend. Specifically, the maximum dissipated energy at a confining pressure of 20 MPa is found to be 2.02 times greater than that at a confining pressure of 10 MPa. Similarly, the maximum dissipated energy at a confining pressure of 30 MPa is 1.80 times larger than that at a confining pressure of 20 MPa. These observations suggest that there is an increase in the maximum dissipated energy with increasing confining pressure; however, the rate of increase gradually diminishes. In other words, as the confining pressure is raised, the dissipation and release of energy in the rock are hindered.
According to the observations from Figure 12, it is apparent that when the confining pressure remains constant and the specimen undergoes the same number of cycles, the total input energy density of the specimen exhibits an inverse relationship with the pore pressure. This finding implies that, under the same confining pressure, the energy required for the specimen to reach yield failure gradually decreases as the pore pressure increases.
Based on Figure 13, it is apparent that when the confining pressure remains constant and the number of cycles is consistent, the elastic energy density of the specimen exhibits a decline as the pore pressure increases. This observation can be attributed to several underlying factors. Firstly, as the test progresses, an increased number of cracks are generated within the specimen. The rise in pore pressure facilitates the intrusion of fluid into these cracks, thereby compromising the load-bearing structure of the specimen. Consequently, the ability of the specimen to store elastic energy is weakened. Additionally, the interaction between the rising pore pressure and the rock specimen leads to the occurrence of unrecoverable plastic deformation. This plastic deformation further contributes to the reduction in the elastic energy storage capacity.
From Figure 14, it is evident that when the confining pressure remains constant, and the specimen undergoes the same number of cycles, a negative correlation exists between the dissipated energy density of the specimen and the pore pressure. Indeed, the observed phenomenon can be attributed to the effects of increased pore pressure on the bearing structure and internal particle interactions within the specimen. When pore pressure increases, it exacerbates the destruction of the bearing structure of the specimen. The elevated pore pressure weakens the cementation forces between the particles inside the specimen. As a result, the overall cohesion and strength of the specimen decline. Additionally, the increased pore pressure promotes the generation and propagation of cracks within the specimen. During the process of specimen failure, the energy dissipated through structural damage is reduced when the pore pressure is higher.

3.4. Post-Peak Cyclic Loading and Unloading Energy Rate of Change Curves

From Figure 15, it is apparent that apart from a handful of specimens, the proportion of elastic energy generally exhibits a trend of an initial increase followed by a decrease, while the proportion of dissipated energy generally portrays a trend of an initial decline followed by a rise ( η e   and η d   in Figure 15 represent the proportion of elastic energy and the proportion of dissipated energy, respectively).
The energy input from the testing machine to the rock is mostly transformed into elastic and dissipation energies. Figure 16 illustrates the energy density ratio–axial strain relationship curves for sandstone specimens subjected to post-peak cyclic loading and unloading under hydraulic coupling conditions. Specifically, it examines the proportion of elastic energy and dissipation energy for sandstone with a pore pressure of 2 MPa under varying confining pressures of 10 MPa, 20 MPa, and 30 MPa.
Figure 16 shows that during the initial cycle of loading and unloading under hydraulic coupling conditions, the dissipated energy predominates, while the elastic energy represents a relatively smaller proportion. This observation can be attributed to the release of accumulated elastic energy during the destruction of the rock specimen. As the rock specimen undergoes loading, elastic energy is stored within the specimen due to deformation. However, when the rock reaches its peak strength and begins to fail, a significant release of elastic energy occurs. This sudden release of stored elastic energy leads to a substantial increase in the density of dissipated energy and, consequently, a relatively larger proportion of dissipated energy compared to elastic energy. After the rock specimen fails, the application of confining pressure helps stabilize the rock, allowing it to accumulate energy once again. This stabilization process leads to a noticeable upward trend in the elastic energy ratio. As the confining pressure increases, the peak value of the proportion of elastic energy also increases. For instance, under confining pressures of 10 MPa, 20 MPa, and 30 MPa, the peak values of the proportion of elastic energy are 0.66, 0.75, and 0.77, respectively. This indicates that higher confining pressures promote the accumulation of elastic energy after rock failure. However, as the cyclic loading and unloading progress, the rock experiences increasing levels of damage, resulting in a gradual weakening of its bearing capacity. Consequently, the rock’s ability to store and accumulate energy diminishes, leading to a decline in the proportion of elastic energy over time.

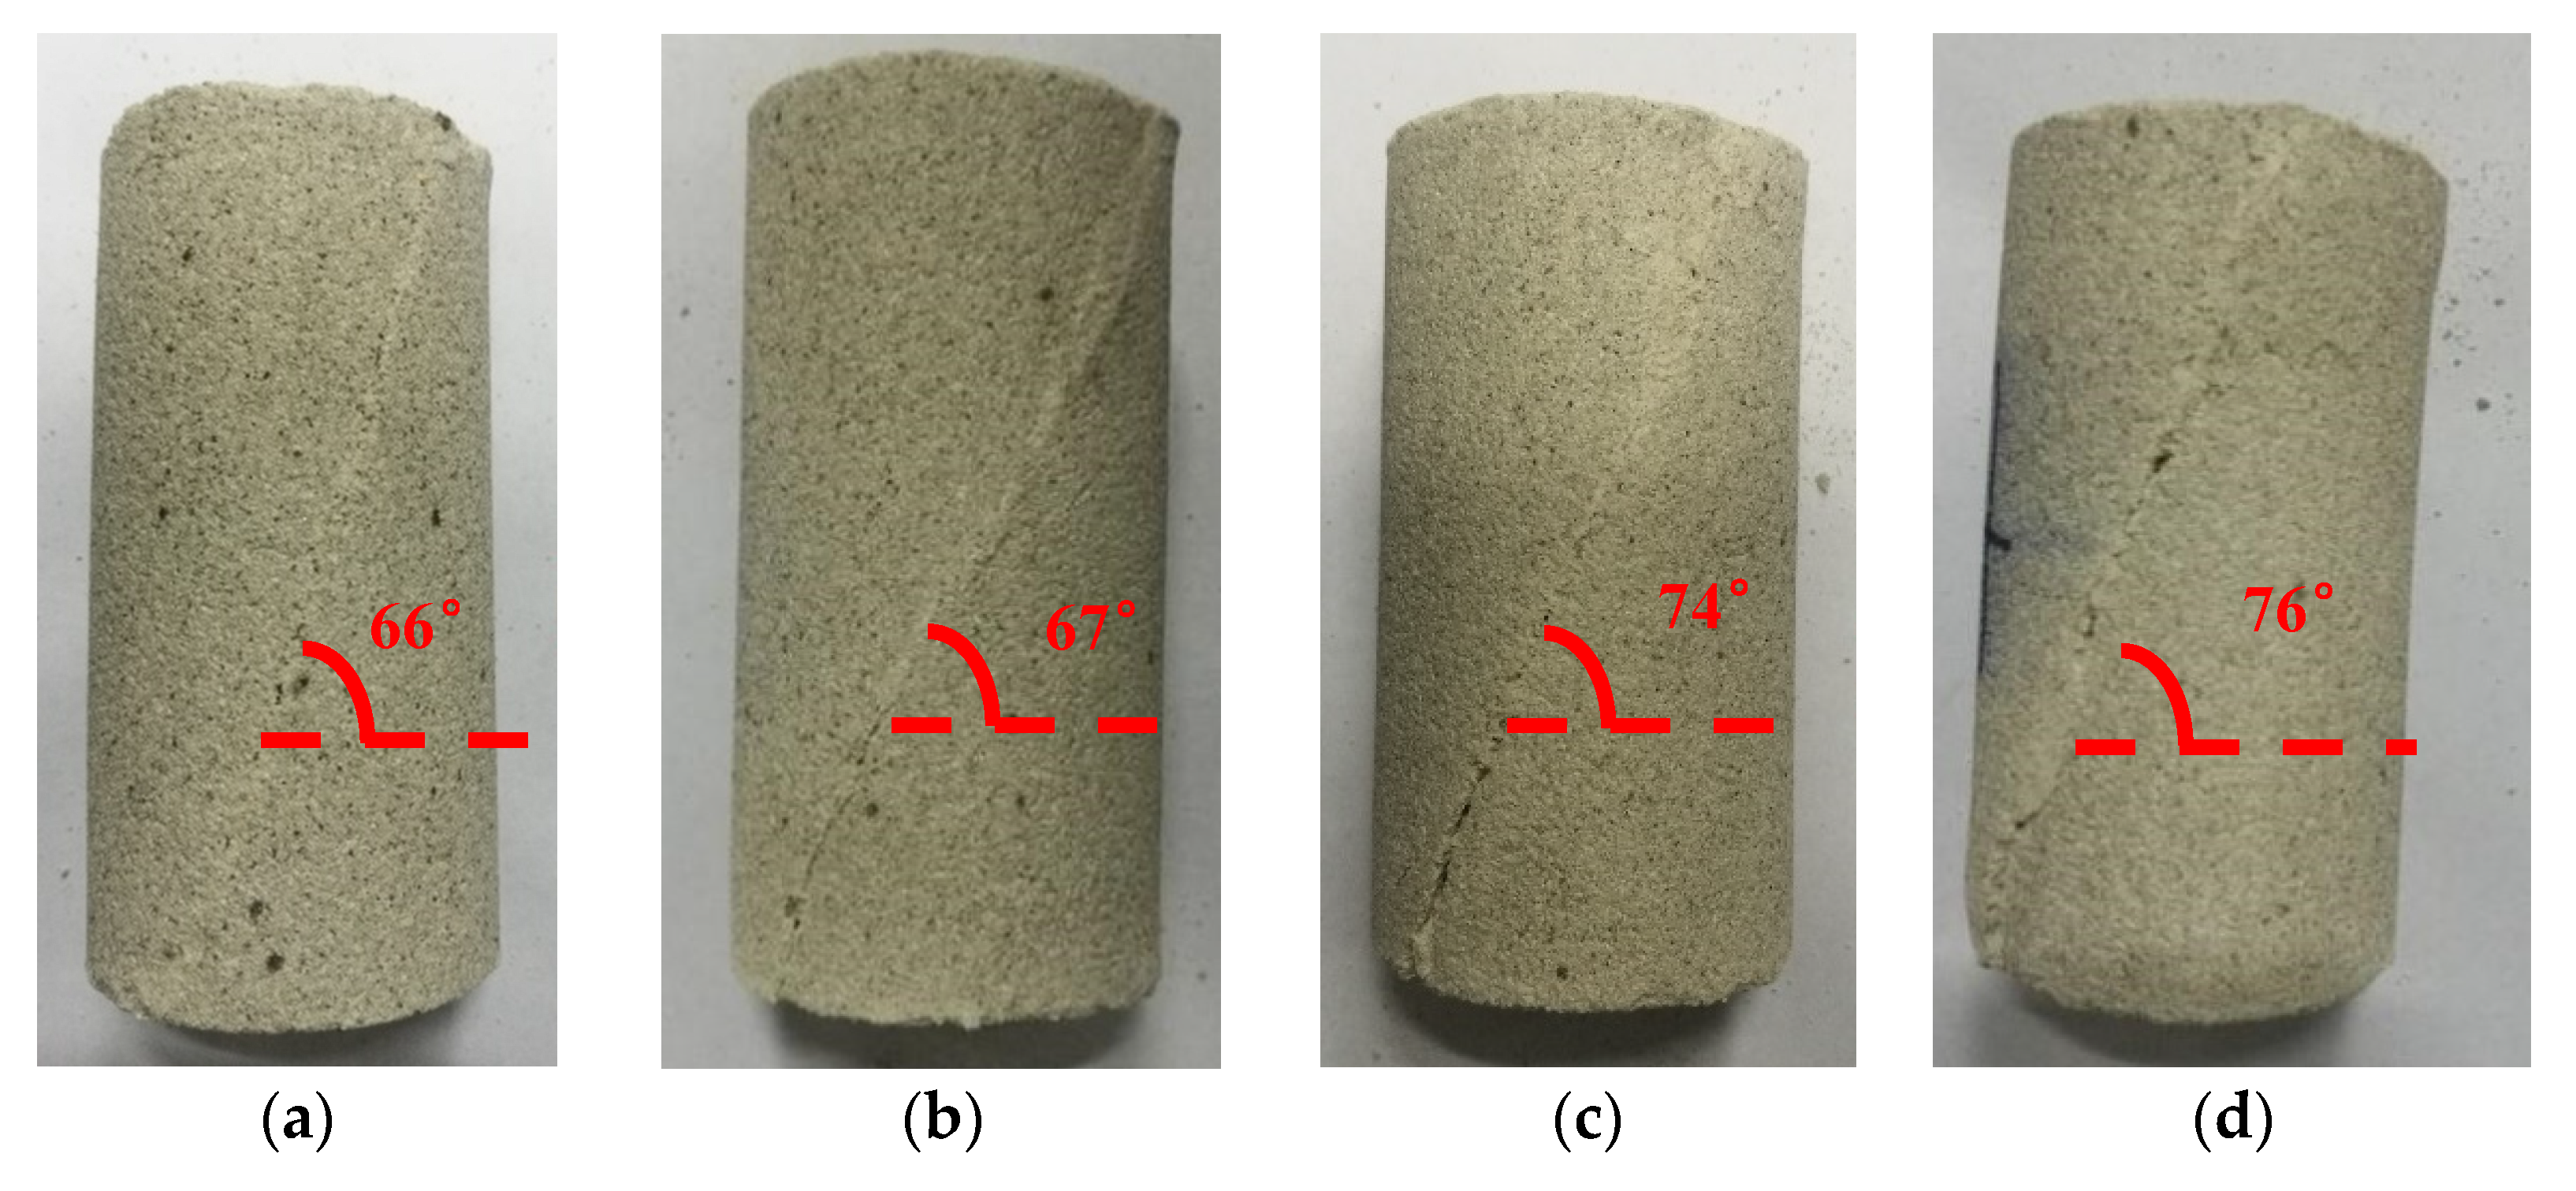
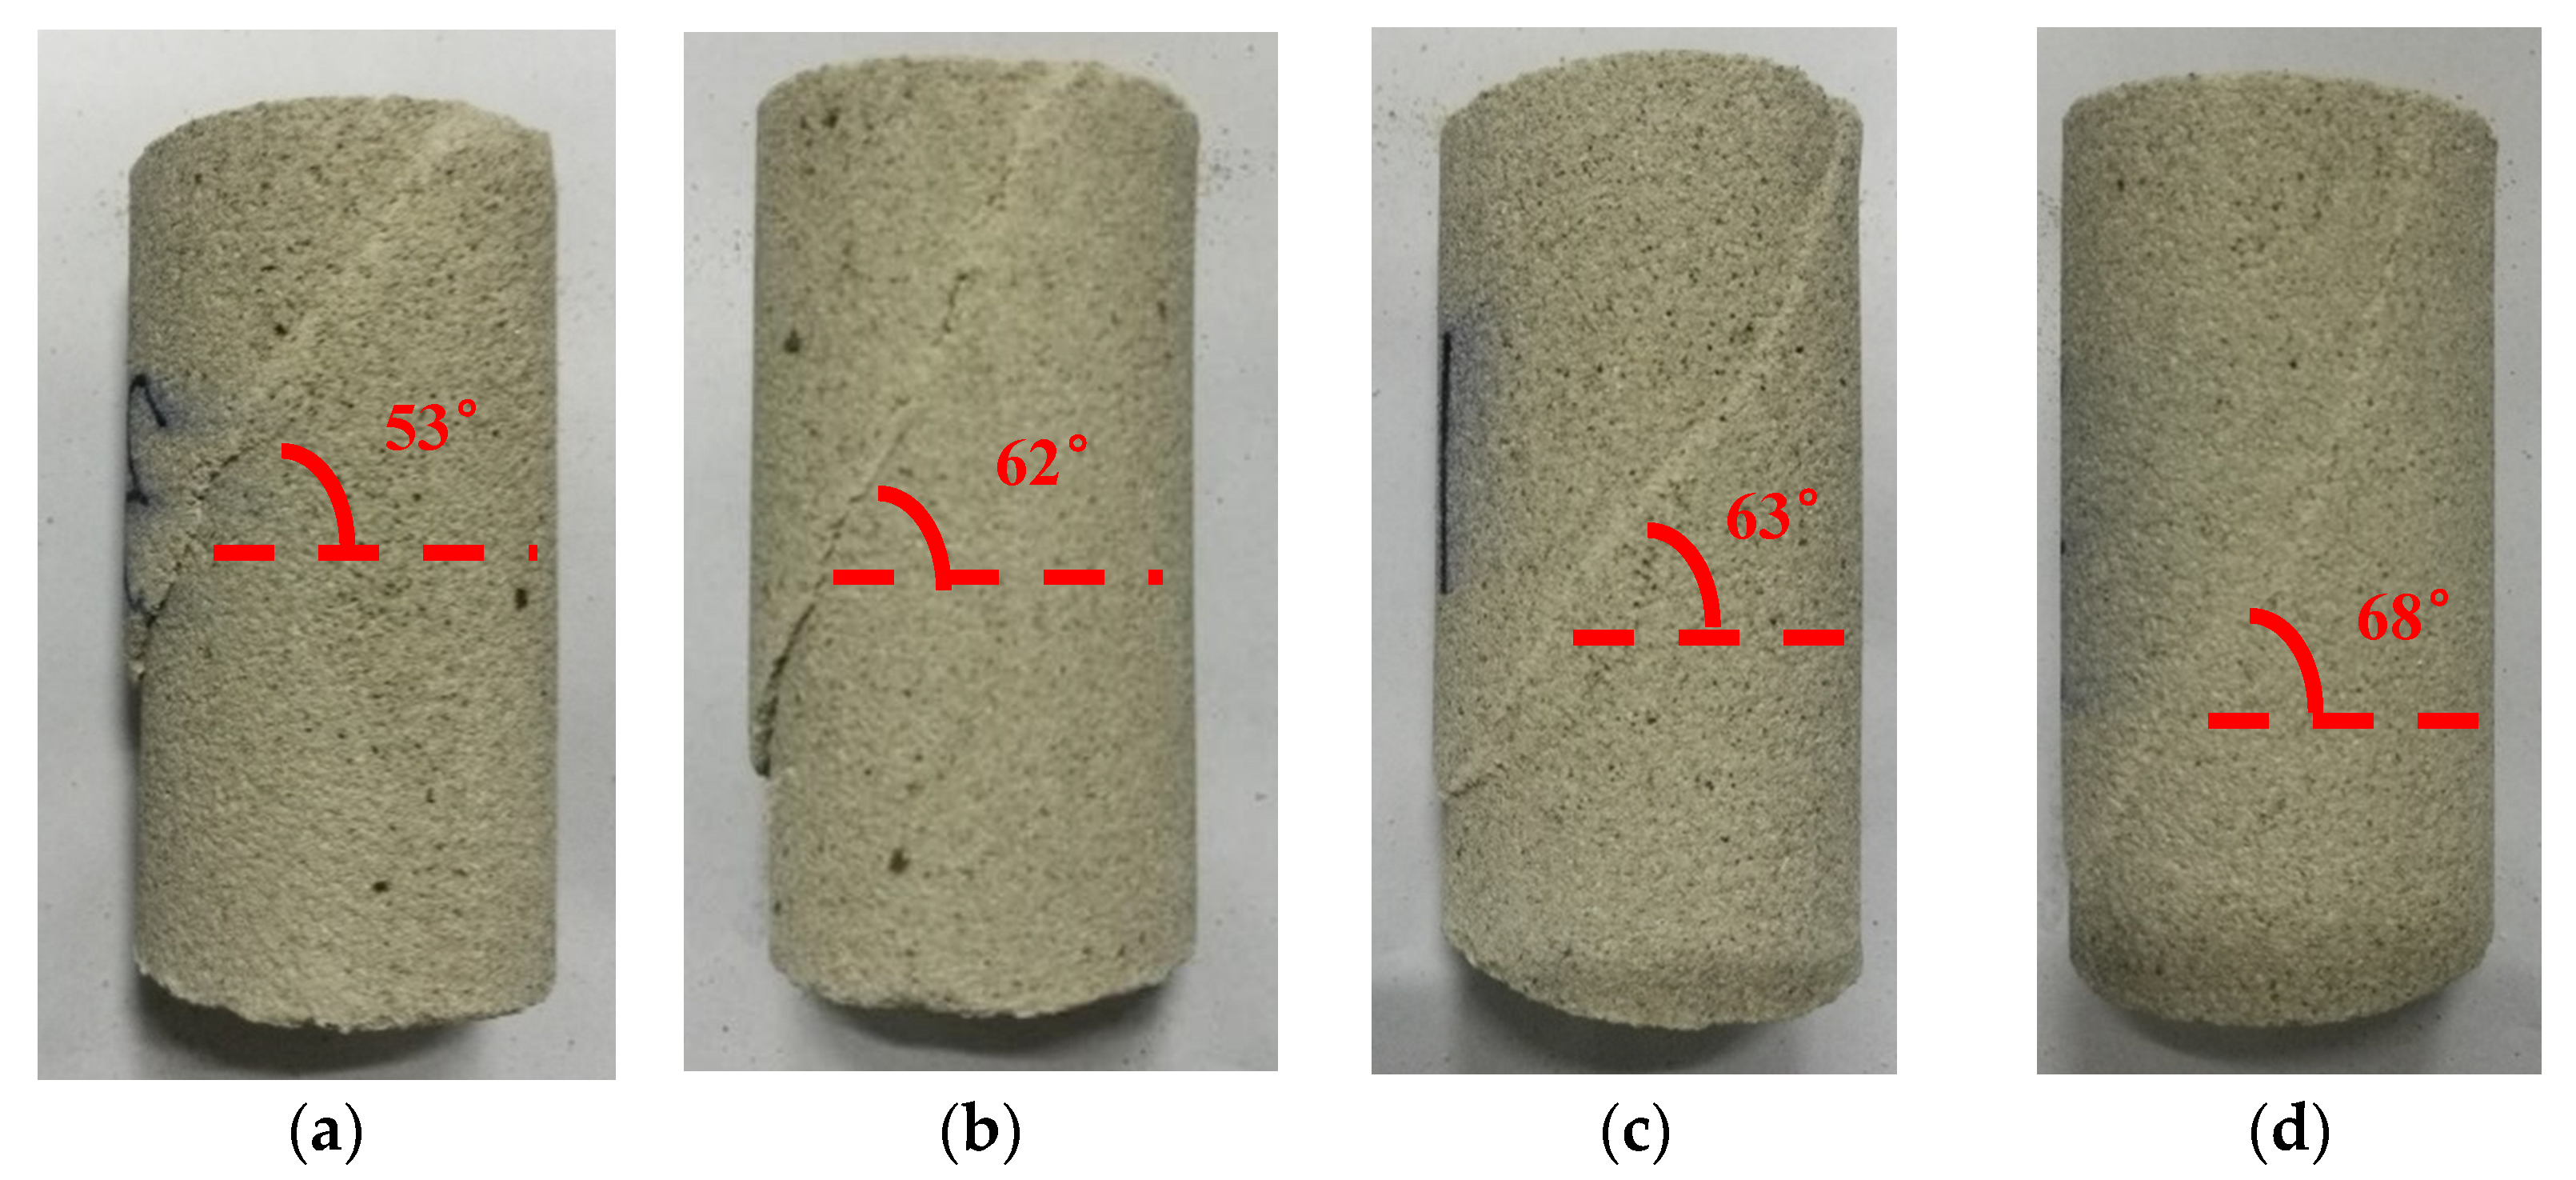
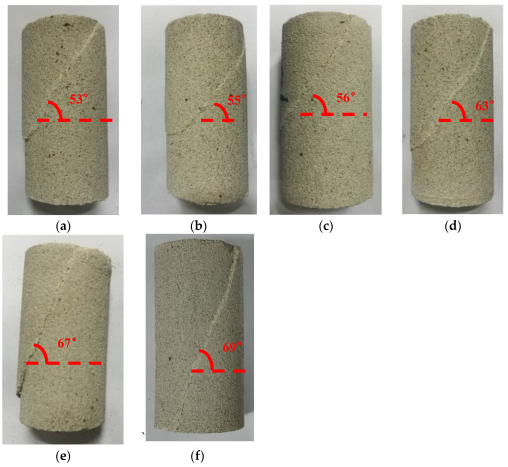
4. Analysis of Failure Characteristics of Sandstone Specimens

Figure 17, Figure 18 and Figure 19 show that the behavior of saturated sandstone specimens under post-peak cyclic loading and unloading conditions exhibits a single slope shear failure pattern [32,33,34,35,36,37]. The fracture surface angle of the specimen varies based on the pore pressure and confining pressure conditions. When comparing specimens with the same confining pressure, an increase in pore pressure results in an increase in the fracture surface angle. This indicates a positive correlation between the pore pressure and the angle of the fracture surface. Conversely, when considering specimens with equal pore pressures, there is a negative correlation between the fracture surface angle and the confining pressure. As the confining pressure increases, the fracture surface angle decreases. Under a confining pressure of 10 MPa, the fracture surfaces of the specimens are connected, extending from the upper to the lower sections. However, when the confining pressure is 20 MPa or 30 MPa and the pore pressure is low, the fracture surface of each specimen is initiated at one end and stopped at the middle section of the specimen. With an increase in pore pressure, the fracture surface of the specimen eventually penetrates both the upper and lower sections.

5. Conclusions

The essence of material failure is state instability driven by energy. Rocks, even after reaching their peak stress, still retain a certain level of load-bearing capacity. During the repair process of damaged rock roadways, rocks are frequently subjected to cyclic loading. As a result, the investigation of the energy evolution laws pertaining to rocks assumes paramount importance in ensuring the sustainable utilization of these compromised roadways. Based on the conducted post-peak cyclic loading and unloading tests on sandstone under hydraulic coupling conditions, as well as the energy calculations, several conclusions have been drawn regarding the influence of confining pressure and pore pressure on rock energy evolution. The findings are as follows:
(1)
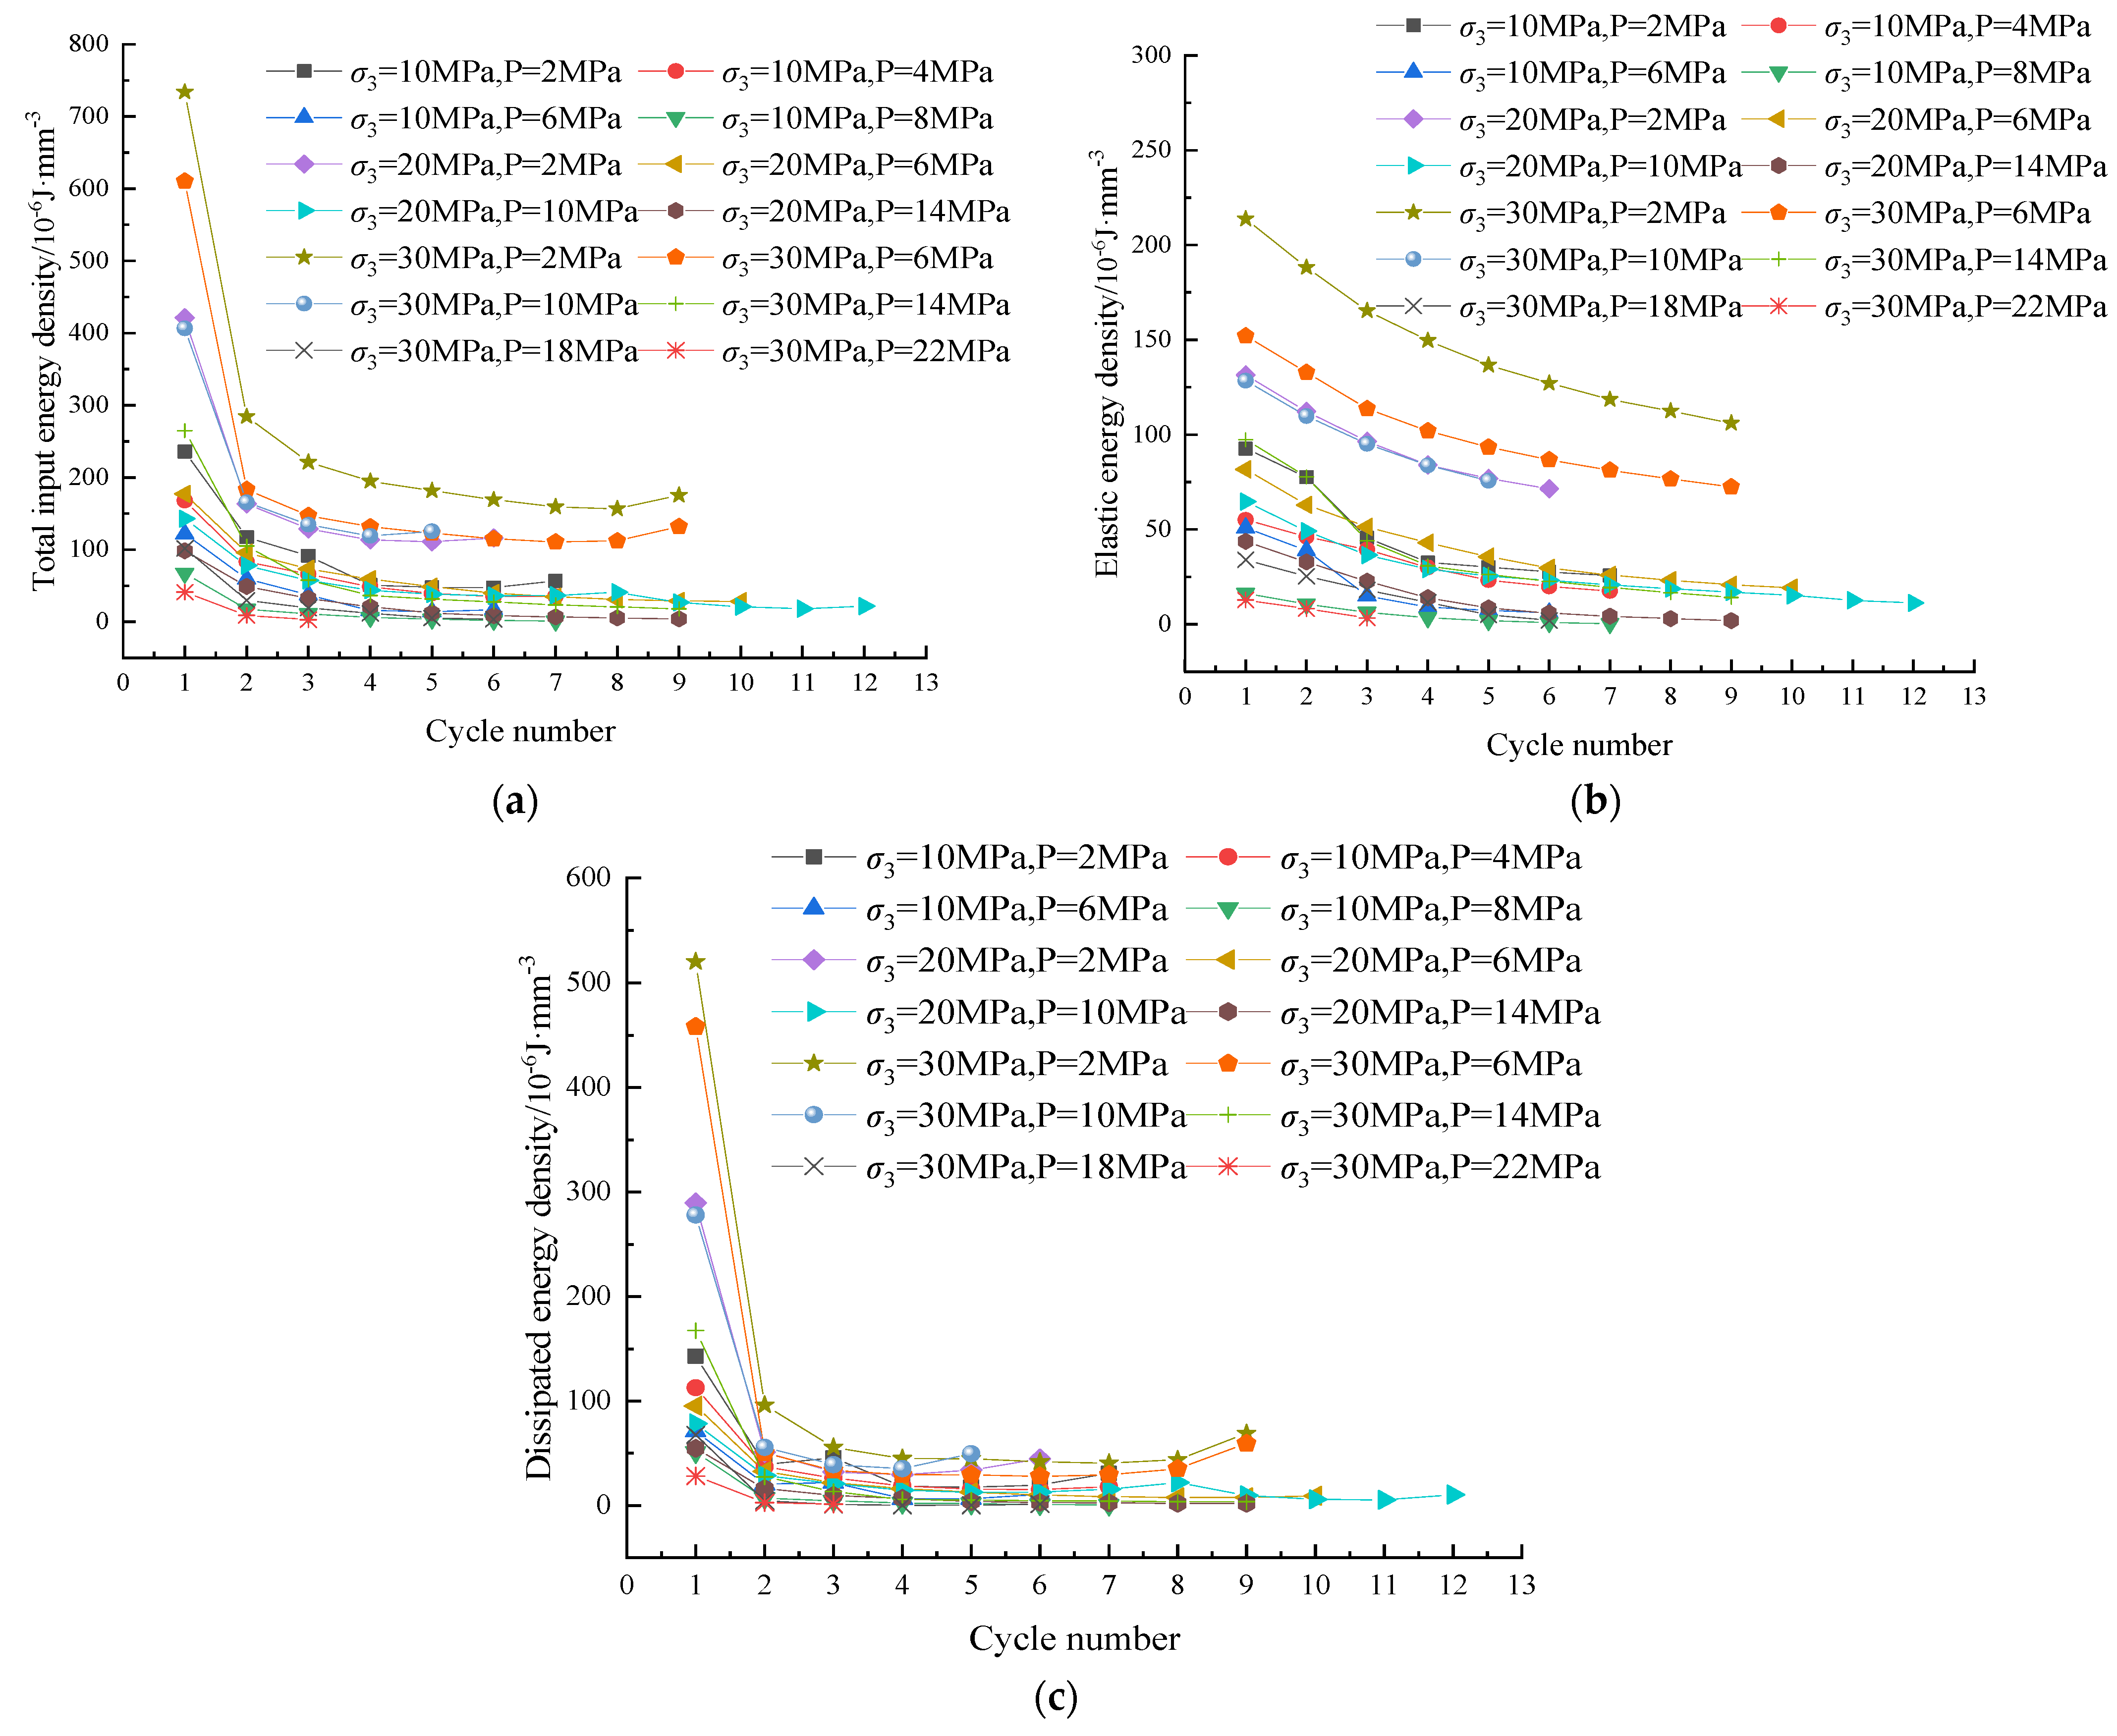
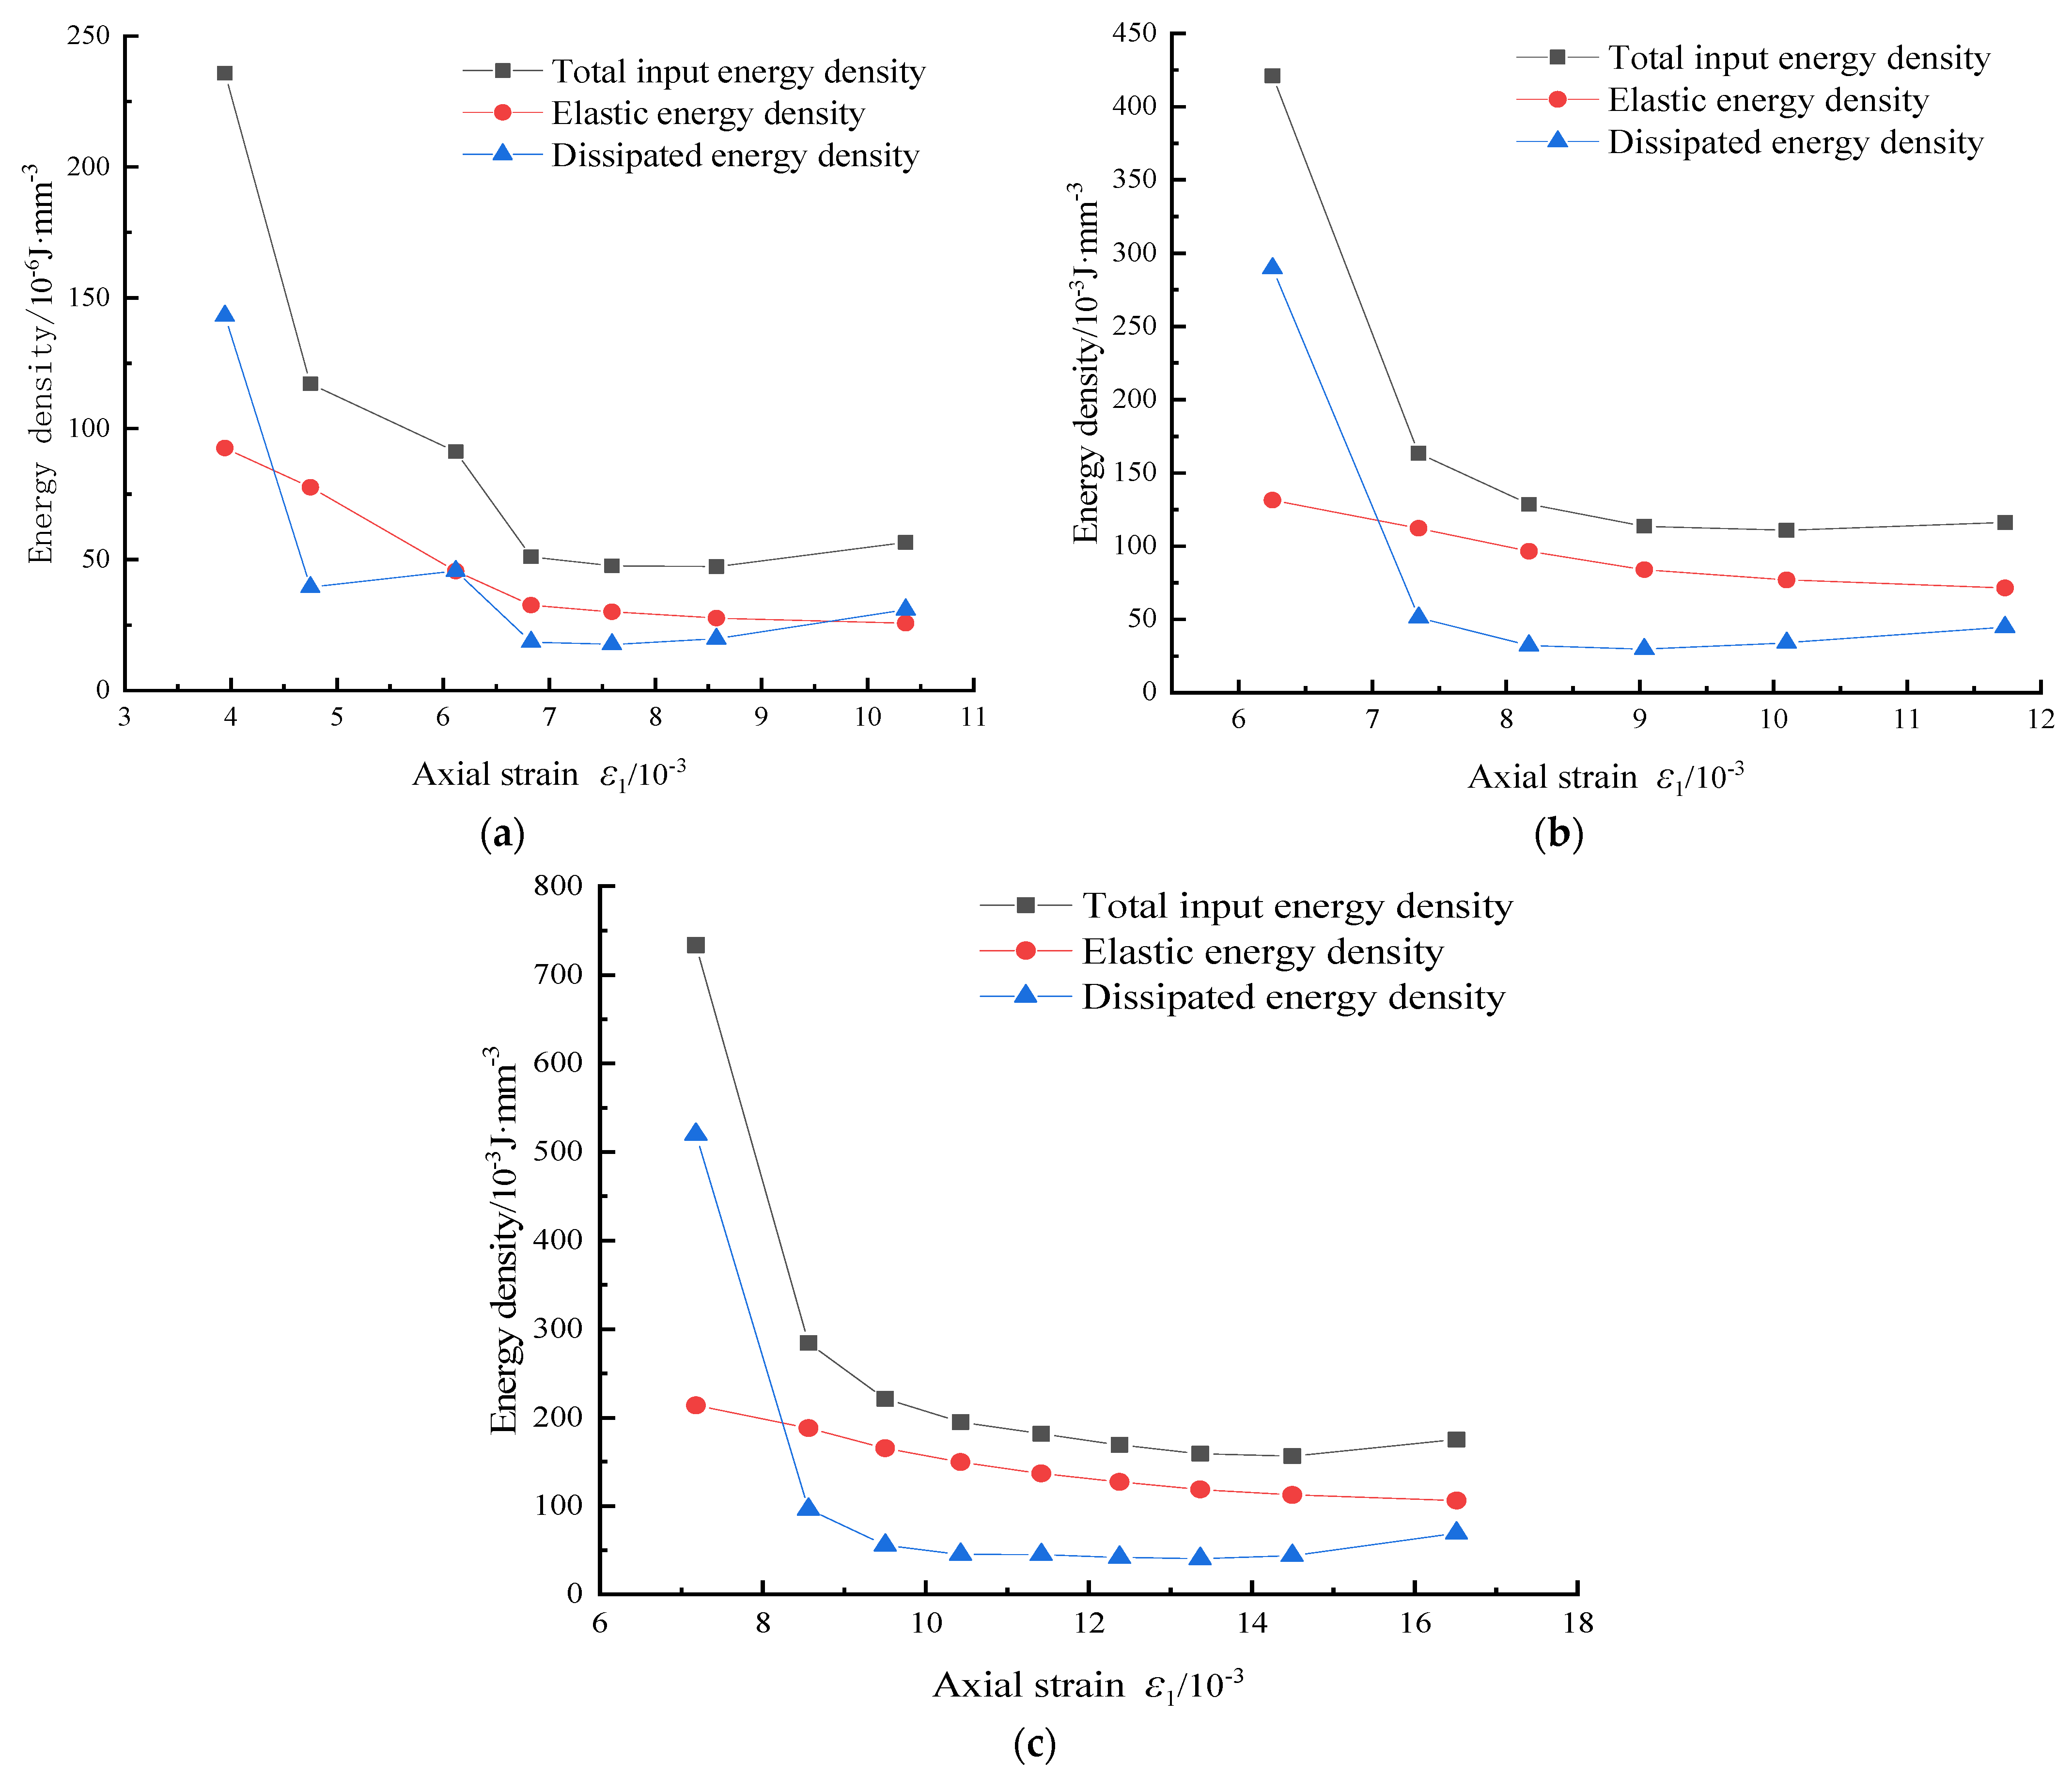
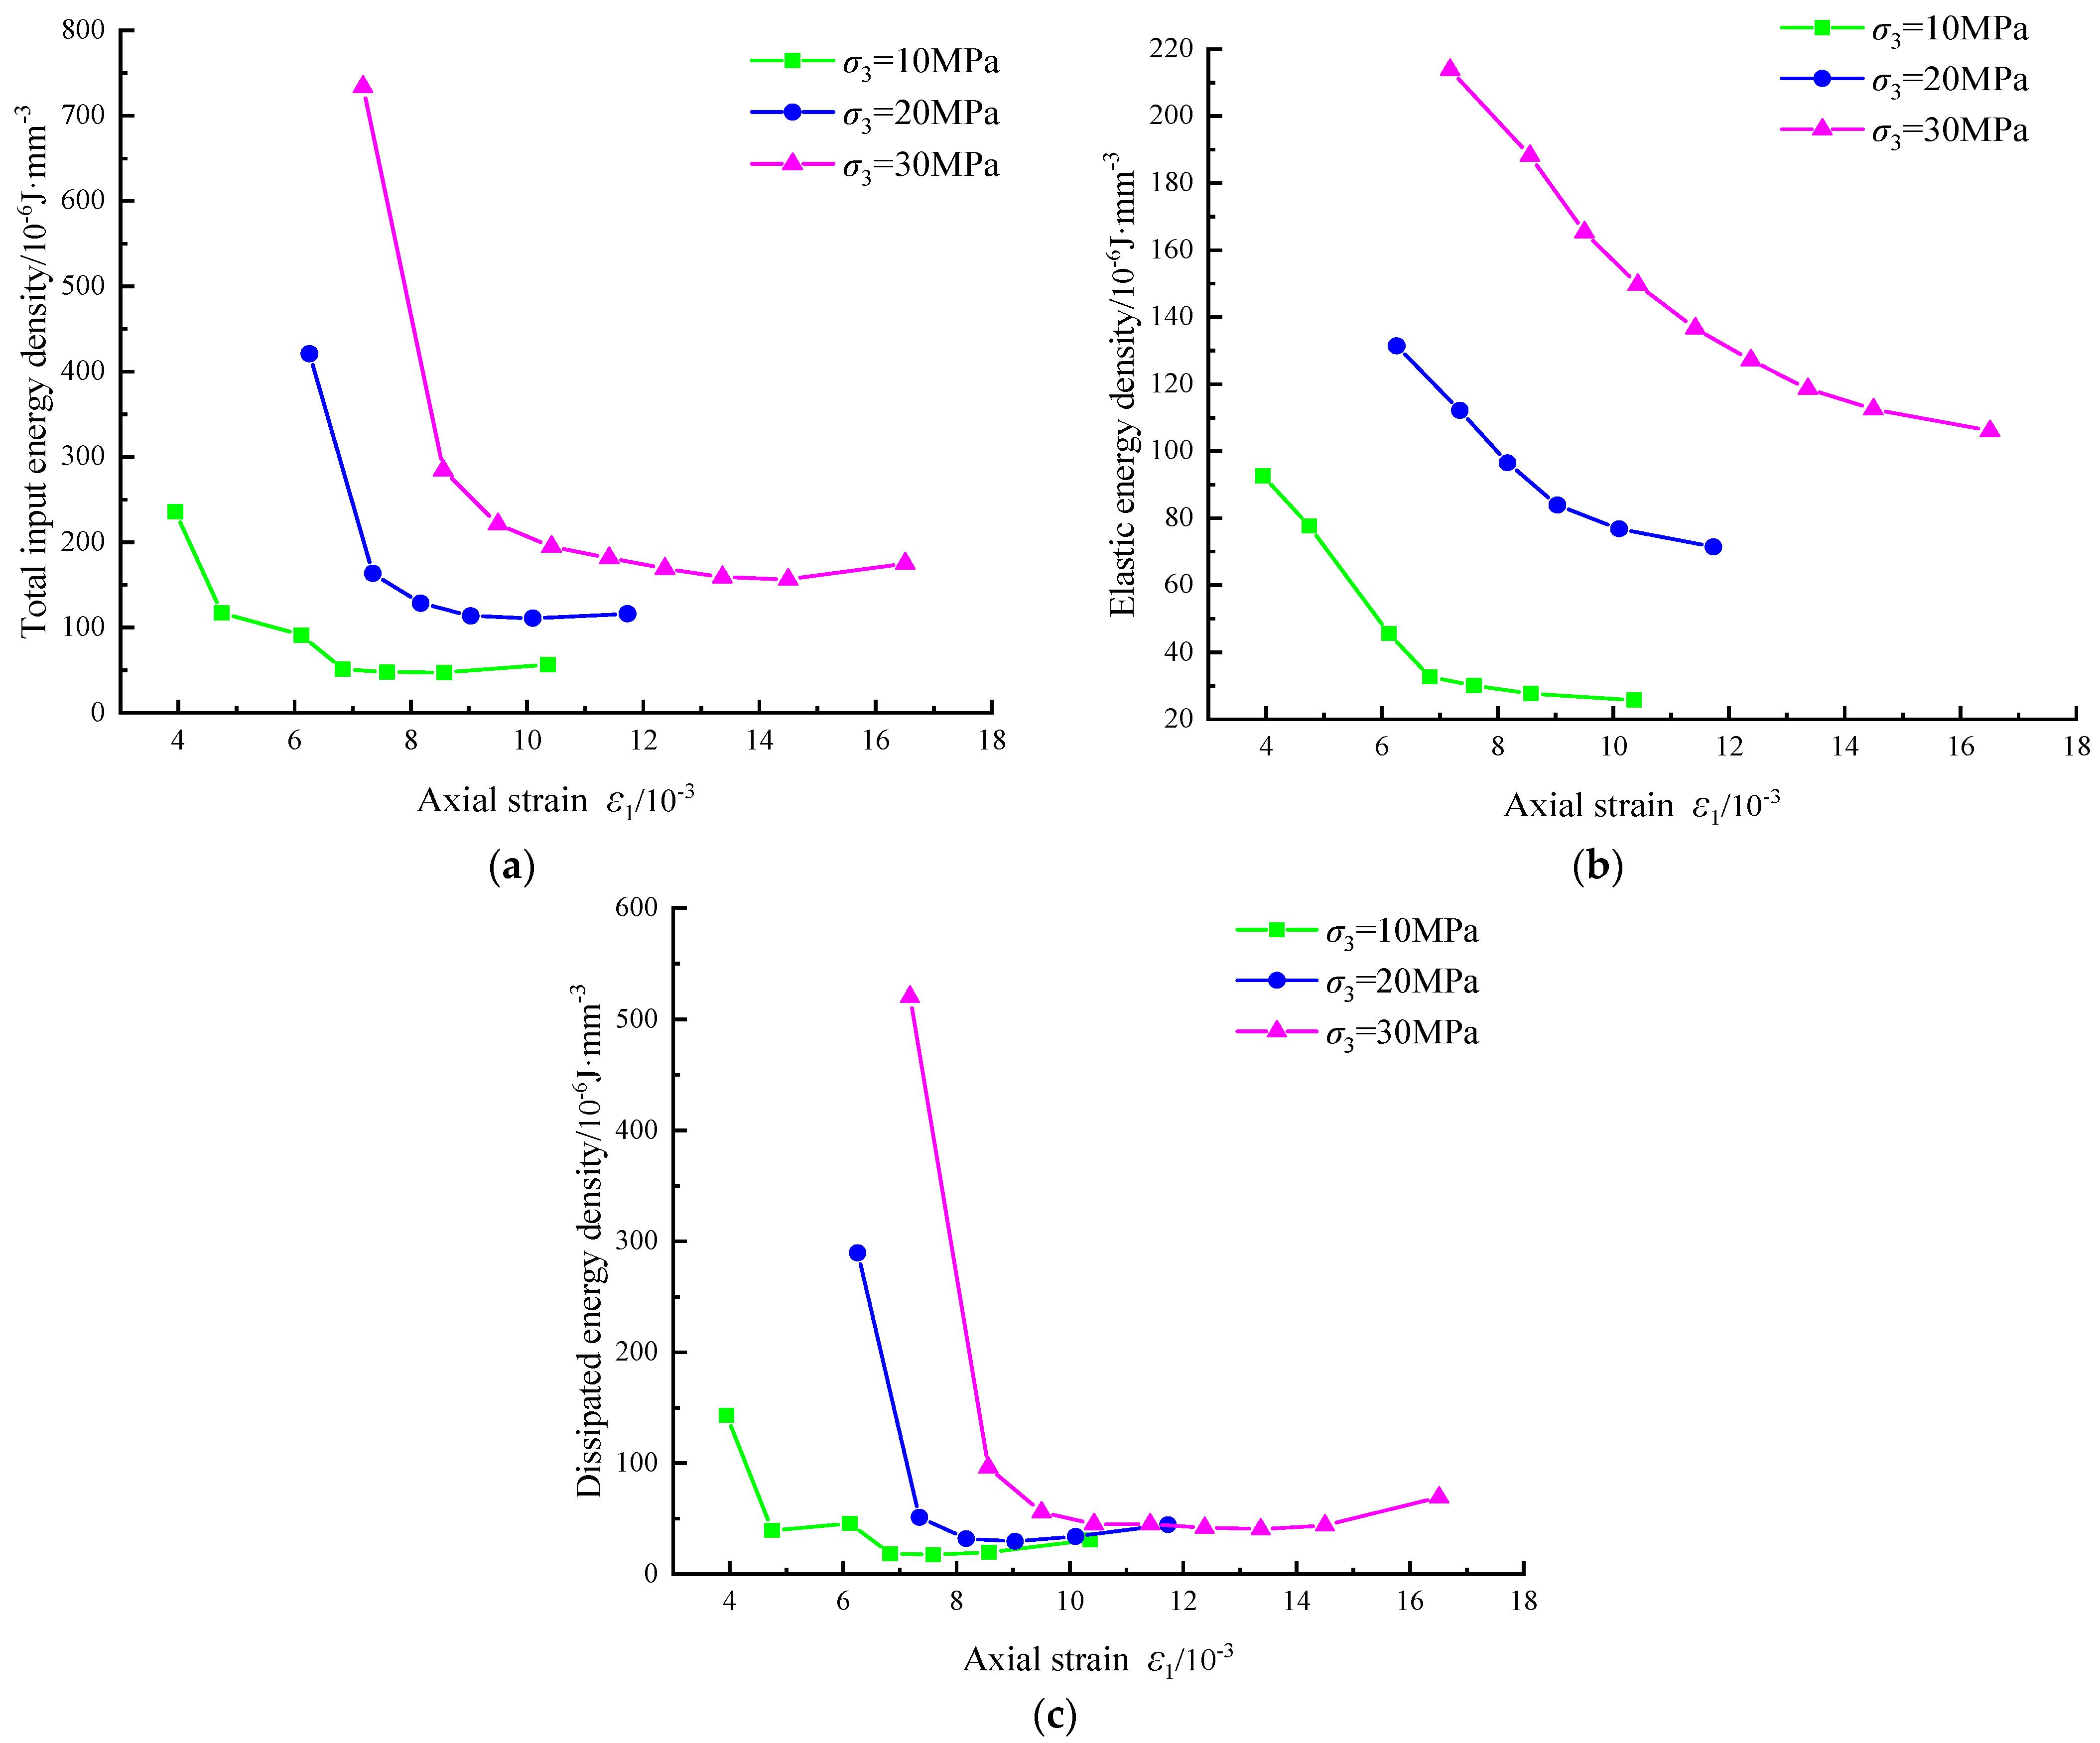
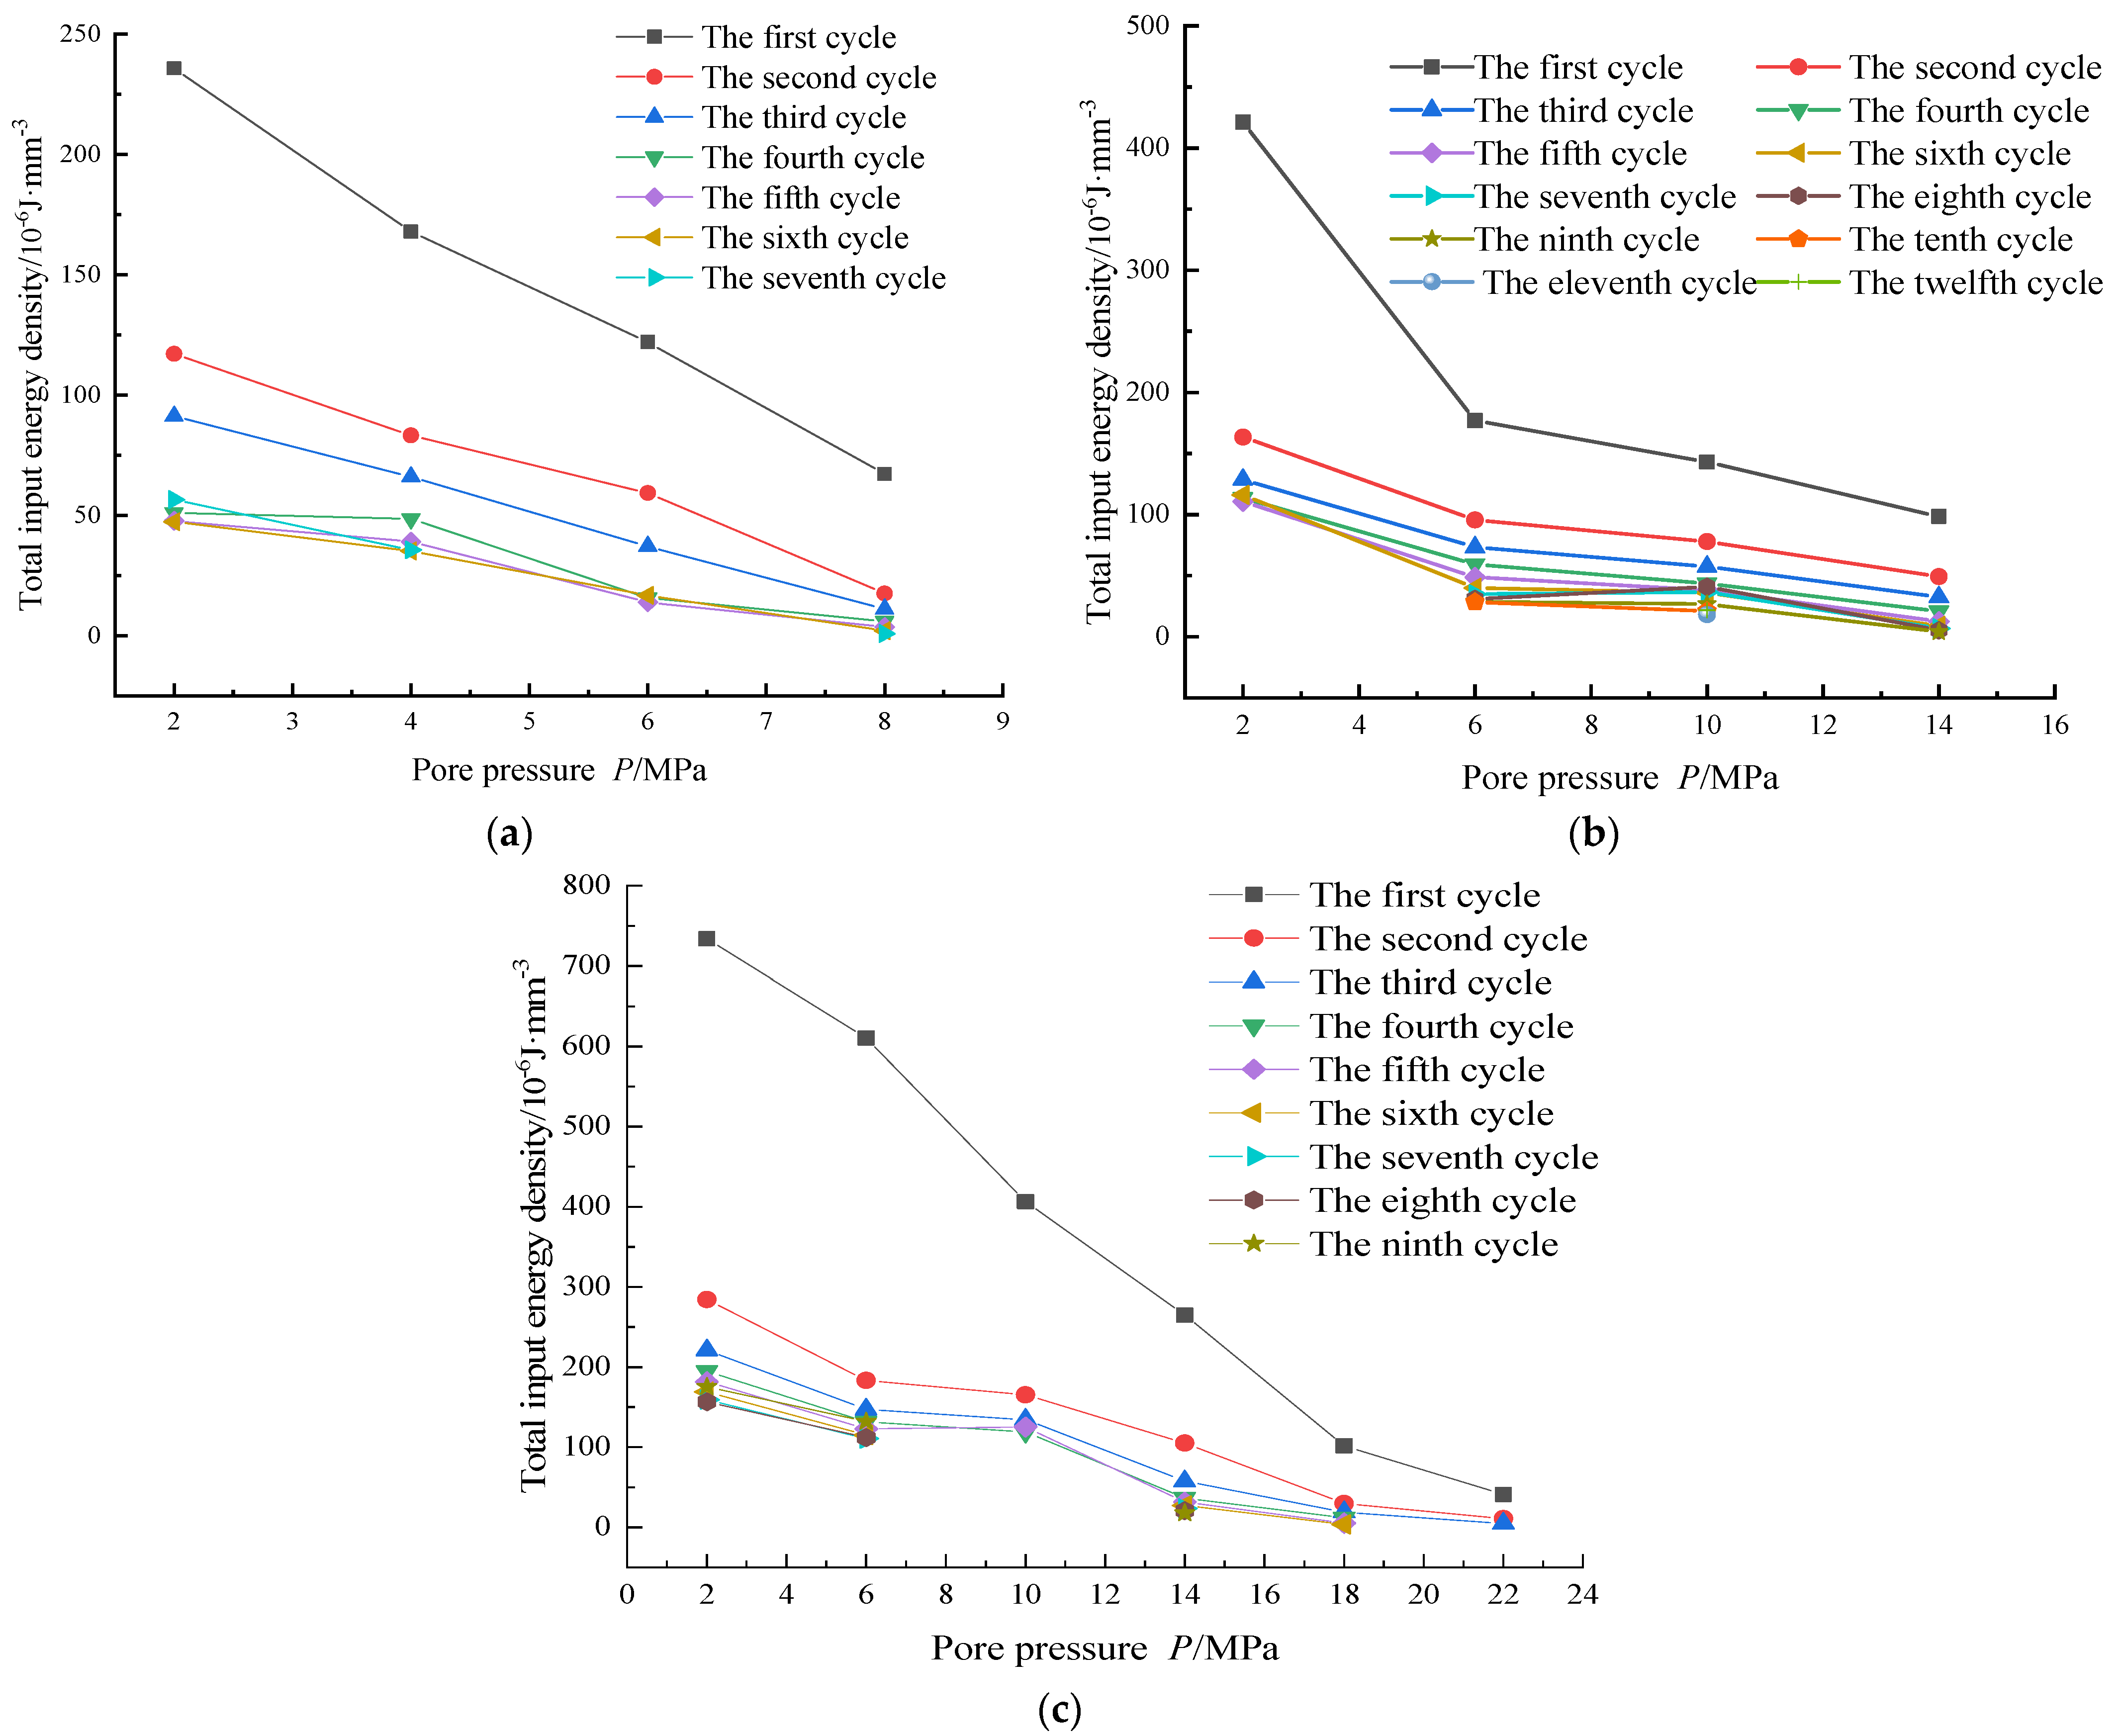
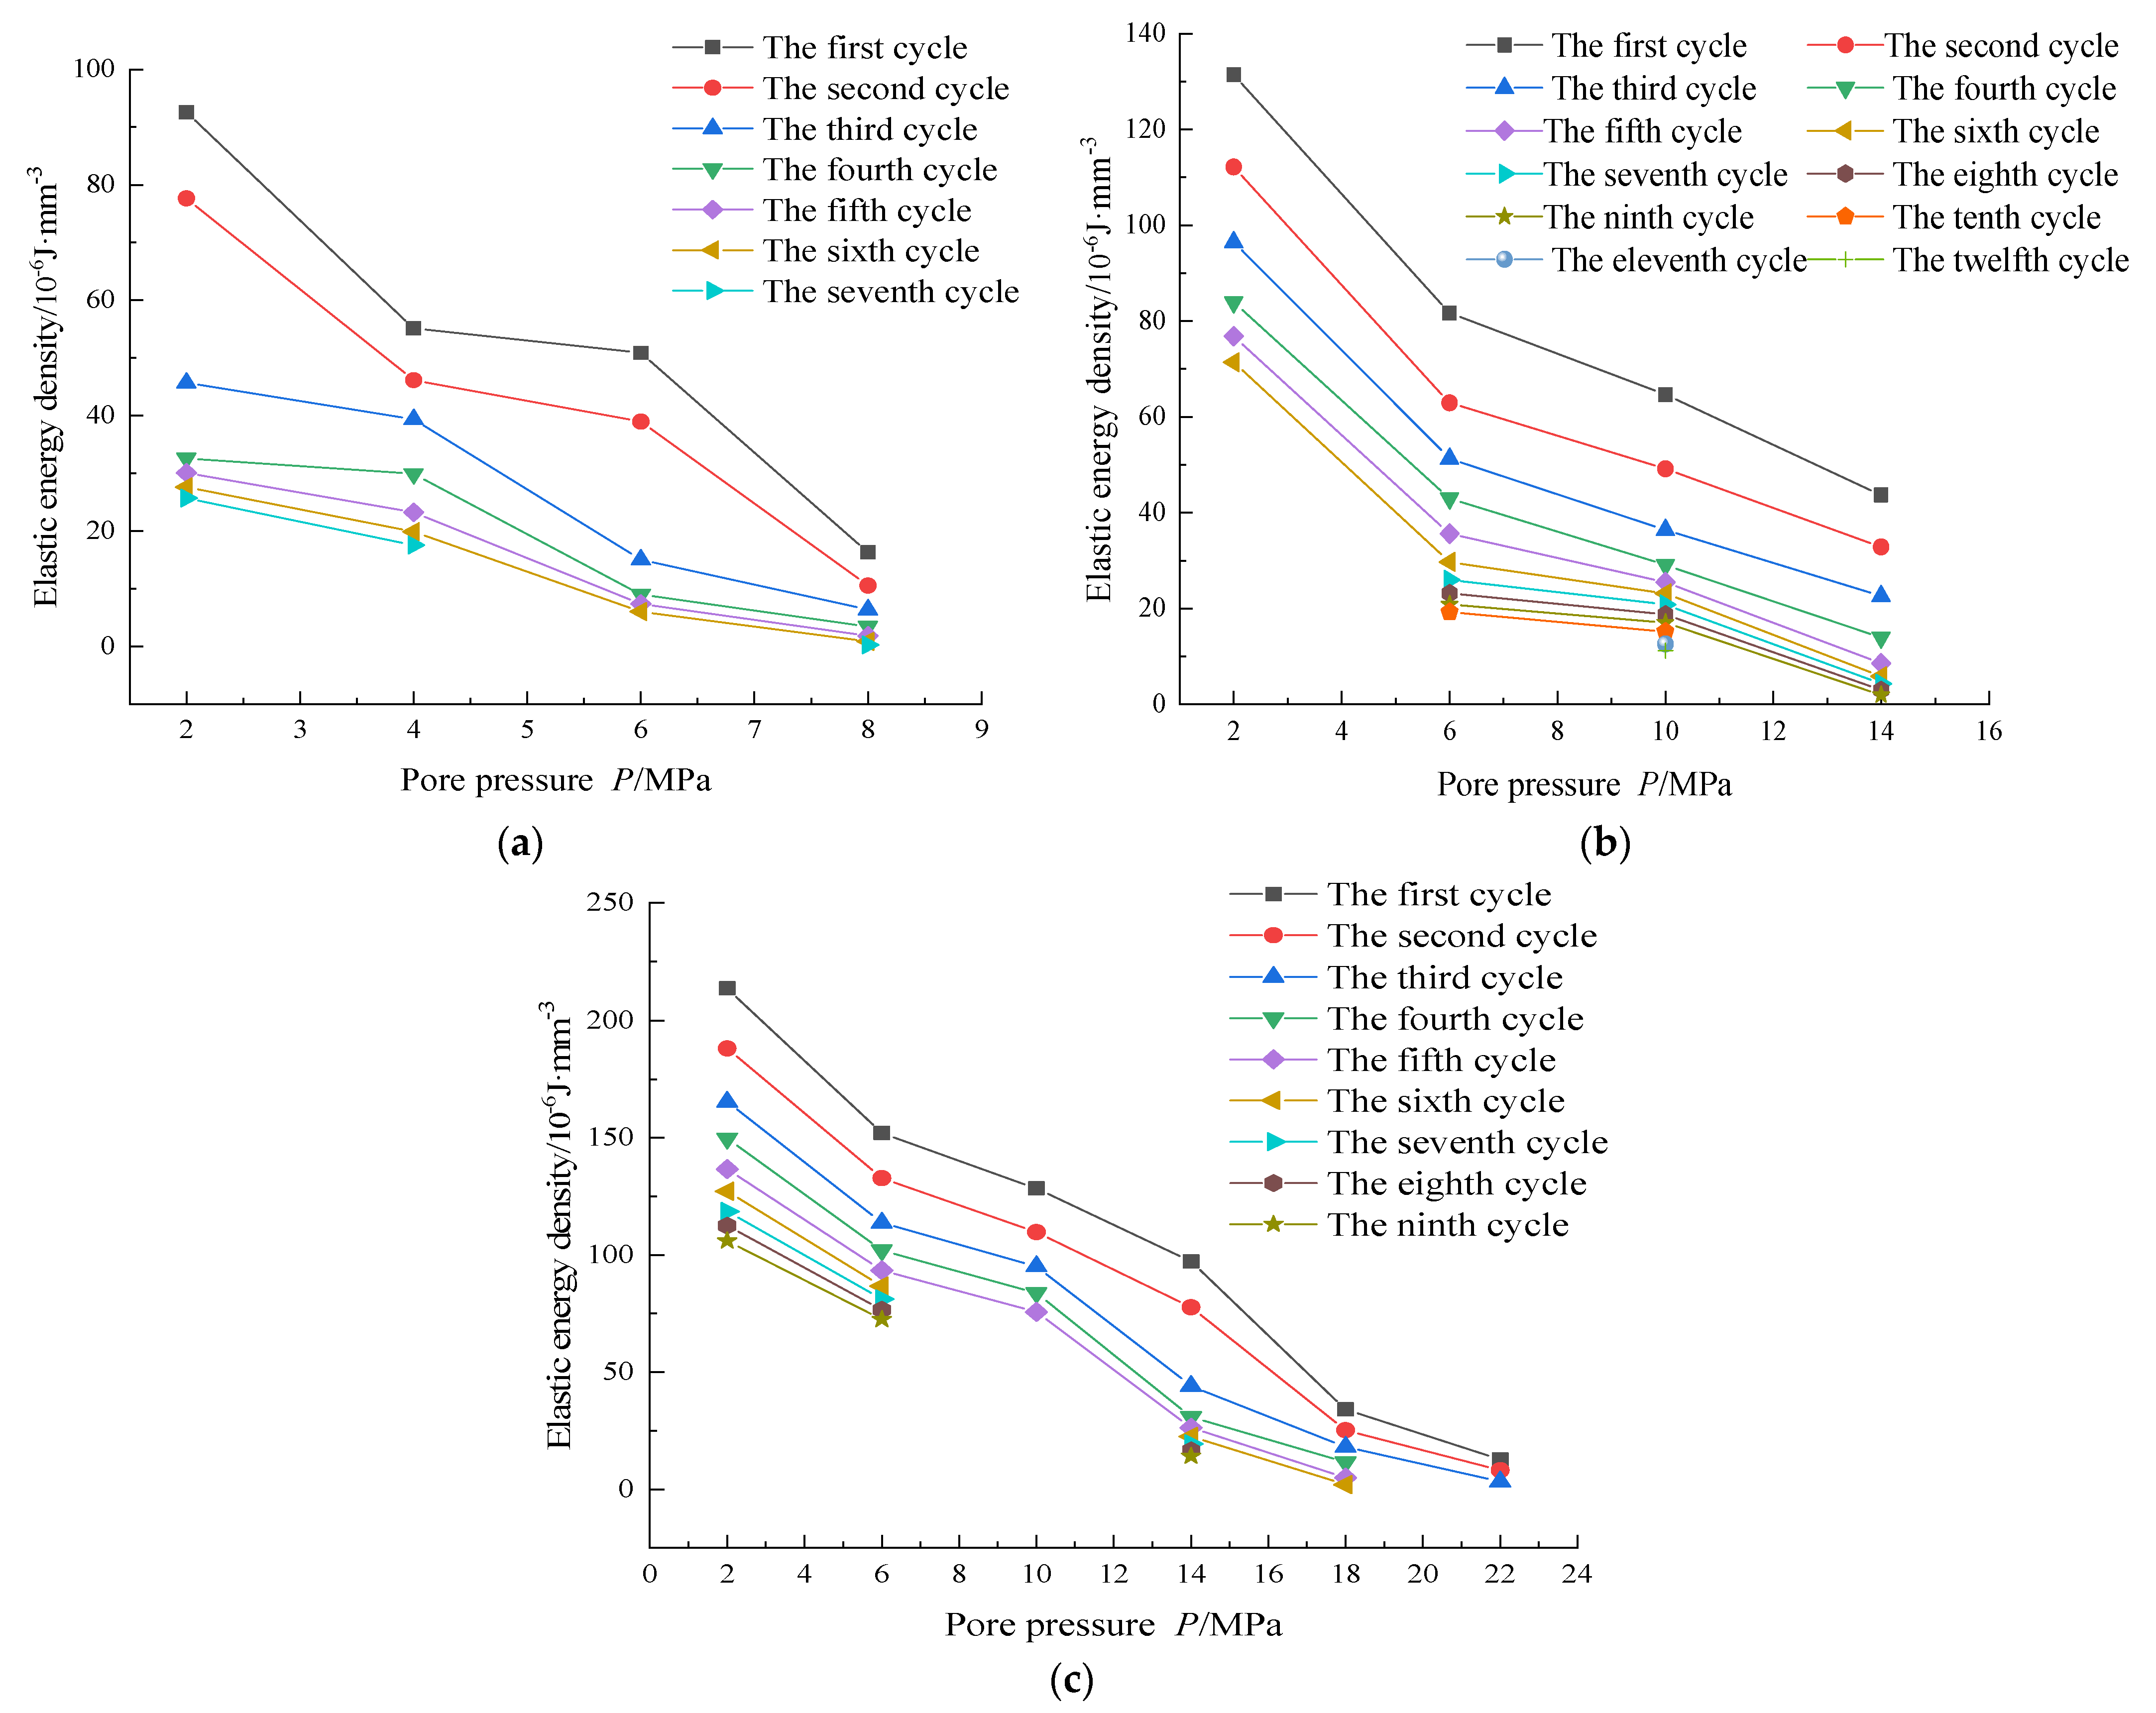
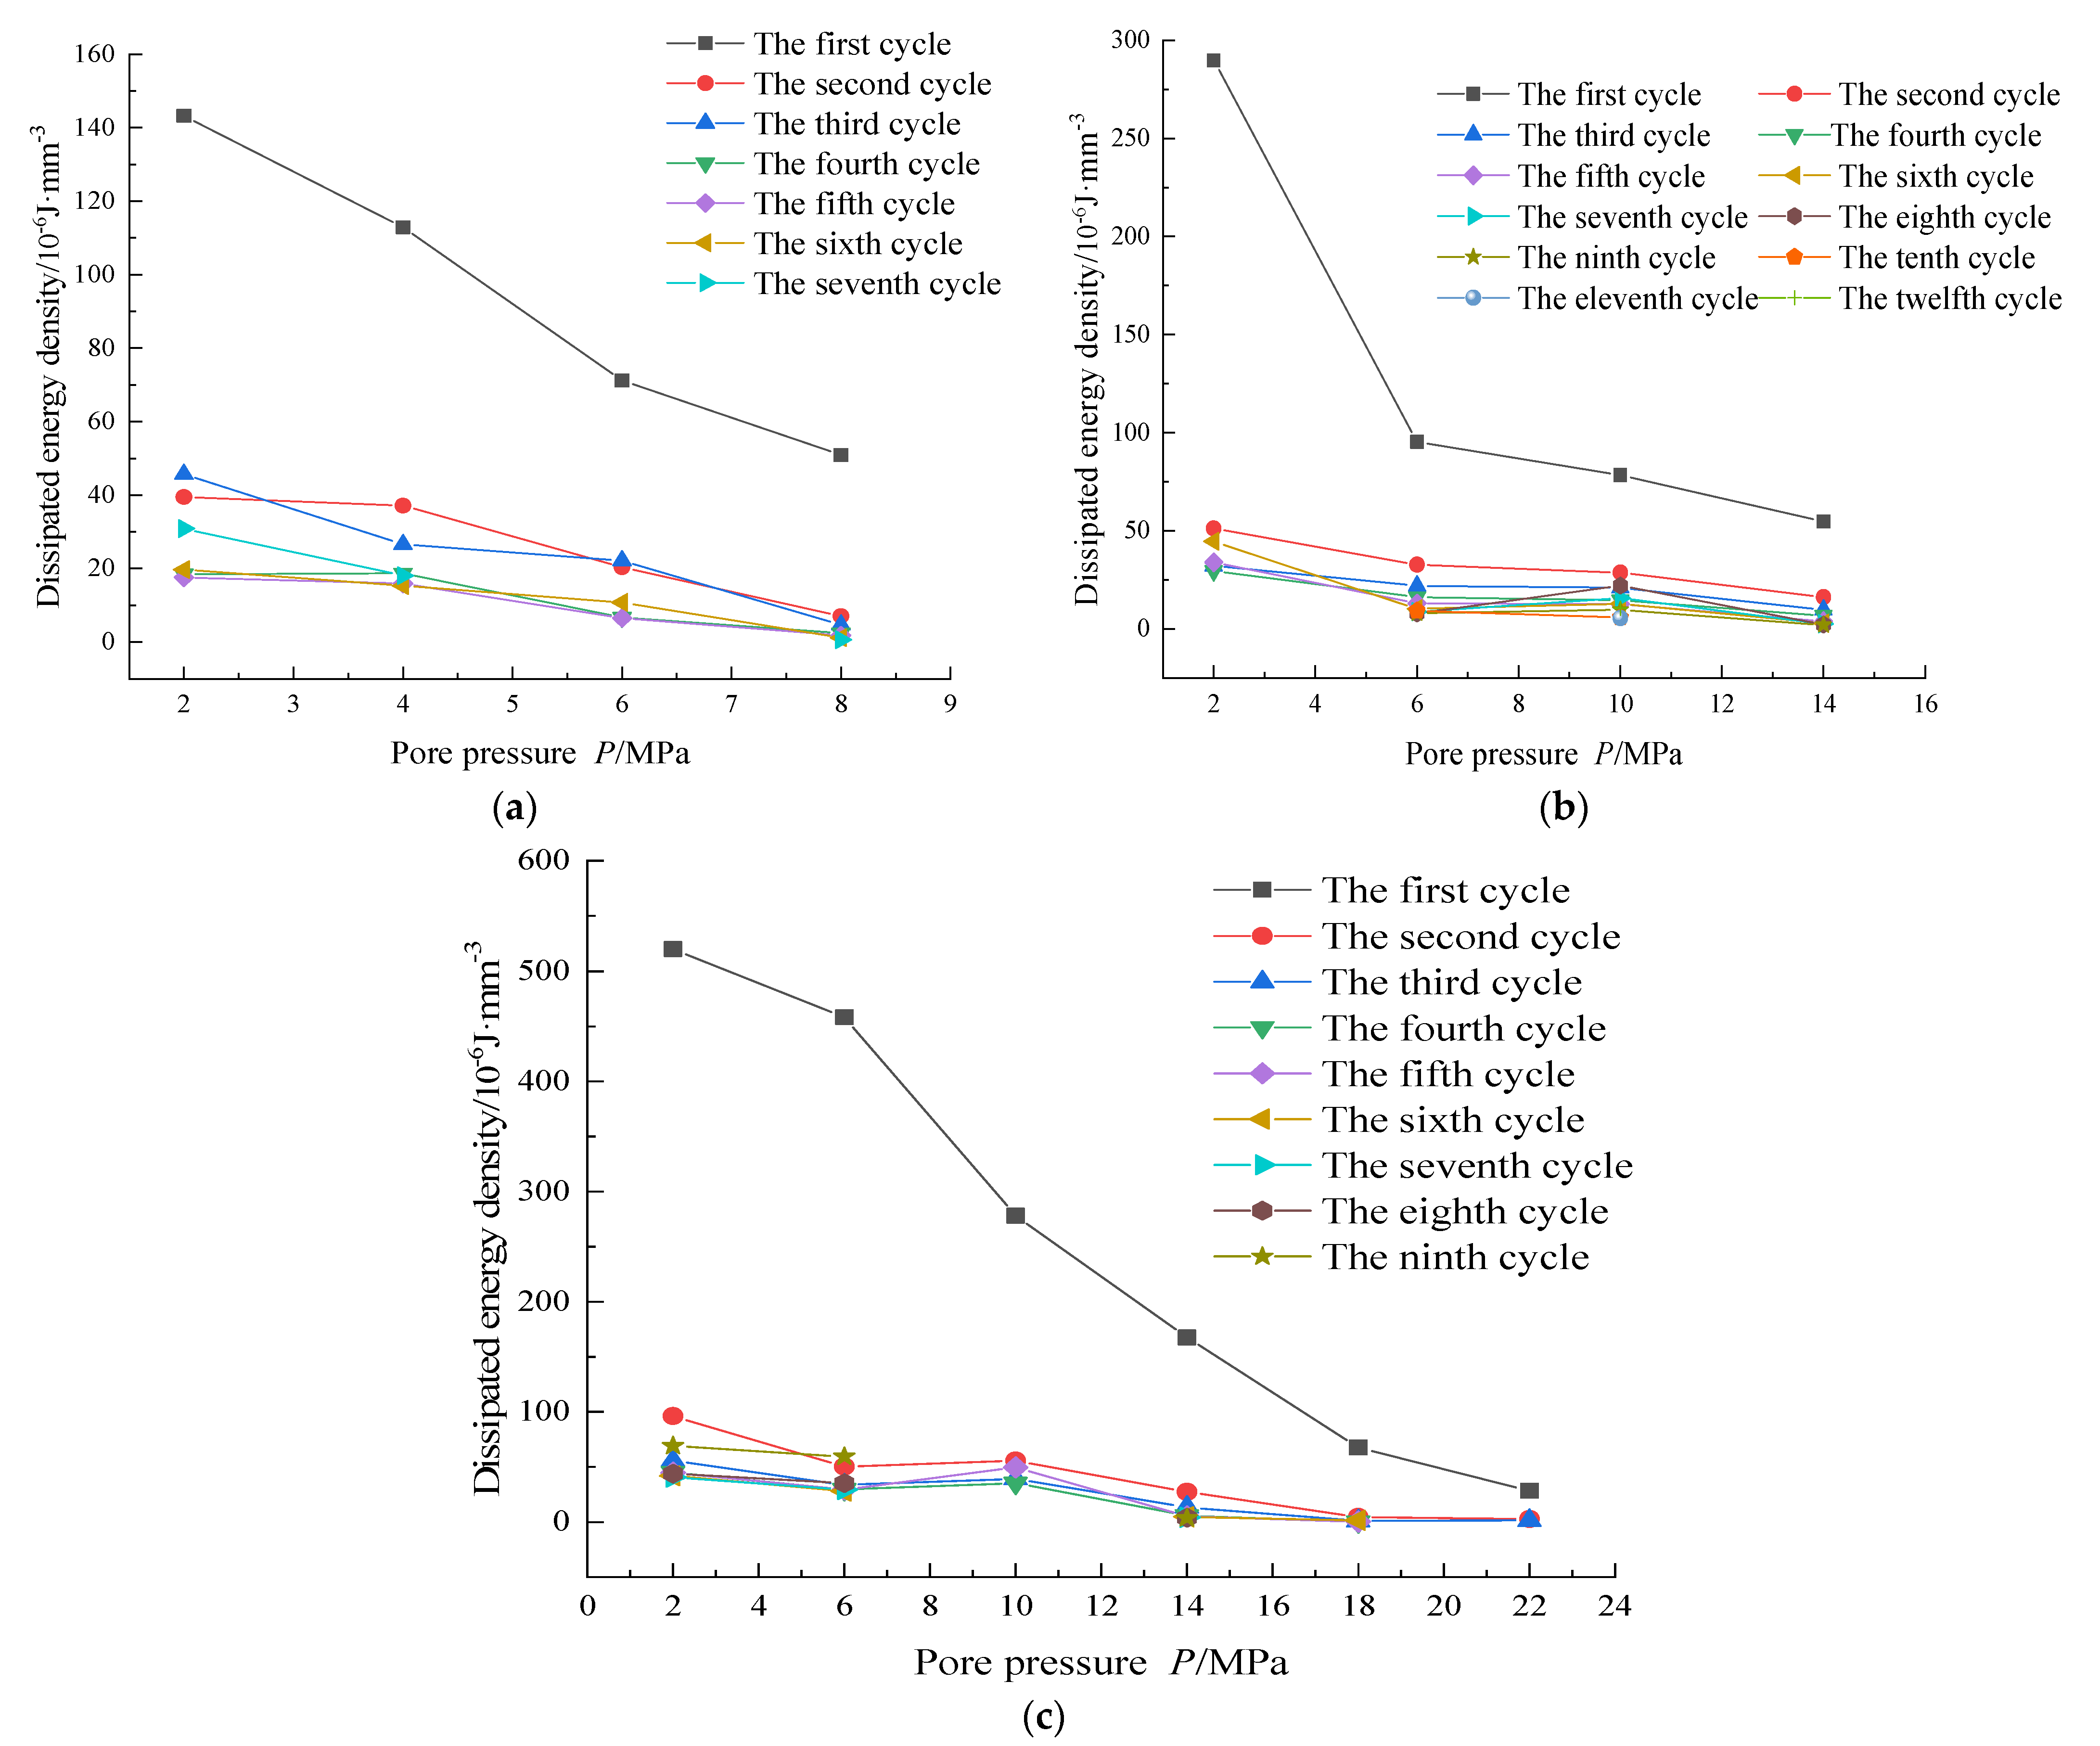
The elastic energy density of the specimen decreases as the number of cycles (axial strain) increases. This implies that with each subsequent cycle of loading and unloading, the specimen exhibits a decrease in its elastic energy storage capacity. Furthermore, the total input energy density and dissipation energy density of the specimen follow a similar trend. As the number of cycles (axial strain) increases, both the total input energy density and the dissipation energy density decrease. However, it is noted that after a certain point, both energy densities tend to stabilize.
(2)
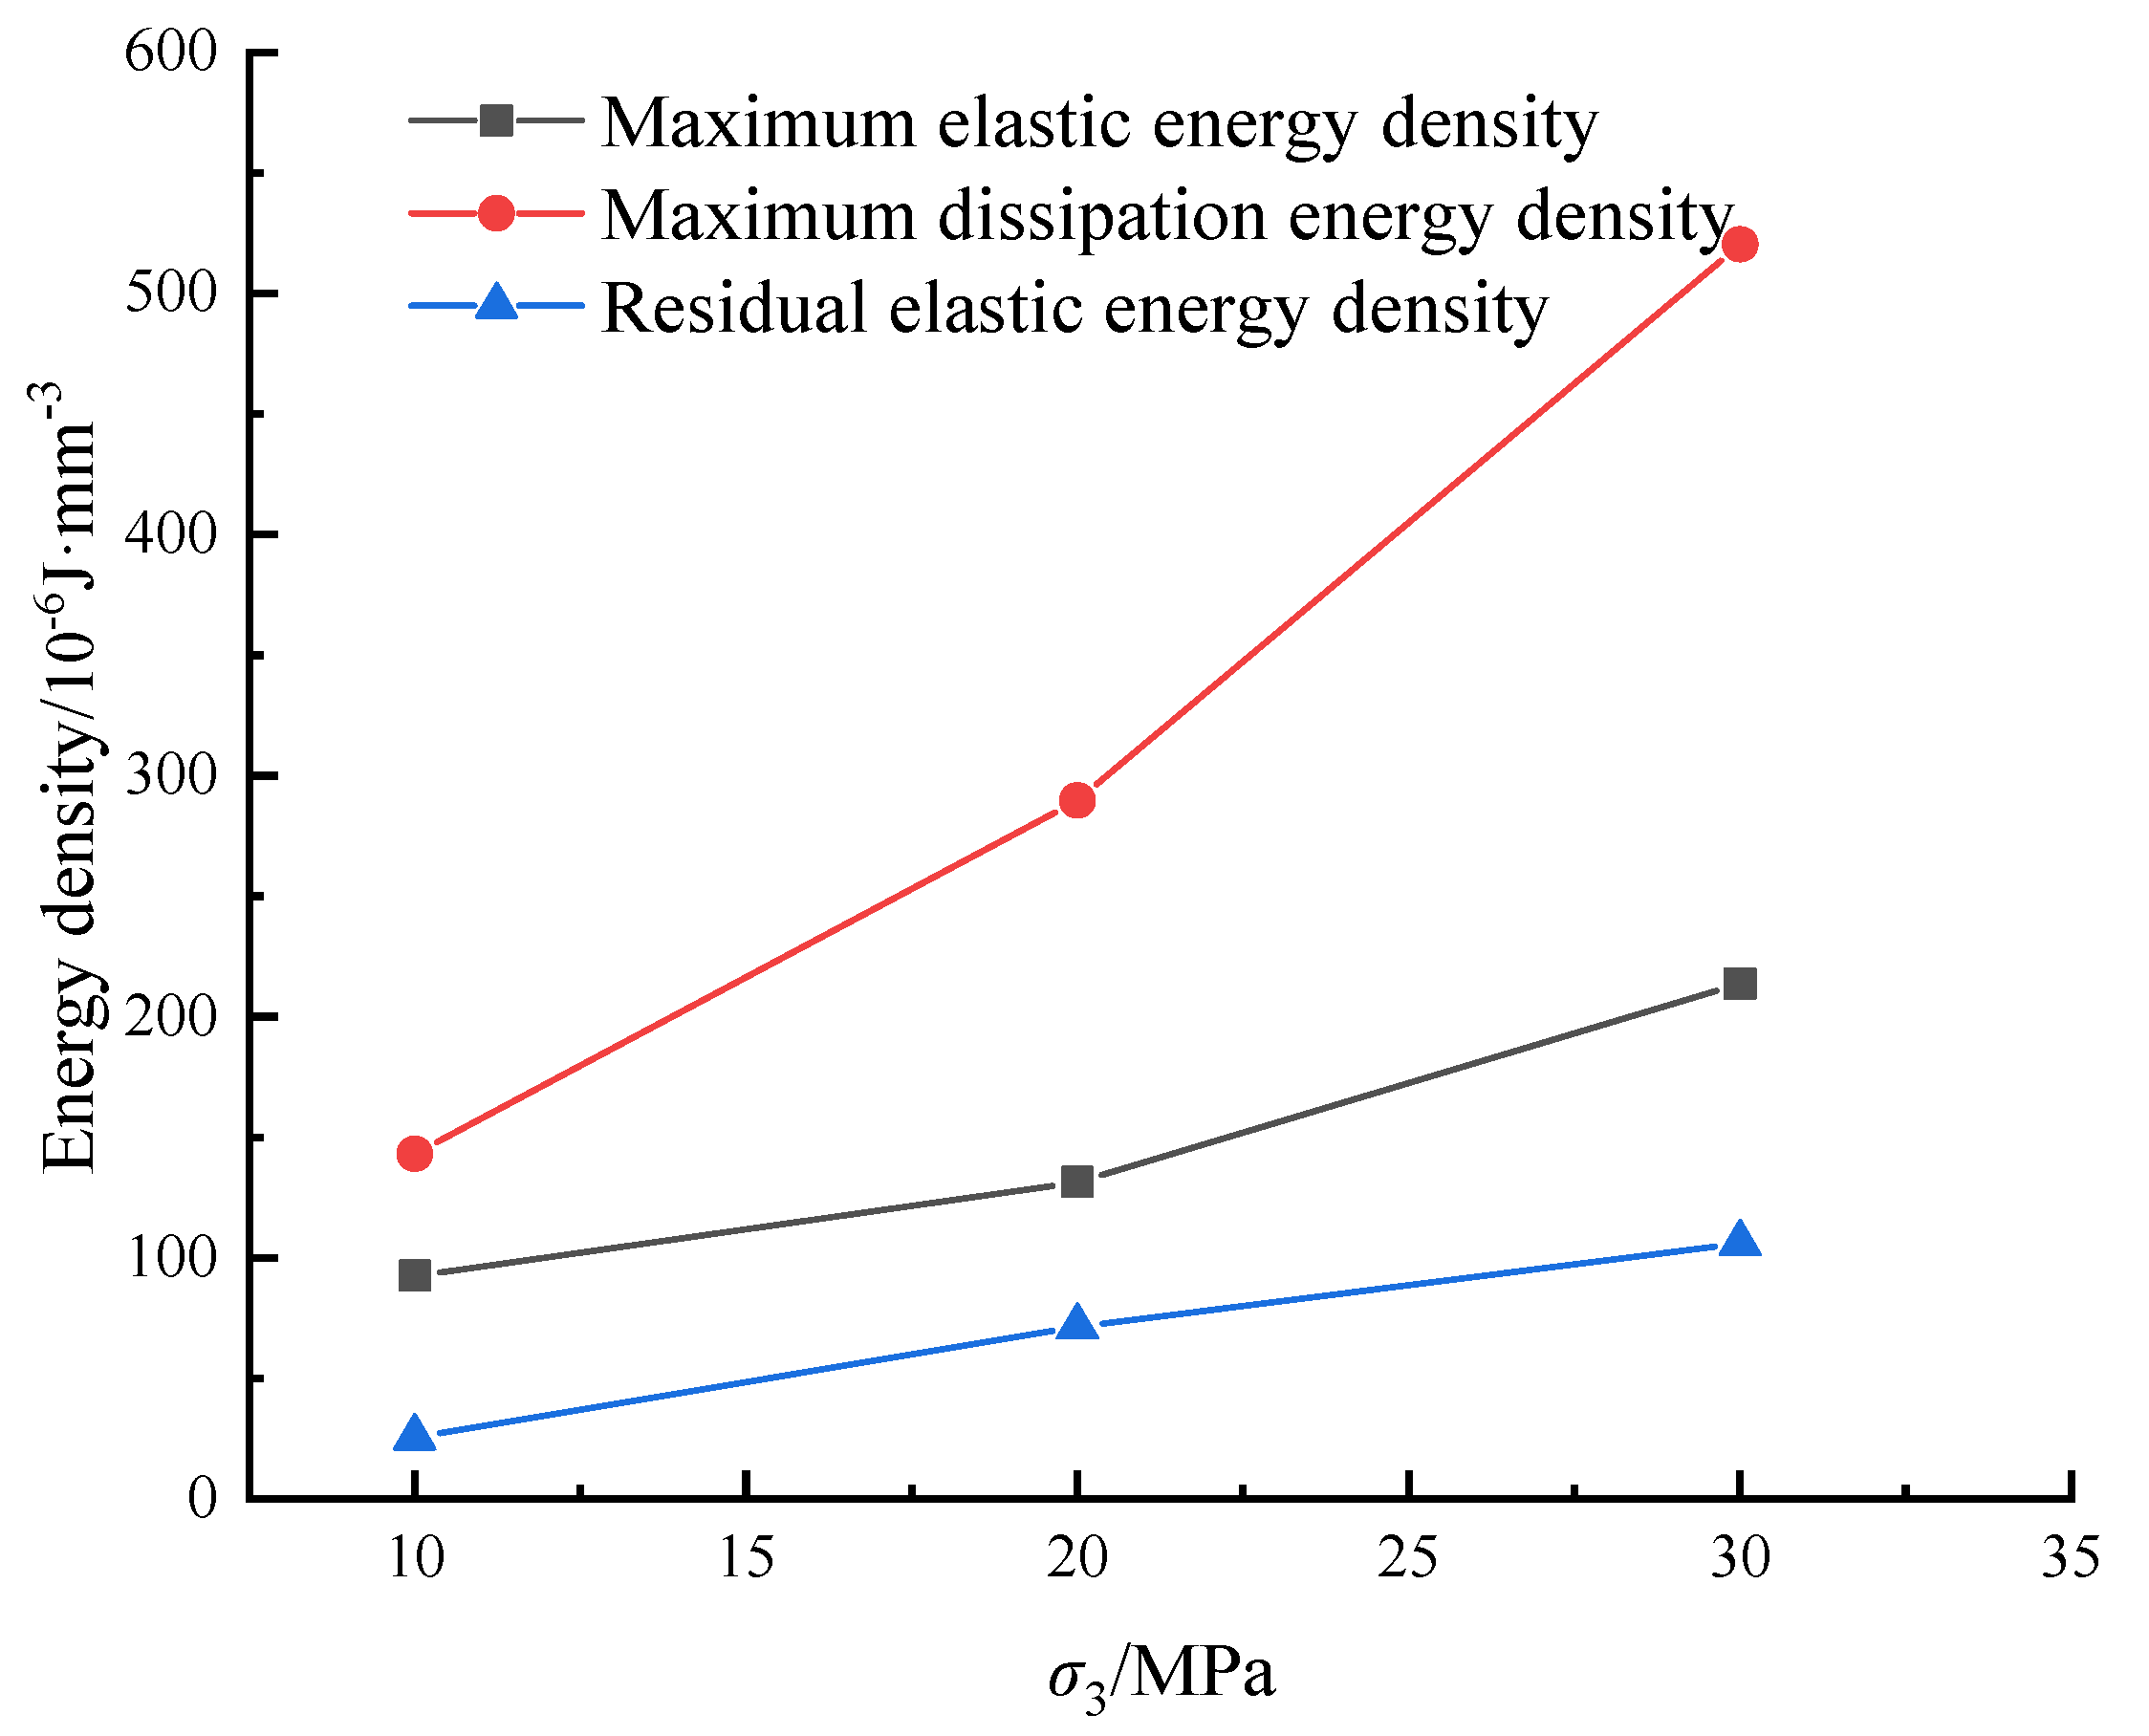
With the increase in confining pressure, the maximum and residual elastic energy densities of the rock increase gradually. Confining pressure inhibits the release of elastic energy.
(3)
The maximum dissipated energy density of the rock is positively correlated with confining pressure. As the confining pressure increases, the rate of increase in the maximum dissipated energy density gradually decreases. This suggests that confining pressure can inhibit the dissipation and release of rock energy.
(4)
Pore pressure can destroy the bearing structure of the rock and reduce the energy storage capacity of the rock. In situations where the confining pressure remains constant and the specimen undergoes the same number of cycles, there exists a negative correlation between pore pressure and the specimen’s total input energy density, elastic energy density, and dissipation energy density.
(5)
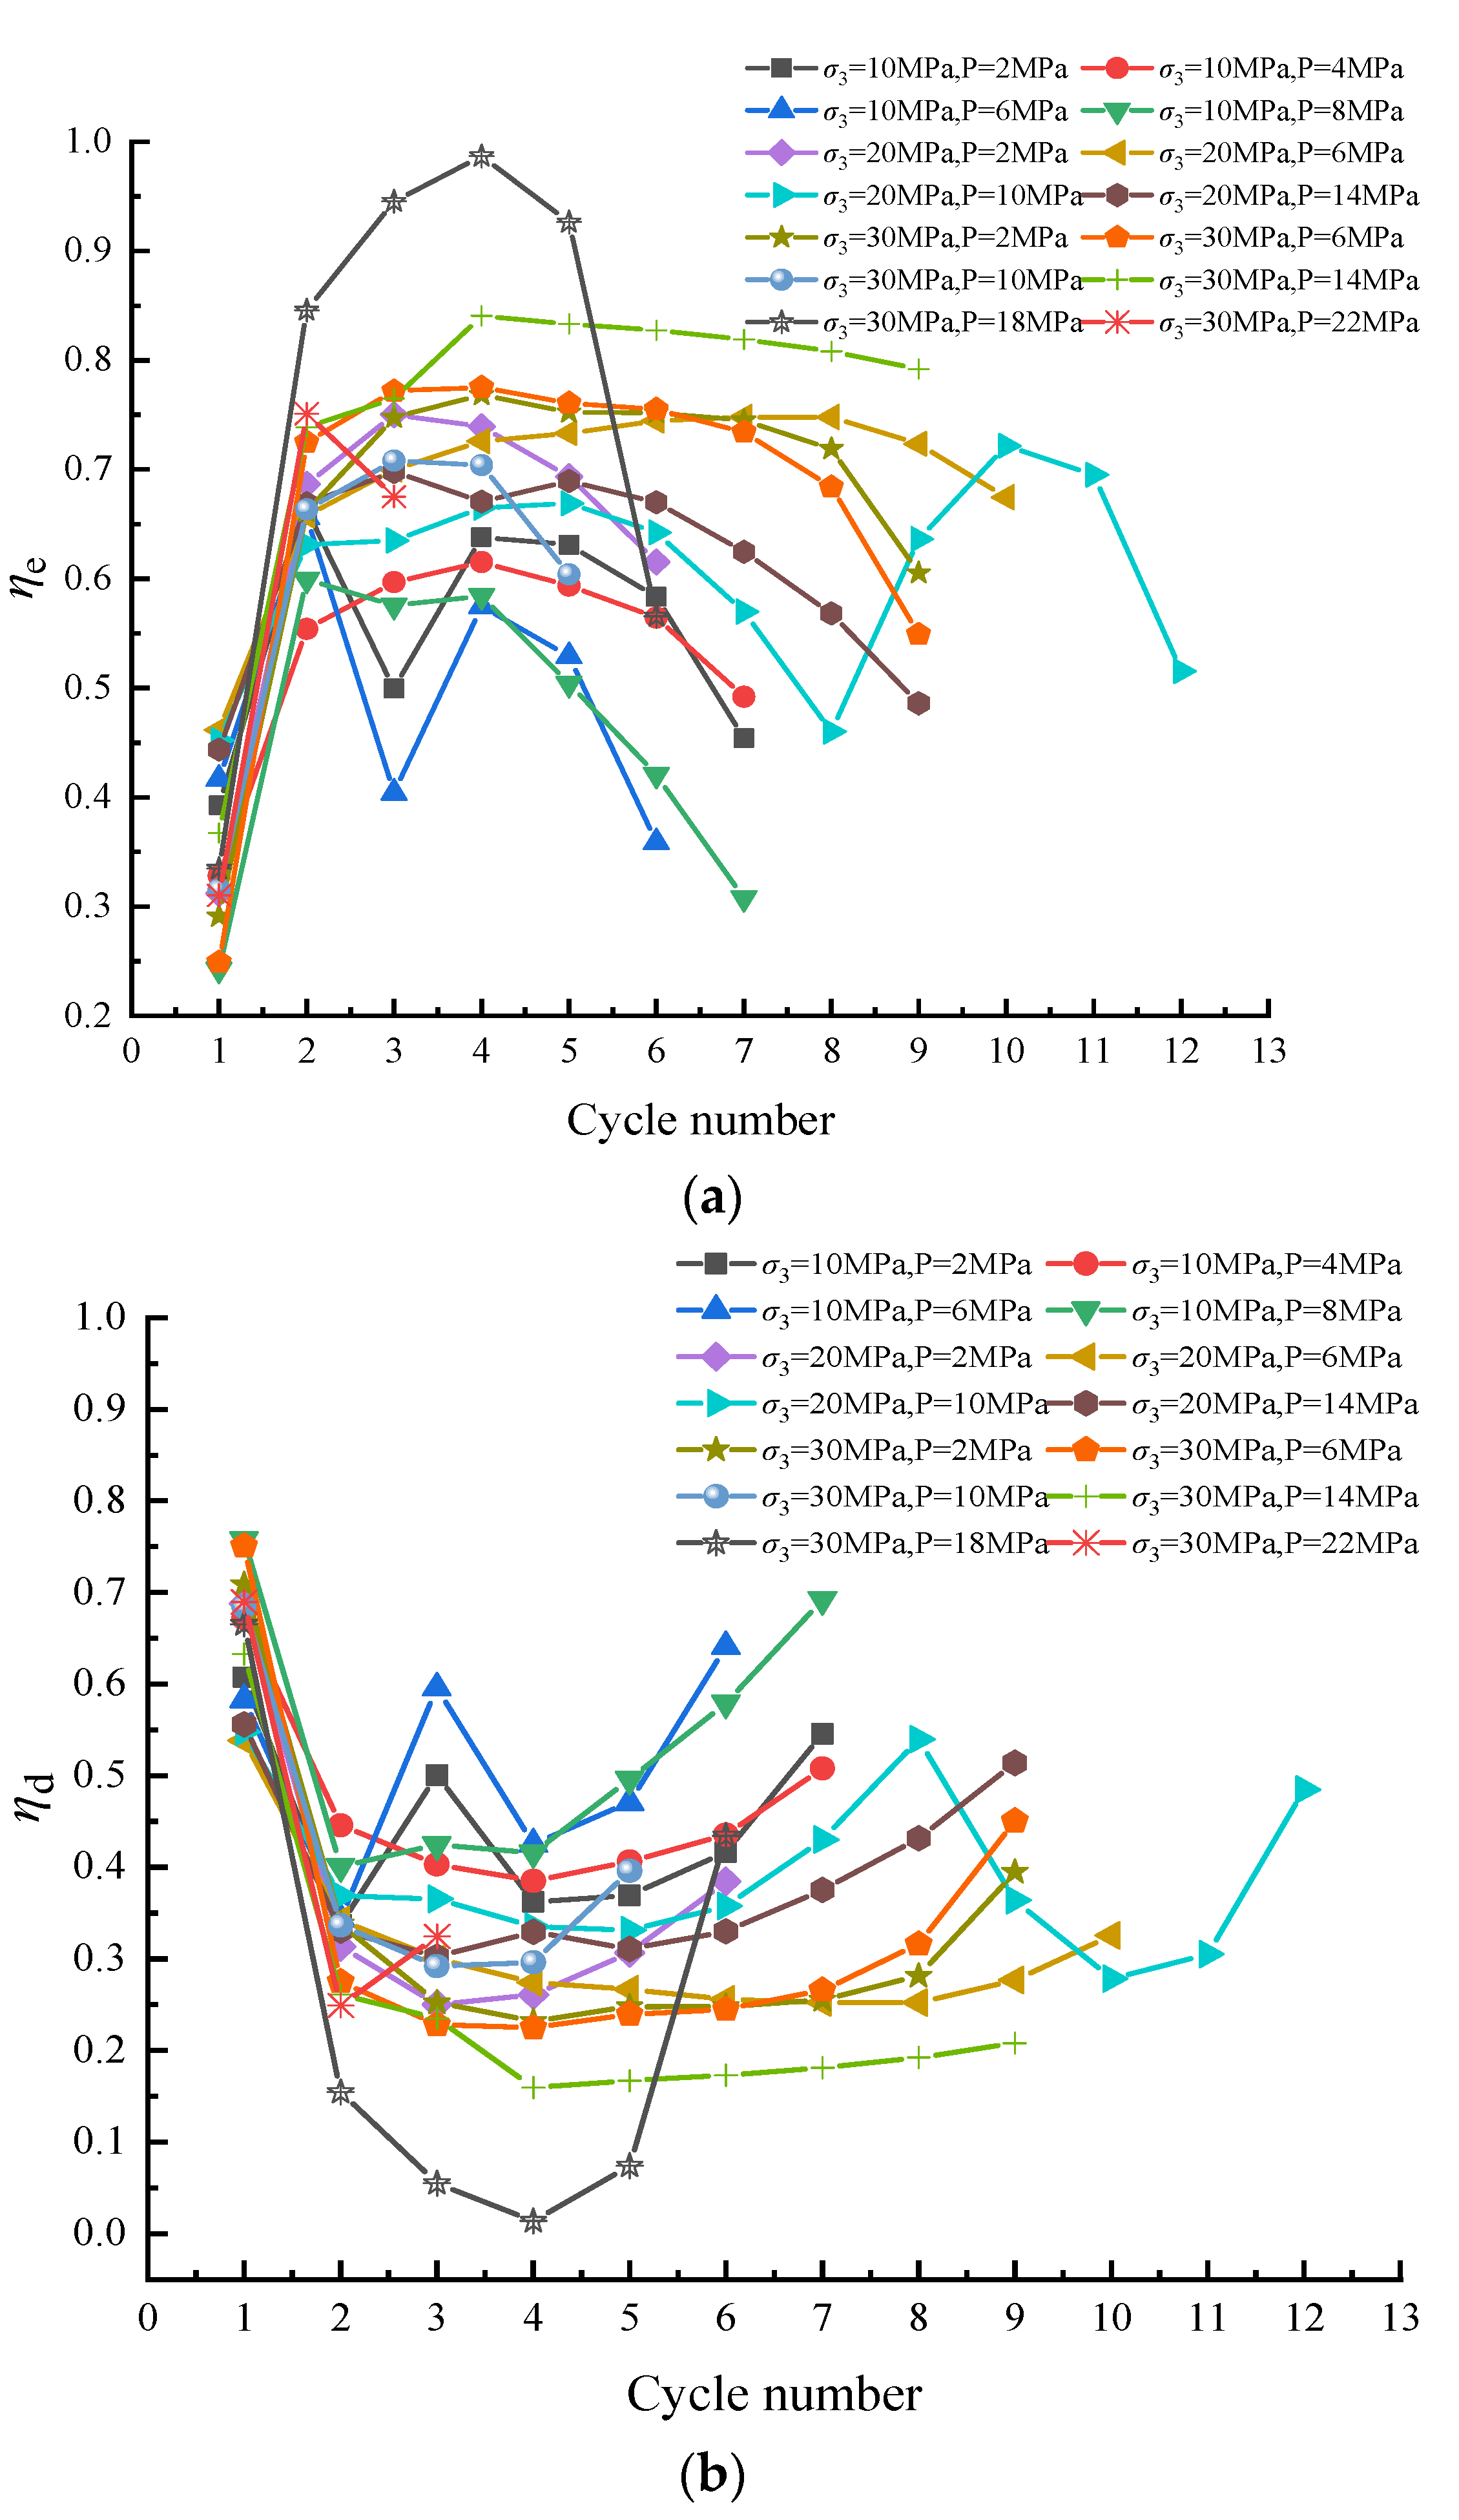
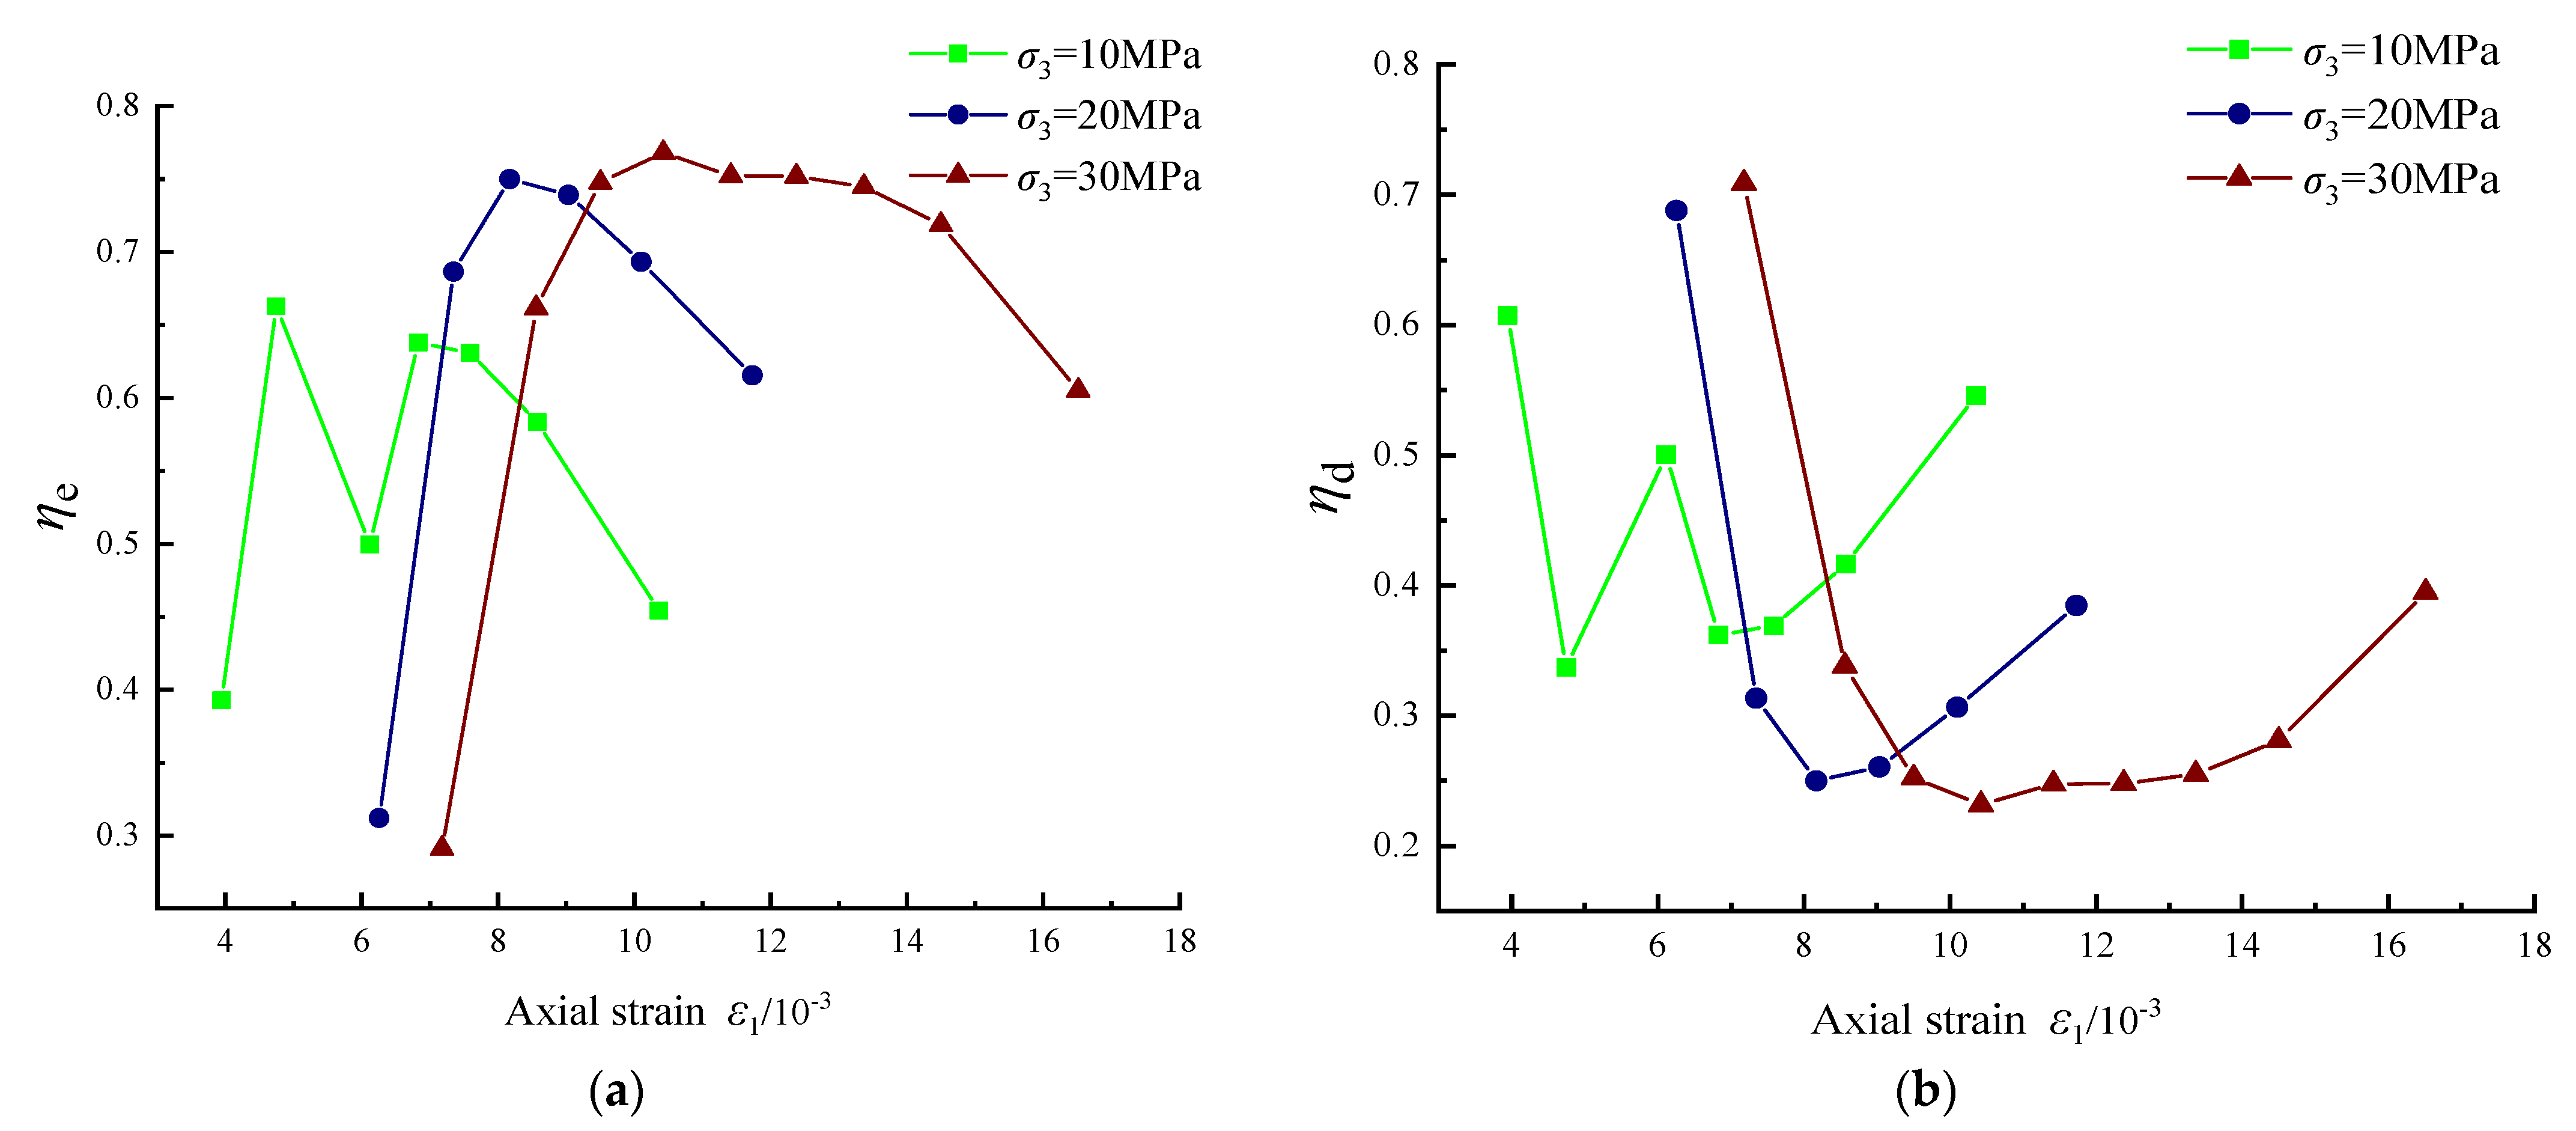
With the increase in the number of cycles (axial strain), the proportion of elastic energy initially rises and then declines, while the proportion of dissipated energy follows the opposite trend. Additionally, an increase in confining pressure can lead to a higher peak value of the proportion of elastic energy and promote energy accumulation after rock failure.
The findings of the study should be interpreted within the context of certain limitations. Firstly, the tests may have been conducted on a limited number of samples or specific types of rocks, which raises concerns about the representativeness of the results. Rock behavior in real-world scenarios exhibits substantial variability and complexity, which may not have been fully captured by the limited sample size or narrow rock types studied. Secondly, the tests were likely carried out at a laboratory scale, and it is important to consider potential scale effects. Rock behavior can differ significantly between laboratory-scale experiments and larger-scale field conditions. Therefore, further research involving a more diverse range of rock samples and larger-scale testing is necessary to enhance the generalizability and applicability of the study’s conclusions.

Author Contributions

Methodology and funding acquisition, Y.Z. (Yingjie Zhang) and Y.Z. (Yanlin Zhao); software, Y.Z. (Yingjie Zhang) and Q.L.; data curation and formal analysis, Y.Z. (Yingjie Zhang) and Y.L.; visualization, Q.L. and Y.L.; supervision, Y.Z. (Yanlin Zhao) and H.L. All authors have read and agreed to the published version of the manuscript.

Funding

This research was funded by the National Natural Science Foundation of China (No. 52274118) and the Postgraduate Scientific Research Innovation Project of Hunan Province (CX20221042). All authors have read and agreed to the published version of the manuscript.

Institutional Review Board Statement

Not applicable.

Data Availability Statement

The datasets generated during and/or analyzed during the current study are available from the corresponding author on reasonable request.

Conflicts of Interest

The authors declare no conflict of interest.

References

  1. Zhao, Y.; Liu, J.; Zhang, C.; Zhang, H.; Liao, J.; Zhu, S.; Zhang, L. Mechanical behavior of sandstone during post-peak cyclic loading and unloading under hydromechanical coupling. Int. J. Min. Sci. Technol. 2023, 33, 927–947. [Google Scholar] [CrossRef]
  2. Dai, S.; Gong, Y.; Wang, F.; Hu, P. Experimental Study on Influential Factors of Shale Permeability Based on the Gas Pulse Decay Method. Fresenius Environ. Bull. 2019, 28, 6307–6313. [Google Scholar]
  3. Xu, J.; Yang, H.; Li, S.; Jiang, Y. Experimental study of effects of cyclic loading and unloading pore water pressures on deformation characteristic of sandstone. Chin. J. Rock Mech. Eng. 2009, 28, 892–899. [Google Scholar]
  4. Yang, H.; Xu, J.; Nie, W.; Peng, S. Experimental study on creep of rocks under step loading of seepage pressure. Chin. J. Geotech. Eng. 2015, 37, 1613–1619. [Google Scholar]
  5. Liu, Y.; Li, X.; Tu, Y.; Lu, Y. Mining Leachates Effect on the Hydraulic Performance of Geosynthetic Clay Liners under Different Temperatures. Water 2023, 15, 1132. [Google Scholar] [CrossRef]
  6. Pan, Y.-H.; Qi, J.-R.; Zhang, J.-F.; Peng, Y.-X.; Chen, C.; Ma, H.-N.; Ye, C. A comparative study on steady-state water inflow into a circular underwater tunnel with an excavation damage zone. Water 2022, 14, 3154. [Google Scholar] [CrossRef]
  7. Xue, T.; Xue, X.; Long, S.; Chen, Q.; Lu, S.; Zeng, C. Effect of Pre-Existing Underground Structures on Groundwater Flow and Strata Movement Induced by Dewatering and Excavation. Water 2023, 15, 814. [Google Scholar] [CrossRef]
  8. Li, T.; Chen, Z.; Chen, G.; Ma, C.; Tang, O.; Wang, M. An experimental study of energy mechanism of sandstone with different moisture contents. Rock Soil Mech. 2015, 36, 229–236. [Google Scholar]
  9. Peng, Y.; Liu, G.; Wu, L.; Zuo, Q.; Liu, Y.; Zhang, C. Comparative study on tunnel blast-induced vibration for the underground cavern group. Environ. Earth Sci. 2021, 80, 68. [Google Scholar] [CrossRef]
  10. Zhang, J.; Yang, F.; Zhang, R.; He, J.; Xie, Y.; Miao, Z.; Zhang, J. Experimental Research on Coal Seam Structure and Gas Occurrence Influencing Factors in Weijiadi Mine China. Fresenius Environ. Bull. 2022, 31, 74–80. [Google Scholar]
  11. Zhang, Z.; Gao, F. Confining pressure effect on rock energy. Chin. J. Rock Mech. Eng. 2015, 34, 1–11. [Google Scholar]
  12. Liu, X.-X.; Li, Y.; Fan, Z.-J.; Li, S.-N.; Wang, W.-W.; Dong, P. Energy evolution and failure characteristics of single fissure carbonaceous shale under drying−wetting cycles. Rock Soil Mech. 2022, 43, 1. [Google Scholar]
  13. Chen, Z.; He, C.; Wu, D.; Gan, L.; Xu, G.; Yang, W. Mechanical properties and energy damage evolution mechanism of deep-buried carbonaceous phyllite. Rock Soil Mech. 2018, 39, 445–456. [Google Scholar]
  14. Qin, T.; Duan, Y.; Sun, H.; Wang, L.; Liu, H. Mechanical characteristics and energy dissipation characteristics of sandstone under triaxial stress conditions. J. China Coal Soc. 2020, 45, 255–262. [Google Scholar]
  15. Liu, G.; Li, Y.; Xiao, F.; Huang, S.; Zhang, R. Study on failure mechanics behavior and damage evolution law of yellow sandstone under uniaxial triaxial and pore water action. Chin. J. Rock Mech. Eng. 2019, 38, 3532–3544. [Google Scholar]
  16. Zhao, Y.; Tan, T.; Zhang, C.; Liu, Q.; Zhang, Y.; Wu, L.H. Mechanical properties and energy evolution and the applicability of strength criteria of sandstone under hydro-mechanical coupling. J. China Coal Soc. 2023, 48, 3323–3335. [Google Scholar]
  17. Liu, H.; Yang, X. Mechanical properties and energy evolution law behind sandstone under triaxial cyclic loading. J. Heilongjiang Univ. Sci. Technol. 2023, 33, 18–23+39. [Google Scholar]
  18. Meng, Q.; Wang, C.; Huang, B.; Pu, H.; Zhang, Z.; Sun, W.; Wang, J. Rock energy evolution and distribution law under triaxial cyclic loading and unloading conditions. Chin. J. Rock Mech. Eng. 2020, 39, 2047–2059. [Google Scholar]
  19. Yang, X.; Cheng, H.; Pei, Y. Study on the evolution characteristics of rock deformation and post-peak energy under different loading methods. Chin. J. Rock Mech. Eng. 2020, 39, 3229–3236. [Google Scholar]
  20. Lu, X.; Xu, J.; Ge, H.; Zhao, D.; Bai, E. Effects of confining pressure on mechanical behaviors of sandstone under dynamic impact loads. Chin. J. Rock Mech. Eng. 2010, 29, 193–201. [Google Scholar]
  21. Jing, W.; Xue, W.; Yao, Z. Variation of the internal friction angle and cohesion of the plastic softening zone rock in roadway surrounding rock. China Coal. Soc. 2018, 43, 2203–2210. [Google Scholar]
  22. Dai, S.; Gong, Y.; Wang, F.; Hu, P. Diagenesis evolution of tight sandstones in Chang 8 Member of Upper Triassic in the Xiasiwan area, Ordos Basin, China. Fresenius Environ. Bull. 2019, 28, 6275–6281. [Google Scholar]
  23. Yu, W.; Li, K.; Liu, Z.; An, B.; Wang, P.; Wu, H. Mechanical characteristics and deformation control of surrounding rock in weakly cemented siltstone. Environ. Earth Sci. 2021, 80, 337. [Google Scholar] [CrossRef]
  24. GB/T 23561.1-2009; Methods for Determining the Physical and Mechanical Properties of Coal and Rock—Part 1: General Requirements for Sampling. Chinese Standard: Beijing, China, 2009.
  25. Xie, H.; Peng, R.; Ju, Y. Energy dissipation of rock deformation and fracture. Chin. J. Rock Mech. Eng. 2004, 23, 3565–3570. [Google Scholar]
  26. Xie, H.-P.; Ju, Y.; Li, L.-Y. Criteria for strength and structural failure of rocks based on energy dissipation and energy release principles. Chin. J. Rock Mech. Eng. 2005, 24, 3003–3010. [Google Scholar]
  27. Dai, S.; Wang, F.; Gong, Y.; Hu, P. Application of Material Balance Equation in Productivity Analysis of Coalbed Methane Reservoir. Fresenius Environ. Bull. 2019, 28, 5605–5611. [Google Scholar]
  28. Xie, H.-P.; Peng, R.-D.; Ju, Y.; Zhou, H.-W. Energy analysis of rock failure. Chin. J. Rock Mech. Eng. 2005, 24, 2603–2608. [Google Scholar]
  29. Zhang, H.; He, Y.; Tang, C.; Ahmad, B.; Han, L. Application of an improved flow-stress-damage model to the criticality assessment of water inrush in a mine: A case study. Rock Mech. Rock Eng. 2009, 42, 911–930. [Google Scholar] [CrossRef]
  30. Xiao, F.-k.; Shen, Z.-L.; Liu, G.; Zhang, Z.; Zhang, F. Relationship between hysteresis loop and elastoplastic strain energy during cyclic loading and unloading. Chin. J. Rock Mech. Eng. 2014, 33, 1791–1797. [Google Scholar]
  31. Can, X.; Shu-chen, L.; Yang, P.; Jing-long, L.; Shu-cai, L. Study of nonlinear damage characteristics and numerical simulation of post-peak fractured rock mass. Rock Soil Mech. 2017, 38, 2128–2136. [Google Scholar]
  32. Hamiel, Y.; Lyakhovsky, V.; Agnon, A. Rock dilation, nonlinear deformation, and pore pressure change under shear. Earth Planet. Sci. Lett. 2005, 237, 577–589. [Google Scholar] [CrossRef]
  33. Zhou, H.; Wang, Z.; Ren, W.; Liu, Z.; Liu, J. Acoustic emission based mechanical behaviors of Beishan granite under conventional triaxial compression and hydro-mechanical coupling tests. Int. J. Rock Mech. Min. Sci. 2019, 123, 104125. [Google Scholar] [CrossRef]
  34. Yang, D.; Hu, J.; Qin, Y. Hydro-mechanical coupling of granite with micro-defects: Insights into underground energy storage. Alex. Eng. J. 2022, 61, 7213–7220. [Google Scholar] [CrossRef]
  35. Li, F.; You, S.; Ji, H.-g.; Elmo, D.; Wang, H.-t. Strength and energy exchange of deep sandstone under high hydraulic conditions. J. Cent. South Univ. 2020, 27, 3053–3062. [Google Scholar] [CrossRef]
  36. Ma, J.; Chen, J.; Chen, W.; Huang, L. A coupled thermal-elastic-plastic-damage model for concrete subjected to dynamic loading. Int. J. Plast. 2022, 153, 103279. [Google Scholar] [CrossRef]
  37. Ma, J.; Zhao, J.; Lin, Y.; Liang, J.; Chen, J.; Chen, W.; Huang, L. Study on Tamped Spherical Detonation-Induced Dynamic Responses of Rock and PMMA Through Mini-chemical Explosion Tests and a Four-Dimensional Lattice Spring Model. Rock Mech. Rock Eng. 2023, 56, 7357–7375. [Google Scholar] [CrossRef]
Figure 1. Standard sandstone specimens.
Sustainability 16 00024 g001
Figure 2. MTS815 rock mechanics test system: (a) testing apparatus; (b) specimen installation diagram.
Sustainability 16 00024 g002
Figure 3. Schematic diagram of the test loading process.
Sustainability 16 00024 g003
Figure 4. Schematic diagram of energy density calculation under cyclic loading and unloading.
Sustainability 16 00024 g004
Figure 5. The stress–strain curves of cyclic loading and unloading under confining pressure of 10 MPa and various pore pressures: (a) P = 2 MPa; (b) P = 4 MPa; (c) P = 6 MPa; (d) P = 8 MPa.
Sustainability 16 00024 g005
Figure 6. The stress–strain curves of cyclic loading and unloading under confining pressure of 20 MPa and various pore pressures: (a) P = 2 MPa; (b) P = 6 MPa; (c) P = 10 MPa; (d) P = 14 MPa.
Sustainability 16 00024 g006
Figure 7. The stress–strain curves of cyclic loading and unloading under confining pressure of 30 MPa and various pore pressures: (a) P = 2 MPa; (b) P = 6 MPa; (c) P = 10 MPa; (d) P = 14 MPa; (e) P = 18 MPa; (f) P = 22 MPa.
Sustainability 16 00024 g007aSustainability 16 00024 g007b
Figure 8. (a) The relationship curves of cycle number–total input energy density; (b) the relationship curves of cycle number–elastic energy density; (c) the relationship curves of cycle number–dissipative energy density.
Sustainability 16 00024 g008
Figure 9. Axial strain–energy density relationship curves: (a) σ 3 = 10 MPa; (b) σ 3 = 20 MPa; (c) σ 3 = 30 MPa.
Sustainability 16 00024 g009
Figure 10. Evolution curves of rock energy density under different confining pressures: (a) total input energy density–axial strain relationship curves; (b) elastic energy density–axial strain relationship curves; (c) dissipative energy density–axial strain relationship curves.
Sustainability 16 00024 g010
Figure 11. The relationship between the maximum elastic energy density of sandstone and confining pressure, the maximum dissipated energy density of sandstone and confining pressure, and the relationship between the residual elastic energy density of sandstone and confining pressure.
Sustainability 16 00024 g011
Figure 12. The variation curves of total input energy density with pore pressure for the same number of cycles of sandstone: (a) σ 3 = 10 MPa; (b) σ 3 = 20 MPa; (c) σ 3 = 30 MPa.
Sustainability 16 00024 g012
Figure 13. The variation curves of elastic energy density with pore pressure for the same number of cycles of sandstone: (a) σ 3 = 10 MPa; (b) σ 3 = 20 MPa; (c) σ 3 = 30 MPa.
Sustainability 16 00024 g013
Figure 14. The variation curves of dissipated energy density with pore pressure for the same number of cycles of sandstone: (a) σ 3 = 10 MPa; (b) σ 3 = 20 MPa; (c) σ 3 = 30 MPa.
Sustainability 16 00024 g014
Figure 15. Evolution curves of elastic energy ratio and dissipation energy ratio of sandstone: (a) elastic energy ratio–cycle number relationship curves; (b) dissipative energy ratio–cycle number relationship curves.
Sustainability 16 00024 g015
Figure 16. The evolution curves of elastic energy ratio and dissipated energy ratio of sandstone at P = 2 MPa: (a) elastic energy ratio–axial strain relationship curves; (b) dissipative energy ratio–axial strain relationship curves.
Sustainability 16 00024 g016
Figure 17. Failure pattern under 10 MPa confining pressure: (a) P = 2 MPa; (b) P = 4 MPa; (c) P = 6 MPa; (d) P = 8 MPa.
Sustainability 16 00024 g017
Figure 18. Failure pattern under 20 MPa confining pressure: (a) P = 2 MPa; (b) P = 6 MPa; (c) P = 10 MPa; (d) P = 14 MPa.
Sustainability 16 00024 g018
Figure 19. Failure pattern under 30 MPa confining pressure: (a) P = 2 MPa; (b) P = 6 MPa; (c) P = 10 MPa; (d) P = 14 MPa; (e) P = 18 MPa; (f) P = 22 MPa.
Sustainability 16 00024 g019
Disclaimer/Publisher’s Note: The statements, opinions and data contained in all publications are solely those of the individual author(s) and contributor(s) and not of MDPI and/or the editor(s). MDPI and/or the editor(s) disclaim responsibility for any injury to people or property resulting from any ideas, methods, instructions or products referred to in the content.

