Article

Regional Differences and Influencing Factors of Green Innovation Efficiency in China’s 285 Cities

1
School of Economics and Management, Qingdao University of Science and Technology, Qingdao 266061, China
2
School of Mathematical Sciences, Ocean University of China, Qingdao 266100, China
*
Author to whom correspondence should be addressed.
Sustainability 2024, 16(1), 334; https://doi.org/10.3390/su16010334
Submission received: 19 September 2023 / Revised: 18 November 2023 / Accepted: 7 December 2023 / Published: 29 December 2023
(This article belongs to the Section Sustainable Products and Services)

Abstract

:
Green innovation is an important concept of high-quality development to achieve resource conservation and ecological protection. To explore whether there is an imbalance in the development of green innovation in China and find the reasons for this phenomenon, it is of vital importance to investigate the regional differences of green innovation efficiency (GIE) and its influencing factors. Many scholars have studied the performance of green innovation from the efficiency perspective but concentrated on provincial-level analysis and lacked heterogeneity analysis of the influencing factors. To fill this gap, this study explores the regional differences of GIE of 285 prefecture-level and above cities in China during the period 2003–2019, and then employs the spatial error model (SEM) to explore the heterogeneity of influencing factors. The results show that: (1) The GIE in China and its three regions underwent an overall increasing process, revealing regional heterogeneity, with most efficient cities agglomerated in the Eastern region. (2) The spatial difference of GIE in China was narrowing, and the within-region Gini coefficient in the three regions presented a similar trend. Between-region difference contributed the largest to the regional differences, especially between the Central and Western regions. The kernel density estimation results showed that GIE presents significant spatial characteristic of polarization. (3) The SEM model analysis indicated that economic development, government motivation, industrial structure, financial support, and population scale affected GIE profoundly in China, and there was significant spatial heterogeneity in the impact of each influencing factor. Western cities were mainly driven by governmental support in green innovation, while Eastern and Central cities were driven by economic development and improved industrial structure.

1. Introduction

China has made great technical advancements and witnessed economic growth since the introduction of the reform and opening-up strategy in 1978. China’s gross domestic product (GDP at current prices), which exceeded USD 18 trillion in 2022, made it the second-largest economy in the world. Meanwhile, China is the world’s biggest energy user, and the low efficiency of energy consumption has led to significant pollution [1,2]. According to the 2022 Environmental Performance Index (EPI) published by Yale University, China’s score ranked 160 among 180 listed entries, indicating the extent of its ecological devastation and the tension between economic development and environmental sustainability. Faced with the pressure of environmental pollution and resource waste, China must resolve the dilemma between the economy and environment by exploring a feasible path of green development. Most developing countries facing current or potential industrial development should also pay attention to the coordination of economic growth and environmental preservation.
With the goal of promoting harmonious economic and environmental development, the Chinese government has implemented a high-quality development strategy centered on “innovation” as the key driving force [3]. As a kind of technological innovation containing the concept of green development, green innovation has become a strong impetus for coordinated development between the economy and environment [4]. Specifically, as an innovation activity, green innovation aims to provide green products [5], improve green processes [6], and strengthen green consciousness, thus achieving the goal of the harmonious development of economic growth and environmental preservation. The Organization for Economic Co-operation and Development (OECD) has emphasized that pursuing environmental efficiency is the goal of green innovation. The core intention of green innovation is to increase the efficiency of resource consumption while decreasing undesirable environmental outputs via technological innovation. Therefore, we use green innovation efficiency (GIE) to imply the green innovation of China.
GIE has become a widely used indicator in evaluating the performance of green innovation from the input and output perspectives. Compared with traditional innovation efficiency analysis, GIE takes the environmental externalities into account, attempting to maximize innovation output at the lowest resource cost [7], which is consistent with the concept of global sustainable development. Focused on resource and environmental sustainability, GIE provides the quantitative evidence associated with the allocation of resources and improvement of environmental efficiency to the policy makers in China and other developing states with similar development patterns, offering important support to formulate policies that can optimize resource allocation and promote green transformation [8]. Based on the above, it is crucial to evaluate the current development status and explore the influencing factors of GIE in China.
Due to natural and social endowments, the level of economic development, industrial structure, technological facilities, and population scale vary among the different regions in China. Large cities, especially those located in the East, have the advantages of fast development of technological innovation. To promote a balance in development among regions, the Chinese government has implemented various strategies. Based on the above, it is critical to address the following questions: How is the GIE of each city measured in the three regions of China? Are there differences in GIE among the three regions? Have the differences among the three regions narrowed or not? What factors influence the GIE in China? And is there any heterogeneity in the impact of these factors among the three regions? We used panel data of 285 Chinese prefecture-level and above cities from 2003 to 2019 and employed a super efficiency SBM-DEA model with undesirable outputs to measure the GIE of each city. To further discover the spatial characteristic of GIE, we used the Gini coefficient decomposition and kernel density estimation (KDE) methods to analyze the differences in GIE among the whole of China and its three regions. Finally, the influencing factors of GIE were investigated using a spatial error model (SEM). Accordingly, policy implications for improving the balanced development of GIE in China are presented.
Compared with previous related research, this study makes contributions in the following areas. First, we measured the GIE at the prefecture level and adopted the super-efficiency SBM model with undesirable outputs, thus, expanding the research method in measuring GIE by integrating the unexpected environmental output into the analytical framework and further exploring the efficiency of the DMUs beyond the efficient frontier. Second, we combined the Gini coefficient decomposition and KDE methods, which are systematically and widely used in analyzing regional differences, to analyze the spatial characteristic of GIE in Chinese prefecture-level cities for the first time, illustrating the spatial characteristics of green innovation in more detail compared with previous provincial-level studies. Third, we introduced SEM to empirically study the influencing factors of GIE and tried to find the spatial heterogeneity of each factor in the three regions to provide differentiated policy implications, which is more in line with reality than just estimating the average impact of each variable on GIE.
The remaining article is as follows: Section 2 presents the relevant literature review. The methods and data resources are introduced in Section 3. Section 4 advances the empirical analysis results of the study. The discussion is presented in Section 5. Section 6 proposes the main conclusions and policy implications.

2. Literature Review

2.1. Measurement of GIE

Existing research has measured GIE mainly by using four types of methods, namely, the single index method, principal component analysis, stochastic frontier analysis (SFA), and data envelopment analysis (DEA). Given that DEA is applicative for non-parametric functions with multi-inputs and multi-outputs, more and more scholars adopted the DEA model to measure GIE. Luo [9] used the Malmquist–DEA model to measure the GIE of China’s strategic emerging industries and found that technological progress has a positive effect on green innovation. Li [10] employed the super efficiency SBM model to evaluate GIE based on the panel data of China’s 21 subdivided intensive pollution industries over the period from 2011 to 2015 and found that there are obvious gaps in GIE between the 21 selected industries. Zhao [11] used the undesirable SBM model to measure GIE based on provincial panel data from 2009 to 2017 in China and opined that the regional difference of GIE has narrowed. Zhao [12] used the minimum distance to strong efficient frontier (MinDS) model to measure the GIE of 30 Chinese provinces during the period 2000–2020 and recognized that regional differences and transvariation intensity are two primary sources of spatial differences in GIE. Wang [13] estimated China’s GIE at the prefecture city level using the GSE-EBM model and concluded that there is pronounced regional heterogeneity in the effect of factors such as population density, economic development, and industrial structure.

2.2. Regional Difference in GIE

Prior studies on the regional characteristics of GIE mainly explored the spatial correlation, regional difference, and dynamic evolution trend. GIE in China exhibits remarkable positive spatial correlation, as shown in a prior study that used the spatial auto-correlation method to identify the spatial correlation based on provincial panel data [11]. To evaluate regional differences, indicator observation [14], the Theil index [15], and Dagum’s Gini coefficient decomposition are three mainly used research methods. The indicator observation method can describe spatial differences visually, but it is not suitable for analysis that explains the sources of regional differences. Due to the use of the average value for calculation, the Theil index method ignores the distribution of sub-samples, which leads to a decrease in the accuracy of the results. Therefore, the Dagum’s Gini coefficient decomposition method has been widely adopted in measuring regional differences. Zhao [12] employed the Dagum’s Gini coefficient decomposition method to examine the regional difference of GIE and found that China’s GIE has shown an increasing trend with significant spatial differences among provinces. In terms of the dynamic evolution trend, KDE has been widely applied to describe the dynamic evolution trend and has been used in identifying the spatial pattern of green innovation. Wang [13] used the KDE method in analyzing the spatial-temporal characteristic of green innovation and found that China’s green innovation shows an upward trend, while the regional difference presents a polarization feature.

2.3. Influencing Factors of GIE

Prior studies have explored the influencing factors of GIE from different perspectives. Some scholars discussed the influencing factors from a market perspective. Seiford [16] found that an open market is conducive to promote technology exchange between developing countries and international markets, and promotes local enterprises’ investment in green innovation. Long [17] found that a systemic industrial structure provides the basis for collaborative innovation, and a reasonable industrial structure can optimize the resource allocation efficiency. Meanwhile, the role of governmental factors in enhancing GIE cannot be ignored. Liu [18] found that financial support, especially green financial support, has a remarkable impact on GIE. Fan [19] opined that innovation incentives, such as tax breaks, can lessen financial pressure on enterprises in the innovation process and can increase their motivation for green innovation. Zhang [20] found that environmental regulation has significant effects on GIE, and the impacts of various environmental regulations differ. Moreover, compared with traditional innovation behavior, green innovation has more stringent requirements for technical competence. Rennings [21] emphasized that investment in R&D and human resources can positively contribute to green innovation performance. Zhang [22] opined that social innovation capacity and human resources in R&D are key factors to gain technological and competitive advantages in the market, providing sufficient scientific and technological support for green innovation. Huang [23] held that opening high-speed railways can improve green innovation based on prefecture-level analysis in China’s Yangtze River Economic Belt.
In summary, prior studies have provided extensive insights for analysis of regional differences and influencing factors of GIE in China. However, it can be further improved to explore the regional differences and influencing factors of GIE, which can be summarized as follows. First, in terms of methodologies, prior studies mostly adopted SFA, EBM, and SBM models to measure GIE. However, given that GIE is a complex system with input, desirable output, and undesirable output, a super-efficiency SBM-DEA model with undesirable outputs was applied in this study in order to further discriminate the multiple efficient samples by taking the unexpected environmental outputs into account. Second, prior studies mostly focused on provincial analysis or a certain industry. Instead, we used the panel data of 285 selected prefecture-level and above cities during the period 2003–2019 to further analyze the spatial-temporal characteristic of GIE, since cities are differentiated in natural endowment, economic development path, and innovation-driven methods within certain provinces in China. Third, to find the heterogeneity of the influencing factors in the three regions and to provide reliable suggestions accordingly, we applied the SEM model to explore the influencing factors in the three regions.

3. Methods and Data

3.1. Methods

3.1.1. Super-Efficiency SBM-DEA Model with Undesirable Outputs

As a prominent frontier approach, DEA has been used widely in assessing efficiency. To further identify the multiple effective decision-making units (DMUs), Tone [24] constructed the SBM-DEA model with undesirable outputs to cope with waste in the output indicators. As a non-radical directional distance function, SBM-DEA with undesirable outputs allows undesirable outputs to vary at different rates from desirable outputs. Given environmental undesirable outputs are integrated into measuring GIE, and to further observe the differences of these efficient cities, we employed the super-efficiency SBM-DEA model with undesirable outputs to evaluate the GIE in the selected 285 cities. Suppose the number of DMUs and inputs are m and n, respectively; the desirable output is recorded as yr (r = 1, 2,⋯,s1) and the undesirable output is recorded as yt (t = 1, 2,⋯,s2). The super-efficiency SBM-DEA model with undesirable outputs can be set as follows:
m i n ρ = 1 + 1 n · i = 1 n s i x i k 1 1 s 1 + s 2 · r = 1 s 1 s r g + y r k g + t = 1 s 2 s t b y t k b s . t . x i k j = 1 , j k m x i j · λ j s i y r b g j = 1 , j k m y r i · λ j + s r g + y t k b j = 1 , j k m y t j b · λ j s t b 1 1 s 1 + s 2 r = 1 s 1 s r g + y r k g + t = 1 s 2 s t b y t k b > 0
Among them, i = 1, 2…, n; r = 1, 2…, s1; t = 1, 2…, s2; j = 1, 2…, m.
The ρ in Formula (1) represents the GIE of the DMU, s is the slack variable, and λ is the weight. The greater the ρ value, the higher the level of green innovation efficiency. If ρ is less than 1, the green innovation in that year is less efficient. On the contrary, if ρ   1 , the green innovation is efficient in that year.

3.1.2. Dagum’s Gini Coefficient Decomposition

We used the Dagum’s Gini coefficient decomposition to analyze the regional differences of GIE. Compared with the traditional Gini coefficient and Theil index, Dagum’s Gini coefficient can effectively solve the cross overlap problem between subgroups, effectively describing the contributions to the overall regional differences made from the net difference between regions [25]. The Dagum’s Gini coefficient decomposition can be expressed as follows:
G = j = 1 k h = 1 k i = 1 n j r = 1 n h y j i y h r / 2 n 2 y ¯
where G represents the overall Gini coefficient, nj and nh stands for the number of cities in region j and region h, yji (yhr) is the GIE value of city i(r) in region j(h), and y   ¯ is the average value of GIE in whole regions. The overall Gini coefficient is decomposed into Gw, Gnb, and Gt. Specifically, Gw is the within-region difference contribution, Gnb is the between-region difference contribution, and Gt is the intensity of transvariation. Each index is defined as follows:
P j = n j n S j = n j Y j ¯ n Y ¯ d j h = 0 d F j y 0 y y x d F h x p j h = 0 d F h y 0 y y x d F j x D j h = d j h p j h d j h + p j h G t j = i = 1 n j r = 1 n j y j i y j r / 2 n j 2 Y j ¯ G w = j = 1 k G t j · P j · S j G j h = i = 1 n j r = 1 n j y j i y j r / n j n h Y j ¯ + Y h ¯ G n b = j = 2 k h = 1 j 1 G j h p j s h + p h s j D j h G t = j = 2 k h = 1 j 1 G j h p j s h + p h s j 1 D j h
where Y j ¯ ( Y h ¯ ) is the average GIE value of region j(h), djh is the difference in gross GIE influence between regions j and h, and pjh is the first-order moment of transvariation.

3.1.3. Kernel Density Estimation

We introduced the kernel density estimation (KDE) to further explore the distribution characteristics of GIE in China and its three regions. As a non-parametric estimation method, KDE can avoid the errors which can be caused in the process of setting function forms subjectively and has been widely used to illustrate the distribution characteristics of random variables by using continuous density curves [26]. Meanwhile, KDE has significant advantages in investigating the dynamic evolution characteristics of geographical variables. Assuming that f(x) represents the density function of the random variable xi, the KDE method can be expressed as follows [27]:
f x = 1 n h i = 1 n K x i x / h
where x stands for the average value of GIE; n is the number of observed cities; K(.) represents the kernel function, and inspired by prior research, we selected the Gaussian kernel function in this study; and h is the bandwidth value that reflects the accuracy and smoothness of the estimation curve.

3.1.4. Spatial Auto-Correlation Method

In this study, the Global Moran’s I is used to identify the existence of a spatial correlation between cities in China during the period 2003–2019. Global Moran’s I was initially created to identify regional spatial correlation [28]. It has been widely used to identify whether the spatial distribution of geographical elements is a clustering model, a discrete model, or a random model. The formula is as follows:
I = n i = 1 n j = 1 n w i j ( x i x ¯ ) ( x j x ¯ ) i = 1 n j = 1 n w i j i = 1 n ( x i x ¯ ) 2
where I is a global auto-correlation index with a range of values [−1, 1]. When I is positive, it represents positive spatial auto-correlation. Conversely, when I is negative, it represents negative spatial auto-correlation. The smaller the difference between the absolute value of I and 0, the weaker the spatial correlation and the stronger the spatial randomness. xi is the variable attribute value of spatial position i, which is the GIE level in this study; n is the number of observations, which is the number of the samples; wij is the spatial weight matrix, that is, the spatial weight of spatial location i and j.

3.1.5. Spatial Econometric Model

Compared to the traditional ordinary least squares (OLS) model, spatial econometric models—including the spatial lag model (SLM), spatial error model (SEM), and spatial Durbin model (SDM)—integrate spatial correlation into estimation [29]. The spatial econometric model is detailed as follows:
y i t = ρ W y i t + β x i t + μ i + γ t + ε i t ε i t = λ ε i t + v i t
where yit is the independent variable; xit represents the dependent variable; W stands for the spatial weight matrix, and in this article, the spatial weight matrix based on geographical distance is selected due to the existence of geographical isolated cities; ui denotes the individual effect; γt represents the time effect; the εit and νit represent the stochastic errors, and their mean and variance value are both 0. When φ = 0 and λ ≠ 0, the spatial econometric model turned into the spatial lag model. When φ = 0 and ρ ≠ 0, the spatial econometric model turned into the spatial error model.

3.2. Variables Selection and Data Sources

Considering the consistency and availability of data, we selected 285 prefecture-level and above cities in China as observed samples in this study, covering the period 2003–2019. To further identify the regional characteristics of GIE, we divided these 285 cities into three regions, namely Eastern, Central, and Western (Figure 1).
To measure the GIE in these 285 cities, we first established a preliminary index system of GIE based on the principles of scientificity, comprehensiveness, objectivity, and data availability. Fully taking into account the connotation of GIE, and inspiration from previous research, we selected capital, labor, and energy as input variables. In terms of output variables, we selected economic development and technological progress as desirable outputs and environmental pollution as an undesirable output. Specific indicators are shown in Table 1.
In terms of influencing factors, considering the reality of the development of green innovation in China and following prior studies [13,17,30], we selected economic development level, governmental motivation, financial support, industrial structure, and population scale to explain the estimated GIE level in the 285 selected cities. Due to the availability and objectivity of the data, the economic development level is described as GDP; governmental motivation is measured as general government expenditure; financial support is measured as the loans from financial institutions; industrial structure is calculated as the ratio of tertiary industry to secondary industry (RTS); and population scale is measured as urban population. Specifically, the natural logarithm of GDP(LnGDP), general government expenditure (LnLGE), financial institutions (LnLFI), and population scale (LnPOP) are used in the regressive analysis.
All the original data of the above variables were collected from the China City Statistical Yearbook, the Statistical Yearbook of each province, and the statistical bulletin of the national economic and social development of each city.

4. Results and Discussions

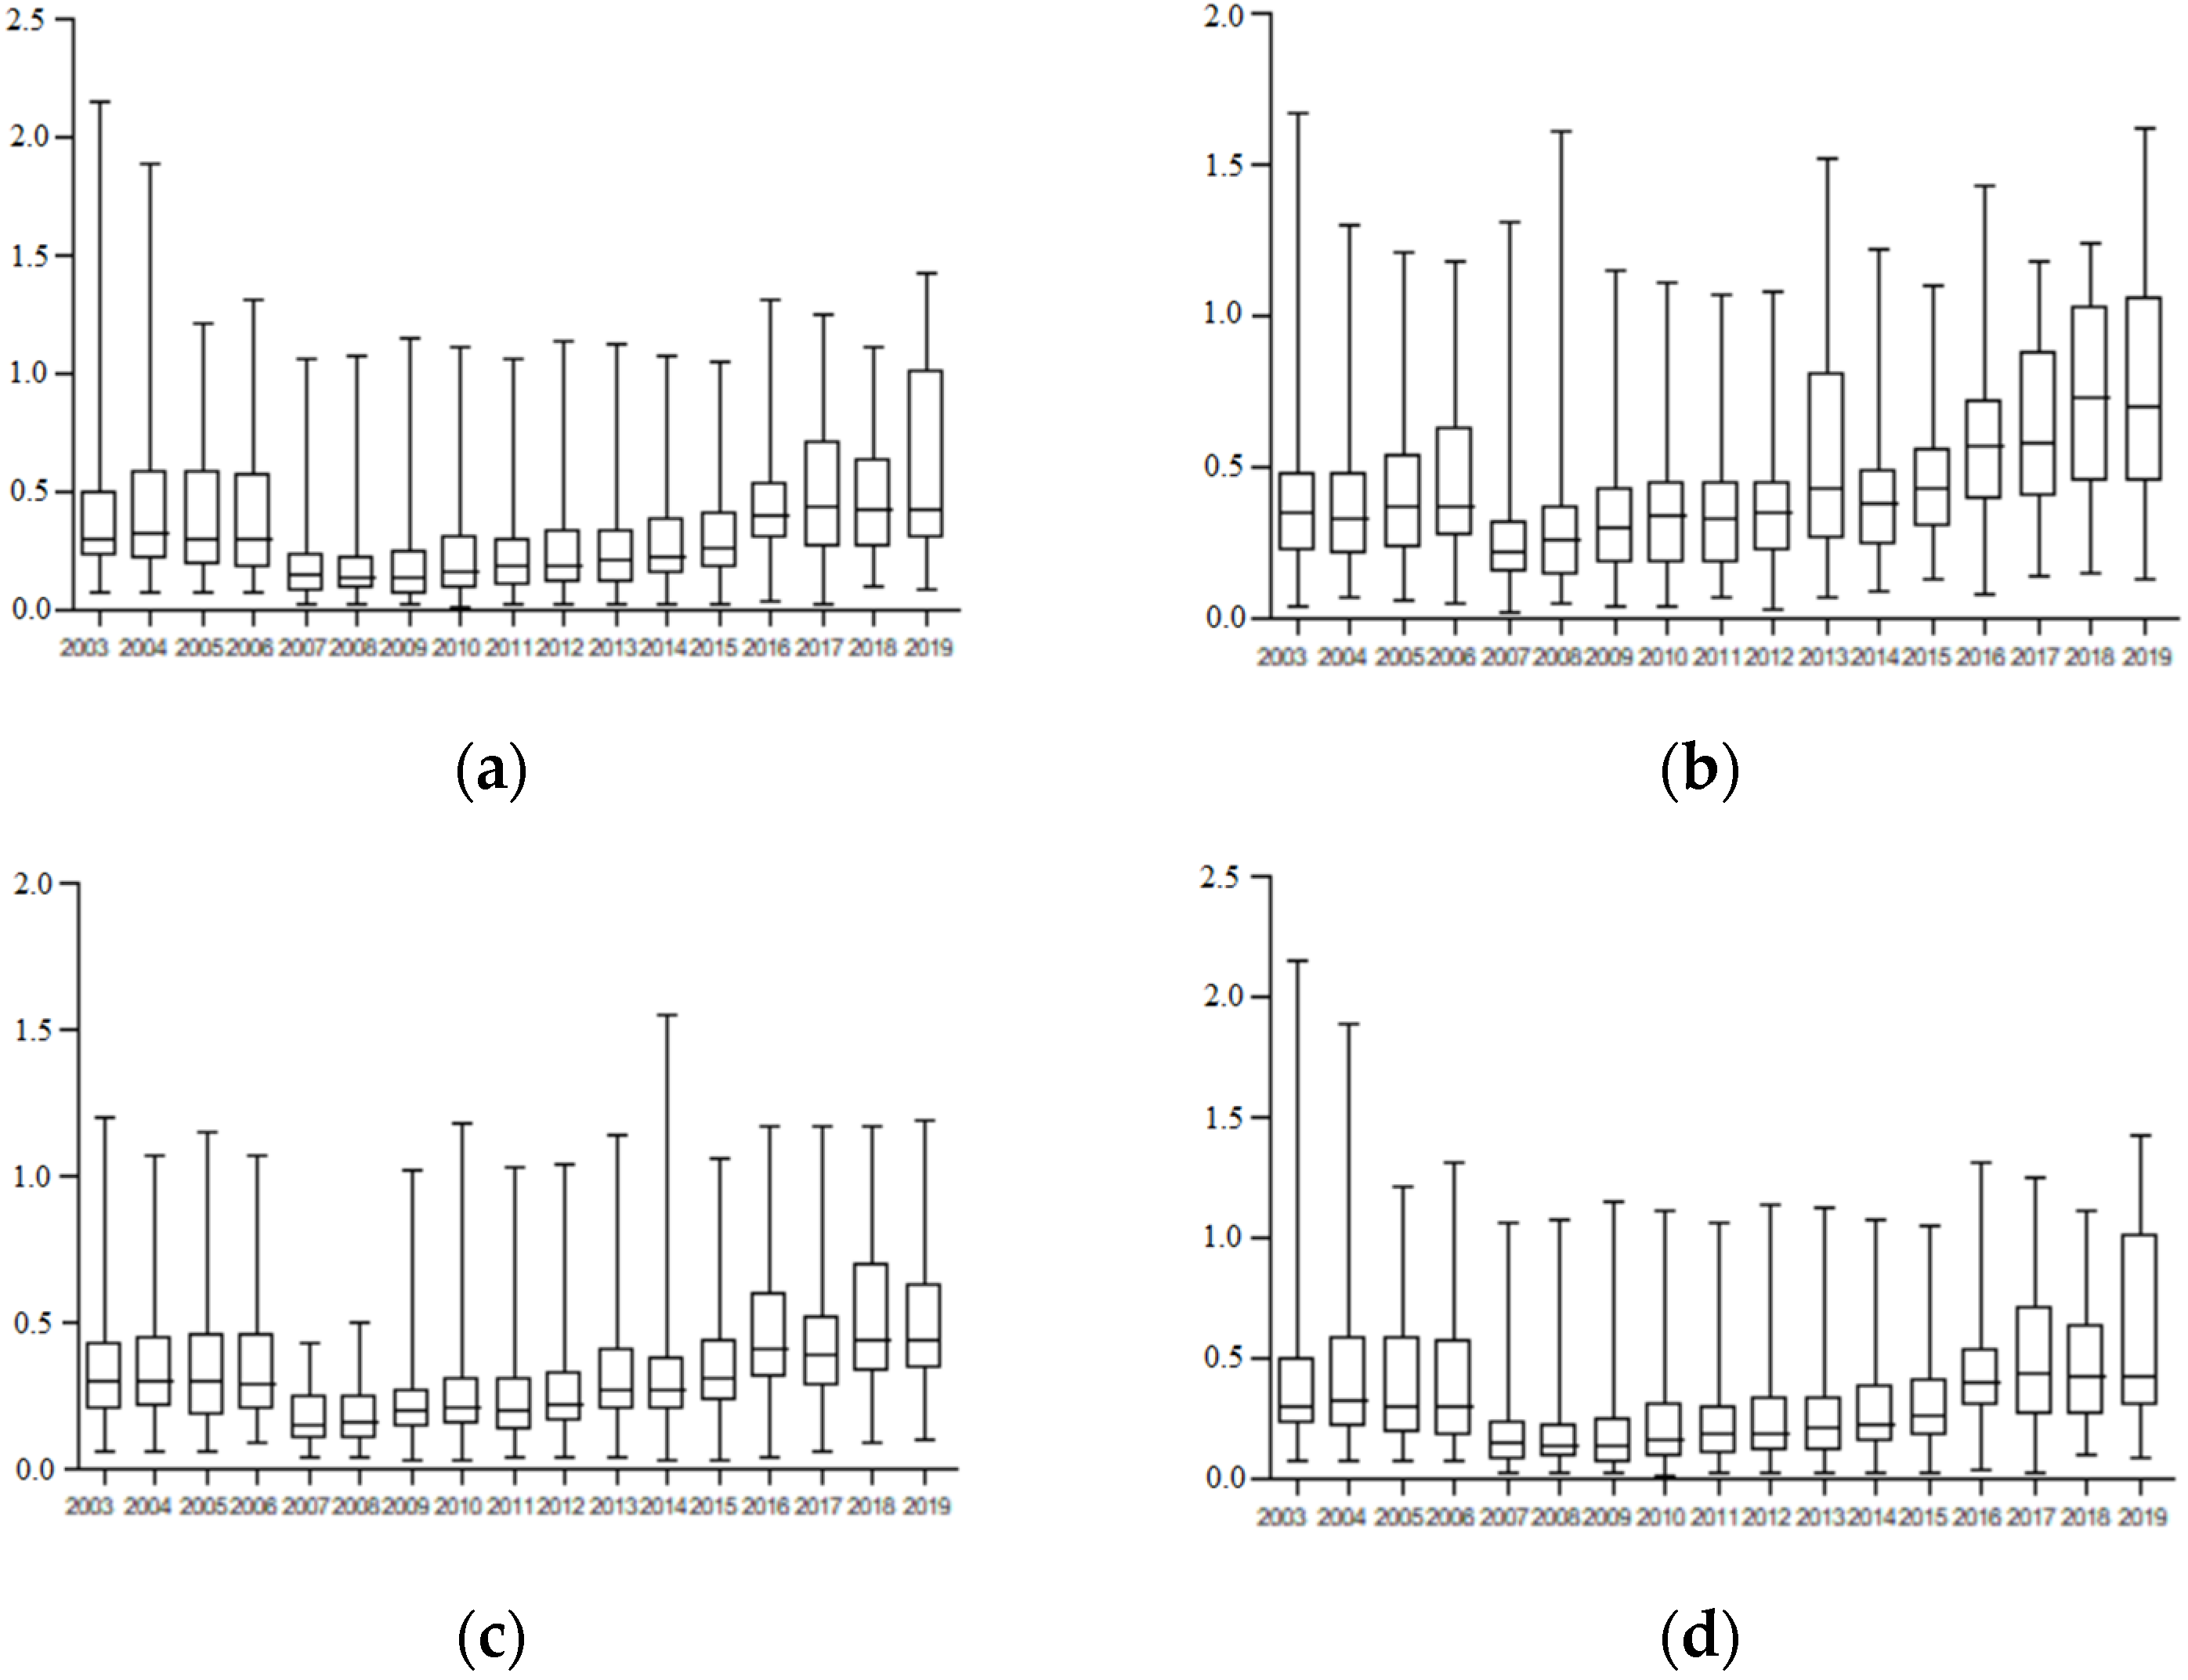
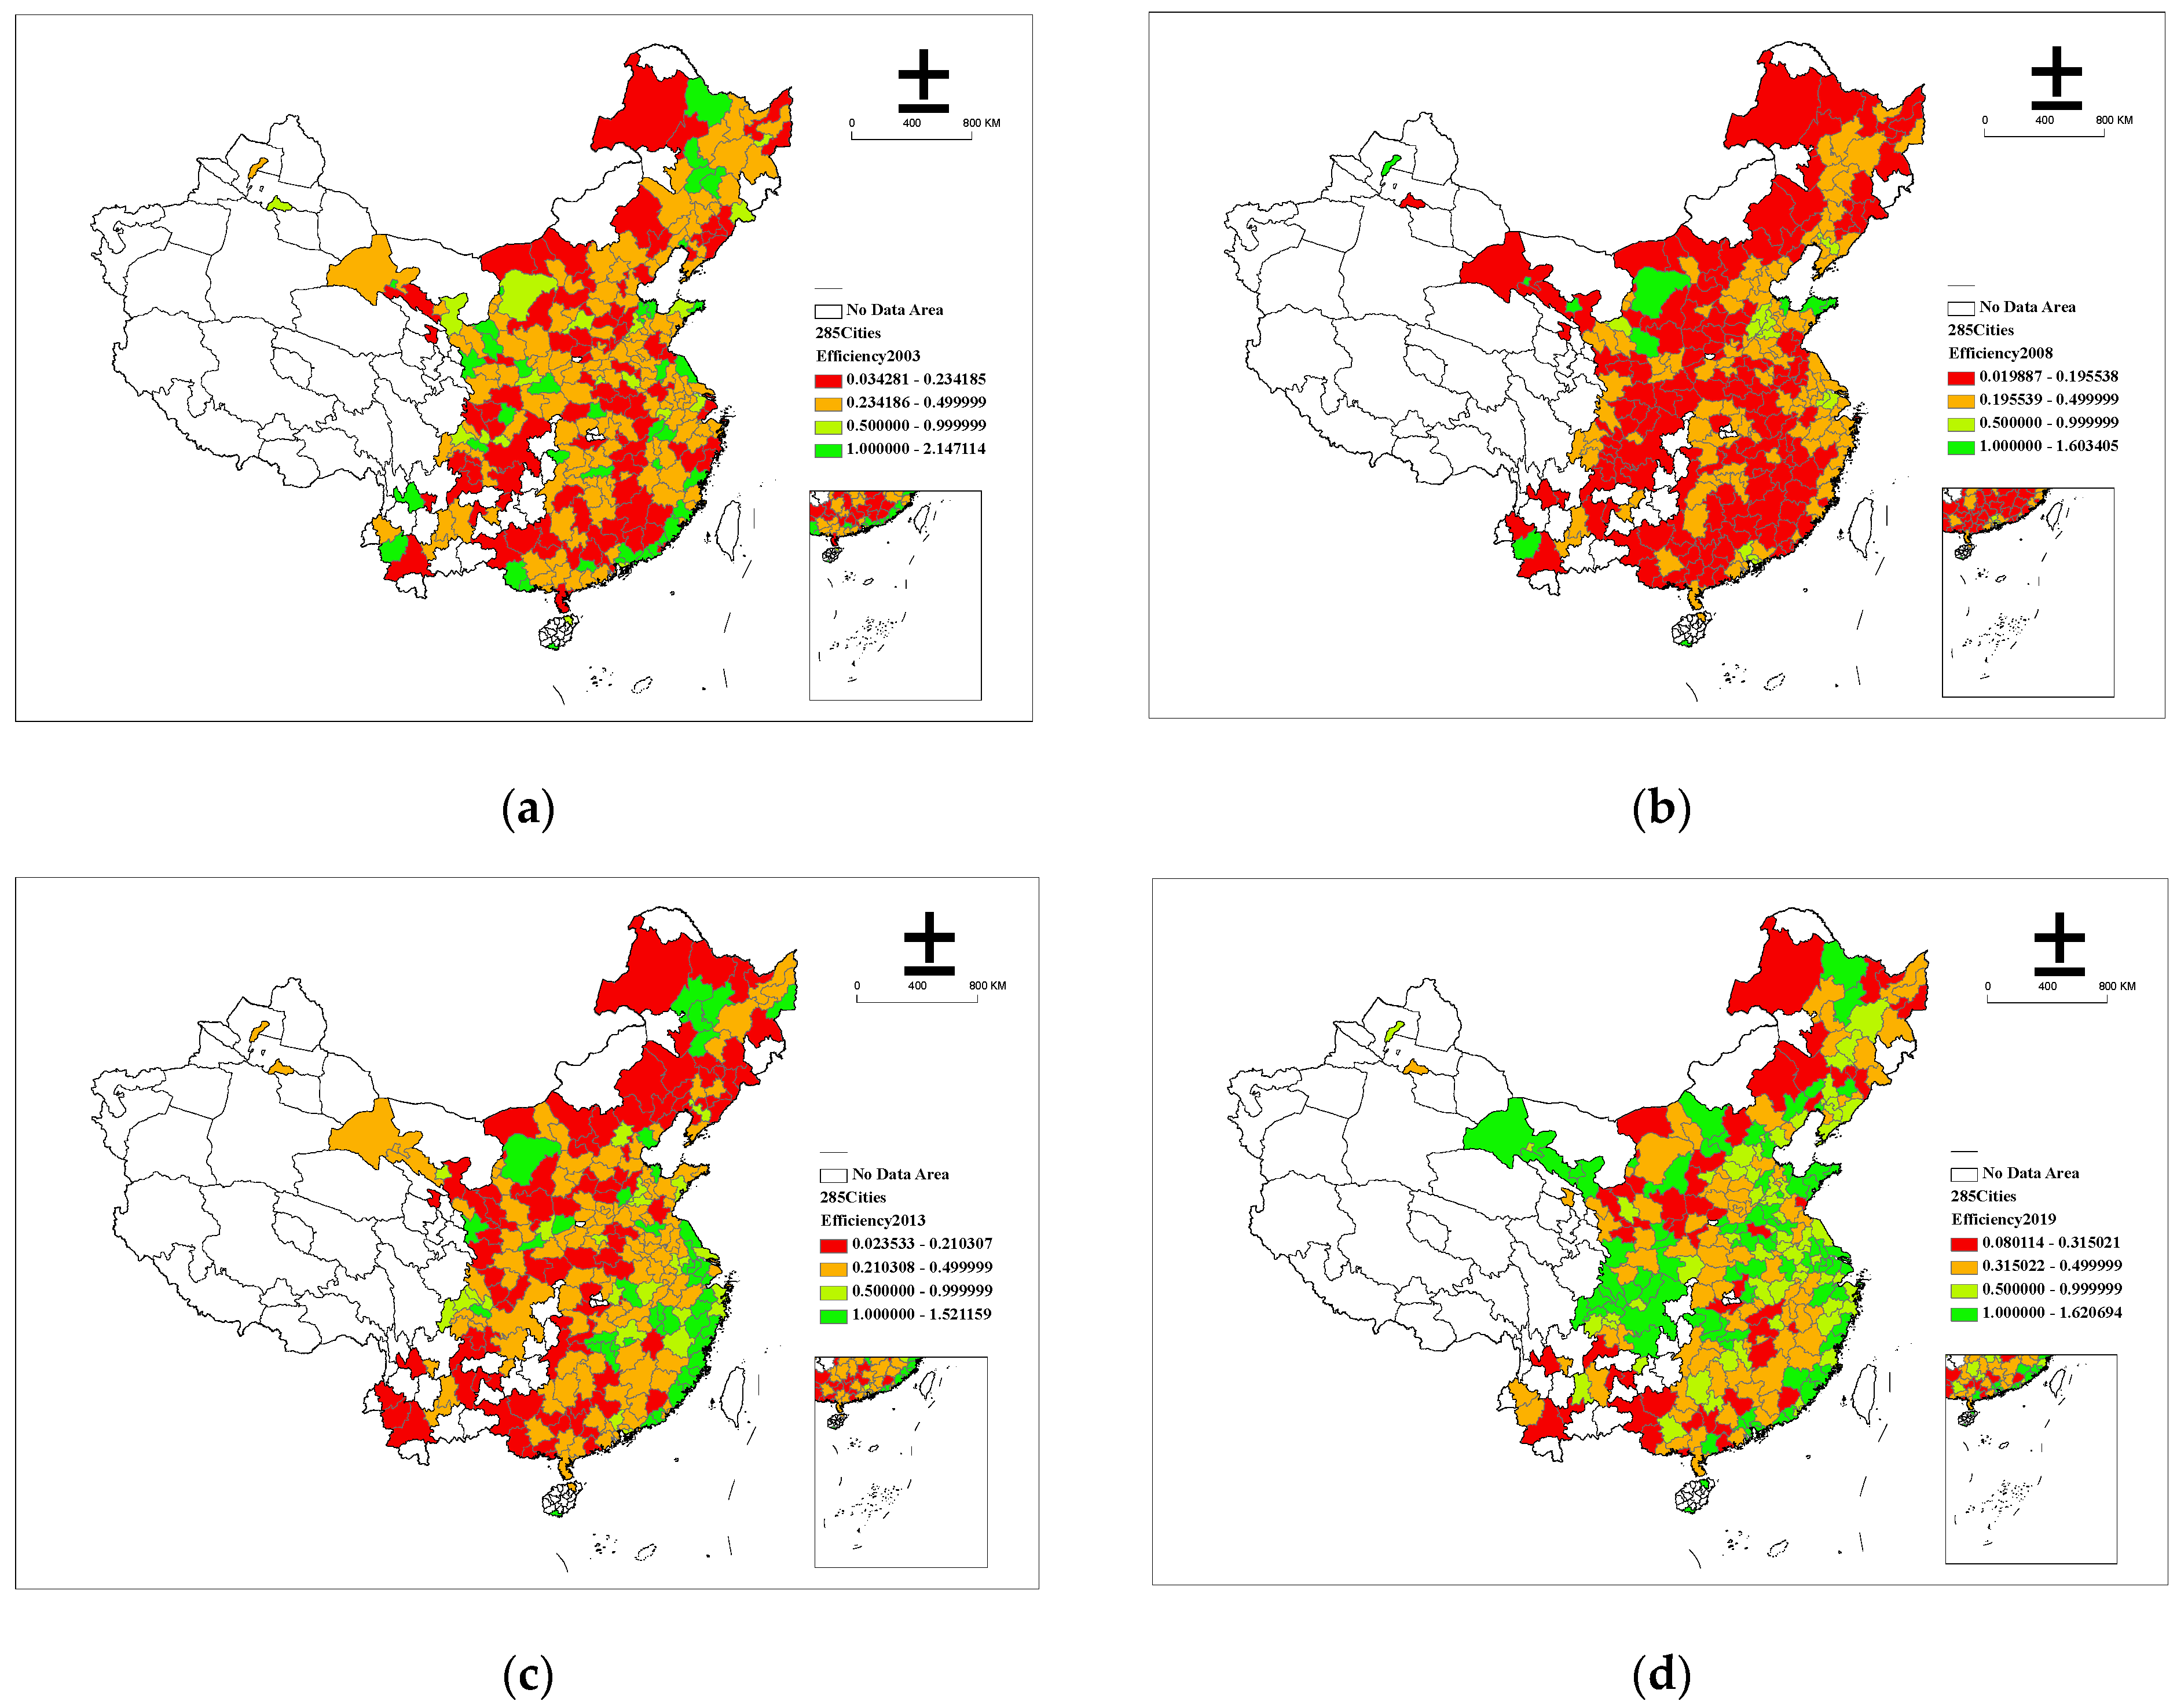
4.1. Results of GIE Measurement

According to the estimation results, the average value of GIE in the whole of China grew from 0.416 in 2003 to 0.625 in 2019, presenting an upward trend (Figure 2). However, the mean value of GIE in China is still less than 1, indicating that there is large room for improvement. Among the three regions, Eastern cities had the highest average GIE, with a value from 0.432 to 0.761 during the research period, which is consistent with prior provincial research [31]. To further analyze the evolution trend of GIE, we divided the GIE into 4 classes, and then used ArcGIS to illustrate the geographical distribution of GIE in China and its three regions in 2003, 2008, 2013, and 2019 (Figure 3). It shows that the number of efficient cities increased from 35 in 2003 to 88 in 2019, indicating that many cities improved significantly in GIE during this period. Specifically, these cities mainly agglomerated in the East, implying that cities in the Eastern region, which is better allocated with improved industrial structure, financial institutions, and high-quality talent, performed better in GIE.
As shown in Figure 3, the temporal trend of the GIE in the three regions during the study period was basically the same, which can be concluded as follows: during 2003–2006, the level of GIE increased slowly; in 2007, there is a significant decreasing trend of GIE in all three regions; from 2008 to 2019, it depicted a rapid increasing evolution trend. To further analyze the regional disparities during the study period, we calculated the increasing rate of GIE in three regions, respectively. The average value of GIE increased from 0.432, 0.370, and 0.450 to 0.761, 0.536, and 0.567 in the Eastern, Central, and Western regions, respectively. And the average annual growth rates in the above three regions are 75.97%, 44.85%, and 25.79%, respectively. It can be concluded that green innovation in the Eastern region was continuously improving at a fast speed while those in the Central and Western regions improved slower, which agrees with the findings of Liu [32].
In 2019, 88 cities had an efficient GIE value. These efficient cities mainly agglomerated in Sichuan (including 10 efficient cities), Guangdong (including 9 efficient cities), Shandong (including 8 efficient cities), Jiangsu (including 7 efficient cities), Fujian (including 6 efficient cities), Henan (including 5 efficient cities), Gansu (including 5 efficient cities), and Hunan (including 5 efficient cities), due to the more developed economy, agglomeration of more universities, higher-qualified workforce, and stronger financial support. Among the efficient cities, Haikou had the highest value of 1.621, due to lower input of capital and energy, and undesirable output of environmental pollution. Conversely, Puer, Zhaotong, and Yichun (Heilongjiang) had quite a low level of GIE, with the average value of 0.080, 0.096, and 0.097, respectively. This empirical analysis agrees with the findings of Li [33], who opined that Western provinces in China are remote with low economic levels, lack of high-technology support facilities, and low GIE.

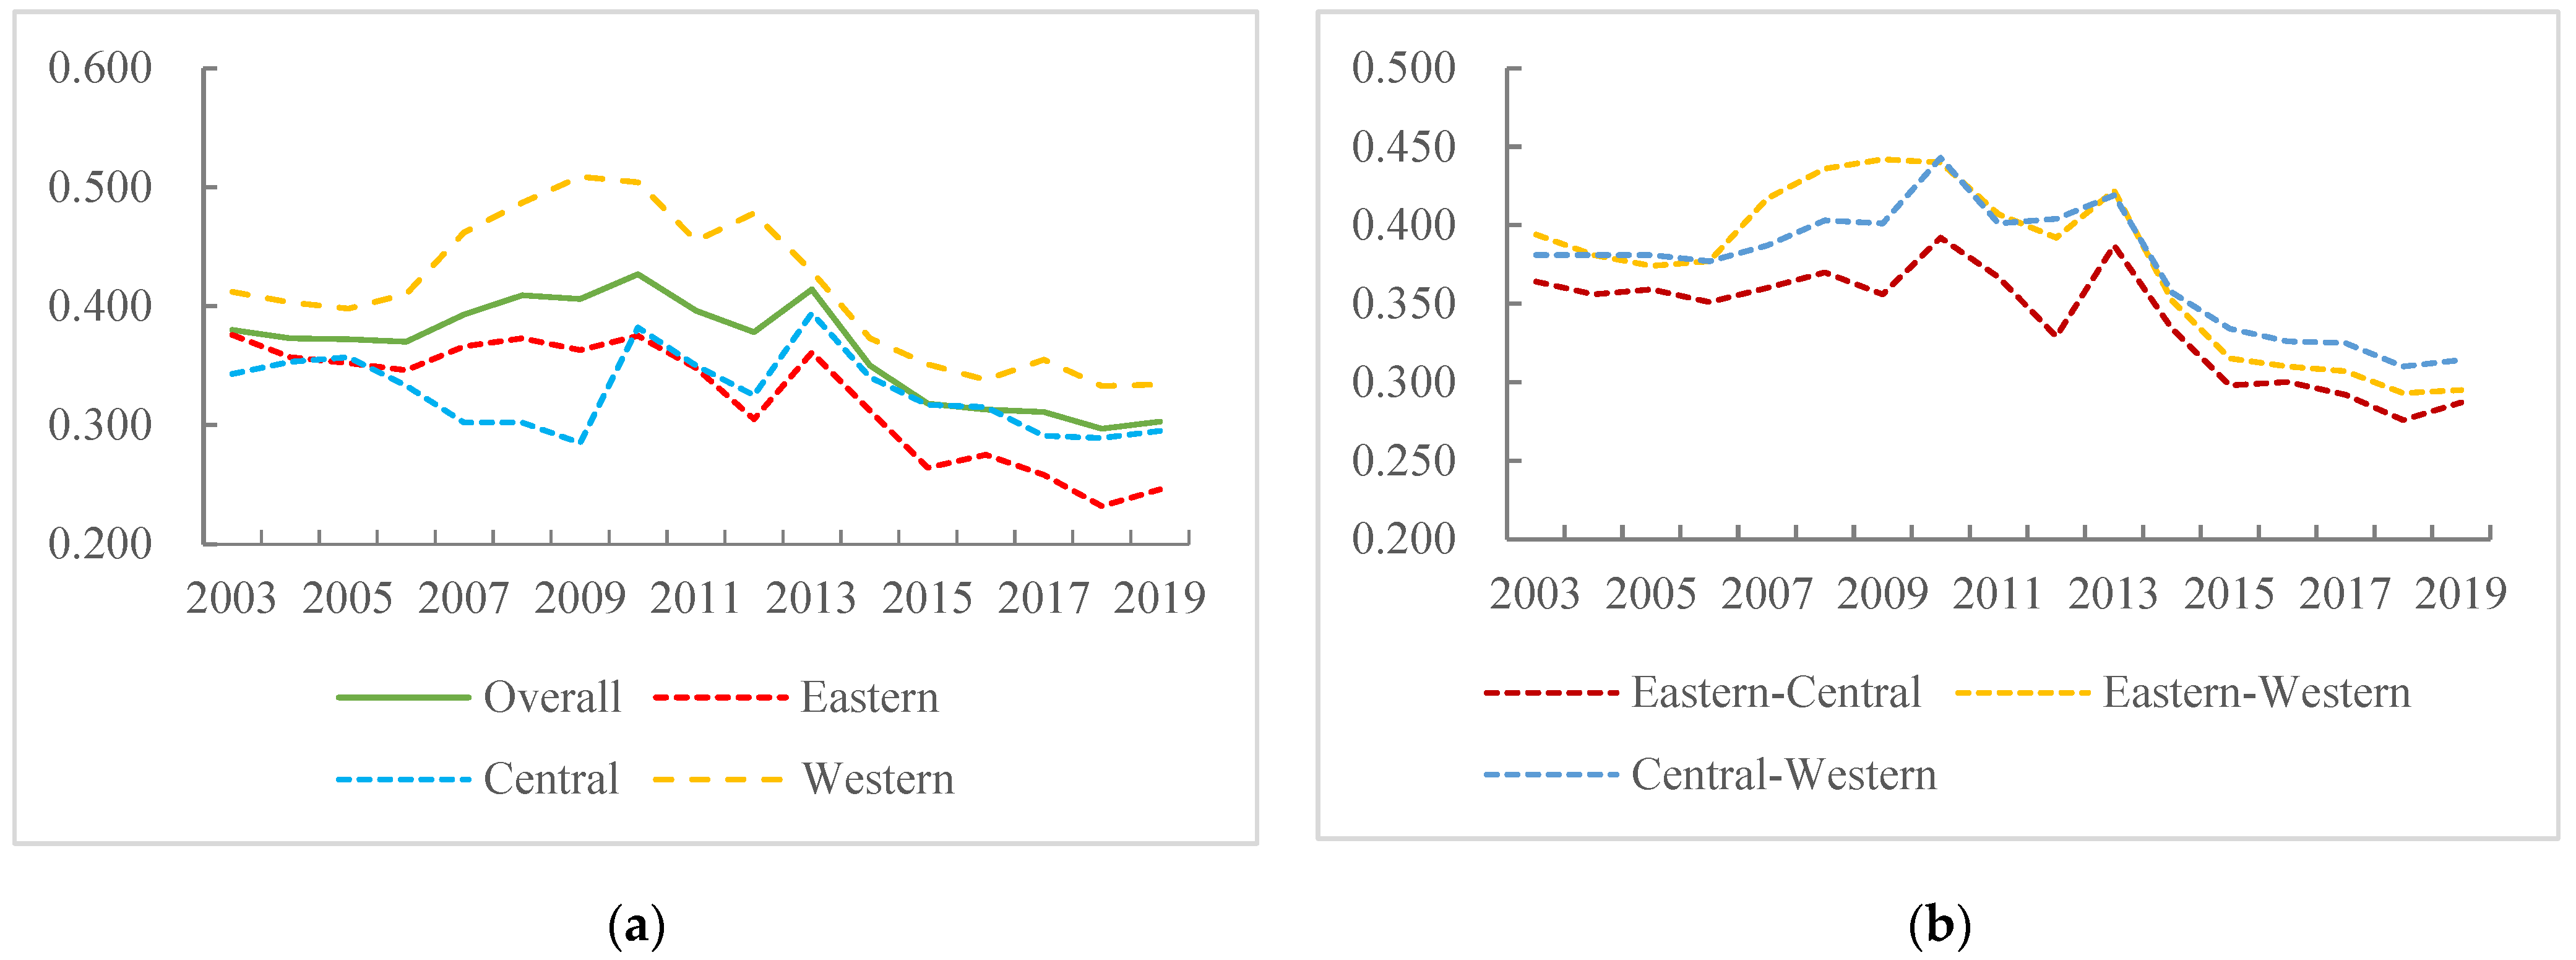
4.2. Regional Differences in GIE

Table 2 and Figure 4 show the empirical results of the Gini coefficient of GIE based on Dagum’s Gini coefficient decomposition method. According to the empirical results, the overall Gini coefficient declined from 0.380 in 2003 to 0.303 in 2019, presenting a slightly decreasing trend. This finding is consistent with Liao [34], who opined that the regional difference of GIE in China is narrowing. Specifically, the overall Gini coefficient fluctuated during the research period, in which it peaked at 0.427 in 2010 and bottomed to 0.303 in 2019. In fact, the performance of green innovation in China kept improving during the research period, and the value of GIE fluctuated mainly due to the national strategy encouraging regional coordinated development, especially the balanced development between the Eastern and Western regions after 2010. The within-region Gini coefficient in the three regions underwent a similar process, showing an overall downward trend. The average values of the within-region Gini coefficient in the Eastern, Central, and Western regions were 0.324, 0.328, and 0.414, respectively. Due to the geographical location, resource endowment, industrial structure, and lack of a highly qualified workforce, the Western region had the largest within-difference in GIE. Due to the national and local strategies that encourage enterprises to settle in the West, the GIE in the Western region improved, and the within-region Gini coefficient blunted to 0.334 in 2019, indicating that the within-region difference in the Western region was shrinking. Meanwhile, within-region differences significantly existed in both the Central and Eastern regions, since larger cities in these two regions are better allocated with strong capital, top-quality universities, and highly qualified talent. With the implementation of the strategy that encourages regional coordinated development, the within-region Gini coefficient of the Eastern and Central regions in 2019 blunted to 0.246 and 0.295, respectively, indicating a better balanced development of green innovation in these two regions, and this agrees with Lin [35].
As shown in Table 2 and Figure 4b, the between-region Gini coefficients of GIE presented a declining trend. Specifically, the Gini coefficient of the Eastern–Central, Eastern–Western, and Central–Western decreased from 0.364, 0.394, and 0.381 in 2003 to 0.287, 0.295, and 0.314 in 2019, respectively. It can be concluded that the between-region difference of GIE in these three regions was diminishing, and this is consistent with the findings of Zhao [12]. The gap between Eastern and Western used to be the largest in 2003, and it has been narrowed significantly since 2013. However, the gap between Central and Western was the largest in 2019, which differs from the findings of Zhang [36], who opined that the gap between Eastern and Western regions remained the largest during the period 2015–2018. This may be due to a diverse research scale, which focused on prefecture-level or above cities in this research instead of a specific industry. Furthermore, it may be due to technological progress in many cities agglomerated in Central provinces, i.e., Hubei, Sichuan, and Hunan; cities in the Central region have performed better in green innovation development than those in the Western region.
In terms of the contribution of regional differences in GIE, the rate of Gw and Gt showed a decreasing trend. Conversely, the rate of Gnb showed an increasing trend, as shown in Table 2. It can be concluded that the contribution of the variation of within-region and the intensity of transvariation decreased in the research period while that of between-regions increased. It can be concluded that although the differences among cities narrowed, cities within the regions performed distinctively on the improvement of green innovation. Cities in the Eastern and Central regions improved better in GIE compared with Western cities. The average contribution rates of Gw, Gnb, and Gt were 31.98%, 22.39%, and 45.63%, respectively. The intensity of transvariation was the main reason causing the regional differences of GIE, which is consistent with the previous study [37].

4.3. Distribution Dynamics of GIE

We applied the Gaussian kernel density estimation method to analyze the distribution dynamics of GIE in the 285 selected cities in China. We used the Matlab software to obtain the three-dimensional kernel density curves of GIE, as shown in Figure 5. In terms of location distribution, the position of the main peak in the whole samples and the three regions showed a slightly right-shift trend, which indicates that the GIE in these regions presented an increasing trend. Specifically, in terms of the main peak, it first moved to the left before 2006, and then to the right during 2007–2019, indicating that the increase in GIE in China mainly happened after 2007. And the trend of the main peak in the three regions is basically consistent with the whole of China, as shown in Figure 5b–d, which indicates that the increasing trend of GIE in China and the three regions is temporally similar. Meanwhile, the height of the four curves increased, presenting the increasingly spatial agglomeration characteristics of GIE. Moreover, the width of the curve narrowed, indicating that the absolute difference of GIE was diminishing.
From the perspective of the distribution ductility, the four curves all showed significant right-tailing characteristics, which resulted from the existence of cities with higher levels of GIE. Temporally, the right-tailing feature became more obvious, which is consistent with our above findings that the number of efficient cities in the whole of China and its three regions increased. Regarding the polarization features, there was always a side peak with a low height on the right side of the main peak, indicating a bipolar differentiation in GIE. In fact, central metropolitan areas such as Zhengzhou, Xi’an, and Wuhan performed quite well in technological construction, becoming new regional poles in both economic growth and technological progress. Specifically, the kernel density curves were composed of stepped main peaks and side peaks, indicating the spatial characteristics of polarization in GIE. Temporally, the side peak of the curve in the whole of China, Eastern, and Central tended to be more obvious, indicating the existence of polarization in these regions, while that in the Western was quite stable, indicating that the spatial polarization of GIE in the Western region was relatively stable during the research period.

4.4. Influencing Factors of GIE

To discover the influencing factors of GIE in China, we first used the spatial auto-correlation model to identify the spatial correlation of GIE in the selected cities. As shown in Figure 6, Global Moran’s I values were significantly positive in each year, indicating a significant spatial correlation of GIE, which agrees with Wang [13]. Based on the above analysis, we introduced the spatial econometric model to identify the influencing factors of GIE.
According to the LM test of global spatial econometric models, the Ro-bust LM(Lag) value is not significant at the 0.1 level, while the Ro-bust LM(error) and LM(error) are both significant at the 0.01 level in this study. Consequently, the SEM was selected.
Table 3 shows the regression results based on the SEM model. Firstly, the R2 values of the regressions in the whole of China, Eastern, Central, and Western are 0.508, 0.521, 0.521, and 0.690, respectively, indicating that the SEM model well stimulated the influence degree of each variable on GIE. Secondly, the regression coefficients of the independent variables (including LnGDP, LnLGE, LnLFI, and RTS) in China and its three regions are positive, indicating that the impact of economic development, governmental motivation, financial support, and industrial structure positively affected the development of GIE. The regression coefficients of the population scale (LnPOP) of China, Central, and Western are positive and negative in Eastern, indicating that the impact of the population scale on the development of GIE was spatially non-stationary.
Specifically, LnGDP positively affected the development of GIE in China and its three regions, and this result agrees with Guo [38]. However, the coefficient value of LnGDP in the Eastern region is insignificant at the 10% level, indicating that economic development in Eastern cities was not the main factor influencing GIE and its spatial heterogeneity. Conversely, the coefficient of LnGDP of Western cities is the highest, with significance at the 1% level, suggesting that economic development was one of the main sources of regional heterogeneity in GIE in the Western region. Meanwhile, the coefficient value of LnGDP varies enormously across regions due to the diverse gap of economic development among cities in the three regions.
The coefficient of LnLGE shows that governmental motivation significantly promotes the level of GIE in the whole of China and its three regions, which is consistent with Wu [39]. Spatially, the value of the coefficient varied among the three regions, indicating the differentiation of the effect that governmental motivation had on GIE. Specifically, the coefficient of LnLGE in the Western region is the highest, indicating that Western cities were deeply influenced by governmental motivation in the development and within-region heterogeneity of GIE, while the coefficient in the Eastern region is the lowest, indicating a weaker influence of LnLGE in the development and within-region heterogeneity.
The SEM results show that industrial structure (RTS) significantly affected the level and regional heterogeneity of GIE overall in China, in the Eastern region, and in the Central region. Furthermore, according to the regression results, the coefficient of RTS in the Central region is the highest, indicating that industrial structure affected the regional heterogeneity of GIE in the Central region most. This is mainly due to the diverse development strategies in Central cities, some of which have relatively advanced industrial structures with a high proportion of tertiary industry and better developed green innovation. Conversely, cities in Central provinces, including Shanxi, Jiangxi, and Jilin, whose industrial structures are marked by high energy consumption and low innovation capabilities, performed worse in GIE.
As for the impact of population scale (LnPOP) on GIE, a positive correlation can be found in the whole of China and Central cities between population scale and GIE, and this agrees with a relevant study showing that population scale has a positive correlation with green innovation [40]. However, the coefficients of LnPOP in the Eastern and Western regions is insignificant at the 10% level, indicating that it was not one of the main sources of within-regional heterogeneity in GIE in these two regions.

5. Discussion

Green innovation is one of the most important supports of social-economic development in China, and it has received widespread attention from scholars. Moreover, GIE has been widely used in measuring the development of green innovation from the input and output perspectives. The spatial pattern of GIE tended to be unevenly distributed in China. Based on provincial analysis, Long [41] opined that the Eastern region in China had the highest value of GIE. And the results of this paper, which analyzed the regional differences of GIE on the city level, also confirms this. Meanwhile, we found that GIE in the Eastern region, which is better supported by open economies and innovation [42], was continuously improving at the fastest speed among the three regions. This is inconsistent with Zhao’s research [11], which pointed out that GIE in the Eastern region decreased slightly based on provincial analysis. This is because cities in a certain province varied in the development of green innovation. Large cities with obvious improvements in GIE have significantly increased the average level of a certain province. The evaluation results of GIE show that the level of green innovation was highly correlated with the level of economic development, which is consistent with the research findings of Guo [38] and Liu [32]. Moreover, within-region differences of GIE significantly existed, especially in the Central and Eastern regions, since larger cities in these two regions are better allocated with strong capital and highly qualified talent, indicating an urgent balanced development through communication of talents and technological innovations within these regions. Regarding the between-region differences, the differences between the Western and Central regions tended to be the largest in 2019. This is inconsistent with a previous study [36], which concluded that the gap between the Eastern and Western regions was the biggest based on the industrial analysis. This is due to the different research scale of the two studies, and we can further conclude that green innovation activities in industrial sectors contributed most to the gap between the Eastern and Western regions, while other factors contributed more to that of the Central and Western regions from the macro perspective. Hence, the heterogeneity analysis of influencing factors is quite essential to further explore the regional difference of GIE. Although the between-region differences significantly existed, the distribution dynamics of GIE in China and its three regions showed a similar characteristic, which revealed significant spatial polarization and bipolar differentiation. This result is caused by the execution of national strategies that encourage technological progress and green manufacturing, and this has been previously proved by Liu [3].
The booming economic development, increasing government motivation, modified industrial structure, efficient financial support, and sufficient labor force offers essential support for the development of green innovation [18]. This paper also confirms this conclusion, and further finds that governmental motivation was the main reason for the development of GIE during the research period. Due to the national strategies that encourage enterprises to head West, the GIE in the Western region has improved significantly. And this can also be confirmed by the heterogeneity analysis of the effect of governmental innovation, since it significantly existed according to the regression result, which shows that GIE in the Western region was highly affected by governmental support while that in the Eastern region is slightly affected. Conversely, financial support did not play a significant role in the improvement of GIE; this is different from the result of Wu [43]. We further found that the effect of financial support on GIE was actually significant in the Eastern region, indicating that the insufficient financial support in the Central and Western regions limited the improvement of GIE. It indicates an urgent improvement of allocation of both capital and labor force in Central and Western cities. Interestingly, the effect of the industrial structure on GIE in Central cities is more significant than that in Eastern cities, which has been previously labeled as the region with the optimal industrial structure in China. This makes us think: Do the advantages of industrial structure in the Eastern region still exist? How did the industrial structure in the Central region improve and promote GIE? The answer to these two questions may further contribute to the improvement and balanced development of GIE in China. Moreover, the population has a positive effect on GIE in the whole of China and the Central region according to the regression results. Actually, the Eastern region has the largest population due to the historical development path, and the large amount of labor force limited the improvement of GIE as the element of input. Conversely, the amount of labor force is too small to optimize the GIE in the Western region. So, to further optimize the spatial structure of the labor force, it is crucial to apply differentiated regional strategies of talent introduction based on the fact of human structure in each city.

6. Conclusions and Policy Implications

6.1. Conclusions

By measuring the GIE of 285 selected cities in China from 2003 to 2019 using the super-efficiency SBM-DEA model with undesirable outputs, this paper systematically investigates the regional differences of GIE in China and its three regions through the methods of Dagum’s Gini coefficient decomposition and KDE, and then employs the spatial auto-correlation method and SEM to investigate the influencing factors of GIE. The main findings are presented as follows:
(1) During the period 2003–2019, the GIE in China and its three regions showed an overall upward trend, and the number of efficient cities, most of which agglomerated in the Eastern region, increased to 88 in 2019, indicating a significant spatial heterogeneity of GIE among the three regions. Due to the history of economic development, comparative advantages of endowment of high-quality factors, and suitable natural environment, the Eastern cities were generally far ahead in the development of green innovation; this spatial characteristic may remain for a certain period in the future.
(2) In terms of regional differences of GIE, through Dagum’s Gini coefficient decomposition analysis, it was revealed that the spatial difference of GIE in China was narrowing, and the within-region Gini coefficient in the three regions underwent a similar process due to the improvement of green innovation on the national level. Moreover, we adopted the analysis of the KDE method and found that GIE presented significant spatial characteristic of polarization. Specifically, developed cities in the Eastern region, such as the Yangtze River Delta, Pearl River Delta, and Beijing-Tianjin-Hebei Urban agglomeration, kept heading in the development of GIE. Meanwhile, large cities in the Western and Central regions, such as Xi’an, Wuhan, and Zhengzhou, had significant growth in the development of green innovation in the last years. So, perhaps in the near future, the development of green innovation will present a multi-polar situation.
(3) The regional heterogeneity of China’s GIE is affected by multiple factors. We employed the spatial error model and found that economic development, governmental motivation, financial support, industrial structure, and population scale had positive impacts on the GIE in China. Among them, governmental innovation was still the main support of green innovation, especially in the Western and Central cities. Conversely, the effect of industrial structure was significantly higher than the others in the Eastern cities. It can be concluded that the three regions in China were exploring different patterns in the development of GIE. Specifically, the improvement of GIE was due to the development of certain industries, especially the third industry in the Eastern region, while those of the Western and Central regions were mainly driven by governmental support.

6.2. Policy Implications

Based on the results of GIE measurement, regional differences, and influencing factors, we propose some policy implications to promote the balanced development of GIE as follows:
(1) Considering significant regional differences in GIE, the Chinese government should implement differentiated strategies according to the characteristics of green innovation in each city. Efficient cities, which mainly agglomerated in the Eastern region and metropolitan area in the Central region, should improve the structure of R&D investment and labor force input in green technology to further improve GIE. Local governments of small cities, especially those geographically located near the big cities, should promote cross-regional transfer of talent and capital by establishing regional urban cooperation organizations, which encourage enterprises to establish branches and other cooperational projects. The Central and Western cities, especially those with low GIE levels, should increase investment in R&D funds and personnel, optimize industrial structure, and introduce green enterprises and highly skilled talent to improve their capacity in green innovation. Meanwhile, the state should keep on introducing policies, such as tax incentives and financial support, to motivate green innovation activities.
(2) It is urgent for the Chinese government to create a green innovation development system and support the development of green technology, especially in economically underdeveloped regions. Specifically, the government should encourage green technologies which contributing to the development of clean and low-carbon energy. Meanwhile, given that industrial structure highly affects the GIE in China, it is essential to adjust industrial structure by identifying the optimized position in the global industrial chain based on the characteristics of industrial development in different regions and cities in front of the urgent need of environmental preservation. Moreover, it is crucial to set the financial support and energy consumption related to green innovations as the standard, offering green financing support in promoting the development of green innovation.
(3) Since differences between regions and intensity of transvariation are two main sources causing spatial differences, it is crucial to diminish regional differences and promote balanced regional development in GIE. To achieve this goal, the Chinese government should establish a cross-regional cooperation mechanism, encouraging cross-regional innovation resource sharing and technology transfer. Moreover, interaction and cooperation in green technology and management experiences should be encouraged among cities and regions to promote the coordinated development of GIE and improve the overall development of green innovation in China. Furthermore, investment in green energies, green technologies, and green production in the Western region should be highly encouraged by national and local measures such as tax reduction and exclusive projects of capital and talent.

6.3. Study Limitations

Due to the restricted availability, our work has potential limitations, which need to be addressed in future studies. First, limited by the availability of data, the index system we built in this study, although objectively reflecting the level of GIE, can further be optimized. Moreover, due to the unavailability of open data of most cities after 2019, factors such as the COVID pandemic and the energy crisis triggered by the conflict between Russia and Ukraine, which may have affected the green innovation activities in China, are not involved in this study. Second, the mechanisms of each influencing factor working on the level of GIE have not been specifically explored in this study. Further research is therefore needed in this field to enrich relevant studies.

Author Contributions

Conceptualization, Y.S. and Y.N.; methodology, Y.S.; software, Y.S.; validation, Y.S., Y.N. and P.S.; formal analysis, Y.S.; resources, Y.S.; data curation, Y.S.; writing—original draft preparation, Y.S.; writing—review and editing, Y.S. and Y.N.; visualization, Y.S.; supervision, Y.N. and P.S.; project administration, Y.S.; funding acquisition, Y.S. and Y.N. All authors have read and agreed to the published version of the manuscript.

Funding

This research was funded by Shandong Social Science Foundation (23DJJJ06), Soft Science of Key R&D Projects of Shandong Province (2022RKY04005 and 2023RKY04014), and Humanities and Social Sciences Project of Shandong Province (2023—XJPZ—006).

Institutional Review Board Statement

Not applicable.

Informed Consent Statement

Not applicable.

Data Availability Statement

The data that support the findings of this study are openly available in CNKI at https://kns.cnki.net/kns8?dbcode=CYFD (accessed on 10 August 2023).

Conflicts of Interest

The authors declare no conflict of interest.

References

  1. Song, M.; Peng, L.; Shang, Y.; Zhao, X. Green technology progress and total factor productivity of resource-based enterprises: A perspective of technical compensation of environmental regulation. Technol. Forecast. Soc. Chang. 2022, 174, 121276. [Google Scholar] [CrossRef]
  2. Zhu, Q.; Li, X.; Li, F.; Zhou, D. The potential for energy saving and carbon emission reduction in China’s regional industrial sectors. Sci. Total Environ. 2020, 716, 135009. [Google Scholar] [CrossRef] [PubMed]
  3. Liu, J.; Jiang, Y.; Gan, S.; He, L.; Zhang, Q. Can digital finance promote corporate green innovation? Environ. Sci. Pollut. Res. 2022, 29, 35828–35840. [Google Scholar] [CrossRef] [PubMed]
  4. Arslan, Z.; Kausar, S.; Kannaiah, D.; Shabbir, M.S.; Khan, G.Y.; Zamir, A. The mediating role of green creativity and the moderating role of green mindfulness in the relationship among clean environment, clean production, and sustainable growth. Environ. Sci. Pollut. Res. 2021, 29, 13238–13252. [Google Scholar] [CrossRef] [PubMed]
  5. Wang, M.; Li, Y.; Li, J.; Wang, Z. Green process innovation, green product innovation and its economic performance improvement paths: A survey and structural model. J. Environ. Manag. 2021, 297, 113282. [Google Scholar] [CrossRef] [PubMed]
  6. Begum, S.; Xia, E.; Ali, F.; Awan, U.; Ashfaq, M. Achieving green product and process innovation through green leadership and creative engagement in manufacturing. J. Manuf. Technol. Manag. 2022, 33, 656–674. [Google Scholar] [CrossRef]
  7. Rennings, K. Redefining innovation—Eco-innovation research and the contribution from ecological economics. Ecol. Econ. 2000, 32, 319–332. [Google Scholar] [CrossRef]
  8. Wurlod, J.-D.; Noailly, J. The impact of green innovation on energy intensity: An empirical analysis for 14 industrial sectors in OECD countries. Energy Econ. 2018, 71, 47–61. [Google Scholar] [CrossRef]
  9. Luo, Q.; Miao, C.; Sun, L.; Meng, X.; Duan, M. Efficiency evaluation of green technology innovation of China’s strategic emerging industries: An empirical analysis based on Malmquist-data envelopment analysis index. J. Clean. Prod. 2019, 238, 117782. [Google Scholar] [CrossRef]
  10. Li, D.; Zeng, T. Are China’s intensive pollution industries greening? An analysis based on green innovation efficiency. J. Clean. Prod. 2020, 259, 120901. [Google Scholar] [CrossRef]
  11. Zhao, N.; Liu, X.; Pan, C.; Wang, C. The performance of green innovation: From an efficiency perspective. Socio-Econ. Plan. Sci. 2021, 78, 101062. [Google Scholar] [CrossRef]
  12. Zhao, P.; Lu, Z.; Kou, J.; Du, J. Regional differences and convergence of green innovation efficiency in China. J. Environ. Manag. 2023, 325, 116618. [Google Scholar] [CrossRef]
  13. Wang, K.-L.; Zhang, F.-Q.; Xu, R.-Y.; Miao, Z.; Cheng, Y.-H.; Sun, H.-P. Spatiotemporal pattern evolution and influencing factors of green innovation efficiency: A China’s city level analysis. Ecol. Indic. 2023, 146, 109901. [Google Scholar] [CrossRef]
  14. Simanaviciene, Z.; Kilijoniene, A.; Simanavicius, A.; Khadzhynov, I. Transformation of Lithuania and Ukraine regional policy. Econ. Cond. Enterp. Funct. 2014, 25, 350–359. [Google Scholar] [CrossRef]
  15. Cui, Y.; Khan, S.U.; Deng, Y.; Zhao, M. Regional difference decomposition and its spatiotemporal dynamic evolution of Chinese agricultural carbon emission: Considering carbon sink effect. Environ. Sci. Pollut. Res. 2021, 28, 38909–38928. [Google Scholar] [CrossRef] [PubMed]
  16. Seiford, L.M.; Zhu, J. Modeling undesirable factors in efficiency evaluation. Eur. J. Oper. Res. 2002, 142, 16–20. [Google Scholar] [CrossRef]
  17. Long, R.; Guo, H.; Zheng, D.; Chang, R.; Na, S. Research on the measurement, evolution, and driving factors of green innovation efficiency in yangtze river economic belt: A super-sbm and spatial durbin model. Complexity 2020, 2020, 8094247. [Google Scholar] [CrossRef]
  18. Liu, C.; Gao, X.; Ma, W.; Chen, X. Research on regional differences and influencing factors of green technology innovation efficiency of China’s high-tech industry. J. Comput. Appl. Math. 2020, 369, 112597. [Google Scholar] [CrossRef]
  19. Fan, F.; Lian, H.; Liu, X.; Wang, X. Can environmental regulation promote urban green innovation efficiency? An empirical study based on Chinese cities. J. Clean. Prod. 2021, 287, 125060. [Google Scholar] [CrossRef]
  20. Zhang, J.; Ouyang, Y.; Ballesteros-Perez, P.; Li, H.; Philbin, S.P.; Li, Z.; Skitmore, M. Understanding the impact of environmental regulations on green technology innovation efficiency in the construction industry. Sustain. Cities Soc. 2020, 65, 102647. [Google Scholar] [CrossRef]
  21. Rennings, K.; Ziegler, A.; Ankele, K.; Hoffmann, E. The influence of different characteristics of the EU environmental management and auditing scheme on technical environmental innovations and economic performance. Ecolog. Econ. 2006, 57, 45–59. [Google Scholar] [CrossRef]
  22. Zhang, N.; Deng, J.; Ahmad, F.; Draz, M.U. Local government competition and regional green development in China: The mediating role of environmental regulation. Int. J. Environ. Res. Public Health 2020, 17, 3485. [Google Scholar] [CrossRef] [PubMed]
  23. Huang, Y.; Wang, Y. How does high-speed railway affect green innovation efficiency? A perspective of innovation factor mobility. J. Clean. Prod. 2020, 265, 121623. [Google Scholar] [CrossRef]
  24. Tone, K. A slacks-based measure of efficiency in data envelopment analysis. Eur. J. Oper. Res. 2001, 130, 498–509. [Google Scholar] [CrossRef]
  25. Dagum, C. A new approach to the decomposition of the Gini income inequality ratio. Empir. Econ. 1997, 22, 515–531. [Google Scholar] [CrossRef]
  26. Rosenblatt, M. Remarks on some nonparametric estimates of a density function. Ann. Inst. Stat. Math. 1956, 27, 832–837. [Google Scholar] [CrossRef]
  27. Silverman, B.W. Density Estimation for Statistics and Data Analysis; Chapman and Hall: New York, NY, USA, 1986. [Google Scholar]
  28. Anselin, L.; Syabri, I.; Smirno, O. Visualizing multivariate spatial correlation with dynamically linked windows. In Proceedings of the CSISS Workshop on New Tools for Spatial Data Analysis, Santa Barbara, CA, USA, 10–11 May 2002. [Google Scholar]
  29. Elhorst, J.P. Applied spatial econometrics: Raising the bar. Spat. Econ. Anal. 2010, 5, 9–28. [Google Scholar] [CrossRef]
  30. Lu, C.; Chen, M.; Tian, G. Spatial-temporal evolution and influencing factors of urban green innovation efficiency in China. J. Environ. Public Health 2022, 2022, 4047572. [Google Scholar] [CrossRef]
  31. Zhou, H.; Wang, R. Exploring the impact of energy factor prices and environmental regulation on China’s green innovation efficiency. Environ. Sci. Pollut. Res. 2022, 29, 78973–78988. [Google Scholar] [CrossRef]
  32. Liu, K.; Xue, Y.; Chen, Z.; Miao, Y. The spatiotemporal evolution and influencing factors of urban green innovation in China. Sci. Total Environ. 2023, 857, 159426. [Google Scholar] [CrossRef]
  33. Li, L.; Lei, L.; Han, D. Regional green innovation efficiency in high-end manufacturing. J. Coast. Res. 2018, 82, 280–287. [Google Scholar] [CrossRef]
  34. Liao, B.; Li, L. Urban green innovation efficiency and its influential factors: The Chinese evidence. Environ. Dev. Sustain. 2023, 25, 6551–6573. [Google Scholar] [CrossRef]
  35. Lin, S.; Sun, J.; Marinova, D.; Zhao, D. Evaluation of the green technology innovation efficiency of China’s manufacturing industries: DEA window analysis with ideal window width. Technol. Anal. Strateg. 2018, 30, 1166–1181. [Google Scholar] [CrossRef]
  36. Zhang, L.; Ma, X.; Ock, Y.-S.; Qing, L. Research on regional differences and influencing factors of Chinese industrial green technology innovation efficiency based on Dagum Gini coefficient decomposition. Land 2022, 11, 122. [Google Scholar] [CrossRef]
  37. Yao, M.; Duan, J.; Wang, Q. Spatial and temporal evolution analysis of industrial green technology innovation efficiency in the Yangtze River Economic Belt. Int. J. Environ. Res. Public Health 2022, 19, 6311. [Google Scholar] [CrossRef] [PubMed]
  38. Guo, Y.; Tong, L.; Mei, L. The effect of industrial agglomeration on green development efficiency in Northeast China since the revitalization. J. Clean. Prod. 2020, 258, 120584. [Google Scholar] [CrossRef]
  39. Wu, F.; Fu, X.; Zhang, T.; Wu, D.; Sindakis, S. Examining whether government environmental regulation promotes green innovation efficiency—Evidence from China’s Yangtze River Economic Belt. Sustainability 2022, 14, 1827. [Google Scholar] [CrossRef]
  40. Liu, P.; Luo, Z. A measurement and analysis of the growth of urban green total factor productivity-based on the perspective of energy and land elements. Front. Environ. Sci. 2022, 10, 838748. [Google Scholar] [CrossRef]
  41. Long, X.; Sun, C.; Wu, C.; Chen, B.; Boateng, K.A. Green innovation efficiency across China’s 30 provinces: Estimate, comparison, and convergence. Mitig. Adapt. Strateg. Glob. Chang. 2019, 25, 1243–1260. [Google Scholar] [CrossRef]
  42. Guo, J.; Fu, Y.; Sun, X. Green innovation efficiency and multiple paths of urban sustainable development in China: Multi-configuration analysis based on urban innovation ecosystem. Sci. Rep. 2023, 13, 12975. [Google Scholar] [CrossRef]
  43. Wu, Z.J.; Wu, N.J. Research on the Measurement, Decomposition and Influencing Factors of Green Economic Efficiency in the Yangtze River Economic Belt: Based on Super-Efficiency SBM-ML-Tobit Model. Urban Probl. 2021, 40, 52–62+89. [Google Scholar] [CrossRef]
Figure 1. Geographical distribution of the 285 selected cities in China.
Sustainability 16 00334 g001
Figure 2. The level of GIE. (a) Overall cities. (b) Eastern cities. (c) Central cities. (d) Western cities.
Sustainability 16 00334 g002
Figure 3. (a) 2003; (b) 2008; (c) 2013; (d) 2019. The spatial-temporal characteristic of GIE in 285 selected cities.
Sustainability 16 00334 g003
Figure 4. Trends in the Gini coefficient of GIE. (a) The within-region Gini coefficient. (b) The between-region Gini coefficient.
Sustainability 16 00334 g004
Figure 5. The kernel density curves of GIE in China and its three regions. (a) Overall cities. (b) Eastern cities. (c) Central cities. (d) Western cities.
Sustainability 16 00334 g005
Figure 6. Global Moran’s I of GIE in 285 selected cities.
Sustainability 16 00334 g006
Table 1. Indicator system of GIE.
System LayerStandard LayerIndicator LayerUnit
InputCapitalExpenditure for science and technology 10 million yuan
Expenditure for education 10 million yuan
LaborNumber of urban employeesPerson
Number of scientific and technological personnelPerson
EnergyElectricity consumption resources10 million kw⋅h
Desirable outputEconomic developmentPer capital GDPYuan
Innovation progressNumber of green patent applicationsOne
Number of green utility model applicationsOne
Undesirable outputEnvironmental pollutionIndustrial wastewater discharge10 million tons
Industrial SO2 emissionsTons
Industrial smoke dust emissionsTons
Table 2. The results of the Gini coefficient of GIE and its decomposition.
YearOverall Gini CoefficientWithin-Region Gini CoefficientBetween-Region Gini CoefficientContribution (%)
EasternCentralWesternEastern-CentralEastern-WesternCentral-WesternGwGnbGt
20030.3800.3760.3430.4120.3640.3940.38133.02011.36855.611
20040.3730.3570.3530.4030.3560.3810.38132.95010.94556.105
20050.3720.3520.3570.3980.3590.3740.38132.92712.80854.266
20060.3700.3460.3330.4100.3510.3770.37732.52117.94349.536
20070.3930.3660.3020.4620.3600.4170.38731.81526.82141.364
20080.4090.3730.3020.4870.3700.4360.40331.35029.72938.922
20090.4060.3630.2850.5090.3560.4420.40130.93626.83242.232
20100.4270.3750.3820.5040.3920.4400.44332.07519.33948.586
20110.3960.3480.3500.4550.3670.4070.40131.80424.80643.391
20120.3780.3050.3250.4780.3290.3920.40431.50420.05448.442
20130.4140.3610.3940.4290.3870.4220.41931.65133.72734.623
20140.3500.3120.3400.3730.3340.3520.35732.39725.31042.293
20150.3180.2640.3170.3510.2980.3150.33432.02422.65545.321
20160.3130.2750.3150.3380.3000.3100.32632.60915.23752.154
20170.3110.2580.2910.3550.2920.3070.32531.54926.30642.145
20180.2970.2320.2890.3330.2760.2930.31031.09129.51639.393
20190.3030.2460.2950.3340.2870.2950.31431.42627.24741.327
Table 3. Regression results of SEM.
OverallEasternCentralWestern
Cons−0.016−0.002−0.035−0.048
LnGDP0.331 ***0.0660.392 ***0.526 ***
LnLGE0.430 ***0.205 **0.415 ***0.607 ***
LnLFI0.0610.157 **0.0470.042
RTS0.120 ***0.074 **0.290 ***0.099
LnPOP0.068 *−0.0200.139 **0.031
LAMBDA0.225 *0.0300.276 **0.357 **
R20.5080.5210.5210.690
Breusch-Pagan test17.718 ***12.496 **12.006 **11.657 **
Likelihood Ratio test2.761 *0.0262.0882.286
Note: *, **, and *** indicate significance at the 10% level, 5% level, and 1% level.
Disclaimer/Publisher’s Note: The statements, opinions and data contained in all publications are solely those of the individual author(s) and contributor(s) and not of MDPI and/or the editor(s). MDPI and/or the editor(s) disclaim responsibility for any injury to people or property resulting from any ideas, methods, instructions or products referred to in the content.

