Article

Investigating New Environmentally Friendly Zeotropic Refrigerants as Possible Replacements for Carbon Dioxide (CO2) in Car Air Conditioners

Department of Mechanical and Materials Engineering, Faculty of Engineering, University of Jeddah, Jeddah 21589, Saudi Arabia
Sustainability 2024, 16(1), 358; https://doi.org/10.3390/su16010358
Submission received: 26 October 2023 / Revised: 20 December 2023 / Accepted: 28 December 2023 / Published: 30 December 2023

Abstract

:
The widespread use of automobiles and the increased duration spent within automobiles equipped with air conditioning systems have prompted various countries to enforce regulations that advocate for eco-friendly cooling substances (refrigerants) characterized by a slight global warming potential (GWP) and the absence of an ozone depletion potential (ODP). The imperative for automobiles to possess air conditioning systems that are both high-performing and eco-conscious has emerged as a means to mitigate their ecological impact, reduce fuel usage, and minimize carbon emissions. Zeotropic refrigerants, with a lower GWP than traditional alternatives, contribute to sustainability in car air conditioning by reducing the environmental impact and enhancing the energy efficiency, aligning with global regulations and fostering innovation in the automotive industry. This shift signifies a commitment to mitigating climate change and adopting environmentally conscious practices. The objective of the present study is to introduce blends of zeotropic refrigerants based on CO2 (R-744), namely R455A (a blend of R-744, R-32, and R-1234yf), R469A (a blend of R-744, R-32, and R-125), and R472A (a blend of R-744, R-32, and R-134a), to enhance the thermodynamic performance of pure CO2 refrigerant. Through the utilization of the Aspen HYSYS V11 software, an investigation is carried out involving thermodynamic energy and exergy analyses, as well as system optimization for an automotive air conditioning (AAC) system utilizing these novel zeotropic refrigerant blends, in comparison with the use of R-744 as the refrigerant. The study delves into the impact of parameters such as average evaporator temperature, condenser/cooler pressure, refrigerant flow rate, and condenser/cooler outlet temperature on AACs’ output parameters and subsequently presents the findings. The outcomes reveal that, under equivalent operational circumstances, the adoption of R455A, R469A, and R472A offers improvements in coefficient of performance (COP) by 35.4%, 18.75%, and 2%, respectively, when compared to R744. This shift is advantageous as it mitigates leakage-related issues stemming from the elevated operational pressure of R744 and eliminates the need for cumbersome equipment. R455A and R469A obtain the greatest COP and exergy efficiency (ηex) values, measuring 4.44 and 4.55, respectively, at the identical operating conditions with optimal condenser/cooler pressures of the examined blends. Furthermore, eco-friendly refrigerants R455A and R472A are recommended for integration into AAC systems in vehicles, as they help combat global warming and protect natural surroundings and leakage issues.

1. Introduction

The heating, ventilation, and air conditioning (HVAC) systems keep thermal comfort suitable for individuals occupying a building, vehicles, and any enclosed space. The thermal comfort conditions have the potential to impact occupants’ efficiency and job performance through various mechanisms. The utilization of the HVAC system is on the rise, coinciding with the increasing severity of global temperature increases due to greenhouse gas emissions. The residential sector uses 27% of the world’s energy and is responsible for 17% of R744 pollution [1,2,3]. The adoption of a refrigerant with a low GWP and exceptional efficiency could play a significant role in diminishing energy usage and emissions equivalent to CO2. In recent decades, the negative effect of refrigerants on the environment has emerged as a noteworthy concern, primarily owing to their raised GWP. Numerous global agreements have been ratified to safeguard the environment by decreasing the utilization of refrigerants possessing ODP and high GWP values [4,5]. The sector linked to the manufacturing and application of refrigerants has encountered challenges in identifying refrigerants that offer exceptional performance and eco-friendliness throughout the preceding three decades. More and more people are driving cars and spending more and more time inside them, which is why most cars now have air conditioning systems. Nonetheless, utilizing refrigerant fluids in these systems bears the potential for environmental detriment, prompting numerous countries to enact regulatory measures necessitating the application of ecologically mindful refrigerants characterized by ODP and a limited GWP. Driven by scientific progress and a growing awareness of the adverse repercussions of the impact of synthetic refrigerants on the ozone layer integrity and emissions of greenhouse gases, the transition from current refrigerants to new environmentally friendly alternatives is an inevitable trajectory. Conventional hydrofluorocarbons are being replaced due to the Kyoto Protocol’s focus on greenhouse gas emissions and global warming. The presently employed refrigerants possess a 100-year GWP of 1430 for R134a, 2088 for R410, 1810 for R22, and 4000 for R11. As a result of these high values, there is a push to either eliminate or gradually decrease the use of these refrigerants. The growing apprehension regarding the state of the atmosphere has intensified the drive to adopt refrigerants with a minimal GWP and ODP. Taking into account aspects related to environmental conservation, economic viability, safety, superior heating capabilities at elevated temperatures, adaptability to low environmental temperatures, and a substantial volumetric cooling potential, the transcritical CO2 technology was anticipated to emerge as the preferred choice for alternative refrigerants and the preferred technical approach for various industrial, commercial, agricultural, and residential applications [6,7,8]. Yelishala et al. [9] conducted a study on an alternative refrigerant to mitigate human-induced climate change. They explored the potential of hydrocarbons (HCs) as natural and efficient cooling agents with a low GWP and no ODP. However, the flammability of HCs limits their widespread use. The research investigated using zeotropic blends of hydrocarbons and CO2 as refrigerants in basic vapor compression refrigeration cycles. The study aimed to identify the most promising hydrocarbon CO2 mixtures for effective refrigeration. The use of zeotropic blends in a specialized subcooling mechanical system inside a CO2 refrigeration setup was assessed by Llopis et al. [10]. They conducted experimental testing on a lab bench to find the ideal compositions of R32, R600, R-32, and CO2 with the base fluid of R152a. The tests involved maintaining a fixed temperature of heat load across the heat rejection temperatures, resulting in a 1.4% increase in COP. Mostafa et al. [11] discussed using adsorption refrigeration technology to efficiently harness low-grade thermal energy. They compared the performance of various adsorption pairs in a solar adsorption ice-maker and introduced new pairs to enhance its efficiency. The experimental setup was in Upper Egypt, demonstrating that the tested pairs are viable for solar adsorption ice-maker systems, particularly for preserving and storing food and vaccines. A study analyzed the performance of zeotropic mixtures and pure fluids in a parallel two-stage organic Rankine cycle powered by reject heat from an LNG-fueled ship. The findings indicated that zeotropic mixtures do not consistently outperform pure fluids. The optimal economic performance of PTORC was achieved using R170/R1270-R600 [12]. Energy efficiency in vapor compression heat pumps using zeotropic-mixed refrigerants was studied by Mezentseva et al. [13]. They demonstrated that the coefficient of performance is higher when utilizing a mixture of R-32/R-152a compared to R-32/R-134a. From 100 K to room temperature, Barraza et al. [14] measured the frictional pressure drop of various multicomponent zeotropic mixtures boiling in extremely small tubes. They used different pressure drop correlations found in the literature to compare the data they gathered.
Contemporary research into substituting refrigerants has bifurcated into two primary strategies, both propelled by ecological considerations. The initial approach entails the quest for inventive refrigerants characterized by a minimal GWP and the absence of an ODP, examples of which include the Company of United Signal azeotropic blend R410A alongside DuPont Company’s R1234ze and R1234yf. The second avenue of investigation delves into the utilization of naturally occurring refrigerants [15]. CO2, an old refrigerant [16], is non-toxic, eco-friendly, safe, and cost-effective and has good thermal properties. Robinson and Groll [17], from Purdue University, demonstrated the CO2 transcritical cycle’s cutting-edge and reliable feasibility for automotive air cooling, promising efficiency gains. Concurrently, Yu et al. [18] have provided evidence that CO2-based electric vehicle air conditioning systems perform at a comparable level to those utilizing R134a.
CO2 as a refrigerant substitute is a promising study area, but its high operational pressure and low system performance impede its implementation [19]. Sun and colleagues conducted empirical investigations involving CO2/R32 blends within a water-to-water heat pump system [20]. Yu et al. [21] employed both theoretical and experimental approaches to investigate temperature differentials in heat transfer. They employed enthalpy changes nonlinearly with the temperature to analyze R236fa/R32 combinations, demonstrating a composition-dependent glide temperature. Liu et al. [22] examined explosive pressure, flame structure, and the lowest flammability bounds of R32/R1234ze(E) mixes. R-134a, R-125, R-32, and R-1234yf, ODP and GWP refrigerants, were unsafe, expensive, and complicated to process [23]. Abboud et al. [24] compared the thermodynamic performance of automotive air conditioning systems (AACs), employing R134a to hydrocarbon (HC) blends such as R290/R600a. A theoretical investigation showed that the blend (R-600a/R-290/R-134a) with a mass percentage of (43/35/22) has a low GWP and similar refrigerant efficiency without system adjustments. Sagar and Rakshit [25] provided a comprehensive review and comparison of recent advancements and sustainable solutions within the domain of automotive air conditioning systems. They focused on important advancements and investigated the thermodynamic and thermophysical features of innovative blended refrigerants, such as R1234yf/R600a, R1234yf/R290, and R13I1/R152a, proposed as alternatives to R134a for use in automobile air conditioning systems [26]. Savitha and colleagues [27] offered an overview of low GWP refrigerants’ thermodynamic and flammability properties and their compatibility with construction materials and lubricants. Various researchers addressed challenges in CO2-based air conditioning systems. An inventive concept was presented by [28], wherein evaporative cooling was integrated with an automobile CO2 air conditioning system. This design addresses the energy efficiency loss in warm conditions when using CO2 as a refrigerant. In hot climates, Lei et al. [29] combined theoretical and experimental studies to improve evaporator heat transfer and system performance with CO2. The effects of adding a second element to CO2 transcritical cycles to mitigate expansion losses were explored by Vaccaro et al. [30]. The theoretical features of vapor–liquid equilibrium in eco-friendly zeotropic mixtures, CO2/R1336mzz(E) and CO2/R1234ze(Z), were investigated [31]. For the prediction of the boiling heat transfer of saturated flow and two-phase pressure declines in evaporating flows, Chen et al. [32] offered novel correlations and deep learning-based modeling. Hussain et al. anticipated and optimized R1234yf two-phase pressure declines under various situations [33]. Al-Zahrania [34] used Aspen HYSYS V 11 software to optimize the thermodynamic energy and exergy performance and system optimization of an automobile air conditioning system (AACs) for novel zeotropic refrigerant mixtures, R455A (R-744/32/1234yf) and R-463A (R-744/32/125/1234yf/134a), compared to carbon dioxide (R744).
Nonetheless, leakage concerns in pure R744 systems might occur due to high operating pressures, necessitating heavy equipment and, as a result, lowering the coefficient of the performance and low thermodynamic performance of pure R744 cycles. These difficulties can be addressed by developing new blends; however, their qualities may differ from those of the original elements. The adoption of new environmentally friendly zeotropic refrigerants as potential substitutes for carbon dioxide (R744) in car air conditioners introduces a novel and promising paradigm in the automotive industry. New environmentally friendly zeotropic refrigerants offer a dual advantage of environmental friendliness and enhanced performance, with a significantly lower global warming potential compared to R744. Their tailored thermodynamic properties facilitate improved energy efficiency and cooling capabilities, contributing to sustainability goals and addressing climate change concerns. The innovation also lies in the compatibility of new environmentally friendly zeotropic refrigerants with existing equipment, ensuring a feasible transition for manufacturers and the overall commitment to safety standards. This shift towards new environmentally friendly zeotropic refrigerants represents a noteworthy advancement in material science and signifies the automotive industry’s dedication to fostering environmentally conscious practices and innovation in refrigeration technology for a more sustainable future. This study examines the potential of three R744-based blends, R455A (R-744/32/1234yf), R-469A (R-744/R-32/R-125), and R-472A (R-744/R-32/R-134a), to improve the thermodynamic efficiency of pure R-744, reducing engine fuel consumption and carbon emissions. The growing requirement for eco-friendly and high-performing automobile air conditioning systems makes the research crucial. Zeotropic refrigerants emerge as crucial contributors to sustainability in automotive air conditioning systems, providing a compelling alternative to carbon dioxide (CO2). With a substantially lower global warming potential (GWP) compared to traditional hydrofluorocarbon (HFC) refrigerants, zeotropic alternatives significantly reduce the environmental impact of car air conditioners. This transition not only aligns with stringent global regulations but also enhances energy efficiency, leading to a decreased carbon footprint associated with both refrigerant production and the operational phase of the air conditioning system. By fostering innovation and compliance with non-ozone depleting standards, zeotropic refrigerants epitomize a sustainable shift in the automotive industry, embodying a commitment to mitigating climate change and advancing environmentally conscious practices. To achieve this goal, the Aspen HYSYS tool is used to compare the thermodynamic exergy and energy analysis of an AAC system for the suggested zeotropic refrigerants and R-744. The impacts of the average evaporator temperature, condenser/cooler pressure, refrigerant flow rate, and condenser/cooler outlet temperature on the AACs’ output parameters (evaporator capacity ( Q ˙ e v a p ), compressor discharge temperature (t2), cycle coefficient of performance (COP), compressor power ( W . c o m p ), compressor pressure ratio (γ), and exergy efficiency (ηex)) are investigated and stated. Additionally, the optimal operating parameters of automotive air conditioning (AAC) systems based on the maximum COP are calculated and presented. The expected results of this study are intended to emphasize the superior performance of the proposed refrigerants in contrast to R-744 while also establishing favorable operational parameters for these new refrigerants. These outcomes have the potential to form the basis for the development of economically feasible and environmentally responsible mass-produced automotive air conditioning (AAC) systems.

2. Refrigerant Blends’ Thermodynamic Properties

2.1. Environmental and Physical Properties

Environmental and physical features of common refrigerants, such as R-134a, R-32, R-125, R1234yf, and R744, are summarized in Table 1. The chart clearly shows that there is no difference between any of these refrigerants with regard to their ozone depletion potential (ODP). However, when associated with the other refrigerants, R-125 and R-134a, have much higher GWP values. Surprisingly, the GWP values of R744 and R1234yf are very similar. R744 also has the lowest standard boiling point (at −78 degrees Celsius) and highest critical pressure (at 7.3 MPa).
Table 2 shows the environmental and physical properties of the tested zeotropic refrigerants. R-455A, R-469A, and R-472A are refrigerant mixes with mass ratios of 3.0/21.5/75.5, 35.0/32.5/32.5, and 69.0/12.0/19.0, respectively. Note that the R-469A blend has a GWP of 1250, while the R-455A blend has a GWP of about 146.
The refrigerant changes from a saturated liquid (bubble point) to a saturated vapor (dew point) throughout the evaporation process. This change happens at a consistent temperature when the pressure remains constant. However, a refrigerant blend with numerous components may have a temperature difference between the dew point and bubble point. This is temperature glide. The balance between vapor and liquid phases is explored in this study to determine R455A, R469A, and R472A’s temperature glide properties. Table 2 shows that the R455A, R469A, and R472A have temperature glides of 12.5 °C, 17 °C, and 28 °C, respectively.

2.2. Pressure–Enthalpy, P–h Envelopes

The investigation of the thermodynamic properties of refrigerant blends holds paramount importance in the realm of refrigeration and air conditioning systems. When combining different refrigerant components into blends, the resulting mixture exhibits unique thermodynamic behaviors that differ from those of individual pure refrigerants. Understanding the pressure–enthalpy, temperature–entropy, and other relevant diagrams specific to these blends provides crucial insights into their performance, efficiency, and operational characteristics. By analyzing these thermodynamic properties, researchers and engineers can optimize system design, enhance energy efficiency, and ensure environmentally responsible refrigerant choices. Consequently, delving into the thermodynamic properties of refrigerant blends contributes significantly to the advancement of sustainable and efficient cooling technologies. The pressure–enthalpy (P–h) graphs of R455A, R469A, and R472A compared to R744 at various temperatures are shown in Figure 1. As depicted in the figure, the latent heat region can be determined for each refrigerant by analyzing the disparity between the bubble point curve and the dew point curve. The critical pressures for R744, R455A, R469A, and R472A are 7.38 MPa, 4.32 MPa, 6.21 MPa, and 7.31 MPa, respectively. Notably, R744 possesses the maximum critical pressure, while R455A boasts the lowermost among them. Zeotropic refrigerants find practical applications in various cooling systems due to their lower environmental impact compared to traditional alternatives. These refrigerants contribute to sustainability by reducing greenhouse gas emissions and complying with regulations. The differences in critical pressure among zeotropic refrigerants influence their selection in real-world applications. Critical pressure affects system design and performance, influencing factors such as compressor power requirements and heat transfer efficiency. Engineers and system designers must consider these variations to optimize the selection of zeotropic refrigerants based on the specific requirements and conditions of the intended application, ensuring both environmental responsibility and efficient operation.

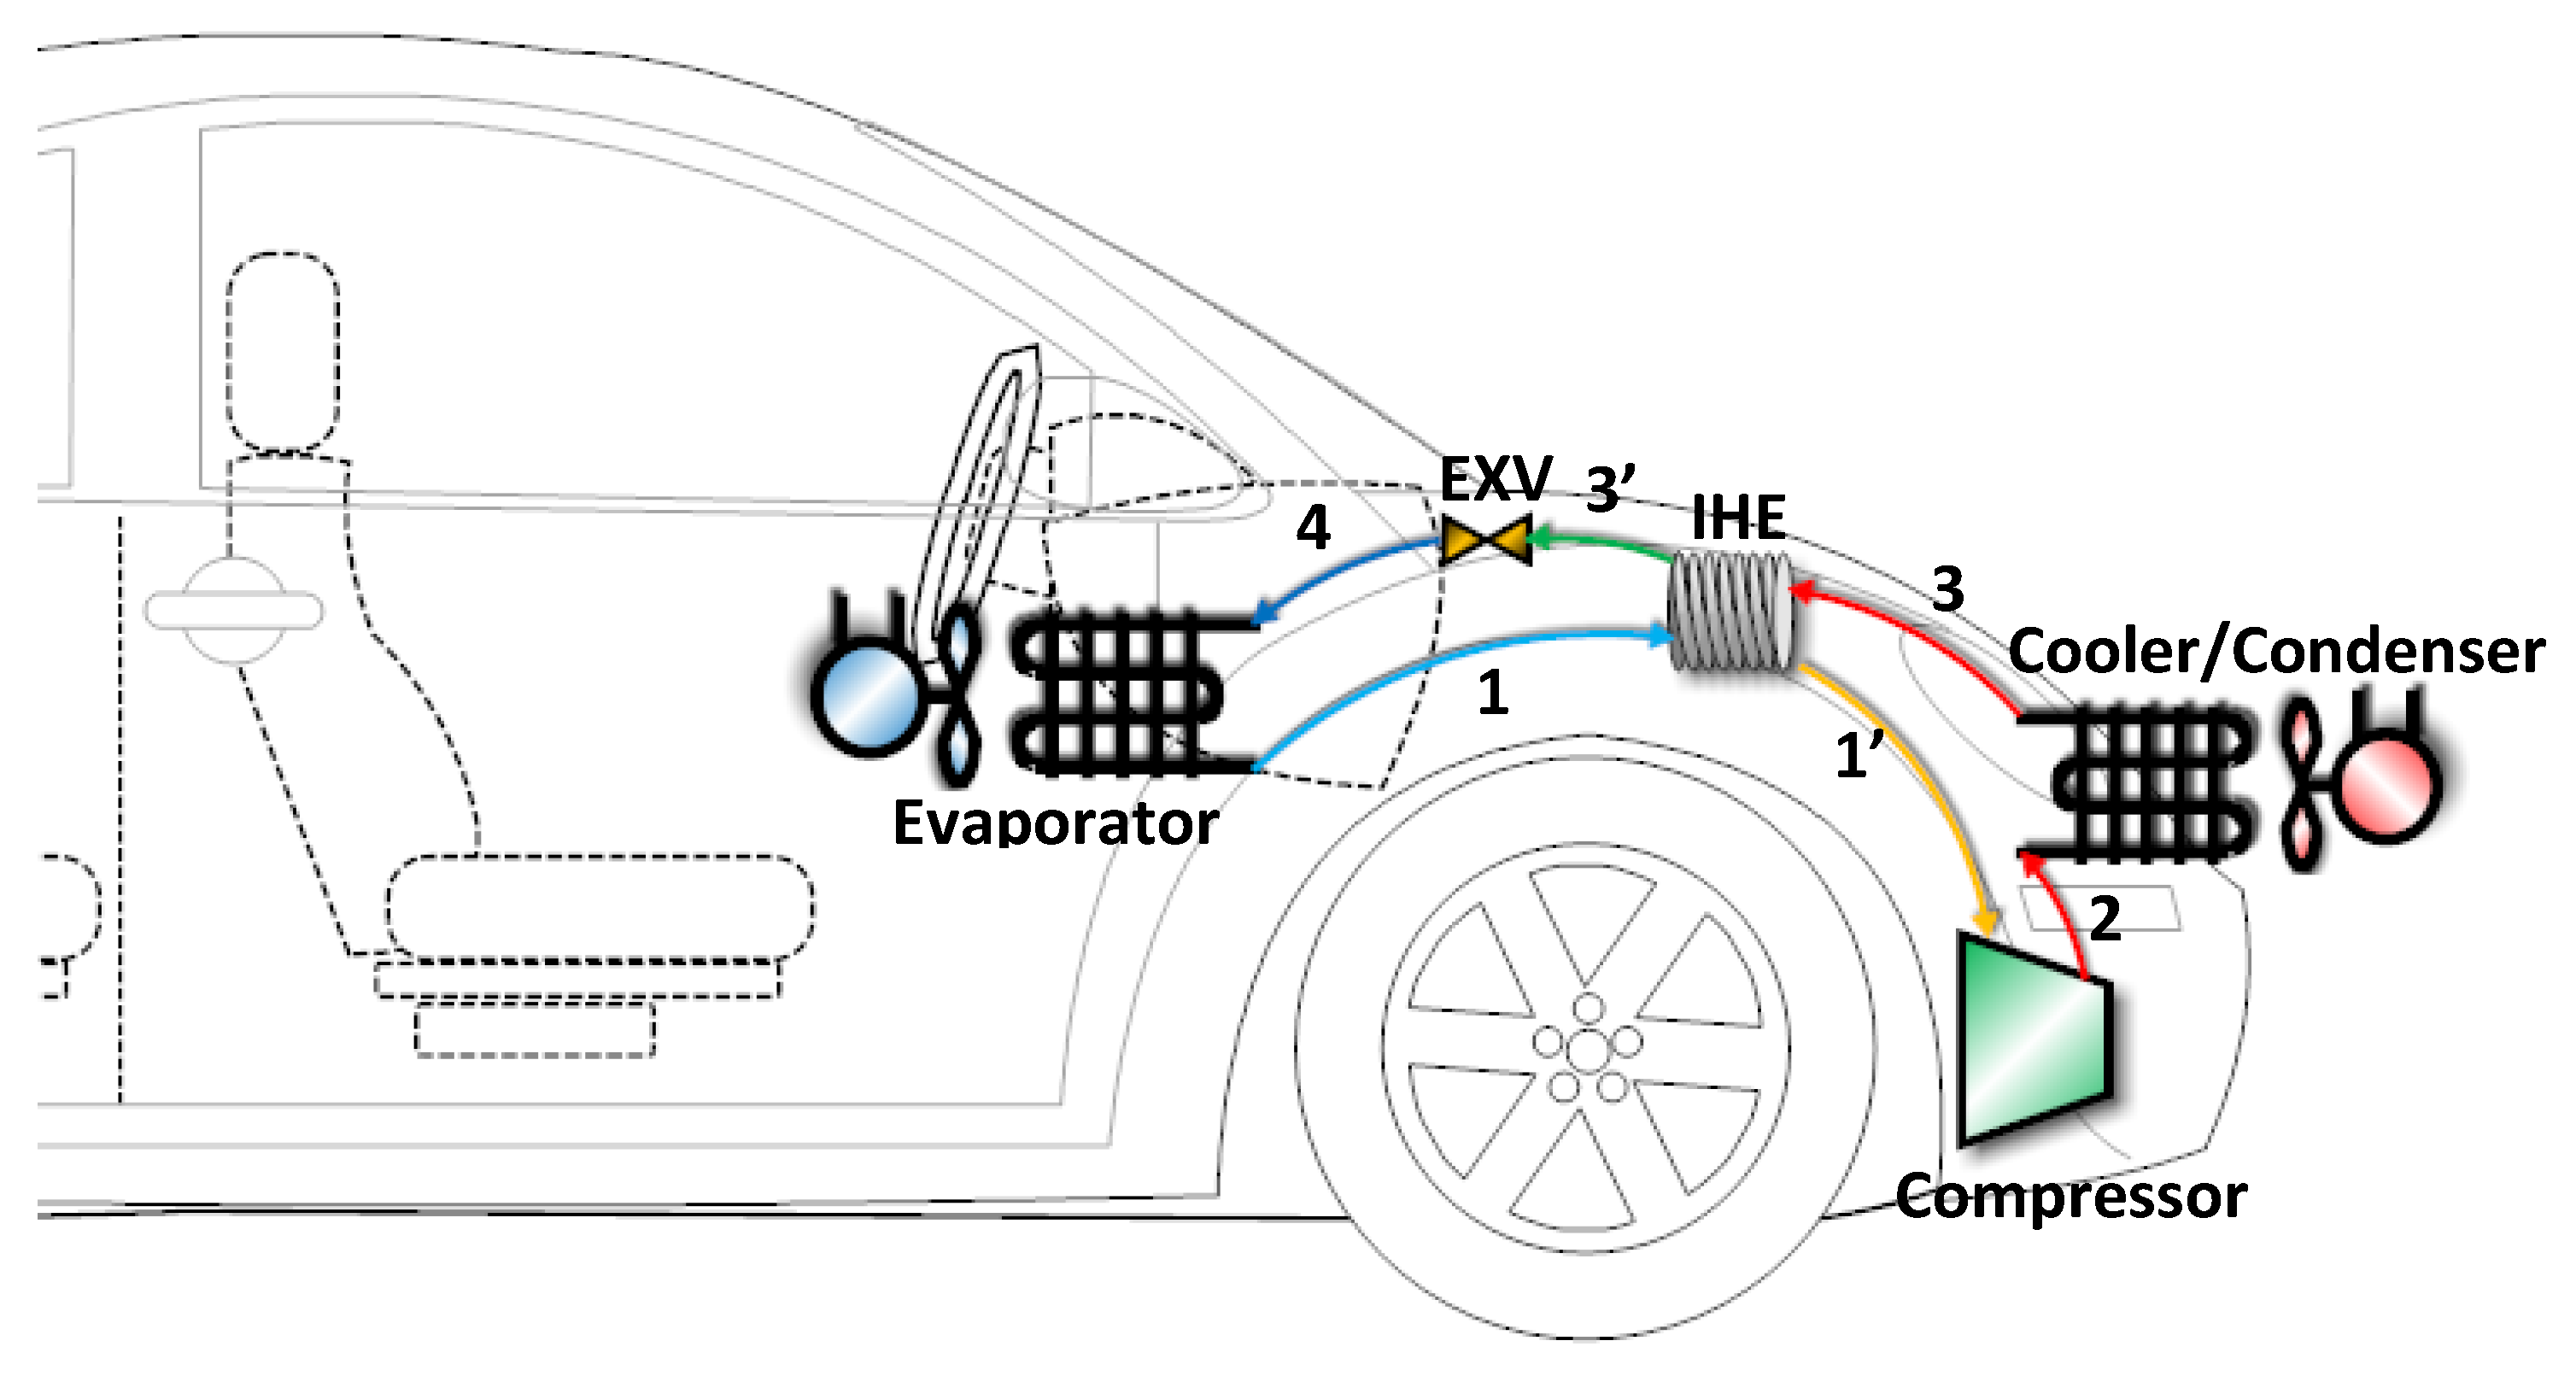
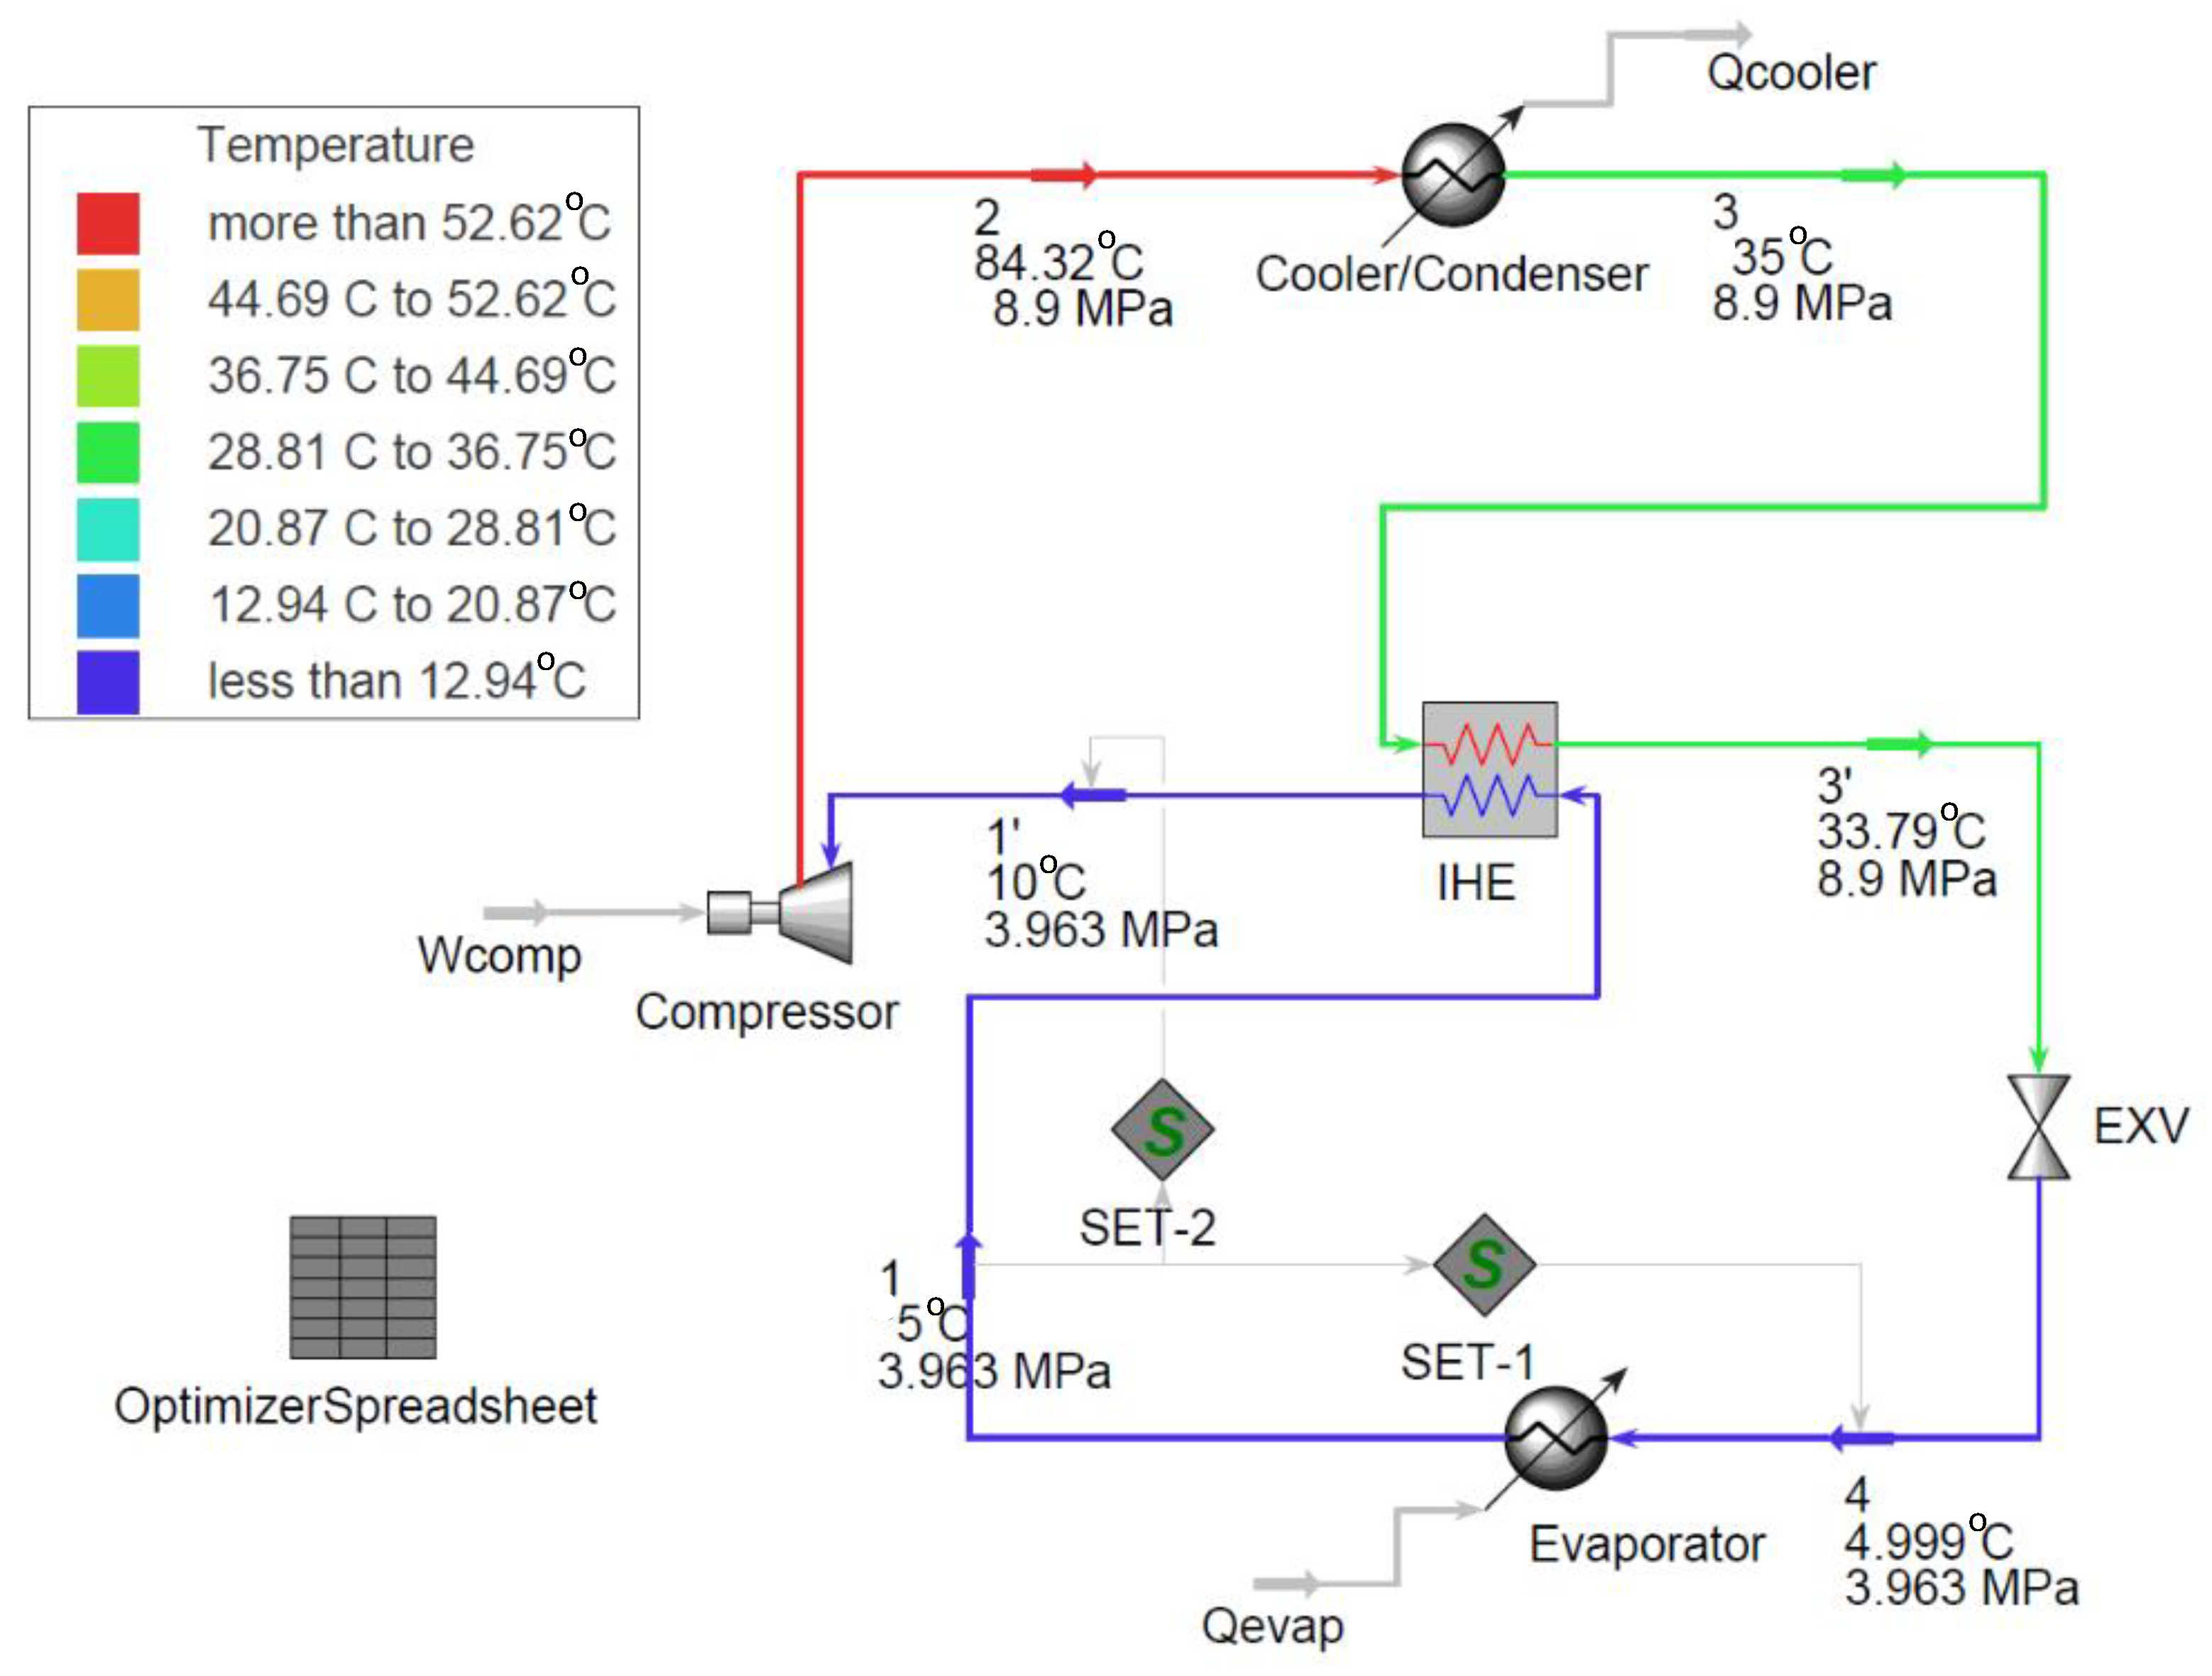
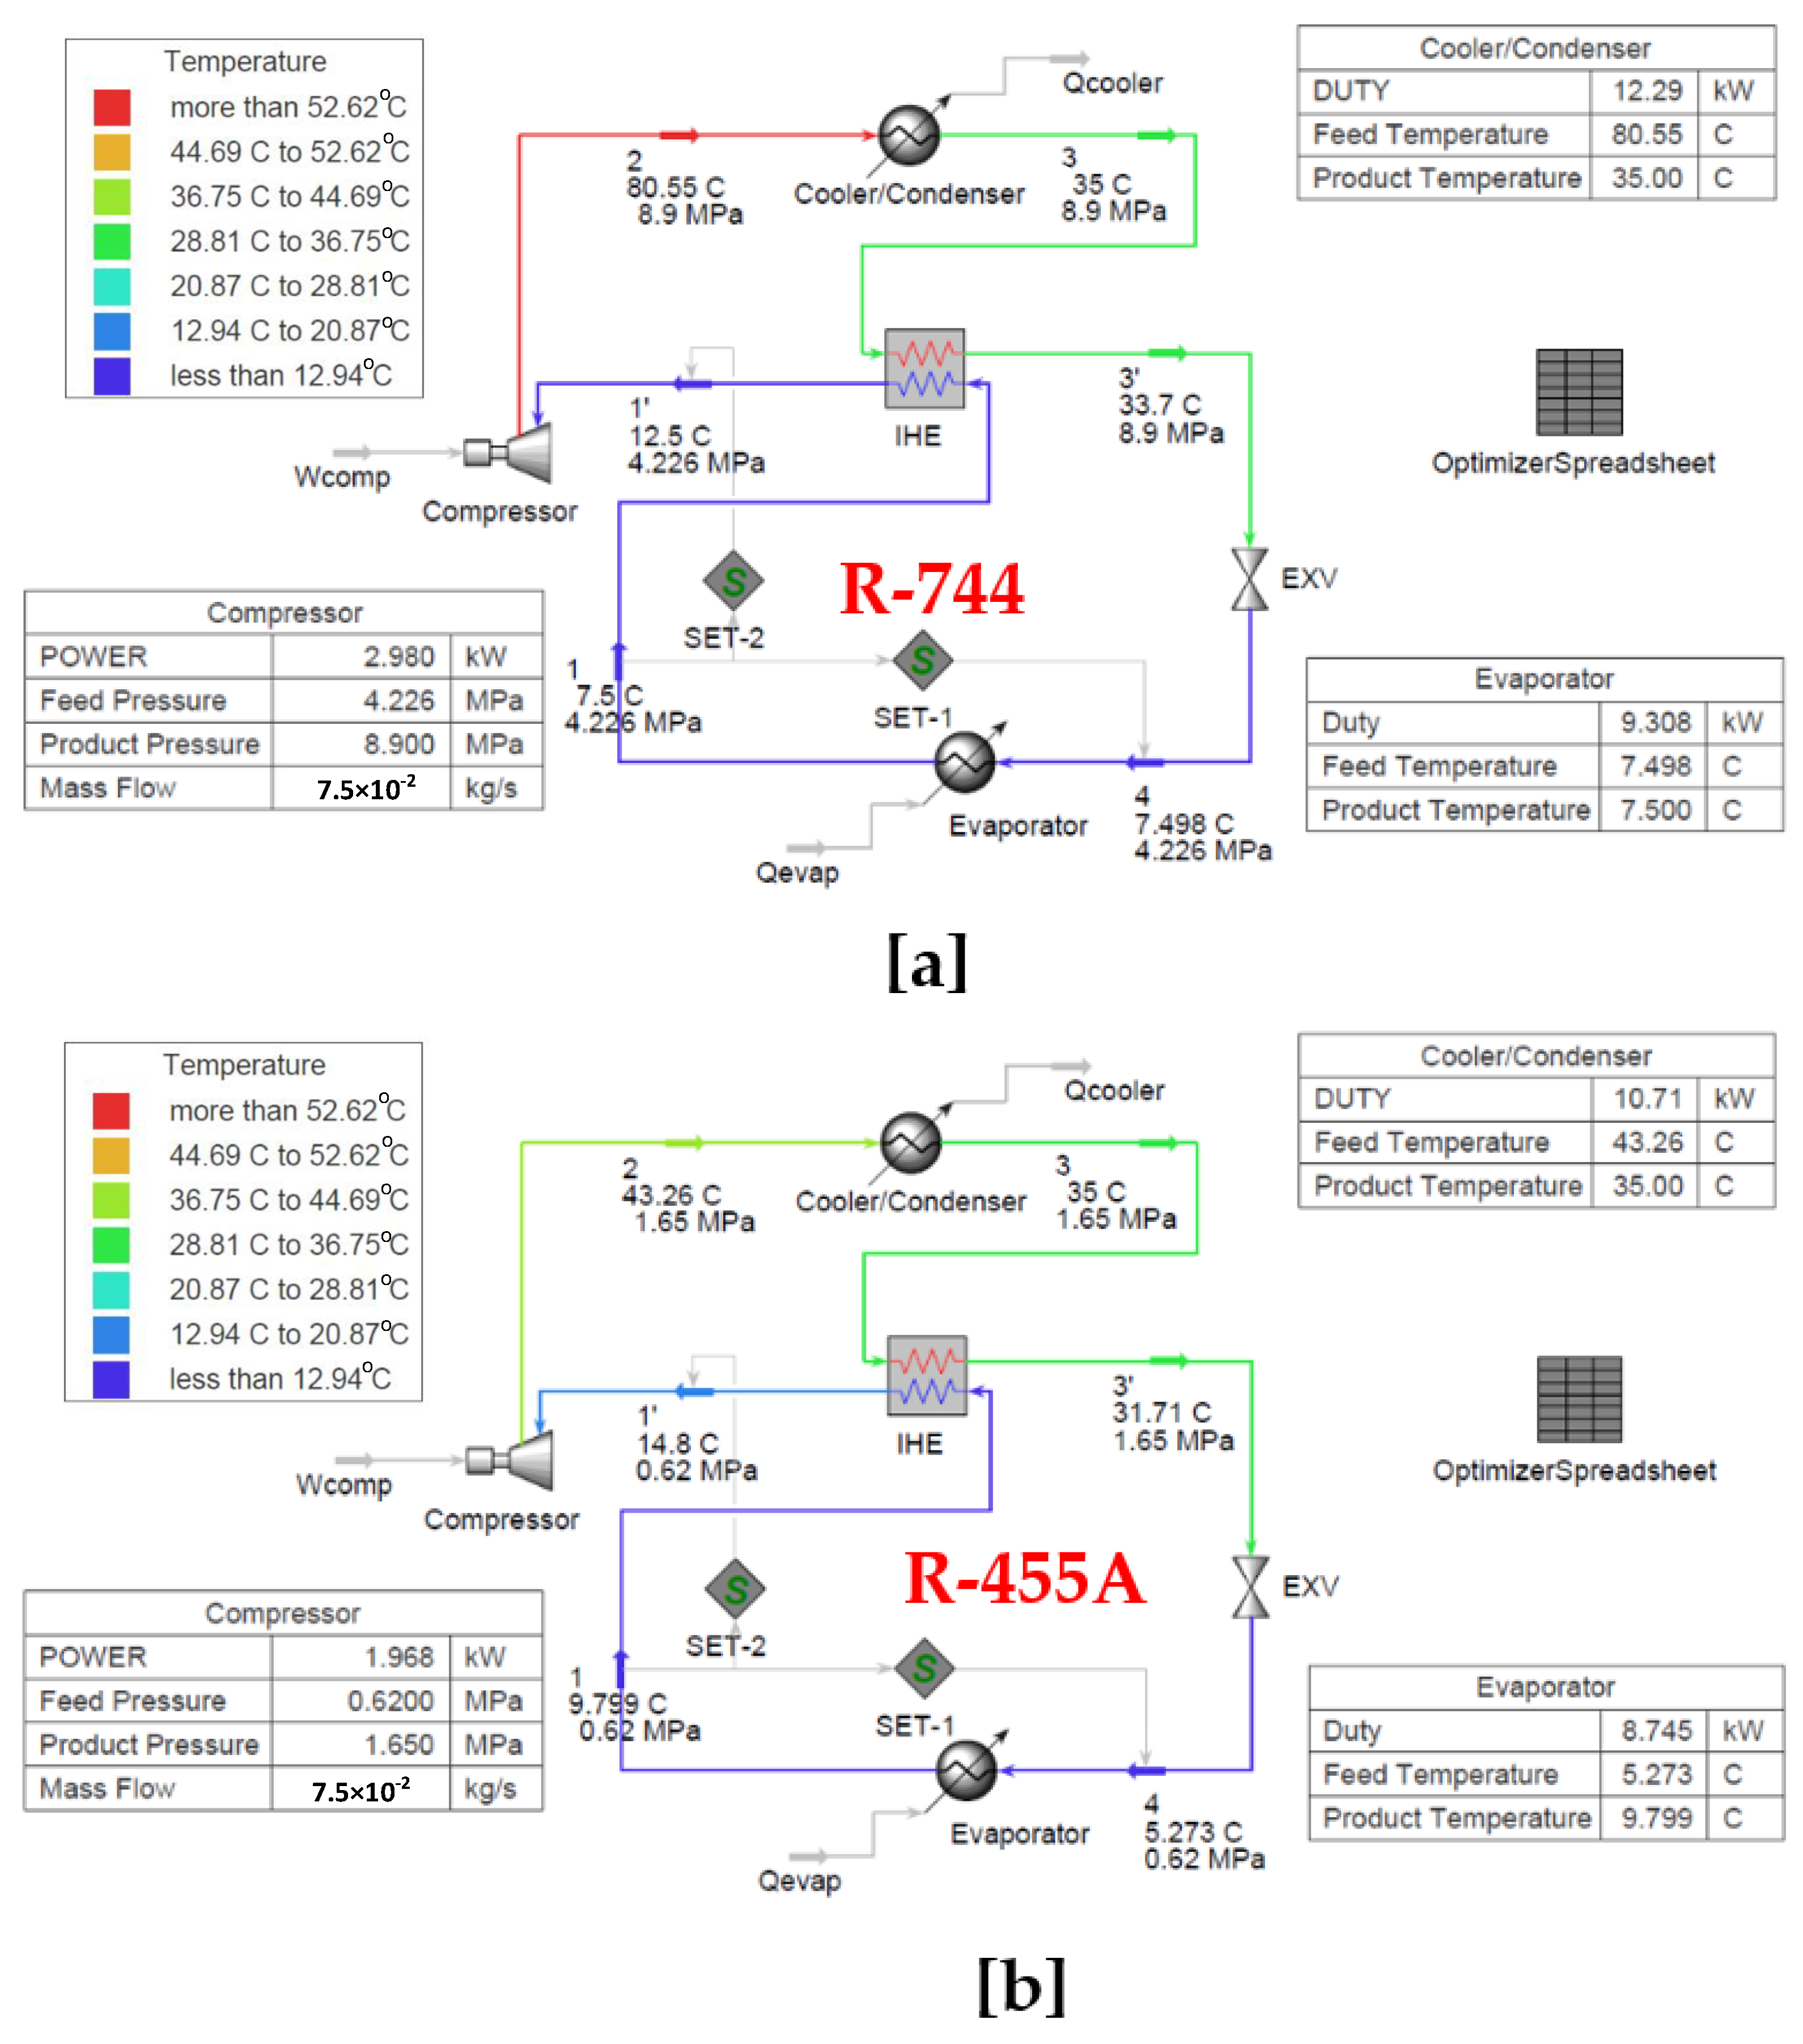
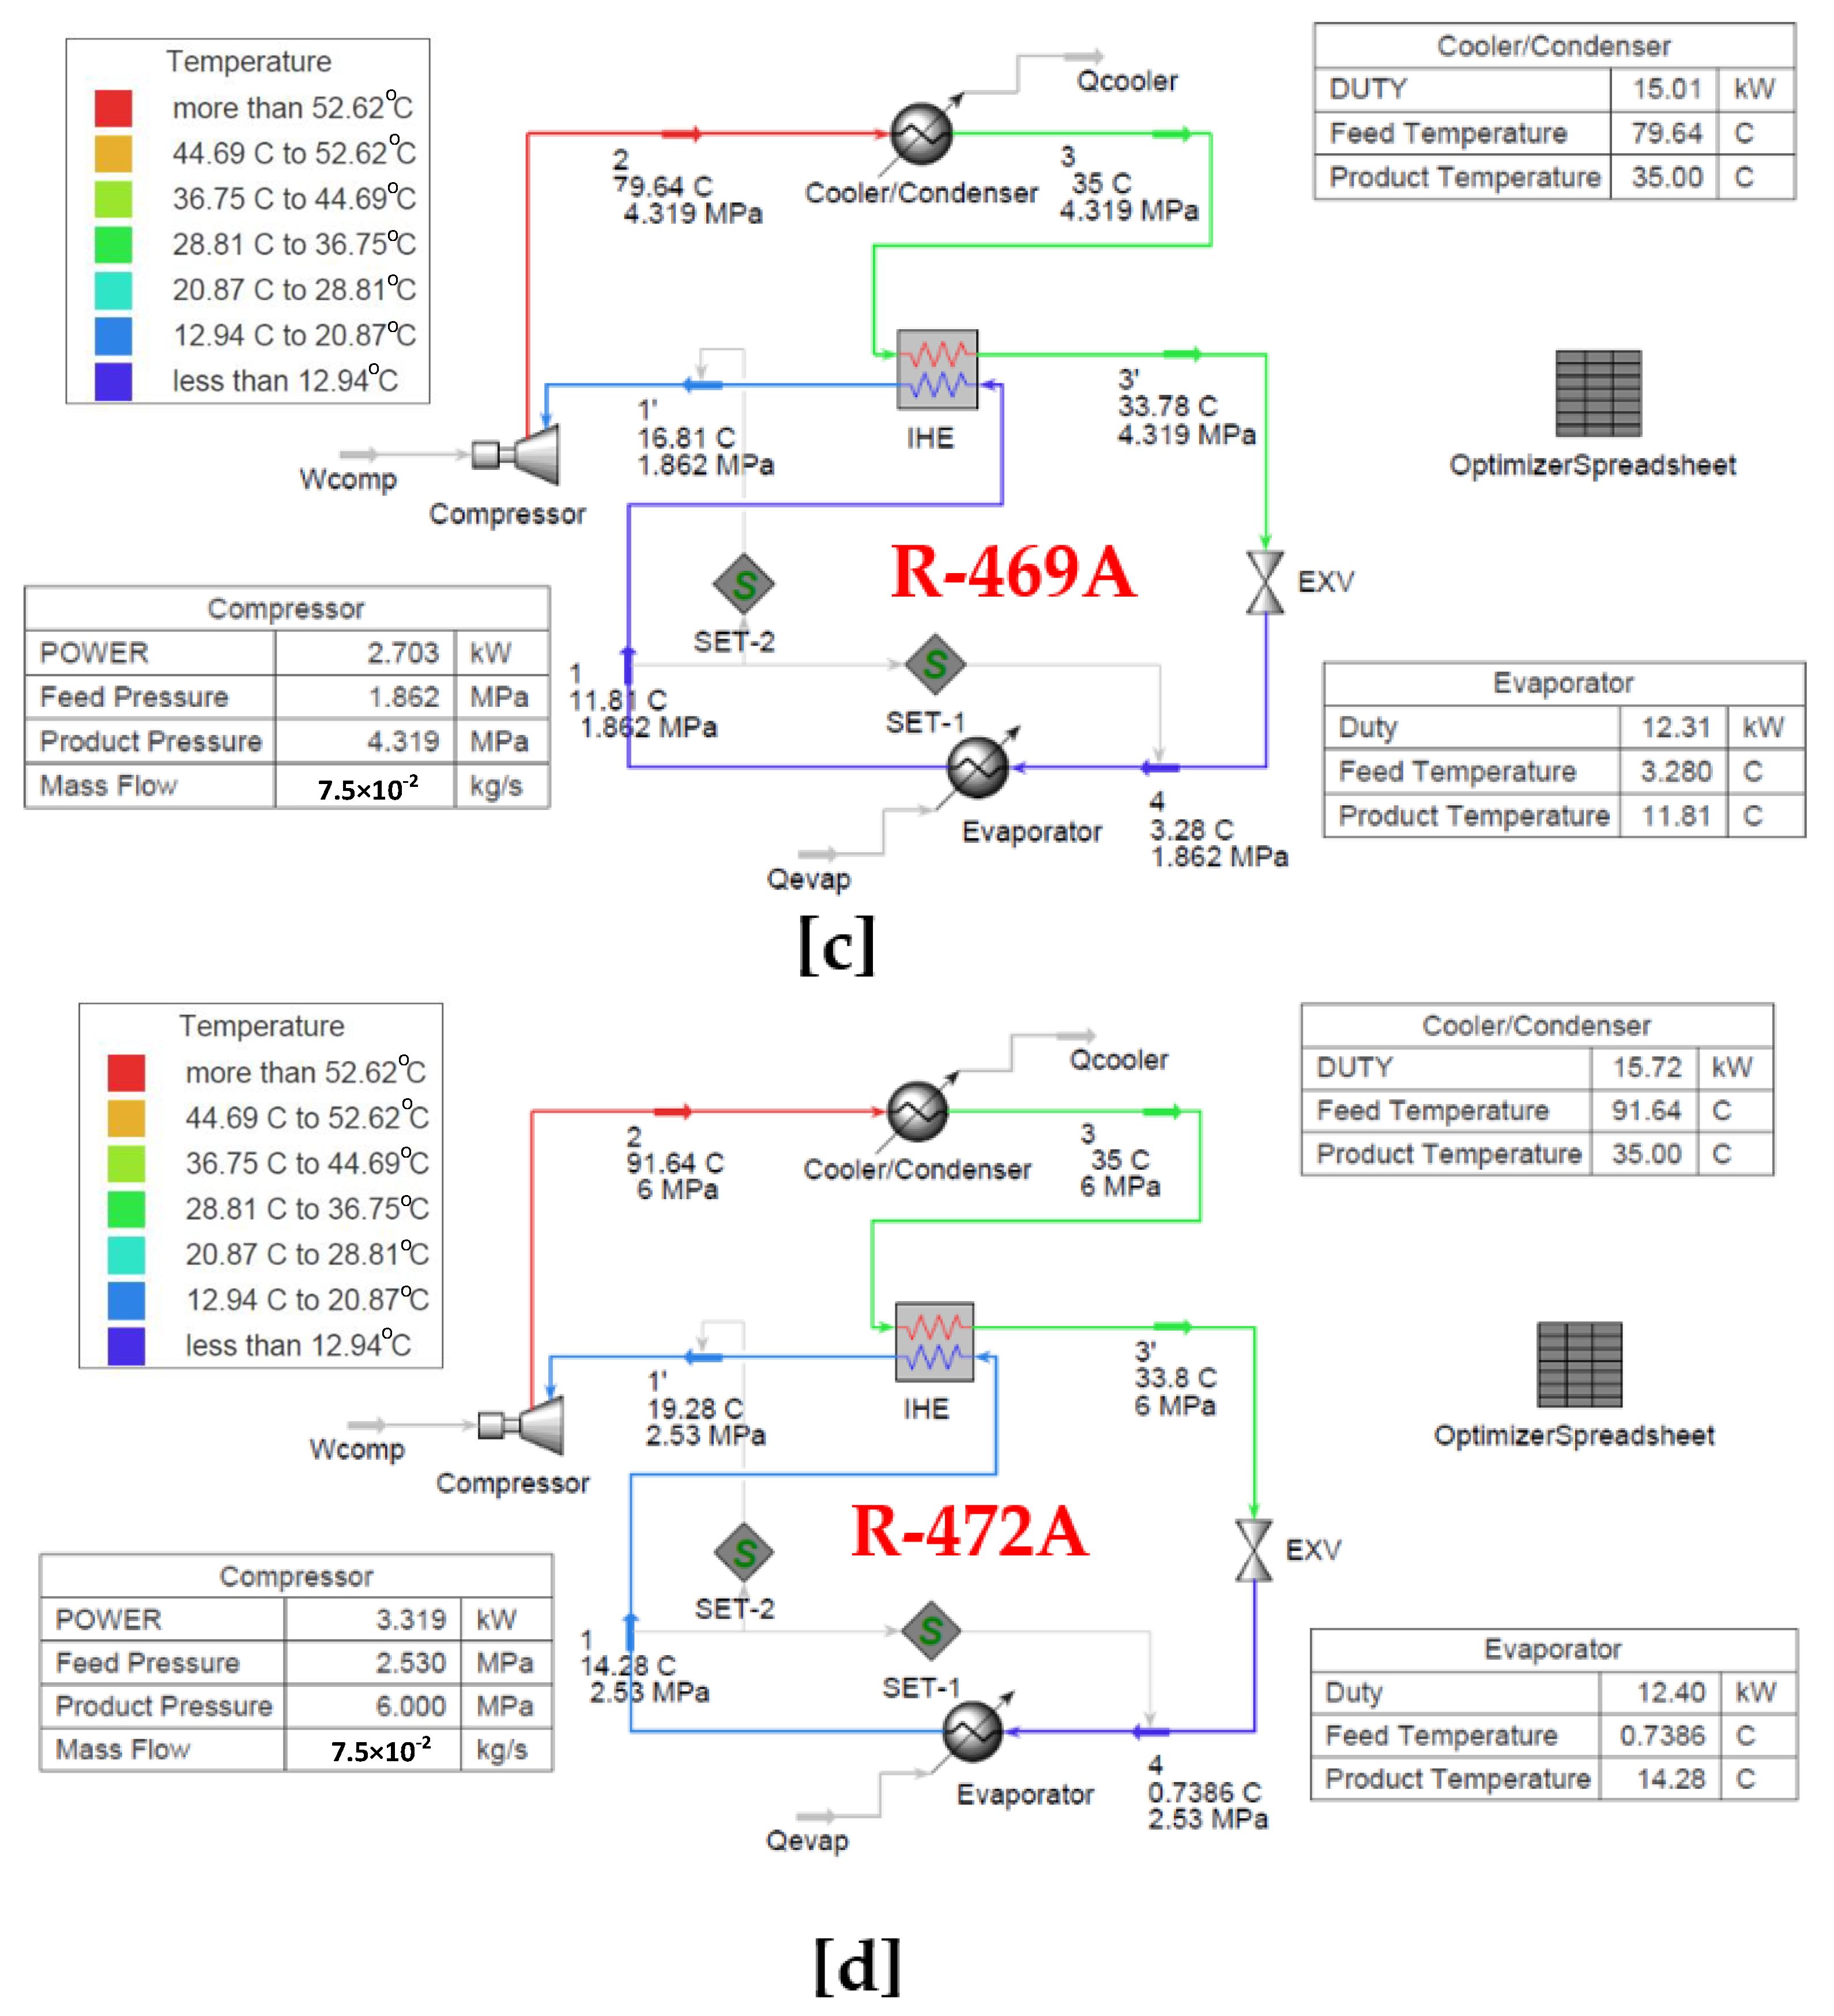
3. System Description

Examining and assessing the operational efficiency of automotive air conditioning systems (AACs) takes on crucial significance, particularly when taking into account the environmental and physical characteristics of recently studied alternative zeotropic refrigerants. The arrangement of the refrigeration cycle in AACs is depicted in Figure 2. This cycle encompasses key components: compressor, evaporator, expansion valve (EXV), cooler/condenser, and an internal heat exchanger (IHE). The sequence of operations for the cycle unfolds as follows:
  • From points 1 to 2: Non-isentropic compression.
  • From point 2 to 3: Heat release at constant pressure in the cooler/condenser.
  • From point 3 to 3’: Subcooling within the IHE.
  • From point 3’ to 4: Isenthalpic throttling at the EXV.
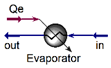
  • From point 4 to 1: Heat absorption at constant pressure within the evaporator.
  • From point 1 to 1’: Superheating within the IHE.
By adjusting crucial factors such as the condenser/cooler pressure, average evaporation temperature, temperature of the refrigerant coming out of the cooler/condenser, and mass flow rate of refrigerant, the cycle’s operational parameters may be precisely adjusted.
Based on the existing operational conditions, a transcritical model was created for situations when the critical pressure of the refrigerants is significantly lower than the cooler pressure. Due to the lack of phase transition beyond the critical point, a gas cooler is used in transcritical cycles in place of the condenser present in subcritical cycles. The differential between refrigerant temperature and pressure shows the necessity of maintaining both of these conditions above the critical point pressure. Even when the gas cooler outlet temperature remains constant, the cycle’s coefficient of performance changes due to the fluctuating operating pressures. In order to function at the most advantageous gas cooler pressure, the gas cooler within the simulation model was optimized [36].

4. Modeling and Assumptions

The evaluation of the thermodynamic performance of zeotropic substitute refrigerants within automotive air conditioning systems (AACs) was executed using Aspen HYSYS V 12.2 ® Software (AspenTech, Bedford, MA, USA) [37]. This simulation configuration is depicted in Figure 3. Aspen HYSYS holds a prominent position among both academic and engineering circles, owing to its dependability and proficiency in scrutinizing intricate industrial processes. The Aspen HYSYS platform’s intuitive layout makes it easier to optimize conceptual concepts and operational plans. The extensive collection of pre-built component models and property packages makes Aspen HYSYS a dependable process simulator. It enables the linkage of material and energy flows by facilitating the smooth integration of several modules. Consequently, it empowers the static and dynamic modeling of a diverse array of processes driven by chemical and hydrocarbon fluids. The Aspen HYSYS simulation model tailored for AAC systems harmoniously accommodates an assortment of energy components, encompassing compressors, expansion valves, heat exchangers, condensers, gas coolers, evaporators, and more.

4.1. System Assumptions

When assessing the performance of zeotropic substitutes in automotive air conditioning systems (AACs), the following assumptions were taken into account to achieve the combination of precision and simplicity within the current simulation:
  • The entire system operates under steady-state conditions.
  • Impacts related to kinetic energy and gravity have been omitted.
  • A reference situation is created with a 25 °C ambient temperature and a 101.325 kPa atmospheric pressure.
  • During the process of heat transfer, heat loss and pressure drop are not taken into account.
  • It is assumed that the refrigerant at the outlet of the evaporator is in a saturated state.
  • Specific operational parameters and values for modeling assumptions are outlined in Table 3 and Table 4.
These assumptions collectively facilitate a balance between precision and simplicity in the analysis of the performance of zeotropic alternative refrigerants within AAC systems.

4.2. Thermodynamic Model Analysis

The primary variables being examined within the system included compressor power, evaporator capacity, compressor discharge temperature, pressure ratio, exergy efficiency, and coefficient of performance (COP). These quantities were computed through the application of energy and exergy analyses to the automotive air conditioning system (AACs), considering various zeotropic substitute refrigerants. Moreover, the significance of validating the model was emphasized to guarantee the accuracy and dependability of the analysis of the AAC system. In-depth details regarding these matters are expounded upon in subsequent parts.

4.2.1. Analysis of Energy

The energy analysis for the modeled automotive air conditioning system (AAC) can be done using energy conservation for each component. This examination was conducted under a steady-state assumption, where kinetic and potential energy changes were deemed negligible. As a result, the capacity of the evaporator could be ascertained by applying the principle of energy conservation directly to the evaporator unit. In simpler terms, energy analysis entails the comprehensive tracking of energy inflows and outflows across the various components of the system, culminating in the computation of the evaporator’s operational capacity.
Q ˙ e v a p = m ˙ r ( h 1 h 4 ) ,
where  m ˙ r  represents the mass flow rate of the refrigerant and h signifies the specific enthalpy of the refrigerant. The ability of the cooler/condenser unit to transport heat can also be determined using this method.
Q ˙ c o o l e r / c o n d = m ˙ r ( h 2 h 3 )
Using the preceding equation and assuming that the compression is done adiabatically, it is possible to determine the amount of energy used by the compressor during the compression of the refrigerant:
W ˙ c o m p = m ˙ r ( h 2 h 1 ) = m ˙ r ( h 2 , s h 1 ) / η i s ,
where ηis represents the compressor isentropic efficiency, defined as follows:
η i s = h 2 , s h 1 h 2 h 1
The specific enthalpy of the refrigerant at the compressor output during isentropic compression is h2s, while the actual compression enthalpy is h2.
The pressure ratio of the compressor is described as follows:
γ = P 2 P 1 ,
where γ represents the pressure ratio of the compressor, P2 indicates the discharge pressure of the compressor in MPa, and P1′ corresponds to the compressor suction pressure.
Performance coefficient of the cycle is as follows:
C O P = Q ˙ e v a p W ˙ c o m p

4.2.2. Exergy Analysis

Exergy, in contrast to energy, is not preserved and is lost during both useful and wasteful operations. Understanding thermal exergy analysis will help you locate and quantify thermodynamic inefficiencies. Applying the generalized steady-state exergy rate balance [38] to automotive air conditioning system (AAC) components achieves this:
I ˙ = 1 T 0 T j Q ˙ j W ˙ c v + E ˙ i n E ˙ o u t
The equation uses “in” and “out” for inlet and outlet. T0 denotes the ambient temperature in a dead condition,  Q ˙ j  represents the boundary heat transfer rate, Tj is the boundary temperature,  W ˙ c v  represents control volume work,  I ˙  represents the flow exergy rate within the control volume.
The following expression describes the system’s exergy rate at state point i:
E ˙ i = m ˙ i [ ( h i h 0 ) T 0 ( s i s 0 ) ] ,
where s is refrigerant specific entropy and “0” is the reference (dead) state.
The compressor loses exergy due to internal heat transfer, gas-moving part friction, and moving part friction. Under adiabatic compression, the exergy rate balance equation gives the compressor’s exergy destruction rate:
I ˙ c o m p = E ˙ 1 E ˙ 2 + W ˙ c o m p
Condenser/cooler exergy destruction can be calculated using this formula:
I ˙ C o o l e r / c o n d . = E ˙ 2 E ˙ 3 1 T o T r ( c o o l e r / c o n d . ) , o u t Q · c o o l e r / c o n d ,
where Tr is the temperature of the refrigerant.
The following calculation can be used to calculate the amount of energy lost due to internal heat transfer between the refrigerant streams within the internal heat exchanger under the supposition that no heat is transferred to or from the environment:
I ˙ I H E = E ˙ 3 E ˙ 3 + E ˙ 1 E ˙ 1
Exergy destruction in the expansion valve due to internal friction and fast pressure decrease can be calculated by neglecting heat transfer:
I ˙ E X V = E ˙ 3 E ˙ 4
The following equation calculates evaporator exergy destruction due to heat transfer among the refrigerant and air streams:
I ˙ e v a p = E ˙ 4 E ˙ 1 + 1 T o T r e v a p , o u t Q · e v a p
All of the exergy destructions in each system component is added up to compute the overall rate of exergy destruction throughout the automotive air conditioning system (AACs) cycle:
I ˙ t o t a l = I ˙ c o m p + I ˙ c o o l e r / c o n d . + I ˙ I H E + I ˙ E X V + I ˙ e v a p
Last, the following exergetic efficiency statement can assess automotive air conditioning systems (AACs):
η e x = 1 I ˙ t o t a l W ˙ c o m p

4.2.3. Model Validation

Through a model validation approach, simulation model accuracy for the automobile air conditioning system (AACs), constructed using Aspen HYSYS, was verified. The simulation model was verified using Rigola et al.’s [39] boundary and operational parameters for transcritical CO2 refrigeration. Table 5 compares current model outputs to Rigola et al. [39] experimental results. In Table 5, the biggest relative error between the current model and Rigola et al. [39]’s experimental values for compressor power, Wcomp, and coefficient of performance, COP, was 10.4%. This degree of agreement highlighted the simulation model procedure used in this work, which made use of Aspen HYSYS software as being sufficiently accurate.

5. Results and Discussion

This study aims to suggest air conditioning system blends for vehicles that are both environmentally friendly and high-performing. Aspen HYSYS, the computer simulation software, is used to assess and compare the thermodynamic exergy and energy attributes of an automobile air conditioning (AAC) system utilizing different refrigerants: zeotropic refrigerants vs. carbon dioxide (R-744). The study examines how various factors, such as average evaporator temperature, condenser/cooler pressure, refrigerant mass flow rate, and cooler/condenser outlet temperature, influence key performance parameters of the AAC system. These parameters include compressor discharge temperature, evaporator capacity, cycle coefficient of performance (COP), compressor power, compressor pressure ratio, and exergy efficiency.

5.1. Environmental Effects of Studied Zeotropic Refrigerants

R-134a, R-32, R-125, R-1234yf, and R-744 have all been connected to adverse impacts on ozone layer depletion despite the fact that R134a and R32 have a favorable impact on global warming while R-1234yf and R-744 do not. Given that they have the ability to enhance refrigeration cycles, this is vital to remember. Table 1 summarizes the GWP and ODP of pure refrigerant components to fully examine the environmental impacts of the suggested refrigerant blends [40,41]. Table 2 shows how Equations (16) and (17) are applied to Table 1 data to evaluate the environmental impact of the suggested zeotropic refrigerants.
O D P Z e o t r o p e = i = 1 n w p u r e , i O D P p u r e , i
G W P Z e o t r o p e = i = 1 n w p u r e , i G W P p u r e , i
The calculations employ the mass fraction of pure component i in a zeotropic mixture. Table 2 shows the anticipated GWP and ODP of zeotropic refrigerants. The fact that all examined zeotropes have zero ODPs since their component ODPs are zero is notable. R-455A has a low GWP level, while R-469A has a high GWP level, according to the classifications set forth by UNIP (2019) [42] for GWP values over a 100-year timeframe. On the other hand, based on these classifications, R-472A is assigned a medium GWP level.

5.2. Parametric Studies

The determination of the optimal cooler/condenser pressure constitutes a pivotal endeavor in the domain of vapor compression refrigeration cycles, grounded in the pursuit of attaining peak efficiency. This critical pressure point is ascertained through a meticulous analysis centered on maximizing the coefficient of performance (COP), a fundamental metric indicative of the cycle’s effectiveness. By systematically exploring the intricate balance between heat transfer, thermodynamic interactions, and operational pressures, researchers strive to pinpoint the specific pressure value at which the cycle achieves its highest COP. This endeavor inherently involves a comprehensive examination of heat rejection, utilization of energy, and overall system performance, culminating in the identification of the cooler/condenser pressure that optimally enhances the refrigeration cycle’s efficiency and thermal performance.
Since the phase change does not happen past the critical point, a gas cooler is used in place of a condenser in transcritical cycles. Over the critical pressure, the temperature and pressure of the refrigerant are no longer related and must be described separately. The condenser/cooler output temperature and operating pressures affect the cycle’s COP. Figure 4 shows the optimal condenser/cooler pressure, P2, for the investigated zeotropic refrigerants R-455A, R-469A, and R-472A compared with R-744 and based on achieving the cycle’s maximum COP. The comparative operating parameters involve tevap at 7.5 °C, t3 at 35 °C, and a mass flow rate (r) of 0.075 kg/s. As seen in the figure, the highest COPs may be achieved using R744, R455A, R469A, and R472A are 3.1, 4.25, 4.3, and 5.48, respectively. For R744, R455A, R-469A, and R-472A, the optimum pressures are 8.9, 1.65, 4.319, and 6 MPa, respectively. The condenser pressure significantly influences key parameters in a refrigeration system. A higher condenser pressure enhances evaporator capacity by increasing the temperature difference between the condenser and evaporator, allowing for more heat absorption. However, it also raises compressor discharge temperatures, posing potential overheating risks. Conversely, lower condenser pressure reduces evaporator efficiency and may decrease the system COP due to reduced temperature lift. Achieving an optimal condenser pressure is crucial for balancing these factors and ensuring efficient heat transfer, compressor reliability, and overall system performance in refrigeration systems. Therefore, the designer must carefully manage the condenser pressure to strike the right balance for optimal efficiency and longevity.

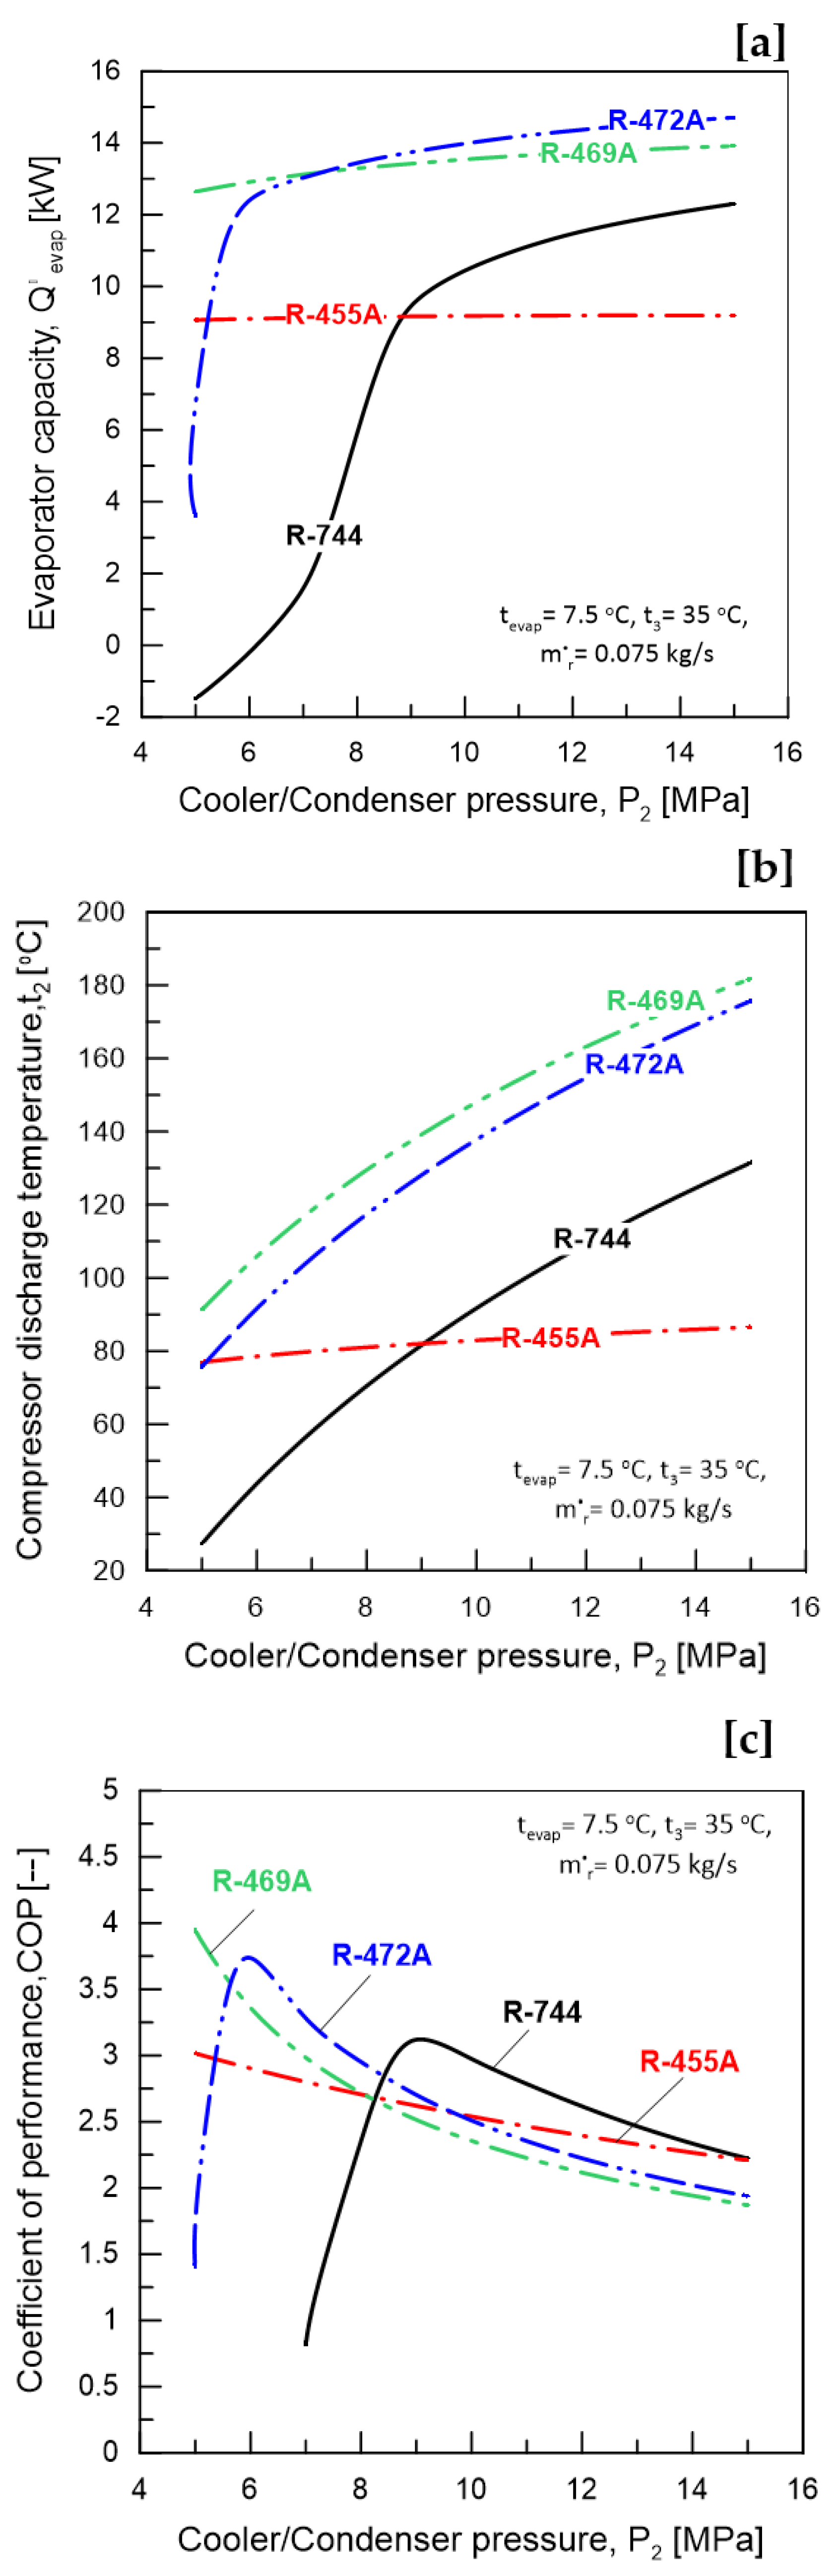
5.2.1. Effect of Condenser/Cooler Pressure, P2

Condenser/cooler pressure, P2, affects evaporator capacity (Qevap), compressor discharge temperature (t2), and coefficient of performance (COP), shown in Figure 5. Figure 5a shows that Qevap increases dramatically for R744 and R472A at P2 ≤ 8.9 MPa and P2 ≤ 7 MPa, but it remains almost constant for R455A and R469A as P2 increases. This phenomenon is attributed to the variation in enthalpy of the refrigerant as it passes through the evaporator. For R744 and R472A, at the evaporator’s intake, the refrigerant’s enthalpy is lowest, while it remains relatively steady for R455A and R469A as the pressure (P2) increases. This dissimilarity arises from the fact that the refrigeration cycles of R744 and R472A are transcritical, employing a gas cooler in place of a condenser, whereas the cycles of R455A and R469A are subcritical and employ a condenser. In addition, as shown in Figure 5a for R744 refrigerant, the lowest pressure of the cooler/condenser can be selected to operate the cycle of refrigeration, which should be greater than 6 MPa because the pressure of the condenser/cooler must be higher than the evaporator pressure at 7.5 °C. R472A has the highest Qevap of the four refrigerant blends, while R455A has a lower Qevap at a higher P2.
Figure 5b illustrates the compressor discharge temperature (t2); it is observed that t2 increases with a rise in the condenser/cooler pressure (P2) for R744, R455A, R469A, and R472A. The pressure–temperature link established by thermodynamics and the properties of the thermodynamic cycle account for this behavior. In addition, as shown in Figure 5b, the R469A has a height compressor discharge temperature compared to the other three referents. Figure 5c illustrate the effect of cooler/condenser pressure (P2) on the COP. For R744 and R472A, it is evident that with an increase in the cooler/condenser pressure, the COP experiences an initial rise, reaching its peak around P2 = 8.9 and P2 = 6.1 MPa for R744 and R472A, respectively, and subsequently begins to decrease. This trend is primarily attributed to the predominant effect of the rise in Qevap, which outweighs the rise in Wcomp until P2 ≤ 8.9 and P2 ≤ 6.1 MPa for R744 and R472A, respectively. After P2 exceeds 8.9 MPa for R744 and 6.1 MPa for R472A, the scenario reverses, leading the COP to inversely correlate with Qevap and Wcomp. R455A and R469A have lower COPs with increasing P2. This decrease is mostly due to Wcomp increasing and Qevap being unchanged when P2 grows.
R744, R455A, R469A, and R472A have maximum Qevap and COP values of 12.2, 9, 13.9, and 14.5 kW and 3.15, 3, 3.95, and 3.5. In addition, at P2 = 15 MPa, R472A has a 19% Qevap improvement over R744, while R744 has a 36% improvement over R455A. R455A and R469A’s COP decreased by 27% and 55%, respectively, within P2. The optimal condenser pressure is essential for achieving the maximum efficiency in a refrigeration system. Therefore, the balance of the condenser pressure should be taken into account in order to ensure adequate heat transfer in the evaporator, manage compressor discharge temperatures, and optimize the system’s overall performance. The relationship between condenser pressure and various system parameters underscores the importance of the proper design and operation for efficient and reliable refrigeration systems.

5.2.2. Effect of Average Evaporator Temperature, tevap

The maximum Qevap and COP for R744, R455A, R469A, and R472A are 12.2, 9, 13.9, and 14.5 kW and 3.15, 3, 3.95, and 3.5. At P2 = 15 MPa, R472A enhances Qevap by 19% compared to R744, whereas R744 enhances it by 36% compared to R455A. Additionally, R455A and R469A’s COP decreased by 27% and 55%, respectively, during P2. As shown in Figure 6a,b, it is noticeable that, for all the examined refrigerants, compressor power (Wcomp) and compressor pressure ratio (γ) decline with increasing tevap. This pattern arises from the reduction in compression work at higher evaporator temperatures while keeping the cooler/condenser pressure (P2) constant. The referent R455A has the lowest compressor power (Wcomp) and higher compressor pressure ratio (γ) compared to all refrigerant blends. Figure 6c shows that increasing tevap decreases the exergy efficiency (ηex).
Maximum Wcomp and γ values for R744, R455A, R469A, and R472A are 3.3, 2.15, 3, and 3.65 kW and 2.25, 2.9, 2.5, and 2.58, respectively. R744, R469A, and R472A have 53.5, 39.5, and 69.8% higher compressor power (Wcomp) than R455A at P2 = 5 MPa. In P2, R744, R455A, R469A, and R472A’s Wcomp decreases by 36.6, 30, 40, and 35.6%, respectively.
The average evaporator temperature (tevap) plays a pivotal role in shaping the performance of a refrigeration system. A higher tevap enhances the evaporator capacity by increasing the temperature differential, promoting efficient heat transfer. This elevation, however, concurrently raises compressor discharge temperatures, necessitating a delicate balance to prevent potential overheating. Conversely, a lower tevap reduces the temperature lift, potentially diminishing evaporator capacity and system efficiency. Striking an optimal tevap is crucial for achieving an efficient coefficient of performance (COP), as it influences the balance between heat transfer effectiveness and compressor work input. The management of the tevap is essentially required to ensure a well-calibrated system, optimizing heat absorption, minimizing discharge temperature risks, and ultimately maximizing the overall efficiency of the refrigeration system.

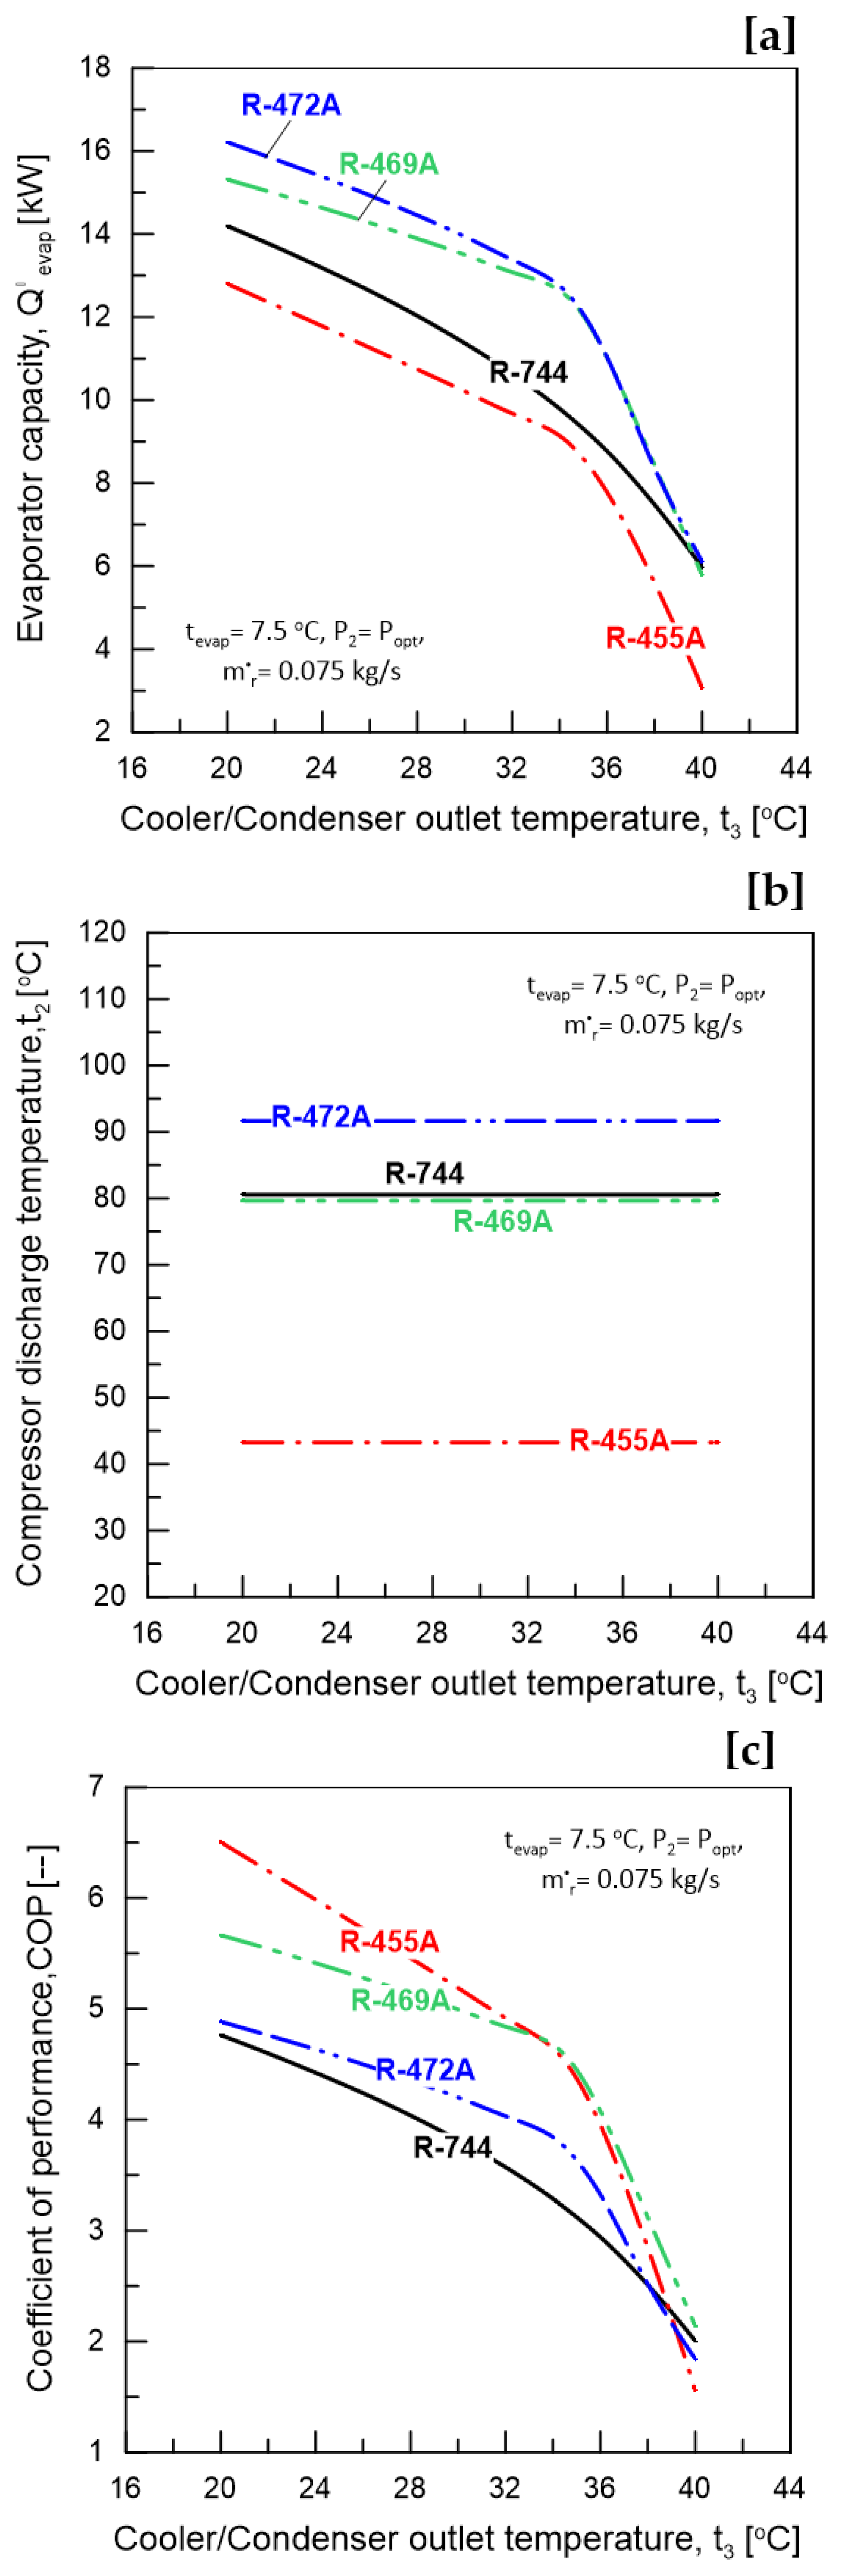
5.2.3. Effect of Condenser/Cooler Outlet Temperature, t3

Figure 7 illustrates the influence of the outlet temperature (t3) of the cooler/condenser on several output parameters of AACs (adsorption air conditioners). These parameters include evaporator capacity (Qevap), compressor discharge temperature (t2), and the coefficient of the COP, all assessed. The analysis covers four refrigerant blends: R744, R455A, R469A, and R472A. As demonstrated in Figure 7a,c, for all the refrigerants studied, an increase in the cooler/condenser outlet temperature (t3) results in a decrease in both the evaporator capacity (Qevap) and coefficient of performance (COP). When t3 exceeds 35 °C, this decline accelerates. As t3 grows, the difference in refrigerant enthalpy throughout the evaporator decreases, but compression work remains constant. In contrast, Figure 7b indicates that the compressor discharge temperature (t2) is not significantly affected by variations in the cooler/condenser outlet temperature (t3). This observation holds true due to the fixed values of the P2 and tevap at their optimal levels of 7.5 °C and Popt, respectively.
When the cooler/condenser outlet temperature (t3) is 20 °C, R744, R455A, R469A, and R472A have the highest Qevap values at 14.1, 12.9, 15.2, and 16.2 kW. For R744, R455A, R469A, and R472A, the Qevap decreases by 57%, 77%, 62%, and 64% across the t3 range. At t3 = 20 °C, R744, R455A, R469A, and R472A have peak COP values of 4.8, 6.5, 5.7, and 4.9. In the tested t3 range, R744, R455A, R469A, and R472A have COP decreases of 58.3%, 77%, 65%, and 63%. Compared to R744 at t3 = 20 °C, R455A, R469A, and R472A increase the COP by 35.4%, 18.75%, and 2%. Balancing the condenser/cooler outlet temperature is crucial for optimizing the performance of a refrigeration system. Therefore, the designer should carefully manage this parameter to ensure efficient heat transfer in the evaporator, mitigate the risk of compressor discharge temperatures exceeding safe limits, and maximize the overall coefficient of performance. The intricate relationship between the condenser/cooler outlet temperature and these parameters underscores the importance of precise system design and operation to achieve optimal efficiency and reliability in refrigeration systems.

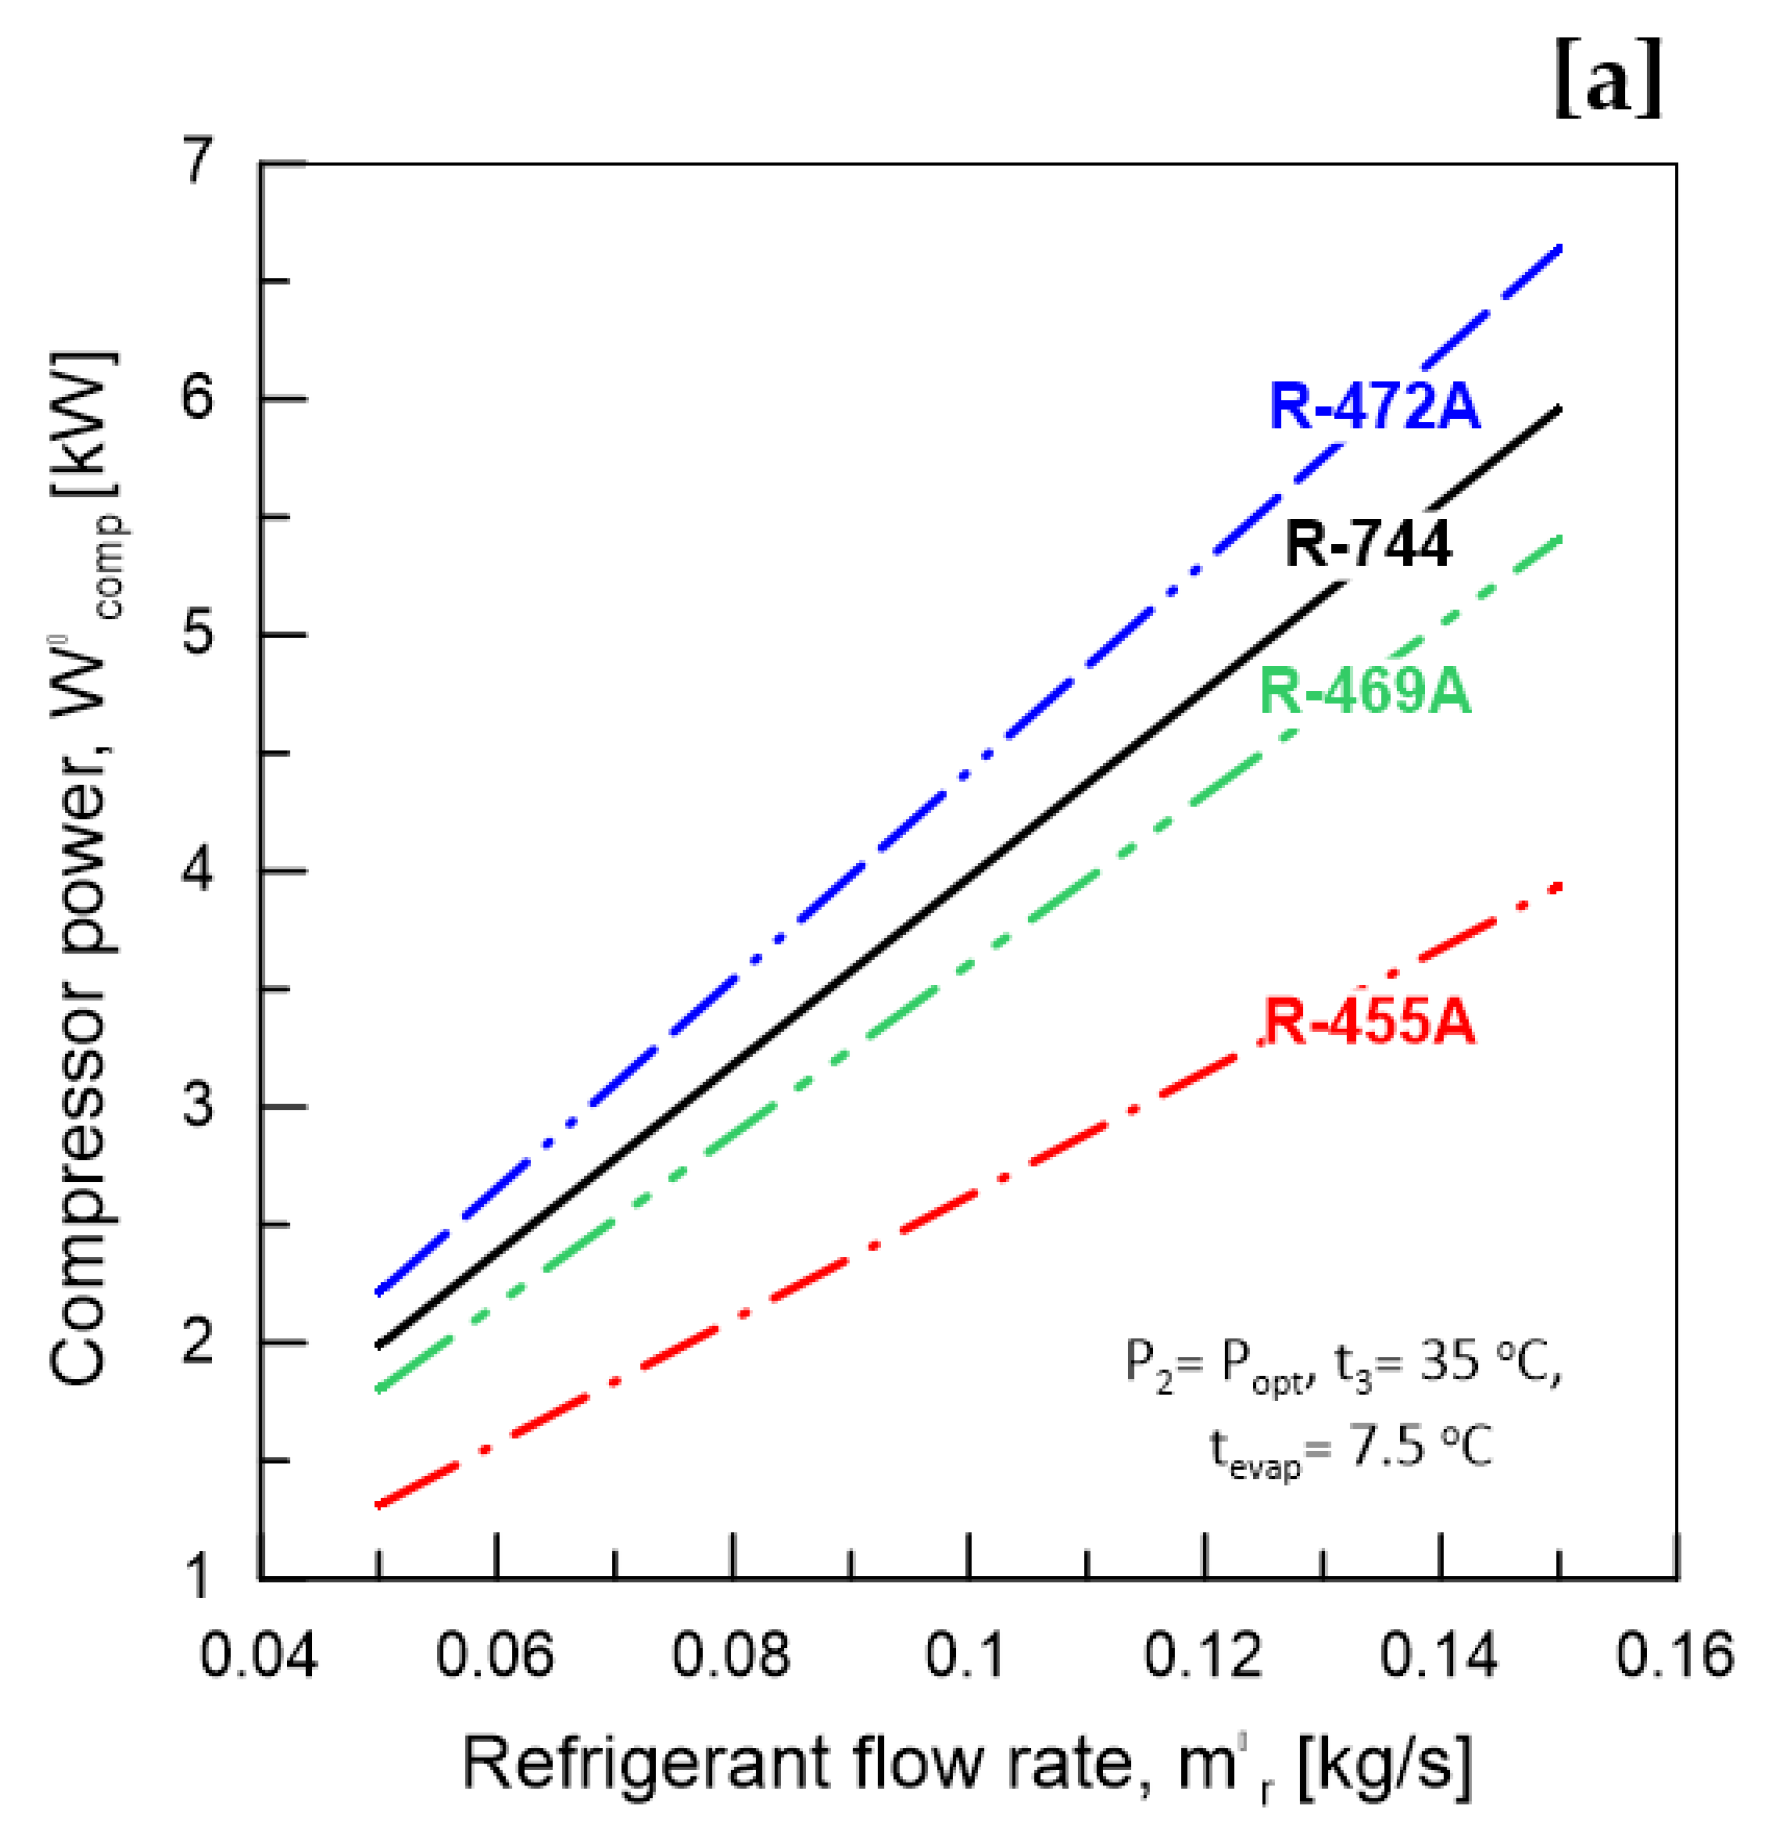
5.2.4. Effect of Refrigerant Mass Flow Rate, mr

Figure 8 depicts the effect of the refrigerant mass flow rate (r) on several performance parameters: compressor power (Wcomp), compressor pressure ratio (γ), and exergy efficiency (ηex). As observed in Figure 8, the Wcomp rises with an augmentation in the flow rate of the refrigerant (r). Nonetheless, the change in ṁr does not notably affect the compressor pressure ratio (γ) or the exergy efficiency (ηex). The highest recorded values for compressor power (Wcomp) occur at 6, 4, 5.4, and 6.5 kW for R744, R455A, R469A, and R472A, respectively, with a refrigerant flow rate (r) of 0.15 kg/s. Within the investigated range of ṁr, the compressor power (Wcomp) for R744, R455A, R469A, and R472A exhibit increases of 200, 207, 237, and 195%, respectively. Importantly, it’s worth noting that, while variations in the refrigerant flow rate (r) have a significant impact on compressor power (Wcomp), there is no discernible effect on the compressor pressure ratio (γ) and exergy efficiency (ηex). The refrigerant mass flow rate is a critical factor in shaping the performance of a refrigeration system. Therefore, the refrigerant mass flow rate should be considered and controlled to optimize the evaporator capacity, manage compressor discharge temperatures within safe limits, and enhance the overall COP. Striking the right balance in refrigerant flow is essential for achieving efficiency, reliability, and longevity in the operation of refrigeration systems.

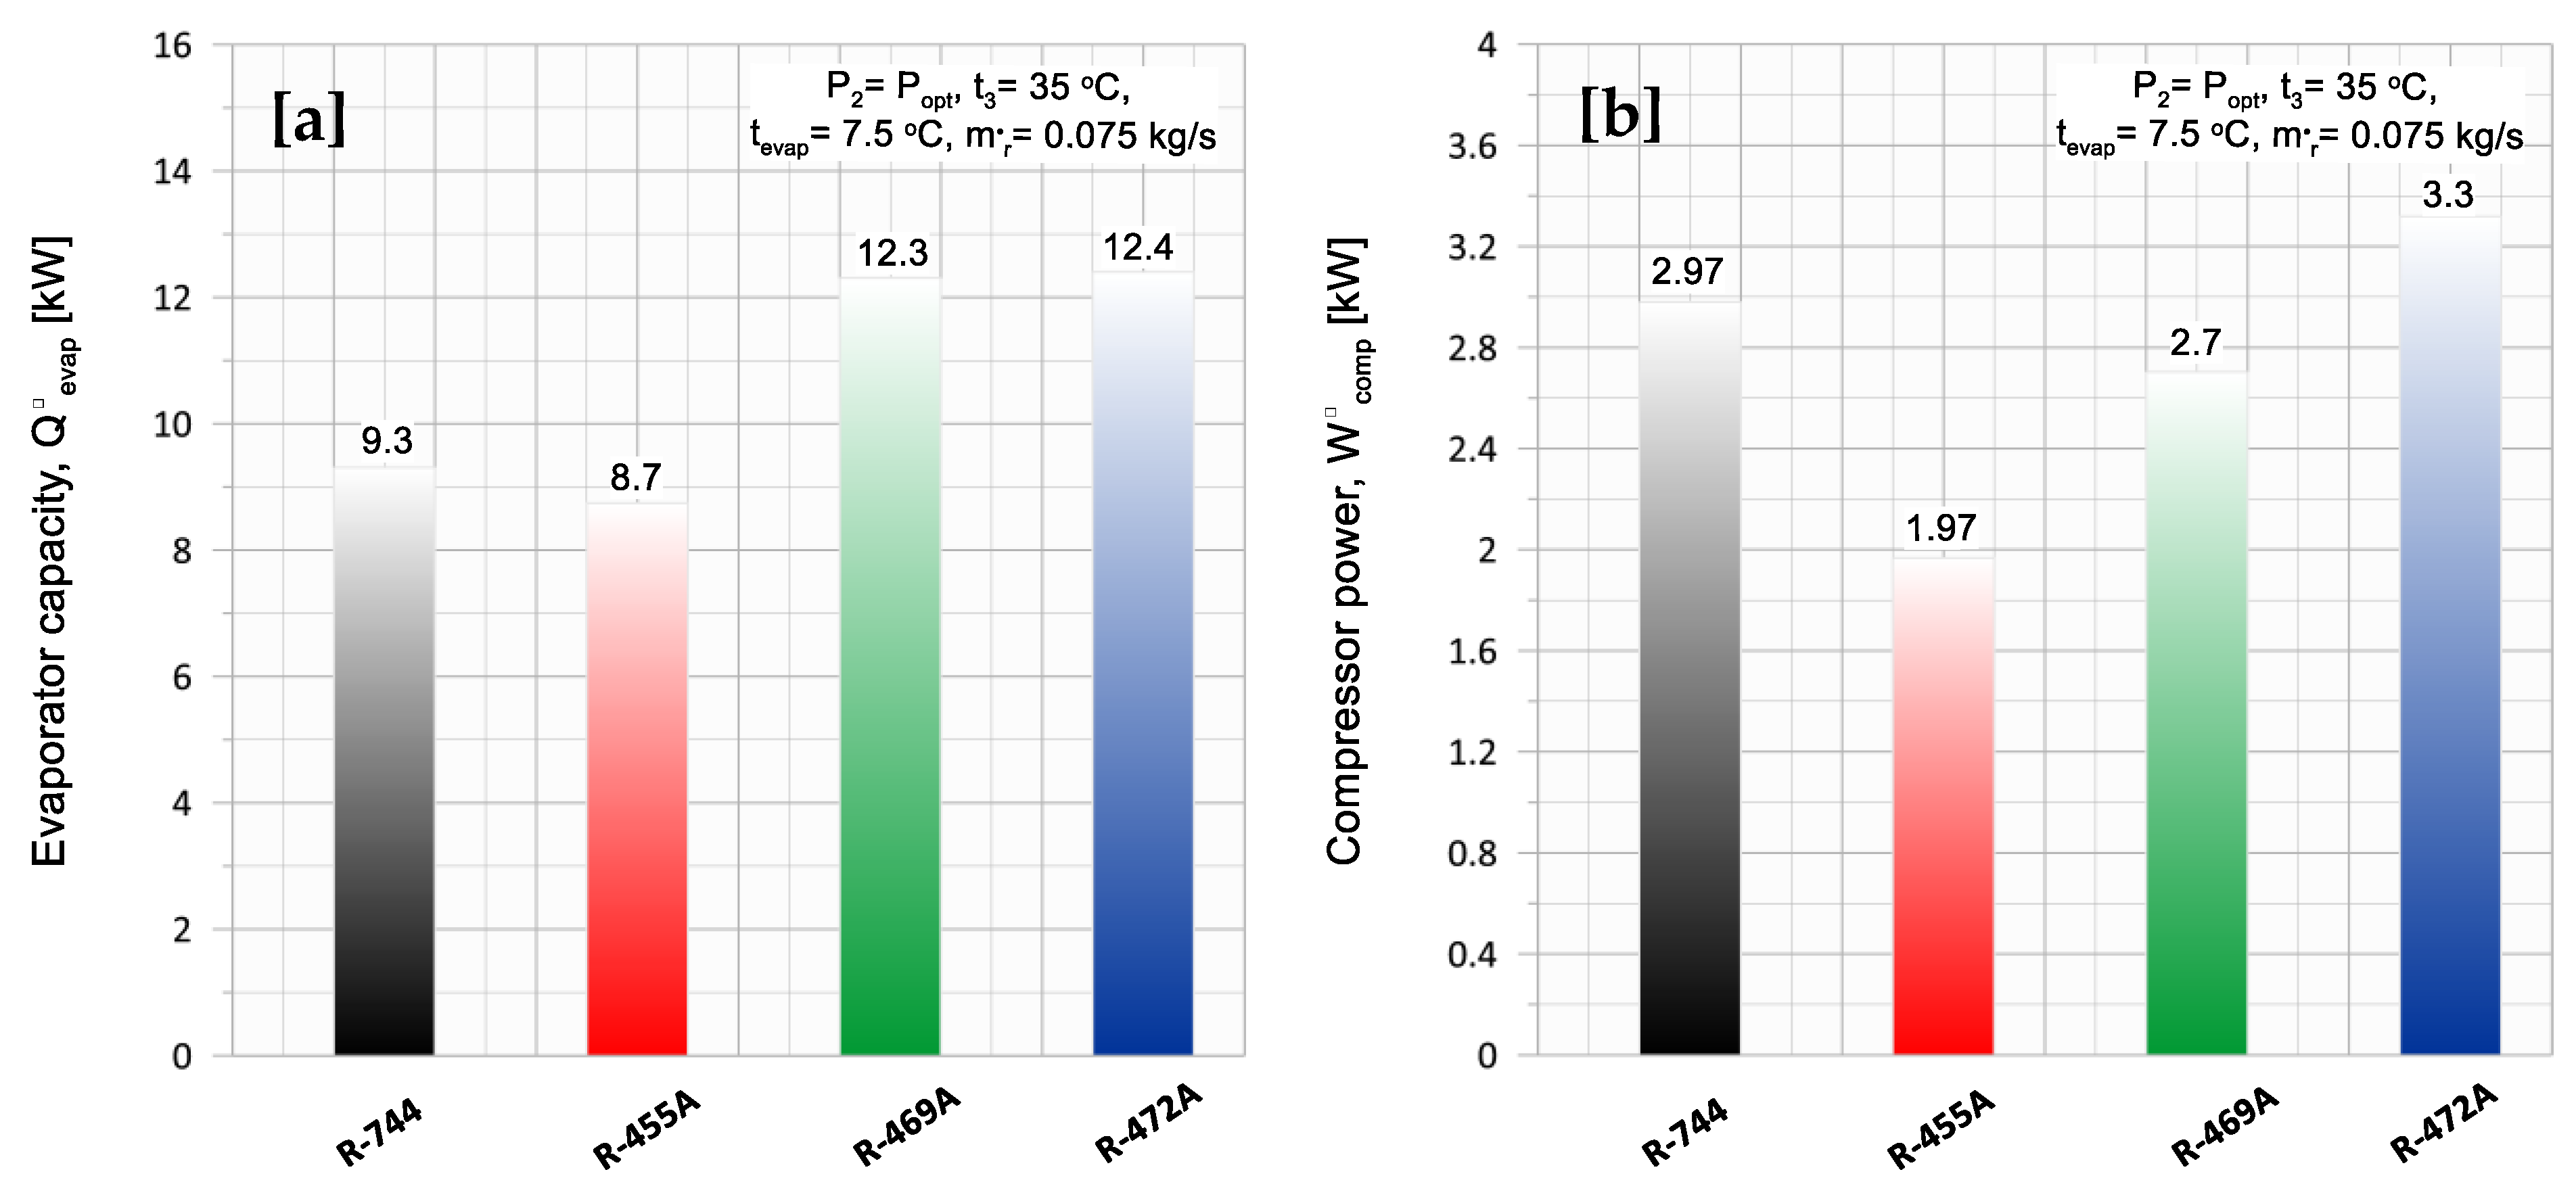
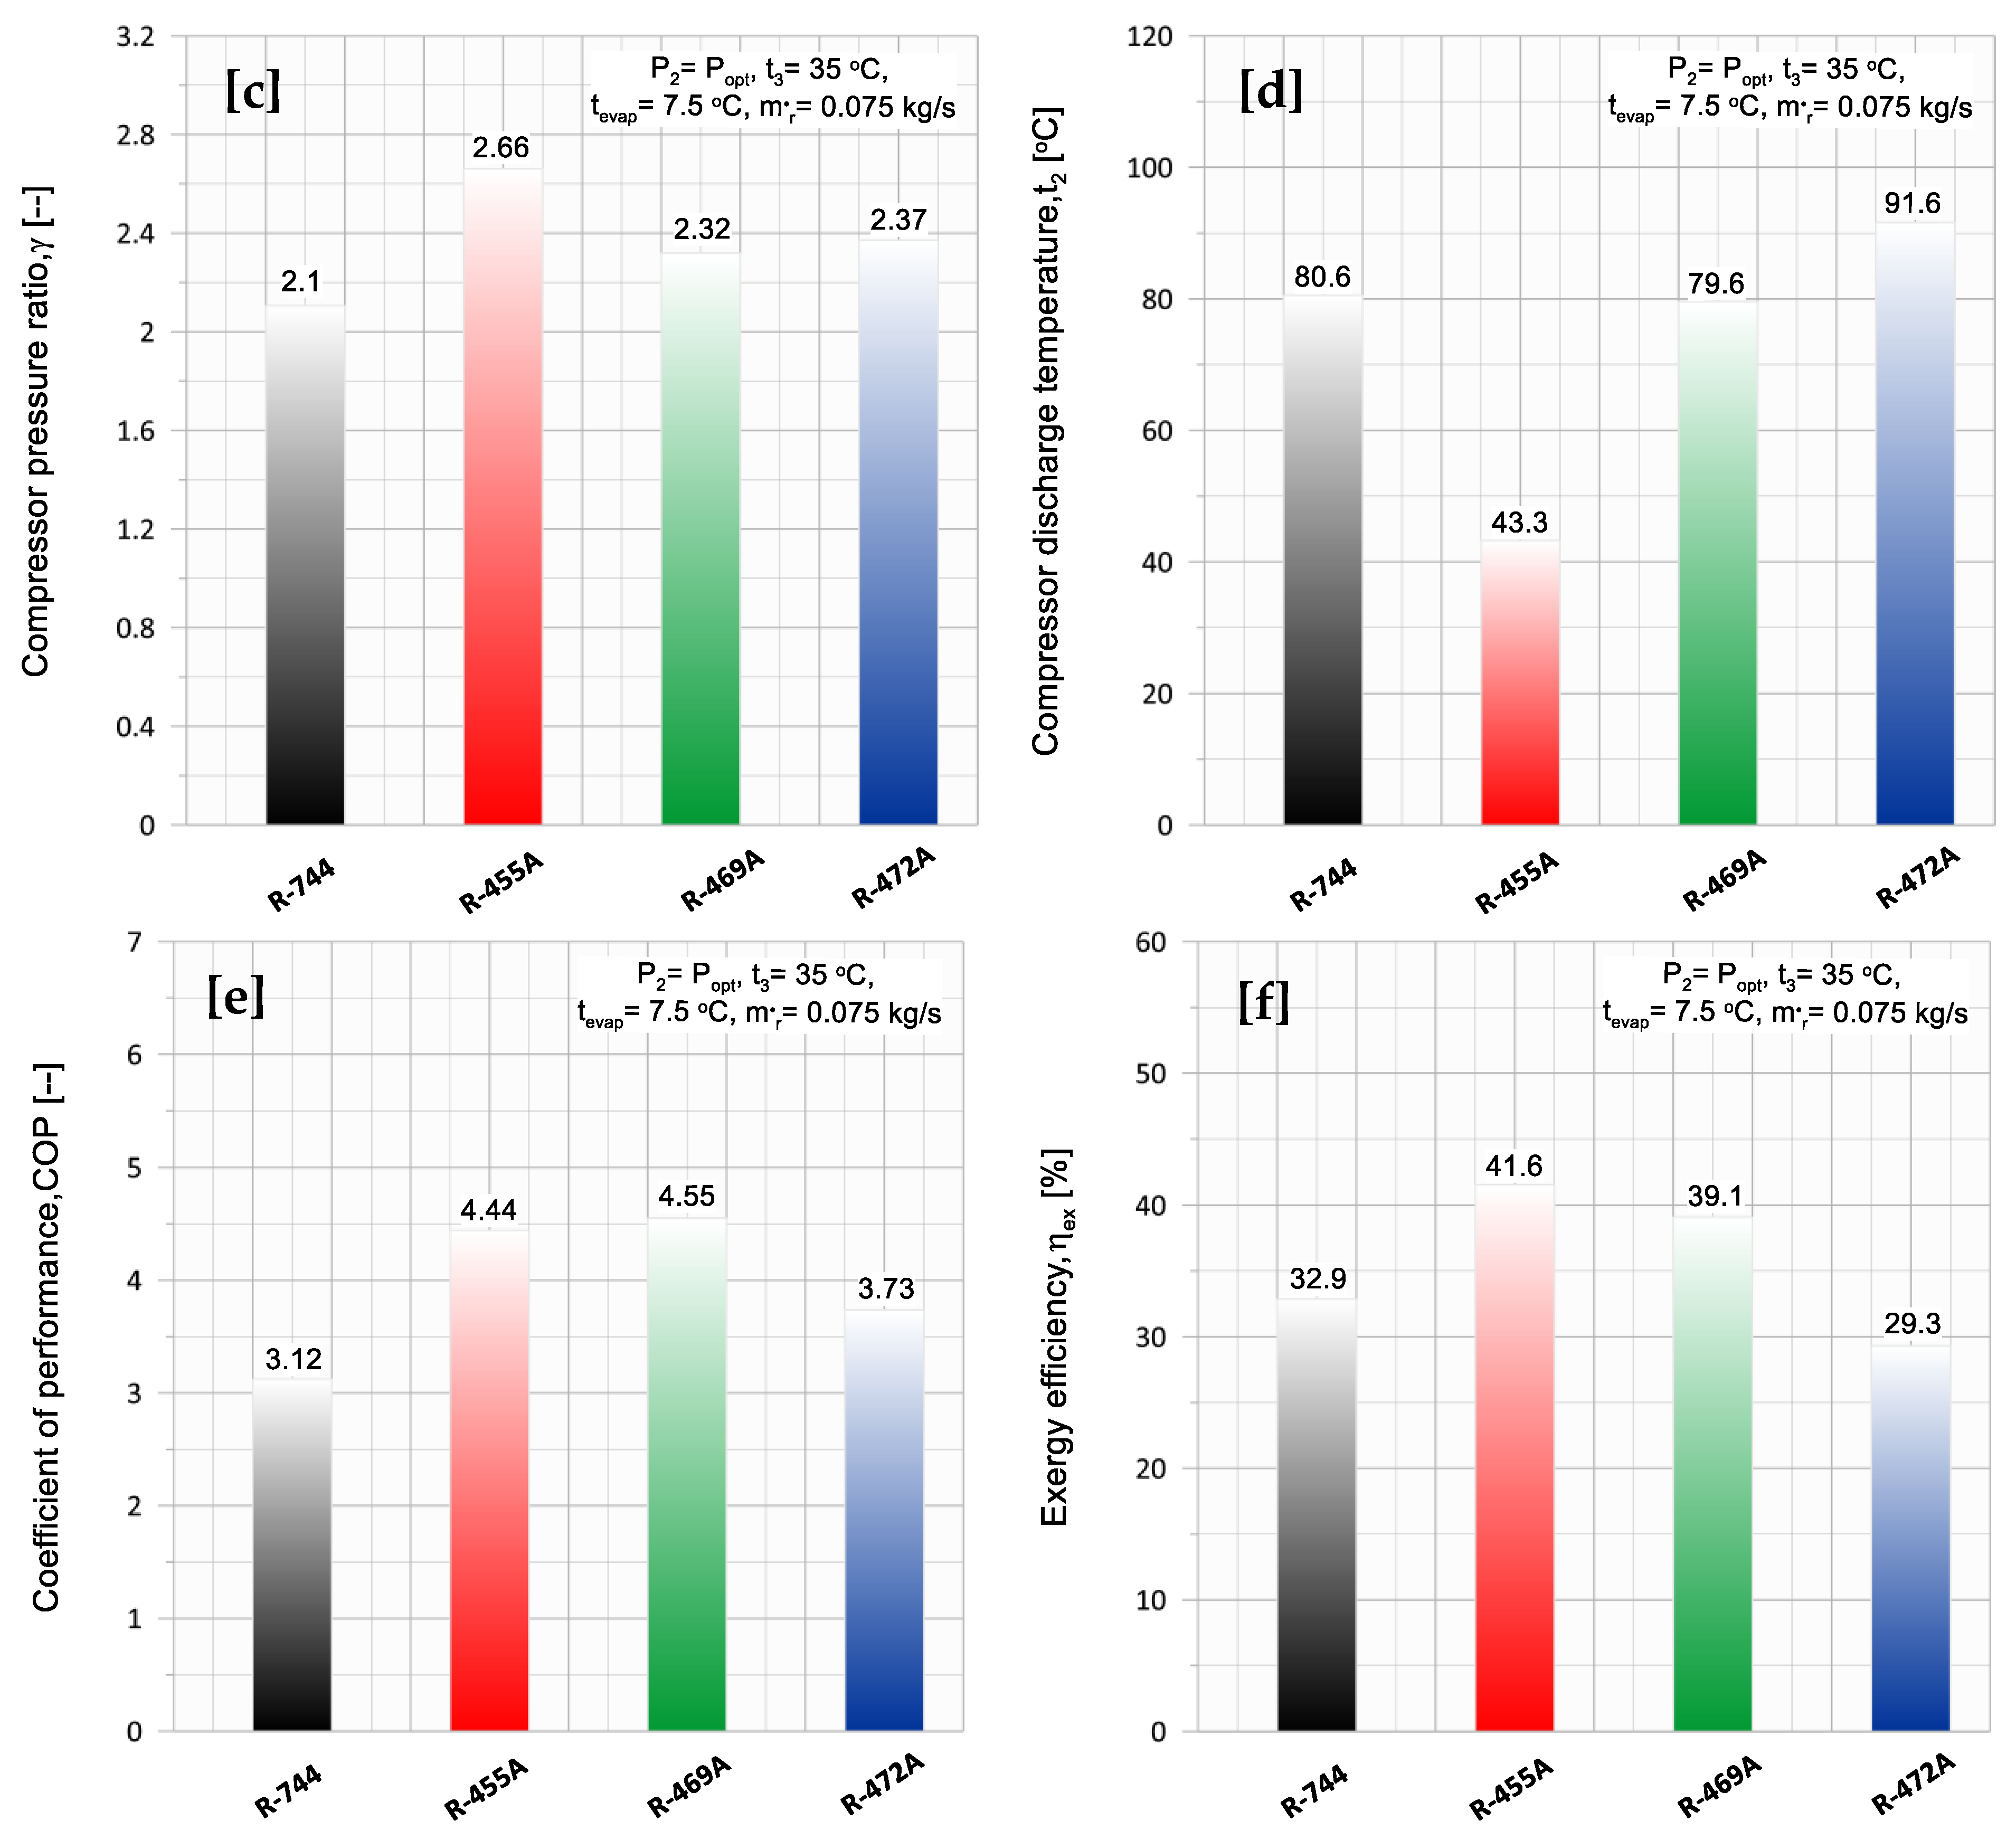
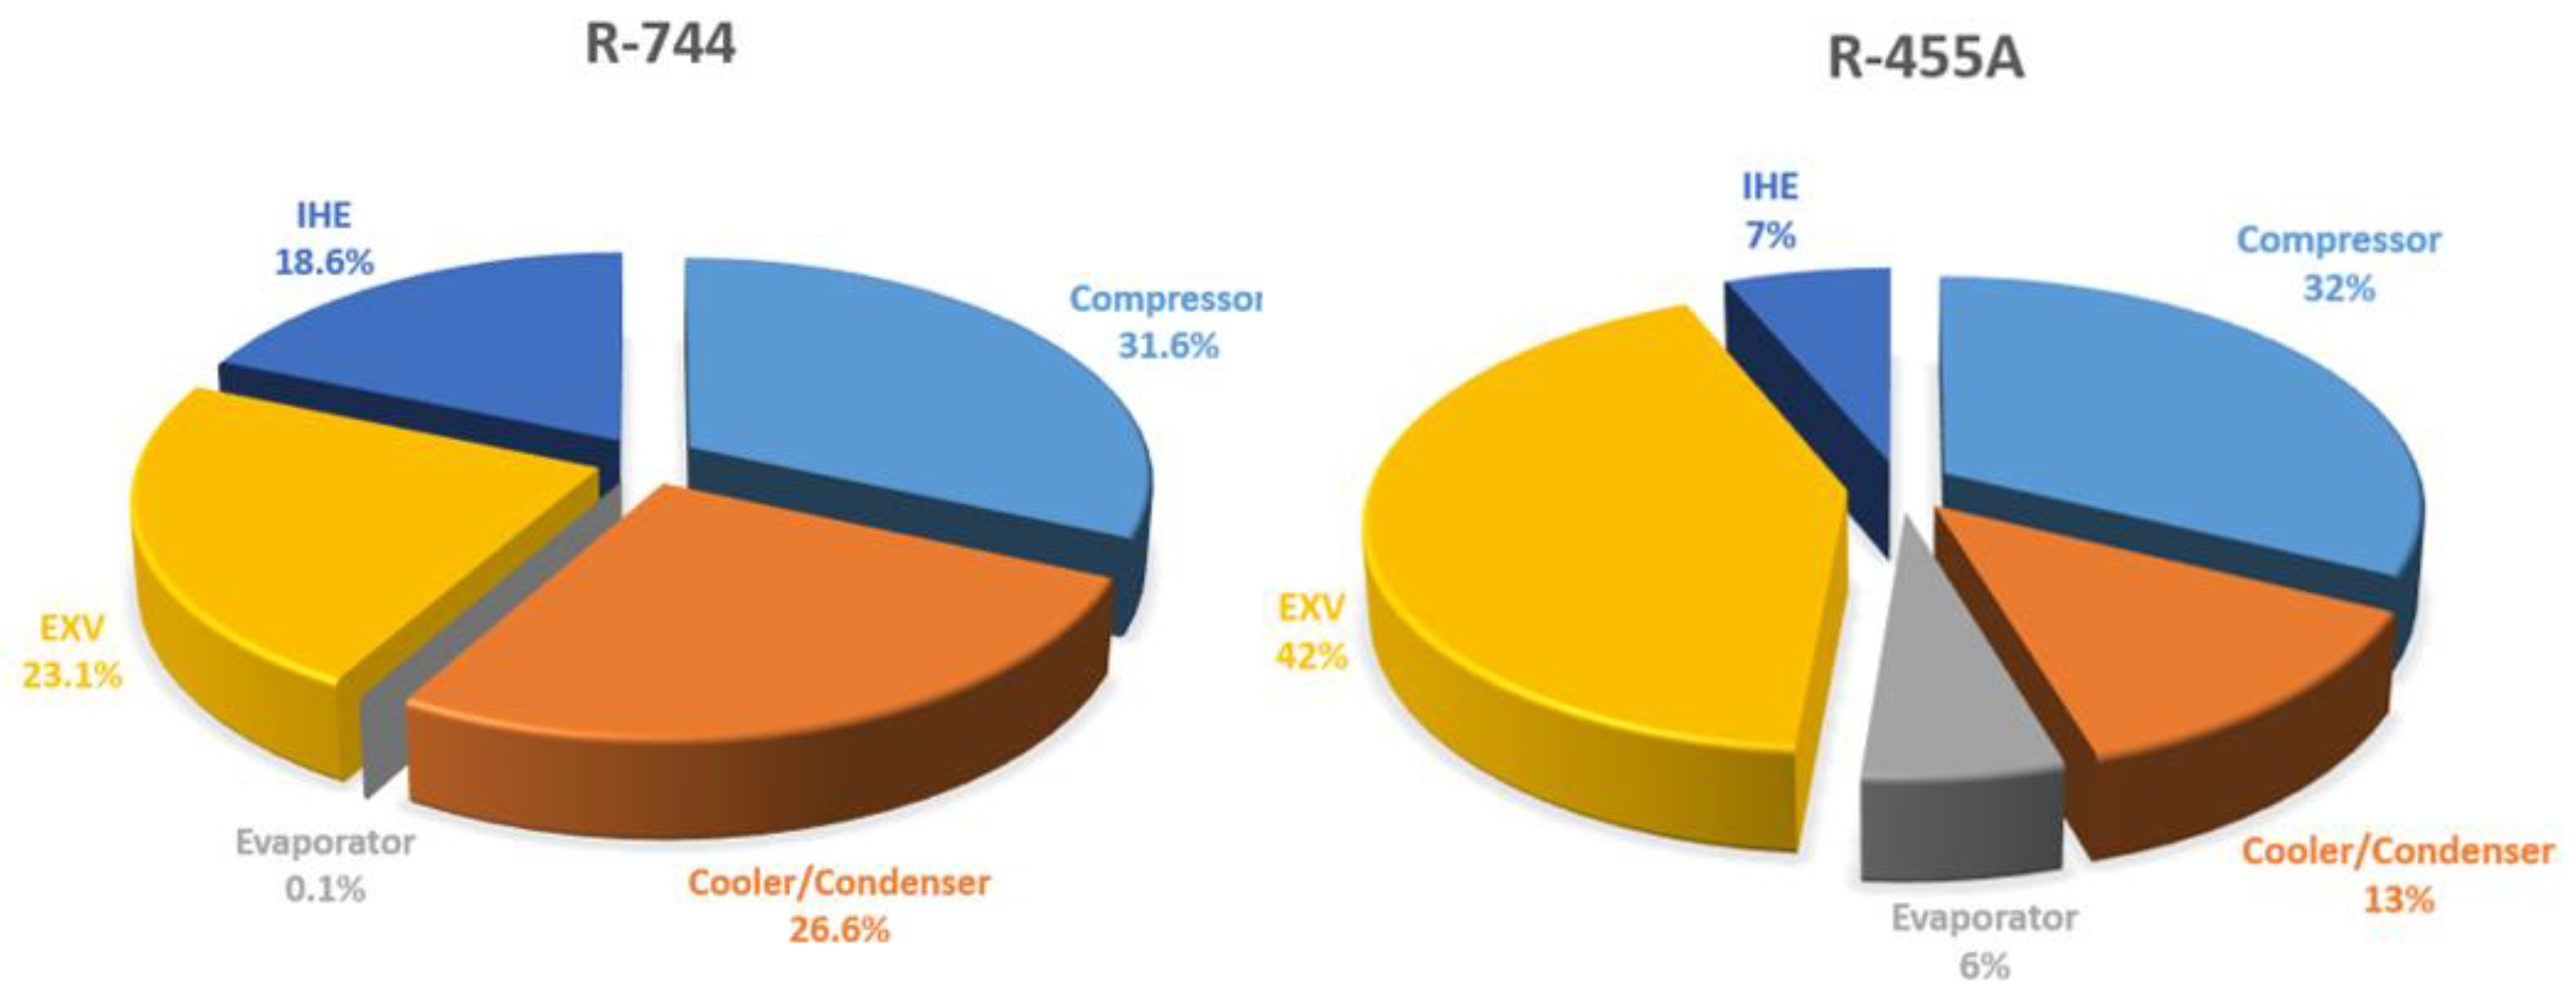
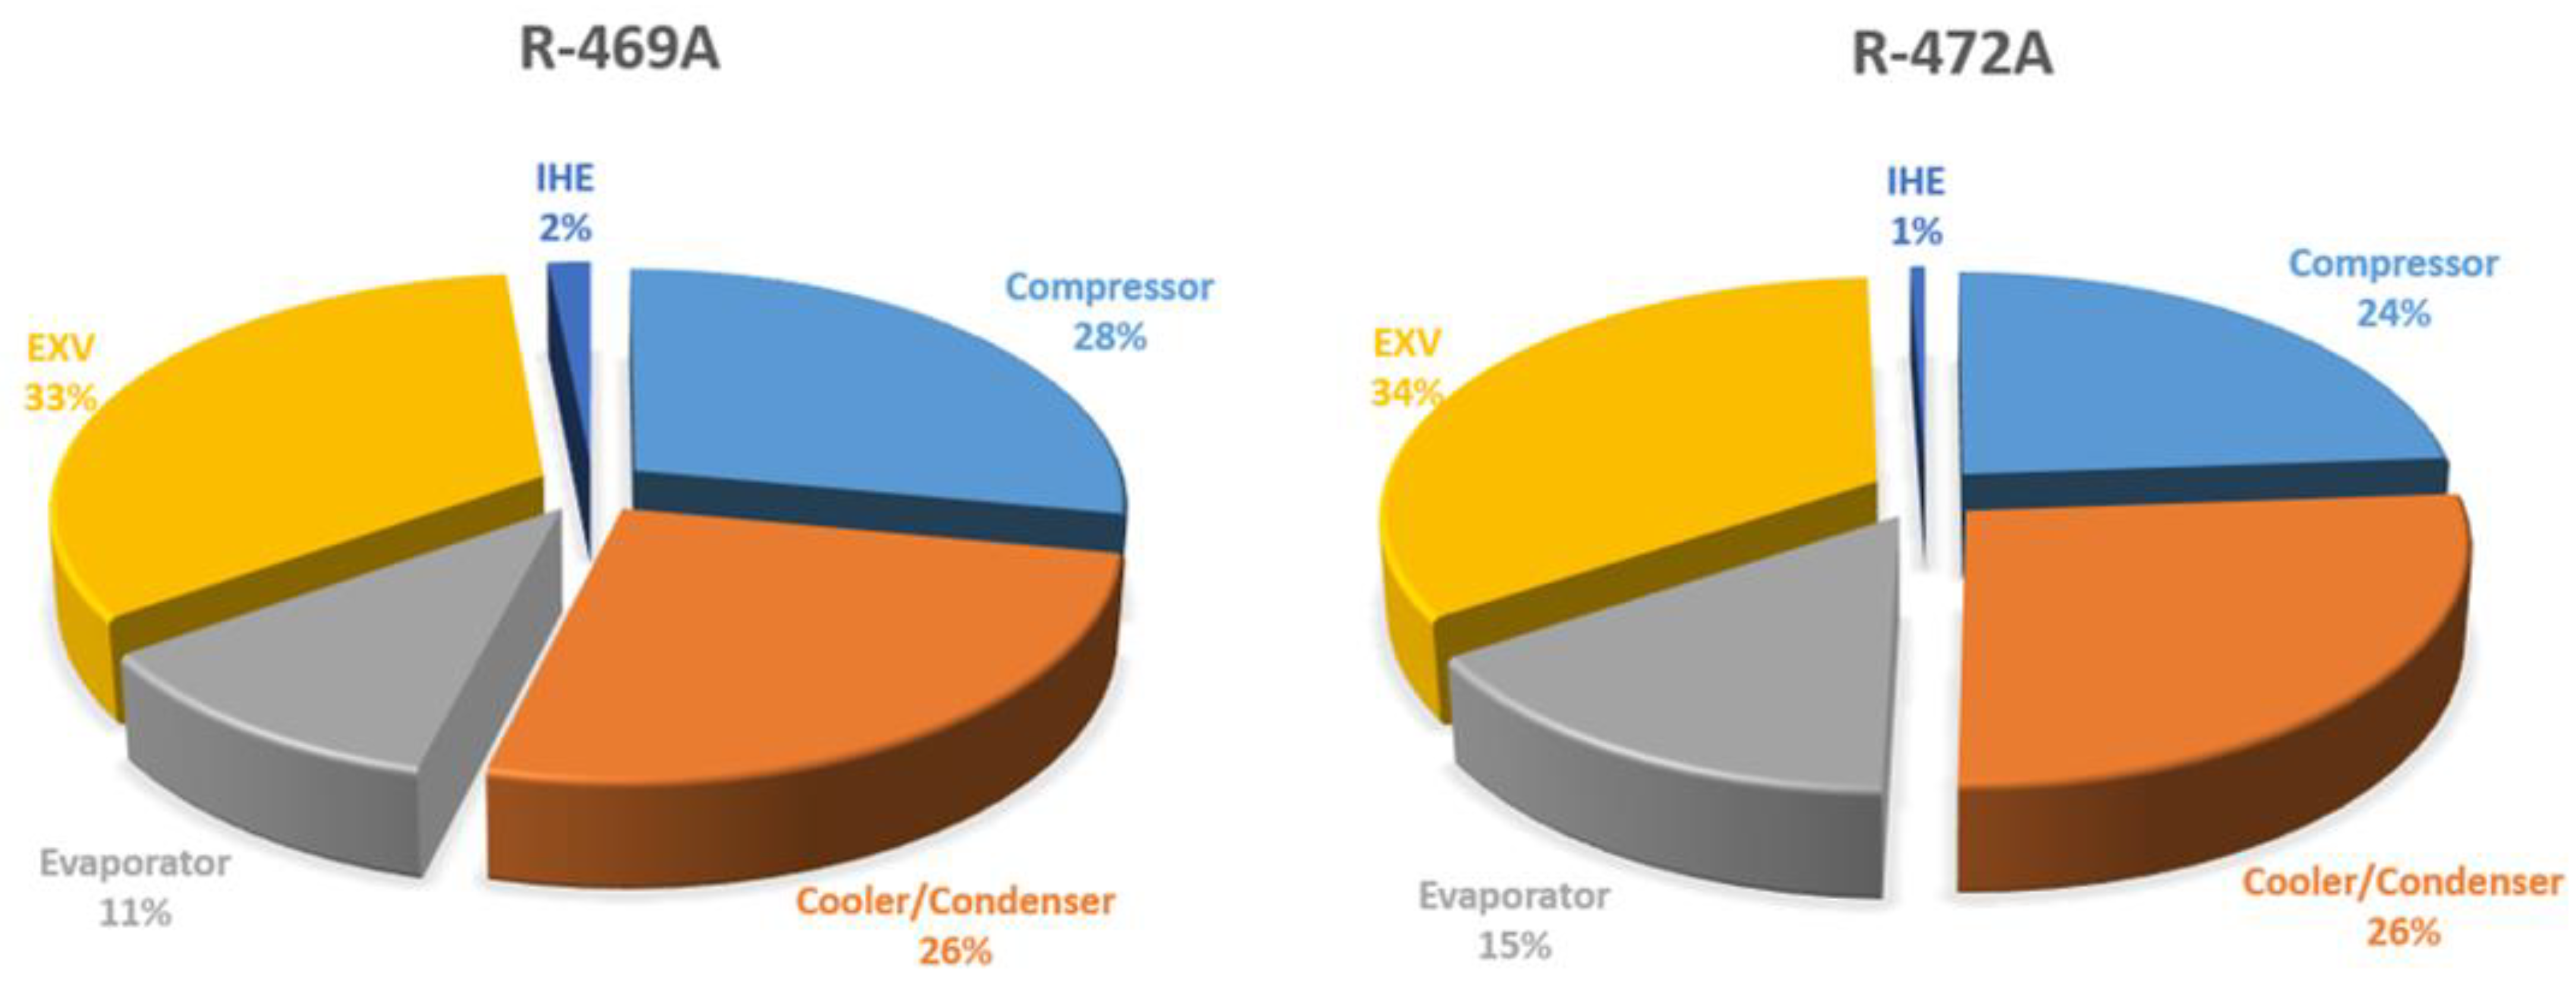
5.3. Comparisons and Evaluations of Analyzed Refrigerant Blends

Figure 9 displays the results of an in-depth analysis of the cycle and state parameters for the R744, R455A, R469, and R472A refrigerants using the Aspen HYSYS program. The principal aim of this analysis is to perform a comparative assessment of performance metrics within the compressed air adiabatic energy storage system. This evaluation encompasses scenarios involving the utilization of pure R744 and the blend refrigerants R455A, R469A, and R472A as the operational fluids. The performance metrics under consideration include Qevap, Wcomp, ηex, and the COP. The benefits obtained by using various working fluids are shown in Figure 10. The R472A blend is clearly the one with the most improvements when it comes to Qevap, Wcomp, and t2. It records values of 12.4 kW, 3.3 kW, and 91.6 °C, respectively, exceeding R744, R455A, and R469A. Furthermore, the R455A and R469A blend achieve the highest COP and exergy efficiency (ηex) values, measuring 4.44 and 4.55, along with 41.6% and 39.1%, respectively; these values exceed those of both R744 and R472A.
For a deeper comprehension of the system’s behavior, Figure 11 illustrates a juxtaposition of the exergy destruction percentages for every individual component among the refrigerant mixes under examination as compared to R744. This visualization provides valuable insights into the distinct effect of every individual on the overall exergy destruction. Significantly, the expansion valve (EXV) is identified as the main cause of irreversibility, accounting for 42% of the energy loss in the R455A cycle and 34% in the R472A cycle. The compressor closely trails at 32% in the R455A cycle. To a lesser extent, though, the condenser and evaporator also contribute to the exergy degradation in all layouts. Altogether, these studies highlight the benefits and drawbacks associated with different refrigerant mixes used in AACs’ cooling process. Because of their evaluated performance indicators, the evaluation specifically names R455A and R472A as competitive candidates.

5.4. Systems’ Optimization Conditions

After carrying out a thorough examination of several parameters, the performance optimization of three refrigerant blends (namely R-455A, R-469A, and R-472A) along with pure CO2 (R-744) was pursued to achieve the highest attainable COP within the prescribed operational parameter ranges. The resultant optimal operational conditions, predicated on the maximization of the COP, are comprehensively outlined in Table 6.
Table 7 also lists exergy destruction and efficiency data for each system component. These calculations were carried out based on the optimal COP scenario. The tabulated data furnishes insights into the maximum refrigeration capacities and system performance capabilities that can be reached for R744, R455A, R469A, and R472A, yielding respective values of 14.21, 15.05, 14.41, and 15.43 kW, respectively, and the corresponding, values of the COP attain its maximum values at 14.58, 12.86, 11.66, and 7.55, respectively. Furthermore, the corresponding exergy efficiencies (ηex) are reported as 45.4, 26.8, 19.8, and 29.3%.
The results of the optimization study underwent additional examination, particularly focusing on factors such as the COP, cycle operating pressures, and the environmental implications of the refrigerants. When assessing the COP, R744 and R455A emerged as top performers, displaying closely aligned cycle performance indicators. Pertaining to cycle operating pressures, R455A, R469A, and R472A showcased lower pressures when compared to R744. The aforementioned element possesses possible ramifications for the choice of materials utilized in cycle components, vulnerability to cycle leakages, the durability of the system, and issues pertaining to compressor lubrication. In the context of environmental impact, both R455A and R472A exhibited relatively minimal adverse effects on the environment, as evidenced by their low global warming potential (GWP) values. Nonetheless, it is worth noting that this came with a slightly diminished COP in comparison to R744 and R469A. Furthermore, there was an average performance discrepancy of about 12% between R455A, R744, and R469A (in terms of the COP). It is highly advised to use the R455A and R472A blend refrigerants for integration into the AAC system due to the urgent need for environmentally responsible air conditioning systems in cars and their substantial effects on the environment and global warming.

6. Conclusions

The increasing use of cars has led to extended periods spent in air-conditioned vehicles. Regrettably, the refrigerants employed in these systems can pose environmental risks. Many nations now require cars to use refrigerants with minimal global warming and ozone depletion potential. This emphasizes the immediate need to create air conditioning systems for vehicles that are environmentally friendly and effective. These systems are essential not just because of their adverse environmental effects and role in global warming but also due to their potential to decrease fuel usage and subsequently cut down engine-related carbon emissions.
This work aims to propose the utilization of CO2-based mixture zeotropic refrigerants, namely R455A, R469A, and R472A, with the intention of enhancing the thermodynamic effectiveness of pure CO2 refrigerants within automotive air conditioning systems. This study examines thermodynamic energy and exergy in an automotive air conditioning (AAC) system to optimize its performance using Aspen HYSYS software. The study compares innovative zeotropic refrigerant mixes to carbon dioxide (R-744). Additionally, the study examines how factors such as average evaporator temperature, condenser/cooler pressure, refrigerant mass flow rate, and condenser/cooler outlet temperature affect the  Q ˙ e v a p , t2, COP W . c o m p , and ηex. The outcomes of these examinations have been carried out and exhibited for additional assessment. It has been demonstrated that R-455A and R-469A exhibit superior system efficiency and enable the greatest attainable travel distance when utilized in automobile air conditioning systems (AACs), as compared to R744 and R-472A, while maintaining comparable operating settings. These points summarize the current work’s principal findings.
  • The maximum coefficient of performance (COP) values for R744, R455A, R469A, and R472A were 3.1, 4.25, 4.3, and 5.48, respectively, at optimal pressures of 8.9, 1.65, 4.319, and 6 MPa.
  • The maximum Qevap and COP values for R744, R455A, R469A, and R472A are 12.2, 9.9, 14.5 kW, and 3.15 and 3, 3.95, and 3.5, respectively.
  • The maximum values of Wcomp and γ for R744, R455A, R469A, and R472A are 3.3, 2.15, 3, and 3.65 kW and 2.25, 2.9, 2.5, and 2.58, respectively.
  • At P2 = 5 MPa, the increase in Wcomp for R744, R469A, and R472A is 53.5, 39.5, and 69.8% compared to R455A.
  • The compressor power (Wcomp) for R744, R455A, R469A, and R472A all decrease by 36.6%, 30.0%, 40%, and 35.6%, respectively, within the investigated range of P2.
  • The highest recorded values for compressor power (Wcomp) occur at 6, 4, 5.4, and 6.5 kW for R744, R455A, R469A, and R472A, respectively, with a refrigerant flow rate (r) of 0.15 kg/s.
  • The maximum refrigeration capacities and system performance capabilities can be reached for R744, R455A, R469A, and R472A, yielding respective values of 14.21, 15.05, 14.41, and 15.43 kW, respectively, and the corresponding values of the COP attain their maximum values at 14.58, 12.86, 11.66, and 7.55, respectively.
  • In the context of environmental impact, both R455A and R472A exhibited relatively minimal adverse effects on the environment, as evidenced by their low global warming potential (GWP) values. Nonetheless, it is worth noting that this came with a slightly diminished COP in comparison to R744 and R469A.
  • R455A and R469A obtain the greatest COP and exergy efficiency (ηex) values, measuring 4.44 and 4.55, respectively, at the identical operating conditions with optimal condenser/cooler pressures of the examined blends.
  • Eco-friendly refrigerants R455A and R472A are recommended for integration into AAC systems in vehicles, as they help combat global warming and protect natural surroundings and leakage issues.
  • Zeotropic blends, HFO-based, such as R1234yf, are recommended as upcoming work on automotive air conditioning performance studies.

Funding

This research received no external funding.

Institutional Review Board Statement

Not applicable.

Informed Consent Statement

Not applicable.

Data Availability Statement

Data are contained within the article.

Conflicts of Interest

The author declares no conflict of interest.

Nomenclature

E ˙ exergy (kW)
hspecific enthalpy (kJ/kg)
I ˙ exergy destruction (kW)
m ˙ mass flow rate (kg/s)
MMolar mass (kg/kmol)
PWorking fluid pressure (MPa)
Q ˙ heat transfer rate (kW)
sspecific entropy (kJ/kg K)
ttemperature (°C)
Ttemperature (K)
Tbnormal boiling point (°C)
Tccritical temperature (°C)
W ˙ power (kW)
Pcritical pressure (MPa)
Greek symbols
ηefficiency
γ compressor pressure ratio
Subscripts
condcondenser
compcompressor
cvcontrol volume
enenergy
exexergy
evapevaporator
I = 1, 2, 3, …index referring to various positions in the system
ininlet
isisentropic e
jboundary
maxmaximum
ooutlet
rrefrigerant
refrefrigeration
0Environmental state
1,2,3, …working fluid state points
Abbreviations
AACautomotive air conditioning
COPcoefficient of performance
EOSPeng–Robinson equation of state
EXVExpansion valve
GWPglobal warming potential
HEXinternal heat exchanger
HFCHydrofluorocarbon
HFOHydrofluro-Olefins
ODPozone depletion potential
VLEvapor-liquid equilibrium

References

  1. Pérez-Lombard, L.; Ortiz, J.; Coronel, J.F.; Maestre, I.R. A review of HVAC systems requirements in building energy regulations. Energy Build. 2011, 43, 255–268. [Google Scholar] [CrossRef]
  2. Nejat, P.; Jomehzadeh, F.; Taheri, M.M.; Gohari, M.; Majid, M.Z.A. A global review of energy consumption, CO2 emissions, and policy in the residential sector (with an overview of the top ten CO2 emitting countries). Renew. Sustain. Energy Rev. 2015, 43, 843–862. [Google Scholar] [CrossRef]
  3. Uddin, K.; Arakaki, S.; Saha, B.B. Thermodynamic analysis of low-GWP blends to replace R410A for residential building air conditioning applications. Environ. Sci. Pollut. Res. 2021, 28, 2934–2947. [Google Scholar] [CrossRef] [PubMed]
  4. European Union. Regulation (EU) No 517/2014 of the European Parliament and of the Council of 16 April 2014 on Fluorinated Greenhouse Gases and Repealing Regulation (EC) No 842/2006 (1). Official Journal of European Union L 150/195. 2014. Available online: https://eur-lex.europa.eu/legal-content/EN/TXT/PDF/?uri=CELEX:32014R0517&from=EN (accessed on 25 October 2023).
  5. Lee, Y.; Jung, D. Brief performance comparison of R1234yf and R134a in a bench tester for automobile applications. Appl. Therm. Eng. 2012, 35, 240–242. [Google Scholar] [CrossRef]
  6. Montreal Protocol on Substances that Deplete the Ozone Layer, “Assessment of Alternatives to HCFCS and HFCS and Update of the TEAP 2005 Supplement Report Data”. 2010. Available online: https://ozone.unep.org/treaties/montreal-protocol/montreal-protocol-substances-deplete-ozone-layer (accessed on 25 October 2023).
  7. Xu, Y.; Mao, C.; Huang, Y.; Shen, X.; Xu, X.; Chen, G. Performance evaluation and multi-objective optimization of a low-temperature CO2 heat pump water heater based on artificial neural network and new economic analysis. Energy 2021, 216, 119232. [Google Scholar] [CrossRef]
  8. Song, Y.; Cui, C.; Yin, X.; Cao, F. Advanced development and application of transcritical CO2 refrigeration and heat pump technology—A review. Energy Rep. 2022, 8, 7840–7869. [Google Scholar] [CrossRef]
  9. Yelishala, S.C.; Kannaiyan, K.; Wang, Z.; Hameed, M. Thermodynamic study on blends of hydrocarbons and carbon dioxide as zeotropic refrigerants. J. Energy Resour. Technol. Trans. ASME 2020, 142, 082304. [Google Scholar] [CrossRef]
  10. Llopis, R.; Toffoletti, G.; Nebot-Andrés, L.; Cortella, G. Experimental evaluation of zeotropic refrigerants in a dedicated mechanical subcooling system in a CO2 cycle. Int. J. Refrig. 2021, 128, 287–298. [Google Scholar] [CrossRef]
  11. Mostafa, M.; Ezzeldien, M.; Attalla, M.; Ghazaly, N.M.; Alrowaili, Z.A.; Hasaneen, M.F.; Shmroukh, A.N. Comparison of different adsorption pairs based on zeotropic and azeotropic mixture refrigerants for solar adsorption ice maker. Environ. Sci. Pollut. Res. 2021, 28, 41479–41491. [Google Scholar] [CrossRef]
  12. Tian, H.; Zeng, W.; Gu, B.; Zhang, Y.; Yuan, X. Energy, exergy, and economic (3E) analysis of an organic Rankine cycle using zeotropic mixtures based on marine engine waste heat and LNG cold energy. Energy Convers. Manag. 2021, 228, 113657. [Google Scholar] [CrossRef]
  13. Mezentseva, N.N.; Mezentsev, I.V. Investigation of Heat Pump Efficiency on Zeotropic Refrigerants R32/R134a and R32/R152a. J. Eng. Thermophys. 2018, 27, 554–559. [Google Scholar] [CrossRef]
  14. Barraza, R.; Nellis, G.; Klein, S.; Reindl, D. Measured and predicted frictional pressure drop for boiling zeotropic mixed refrigerants in horizontal tubes. Int. J. Heat Mass Transf. 2016, 98, 285–298. [Google Scholar] [CrossRef]
  15. Ma, Y.; Wang, P.; Li, M. Greenhouse effect and fourth generation refrigerant. Refrig. Technol. 2017, 5, 8–13. [Google Scholar]
  16. Chen, Y.; Xu, D.; Chen, Z.; Gao, X.; Ren, F.; Han, W. Performance Analysis and Evaluation of a Supercritical CO2 Rankine Cycle Coupled with an Absorption Refrigeration Cycle. J. Therm. Sci. 2020, 29, 1036–1052. [Google Scholar] [CrossRef]
  17. Robinson, D.M.; Groll, E.A. Eiciencies of transcritical CO2 cycles with and without an expansion turbine. Int. J. Refrig. 1998, 21, 577–589. [Google Scholar] [CrossRef]
  18. Yu, B.; Wang, D.; Xiang, W.; Yu, H.; Chen, J. Performance Analysis of Transcritical CO2 Electric Vehicle Air Conditioning System. J. Shanghai Jiaotong Univ. 2019, 53, 866–872. [Google Scholar]
  19. Sobieraj, M.; Rosiński, M. High Phase-Separation Efficiency Auto-Cascade System Working with a Blend of Carbon Dioxide for Low-Temperature Isothermal Refrigeration. Appl. Therm. Eng. 2019, 161, 114149. [Google Scholar] [CrossRef]
  20. Sun, Z.; Cui, Q.; Wang, Q.; Ning, J.; Guo, J.; Dai, B.; Liu, Y.; Xu, Y. Experimental study on CO2/R32 blends in a water-to-water heat pump system. Appl. Therm. Eng. 2019, 162, 114303. [Google Scholar] [CrossRef]
  21. Yu, P.; Zhang, X.; Wen, X. Theoretical and Experimental Study on the Heat Transfer Temperature Difference Based on the Nonlinear Temperature Enthalpy of the R236fa/R32 Mixtures. Procedia Eng. 2017, 205, 2126–2132. [Google Scholar] [CrossRef]
  22. Liu, Q.; Li, Y.; Gao, W.; Zhang, K.; Huang, L.; Bi, M. Hazard evaluation of R32/R1234ze(E) cloud explosion. Int. J. Refrig. 2020, 111, 159–167. [Google Scholar] [CrossRef]
  23. Wang, X.; Yan, Y.; Wright, E.; Hao, X.; Gao, N. Prospect Evaluation of Low-GWP Refrigerants R1233zd(E) and R1336mzz(Z) Used in Solar-Driven Ejector-Vapor Compression Hybrid Refrigeration System. J. Therm. Sci. 2020, 30, 1572–1580. [Google Scholar] [CrossRef]
  24. Abbood, M.H.; Hashim, H.T.; Amin, A.S. Investigation of Environmentally-Friendly Alternative Refrigerants for Automotive Air Conditioning Systems. IOP Conf. Ser. Mater. Sci. Eng. 2020, 671, 012139. [Google Scholar] [CrossRef]
  25. Vashisht, S.; Rakshit, D. Recent advances and sustainable solutions in automobile air conditioning systems. J. Clean. Prod. 2021, 329, 129754. [Google Scholar] [CrossRef]
  26. Zhang, N.; Dai, Y.; Feng, L.; Li, B. Study on environmentally friendly refrigerant R13I1/R152a as an alternative for R134a in automotive air conditioning system. Chin. J. Chem. Eng. 2022, 44, 292–299. [Google Scholar] [CrossRef]
  27. Savitha, D.C.; Ranjith, P.K.; Talawar, B.; Reddy, N.R.P. Refrigerants for sustainable environment—A literature review. Int. J. Sustain. Energy 2022, 41, 235–256. [Google Scholar] [CrossRef]
  28. Song, X.; Yuan, H.; Zhang, Y.; Yu, B.; Wang, D.; Shi, J.; Chen, J. Experimental study on improved performance of an automotive CO2 air conditioning system with an evaporative gas cooler. Int. J. Refrig. 2022, 140, 39–48. [Google Scholar] [CrossRef]
  29. Lei, L.; Song, X.; Yu, B.; Liu, C.; Shi, J.; Chen, J. Energetic performance evaluation of an automotive CO2 air conditioning system with a dual-evaporator configuration. Int. J. Refrig. 2023, in press. [CrossRef]
  30. Vaccaro, G.; Milazzo, A.; Talluri, L. Thermodynamic assessment of trans-critical refrigeration systems utilizing CO2-based mixtures. Int. J. Refrig. 2023, 147, 61–70. [Google Scholar] [CrossRef]
  31. Luo, J.; Ye, Z.; Zhao, Z.; Yang, K.; Zhang, S.; Wang, Q. Vapor-liquid equilibrium measurement and heating performance modeling on eco-friendly zeotropic blends of CO2/R1234ze(Z) and CO2/R1336mzz(E). Appl. Therm. Eng. 2023, 229, 120576. [Google Scholar] [CrossRef]
  32. Chen, B.-L.; Yang, T.-F.; Sajjad, U.; Ali, H.M.; Yan, W.-M. Deep learning-based assessment of saturated flow boiling heat transfer and two-phase pressure drop for evaporating flow. Eng. Anal. Bound. Elem. 2023, 151, 519–537. [Google Scholar] [CrossRef]
  33. Hussain, I.; Bibi, F.; Sajjad, U.; Sultan, M.; Kaushal, S.K.; Yan, W.-M. A new insight into two-phase flow pressure-drop estimation and optimization of the refrigerant R1234yf. Mater. Today Proc. 2023, in press. [Google Scholar] [CrossRef]
  34. Al-Zahrani, A. Energy and Exergy Analysis on Zeotropic Refrigerants R-455A and R-463A as Alternatives for R-744 in Automotive Air-Conditioning System (AACs). Processes 2023, 11, 2127. [Google Scholar] [CrossRef]
  35. ANSI/ASHRAE Standard 34-2022; ASHRAE Standard 34, Designation and Safety Classification of Refrigerants. Refrigeration and Air-Conditioning Engineer Incorporation: Atlanta, GA, USA, 2016.
  36. Liao, S.; Zhao, T.; Jakobsen, A. A correlation of optimal heat rejection pressures in transcritical carbon dioxide cycles. Appl. Therm. Eng. 2000, 20, 831–841. [Google Scholar] [CrossRef]
  37. Aspen HYSYS V12.1. 2021. Available online: www.aspentech.com (accessed on 1 May 2023).
  38. Moran, M.J.; Shapiro, H.N. Fundamentals of Engineering Thermodynamics; John Wiley and Sons: West Sussex, UK, 2006. [Google Scholar]
  39. Rigola, J.; Raush, G.; Pérez-Segarra, C.; Oliva, A. Numerical simulation and experimental validation of vapor compression refrigeration systems. Special emphasis on CO2 trans-critical cycles. Int. J. Refrig. 2005, 28, 1225–1237. [Google Scholar] [CrossRef]
  40. Mazyan, W.; Ahmadi, A.; Ahmed, H.; Hoorfar, M. Increasing the COP of a refrigeration cycle in natural gas liquefaction process using refrigerant blends of Propane-NH3, Propane-SO2, and Propane-CO2. Heliyon 2020, 6, 2405–8440. [Google Scholar] [CrossRef]
  41. Yu, B.; Ouyang, H.; Shi, J.; Liu, W.; Chen, J. Evaluation of low-GWP and mildly flammable mixtures as new alternatives for R410A in air-conditioning and heat pump system. Int. J. Refrig. 2020, 121, 95–104. [Google Scholar] [CrossRef]
  42. UNEP. Refrigeration, Air Conditioning, and Heat Pumps Technical Options Committee 2018 Assessment Report. 2019. Available online: https://ozone.unep.org/sites/default/files/2019-04/RTOC-assessment-report-2018_0.pdf (accessed on 1 May 2023).
Figure 1. P–h envelopes of studied zeotropic refrigerant compared with R744: (a) R-455A; (b) R-744; (c) R-469A; (d) R-472A.
Sustainability 16 00358 g001
Figure 2. Schematic diagram of AACs.
Sustainability 16 00358 g002
Figure 3. Flow diagram of simulated AACs in Aspen HYSYS.
Sustainability 16 00358 g003
Figure 4. Optimum cooler/condenser pressure, P2.
Sustainability 16 00358 g004
Figure 5. Influence of cooler/condenser pressure on (a) Qevap, (b) t2, (c) COP.
Sustainability 16 00358 g005
Figure 6. Influence of average evaporator temperature on (a) Wcomp, (b) γ, (c) ηex.
Sustainability 16 00358 g006aSustainability 16 00358 g006b
Figure 7. Influence of cooler/condenser outlet temperature on (a) Qevap, (b) t2, (c) COP.
Sustainability 16 00358 g007
Figure 8. Influence of refrigerant flow rate on (a) Wcomp, (b) γ, (c) ηex.
Sustainability 16 00358 g008aSustainability 16 00358 g008b
Figure 9. Refrigerant blend comparisons and evaluations with R-744: (a) R-744; (b) R-455A; (c) R-469A; (d) R-472A.
Sustainability 16 00358 g009aSustainability 16 00358 g009b
Figure 10. AAC performance indicator comparisons of the investigated refrigerant blends: (a) Qevap; (b) Wcomp; (c) γ; (d) t2; (e) COP; (f) ηex.
Sustainability 16 00358 g010aSustainability 16 00358 g010b
Figure 11. System’s component exergy destruction rates for refrigerant blends compared to R-744.
Sustainability 16 00358 g011aSustainability 16 00358 g011b
Table 1. Environmental and physical characteristics of individual refrigerants [34,35].
Pure RefrigerantKindSafety Group
(ASHRAE Standard 34), [35]
ODPGWPM
[kg/kmol]
Tb
[°C]
Tc
[°C]
Pc
[MPa]
R-134aHFCA101370102−261014
R-32HFCA2L067752−51.7785.8
R-125HFCA103170120−48.5663.6
R-1234yfHFOA2L0<1114−29.594.73.4
R-744NaturalA10144−78.5317.4
Table 2. Environmental and physical characteristics of investigated zeotropic refrigerants [35].
Refrigerant DesignationComposition (Mass %)Glide Temperature (°C)M
(kg/kmol)
Tb/(Bubble/Dew)
(°C)
Tc
(°C)
Pc
(MPa)
Safety
Group
(ASHRAE Standard 34), [35]
ODPGWP
R-744R-744
(100)
--44.01−78.5131.057.38A101
R-455AR-744/32/1234yf (3.0/21.5/75.5)12.587.45−51.6/−39.185.484.32A2L0~146
R-469AR-744/R-32/R-125 (35.0/32.5/32.5)1759.14−78.5/−61.556.176.21A101250
R-472AR-744/32/134a (69.0/12.0/19.0)22.850.38−84.3/−61.548.227.31A10342
Table 3. Operating conditions and parameter, [34].
ParameterRange/Value
The pressure of the cooler/condenser, P25–15 MPa
The average temperature of the evaporator, tevap5–15 °C
The outlet temperature of the cooler/condenser, t320–40 °C
a flow rate of refrigerant,  m ˙ r  0.05–0.15 kg/s
Optimum cooler/condenser pressure, Popt, R7448.9 MPa
Optimum cooler/condenser pressure, Popt, R455A1.65 MPa
Optimum cooler/condenser pressure, Popt, R469A4.319 MPa
Optimum cooler/condenser pressure, Popt, R472A6 MPa
Top of Form.
Table 4. Modeling assumptions and equations for energy and exergy.
ElementSignificant Equations [34] Model Assumptions
Sustainability 16 00358 i001
Compressor
W ˙ c o m p = m ˙ r ( h c o m p , o u t , a c t h c o m p , i n ) = m ˙ r ( h c o m p , o u t , s h c o m p , i n ) / η i s
η i s = h c o m p , o u t , s h c o m p , i n h c o m p , o u t , a c t h c o m p , i n
I ˙ c o m p = E ˙ c o m p , i n E ˙ c o m p , o u t + W ˙ c o m p
  • ηis = 80%,
  • Polytropic method: Shultz
  • Operation mode: centrifugal
Sustainability 16 00358 i002
Cooler/condenser
Q ˙ c o o l e r / c o n d . = m ˙ r ( h c o o l e r / c o n d , o u t h c o o l e r / c o n d , i n )
I ˙ C o o l e r / c o n d . = E ˙ c o o l e r / c o n d , i n E ˙ c o o l e r / c o n d , o u t E ˙ c o o l e r / c o n d .
E ˙ c o o l e r / c o n d = 1 T o T r ( c o o l e r / c o n d ) , o u t Q · c o o l e r / c o n d
  • Simple endpoint (HE model)
  • ΔP = 0 kPa
Sustainability 16 00358 i003
Expansion valve
m ˙ r h E X V , i n = m ˙ r h E X V , o u t
I ˙ E X V = E ˙ E X V , i n E ˙ E X V , o u t
Sustainability 16 00358 i004
Evaporator
Q ˙ e v a p = m ˙ r ( h e v a p , i n h e v a p , o u t )
I ˙ e v a p = E ˙ e v a p , i n E ˙ e v a p , o u t E ˙ e v a p
E ˙ e v a p = 1 T o T r e v a p , o u t Q · e v a p
  • x1= 1
  • ΔP = 0 kPa
Sustainability 16 00358 i005
IHE
Q ˙ I H E = m ˙ r ( h I H E , i n h I H E , o u t ) H o t = m ˙ r ( h I H E , o u t h I H E , i n ) c o l d
I ˙ I H E = E ˙ I H E , i n E ˙ I H E , o u t
  • Simple endpoint (HE model)
  • Hot stream ΔP = 0 kPa
  • Cold stream ΔP = 0 kPa
Table 5. Model’s reported findings and validation [39].
State VariablesPerformance Metrics
Exp. Data, [39] W ˙ c o m p  (W)COP
Qevap (W) Tevap (°C)Tcomp, in (°C)Pcomp, out (bar)Tcooler, out (°C)ηcomp, overall (%)Exp., [39]Current ModelError (%)Exp., [39]Current ModelError (%)
351.65−11.3035.3889.7135.2446.30326.53486.21.081.06.4
525.11−2.0335.6290.3735.2354.80343.73748.01.561.49.8
832.709.4835.4290.1436.4565.7033537410.42.492.210.4
469.09−11.5831.0684.9531.9456.00331.6353.56.21.421.36.2
649.51−1.7731.5684.9831.9460.60351.7368.74.61.851.84.6
842.025.3231.8385.7832.1164.50360.1381.35.62.292.23.4
Table 6. Optimal operating parameters based on the highest COP.
ParameterUnitR-744R-455AR-469AR-472A
P1, P1′, P4Mpa5.090.7932.312.73
P2, P3, P3′Mpa6.31.2433.464.51
t1°C1517.8919.3816.72
t1′°C2022.8924.3821.72
t2°C38.6333.5754.56863.21
t3°C2424.0024.40822
t3′°C22.4322.3822.321.76
t4°C1510.299.052.41
m ˙ r kg/s9.73 × 10−28.97 × 10−27.50 × 10−28.27 × 10⁻²
W ˙ c o m p kW0.9751.171.242.05
Q ˙ e v a p kW14.2115.0514.4115.43
Q ˙ c o o l e r / c o n d kW15.1916.2215.6517.48
COPmax---14.5812.8611.667.55
ηex%45.426.819.829.3
Table 7. Components’ exergy destruction at highest COP.
TermUnitR-744R-455AR-469AR-472A
I ˙ c o m p kW0.230.230.230.36
I ˙ c o o l e r / c o n d kW0.0780.2890.3570.513
I ˙ I H E kW0.02110.01270.00220.0045
I ˙ E X V kW0.200.150.150.43
I ˙ e v a p kW5.27 × 10−81.82 × 10−12.52 × 10−14.73 × 10⁻¹
E ˙ i n kW0.9751.171.242.05
ηex%45.426.819.829.3
Top of Form.
Disclaimer/Publisher’s Note: The statements, opinions and data contained in all publications are solely those of the individual author(s) and contributor(s) and not of MDPI and/or the editor(s). MDPI and/or the editor(s) disclaim responsibility for any injury to people or property resulting from any ideas, methods, instructions or products referred to in the content.

