Article

Hydrochemical Evolution and Nitrate Source Identification of River Water and Groundwater in Huashan Watershed, China

1
Hydrology and Water Resources Department, Nanjing Hydraulic Research Institute, Nanjing 210029, China
2
State Key Laboratory of Hydrology-Water Research and Hydraulic Engineering, Nanjing Hydraulic Research Institute, Nanjing 210029, China
*
Authors to whom correspondence should be addressed.
Sustainability 2024, 16(1), 423; https://doi.org/10.3390/su16010423
Submission received: 29 November 2023 / Revised: 16 December 2023 / Accepted: 20 December 2023 / Published: 3 January 2024

Abstract

:
The combined hydrochemical analysis, factor analysis, and isotopic signals of water and nitrate were applied to explore the hydrochemical origin and identify the sources and transformation of nitrate in river water and groundwater in the Huashan watershed. Additionally, a Bayesian isotope mixing model (SIAR) was employed for quantitative assessment of the nitrate sources. The results indicated that both river water and groundwater were dominated by HCO3-Ca and HCO3-Ca·Mg types; both originated from precipitation and were influenced by evaporation. The main constituent ions in the river water and groundwater primarily originated from carbonate and silicate dissolution, with the presence of cation exchange in the groundwater. The water chemistry of river water was greatly influenced by physicochemical factors, while that of groundwater was mainly controlled by water–rock interaction. NO3 in river water was mainly influenced by soil nitrogen (SN) and manure and septic wastes (MSWs), while NO3 in groundwater was jointly affected by ammonium fertilizers (AF), SN, and MSWs. With the exception of denitrification observed in the groundwater at the watershed outlet, denitrification was absent in both groundwater in the piedmont area and in river water. The SIAR model results demonstrated that the contribution rates of atmospheric precipitation (AP), AF, SN, and MSWs to river water were 12%, 21%, 25%, and 42%, respectively, while to groundwater, they were 16%, 27%, 10%, and 47%, respectively. Overall, MSWs were the main sources of nitrate in the river water and groundwater. It is necessary to prevent the leakage of MSWs when managing water resources.

1. Introduction

The Jianghuai hilly region is situated in the transitional zone between China’s temperate monsoon and subtemperate monsoon climates, characterized by a relatively abundant annual precipitation. However, the uneven spatial and temporal distribution of the precipitation, with large intra- and inter-annual variations, leads to a water shortage during seasons with lower precipitation in this region; groundwater is therefore an important supplementary source of drinking water [1,2]. With an increasing population and rapid economic development, frequent agricultural and industrial activities have significantly altered the local water environment, and the reduction of water quantity and deterioration of water quality have gradually become the critical constraints on regional socioeconomic development and production as well as life [3]. Water chemistry plays a pivotal role in understanding the water quality of aquatic systems, with nitrate being the most common and widely distributed pollutant in water, particularly under the influence of frequent agricultural and industrial activities. It is also a primary indicator for assessing water quality conditions [4,5,6]. Therefore, investigating the hydrochemical characteristics of surface water and groundwater in the Jianghuai hilly region, along with the sources and the transformation of nitrate, holds significant importance for regional water resource management and development.
The hydrochemical characteristics of water are typically influenced by various factors including atmospheric precipitation, rock weathering and dissolution, and human activities [7]. The water chemistry, as a product of long-term interactions between water and its surroundings, is an important source of information that can be used to elucidate the origin and formation of water [8,9]. Currently, Gibbs diagrams, Piper diagrams, and ion correlation analyses are commonly used in the investigation of quality in water [7,10]. However, these hydrochemical stoichiometric analyses alone may not effectively distinguish key indicators that control water chemistry characteristics. The multivariate statistical analysis, with its simplicity and efficiency in data processing, has emerged as a promising approach in hydrogeology, highlighting its potential application in this field [11]. Nitrate in water originates from various sources, and hydrochemical characteristics have traditionally been a primary method of identifying nitrogen sources in water. However, this method may not accurately identify the sources and transformation processes of nitrogen, and isotope analysis provides an important means for this [12]. Research shows that the application of δ15N-NO3 can effectively identify the source of nitrate in the water in some regions [13]. However, the single use of δ15N-NO3 can lead to the multiplicity of interpretations of the nitrate source tracing results when the δ15N-NO3 values of different sources overlap. Consequently, the combined use of δ15N-NO3 and δ18O-NO3 values has become a common approach for nitrate source tracing [14,15]. The positive correlation between δ15N-NO3 and δ18O-NO3 values (∆δ15N/∆δ18O ≈ 1.3~1.9) can also effectively indicate denitrification processes [3,16]. Currently, water environment management is shifting from traditional static management to dynamic management based on the dynamic characteristics of the pollutant source emissions [17]. However, at the watershed scale, the complex combination of land use leads to complex combinations of point and nonpoint source pollutants. Without the quantitative analysis of pollution sources, targeted water environment management cannot be effectively conducted. Therefore, on the basis of achieving the qualitative identification of nitrogen sources using δ15N-NO3 and δ18O-NO3 values, the combination of nitrate isotope analysis with a mass balance mixing model has been used for quantitative source identification [18]. However, this model has limitations, as it does not account for the spatiotemporal variability of isotopes or situations where there are more than three nitrate sources. Bayesian isotope mixing models (SIAR) have overcome the limitations of mass balance mixing models and have gradually been used for the quantitative identification of nitrate sources in water bodies in recent years [19,20,21]. The successful application of the SIAR model holds significant implications for improving dynamic watershed water resource management.
The Huashan experimental watershed located in the southwestern part of the Jianghuai hilly region was chosen as the study area. It is a typical agricultural small watershed and one of the main experimental watersheds for hydrology research established by China, based on the International Hydrological Program (IHP), since the founding of the country [22]. Most researchers have focused on the study of water chemistry characteristics, nitrogen sources, and nitrogen cycling processes at global, regional, or large watershed scales, and substantial research achievements have been made. However, the limited monitoring points at large-scale regions coupled with the numerous uncertainties between these points often result in an unclear understanding of hydrochemical evolution and the nitrogen transformation processes, introducing uncertainties into research findings. In contrast, experimental watersheds for hydrology research have a smaller spatial scale, serving not only as independent hydrological units but also as independent natural ecosystems and socioeconomic units. Data obtained from in situ observations and experiments in these watersheds offer an effective approach to understanding water environments. Currently, data from experimental small watersheds such as the WE-38 watershed in the United States [23], the ZagoDonka watershed in Poland [24], and China’s Wudaogou runoff experimental watershed [25] have contributed significantly to the study of hydrological cycles, the mechanisms of watershed nonpoint source pollution, and other research areas. However, research on the Huashan experimental watershed has mostly focused on surface runoff processes and nitrogen budgets [26,27]. There has been limited attention directed towards the hydrochemical origins of nitrate sources and nitrate’s transformation process of water in this region. Hence, the hydrochemical anaylsis and isotope tracing techniques are combined to elucidate the hydrochemical origins, qualitative and quantitative identification of nitrate sources, and nitrate’s transformation processes of surface water and groundwater in the experimental watershed. In summary, this research will provide a scientific basis for the utilization and protection of surface water and groundwater in the study area, while also offering theoretical support for understanding the nitrogen cycling processes in the watershed.

2. Materials and Methods

2.1. Study Area

The Huashan watershed is located in Chuzhou City, Anhui Province, China, and covers an area of approximately 80.13 km2. The region is situated between the latitudes 118°8′8″ to 118°16′50″ E and longitudes 32°13′16″ to 32°18′52″ N. The regional climate is a warm-temperate, semi-humid monsoon climate zone, with droughts and low rainfall in the winter and high temperatures and rain in the summer. The annual mean temperature is 15.2 °C and the annual mean precipitation is 1048.5 mm, most of which occurs from April to September.
The study area is characterized by the typical Jianghuai hilly terrain, surrounded by mountains on all sides with a complex topography and fan-shaped distribution of surface water systems (Figure 1). The exposed rock types in the hilly areas of the region consist mainly of Cambrian and Ordovician sedimentary limestone. Weathered products of these bedrocks include andesite, coarse-grained rock, sandstone, conglomerate, and limestone. Based on the lithology, groundwater in the area can be categorized into carbonate-fractured karst water or pore water. The carbonate-fractured karst water stored in the carbonate rocks of the Permian to Ordovician strata is mainly recharged by precipitation and is discharged into mountain-front pore groundwater or weakly confined water. The pore water stored in the Quaternary sediments is primarily recharged by precipitation; additionally, it recharges through mountain-fractured karst water and river water during the flood season. Considering the burial conditions, groundwater can be divided into shallow groundwater and confined groundwater. This study focuses on shallow groundwater, as it is more affected by human activity, particularly in terms of nitrate contamination.

2.2. Sampling

A total of 46 samples, including 1 precipitation sample, 16 river water samples, and 29 groundwater samples (Figure 1) were collected in November 2021. For river water samples, the depth of the sampling river section was generally greater than 0.5 m. The sampling points were in the middle of the river water depth if the sampling river section fell between 0.5 and 0.6 m. The sampling point was positioned below the water surface at a depth of 0.3 to 0.5 m, and above the riverbed at a depth of 0.3 to 0.5 m if the depth of the sampling river section higher than 0.6 m. Groundwater samples were collected from wells with depths ranging from 2.16 to 10.62 m. Before sampling, groundwater was pumped for 30 min until the EC value stabilized. The pH, temperature (T), electrical conductivity (EC), oxidation–reduction potential (ORP), and dissolved oxygen (DO) were measured in situ using a precalibrated portable water quality analyzer (HQ30D). Samples were collected separately. The HCO3 and CO32− contents were measured by the Gran titration methods on-site. Samples for the analyses of major ions (Na+, K+, Ca2+, Mg2+, Cl, SO42−, and NO3) and Si were filtered on-site using 0.45 μm filters and collected in 100 mL polyethylene bottles. Samples for the analyses of δD-H2O and δ18O-H2O were sealed immediately after filling the 100 mL polyethylene bottles to prevent evaporation. Samples for the analyses of δ15N-NO3 and δ18O-NO3 were collected in 100 mL polyethylene bottles and kept cold on-site using ice bags. All sampling bottles were precleaned in the laboratory with ultrapure water and rinsed with the water sample that was collected three times before sampling. The samples were brought back to the laboratory at the Nanjing Hydraulic Research Institute after sampling, and the samples for δ15N-NO3 and δ18O-NO3 were frozen immediately and stored at −20°, while the other samples were stored at 4 °C before analysis. All analyses were completed within two weeks after sampling.

2.3. Laboratory Analysis

Major ions (Na+, K+, Ca2+, Mg2+, Cl, SO42−, and NO3) were analyzed using ion chromatography (Thermo ICS-900, Washington, DC, USA), and the results were evaluated using the anion–cation balance method, with errors falling within the range of ±5%. Si concentrations were determined using a flow injection analyzer (SKALAR San++, Breda, The Netherlands). The δD-H2O and δ18O-H2O values were measured using a stable isotope mass spectrometer (Isoprime 100, Berlin, Germany) with analytical precisions of ±0.03‰ and ±0.02‰. The δ15N-NO3 and δ18O-NO3 values were determined using the “denitrifier” methods [28,29] and tested with an isotope ratio mass spectrometer (Thermal Fisher, DELTA-V, Washington, DC, USA). The values of δ15N-NO3 and δ18O-NO3 were calibrated by three international standards: USGS32, USGS34, and USGS35, and the analytical precision was ±0.4‰ for δ15N-NO3 and ±0.5‰ for δ18O-NO3. All the above analyses were conducted in the Key Laboratory of Environmental Science and Engineering at Sun Yat-sen University.

2.4. Data Analysis

To quantify the contributions from multiple nitrate sources in river water and groundwater, the Bayesian stable isotope mixing model (stable analysis in R, SIAR) was applied based on the isotopic compositions of nitrate. The SIAR model can be briefly described as follows:
X i j = k = 1 K P k S j k + C j k + ε i j
S j k ~ N μ i k , ω j k 2 , C j k ~ N λ i k , τ j k 2 , S j k ~ N 0 , σ j 2
where Xij represents the isotope value j for sample I, in which i = 1, 2, 3, …, I and j = 1, 2, …, J. Pk is the contribution ratio of nitrate source k (where k = 1, 2, 3, …, K). Sjk is the isotope value j for nitrate source k, which follows a normal distribution with a mean of μik and a standard deviation of ωjk2. Cjk is the fractionation factor of the isotope j for nitrate source k, which follows a normal distribution with a mean of λ i k and a standard deviation of τ j k 2 . ε i j is the residual error indicating the unexplained variability between individual mixtures and follows a normal distribution with a mean of 0 and a standard deviation of σ j 2 .

3. Results and Discussion

3.1. Hydrochemical Characteristics

The field parameters and constituents of river water and groundwater are presented in Table 1. For river water, the pH values range from 6.31 to 9.46 with a mean value of 7.67, showing a slightly alkaline environment. The DO concentrations vary from 5.29 to 14.72 mg/L with an average of 9.28 mg/L, and the ORP values are consistently positive, indicating that the river water is in an oxidizing environment. For groundwater, the pH values range from 6.43 to 7.16 with an average of 6.82, showing a slightly acidic to neutral environment. The DO contents vary from 3.08 to 8.19 mg/L with a mean value of 4.62 mg/L, and the ORP values vary over a wide range, from −91.70 to 229.20 mV with an average of 117.11 mV, indicating that both oxidizing and reducing environments are present in the groundwater.
The precipitation, river water, and groundwater are all freshwater, with mean TDS values of 20.66 mg/L, 230.10 mg/L and 313.89 mg/L, respectively (Table 1). HCO3 acts as the dominant anion and Ca2+ and Mg2+ are the dominant cations for these water samples, and the hydrochemical types are all HCO3-Ca and HCO3-Ca·Mg (Figure 2).

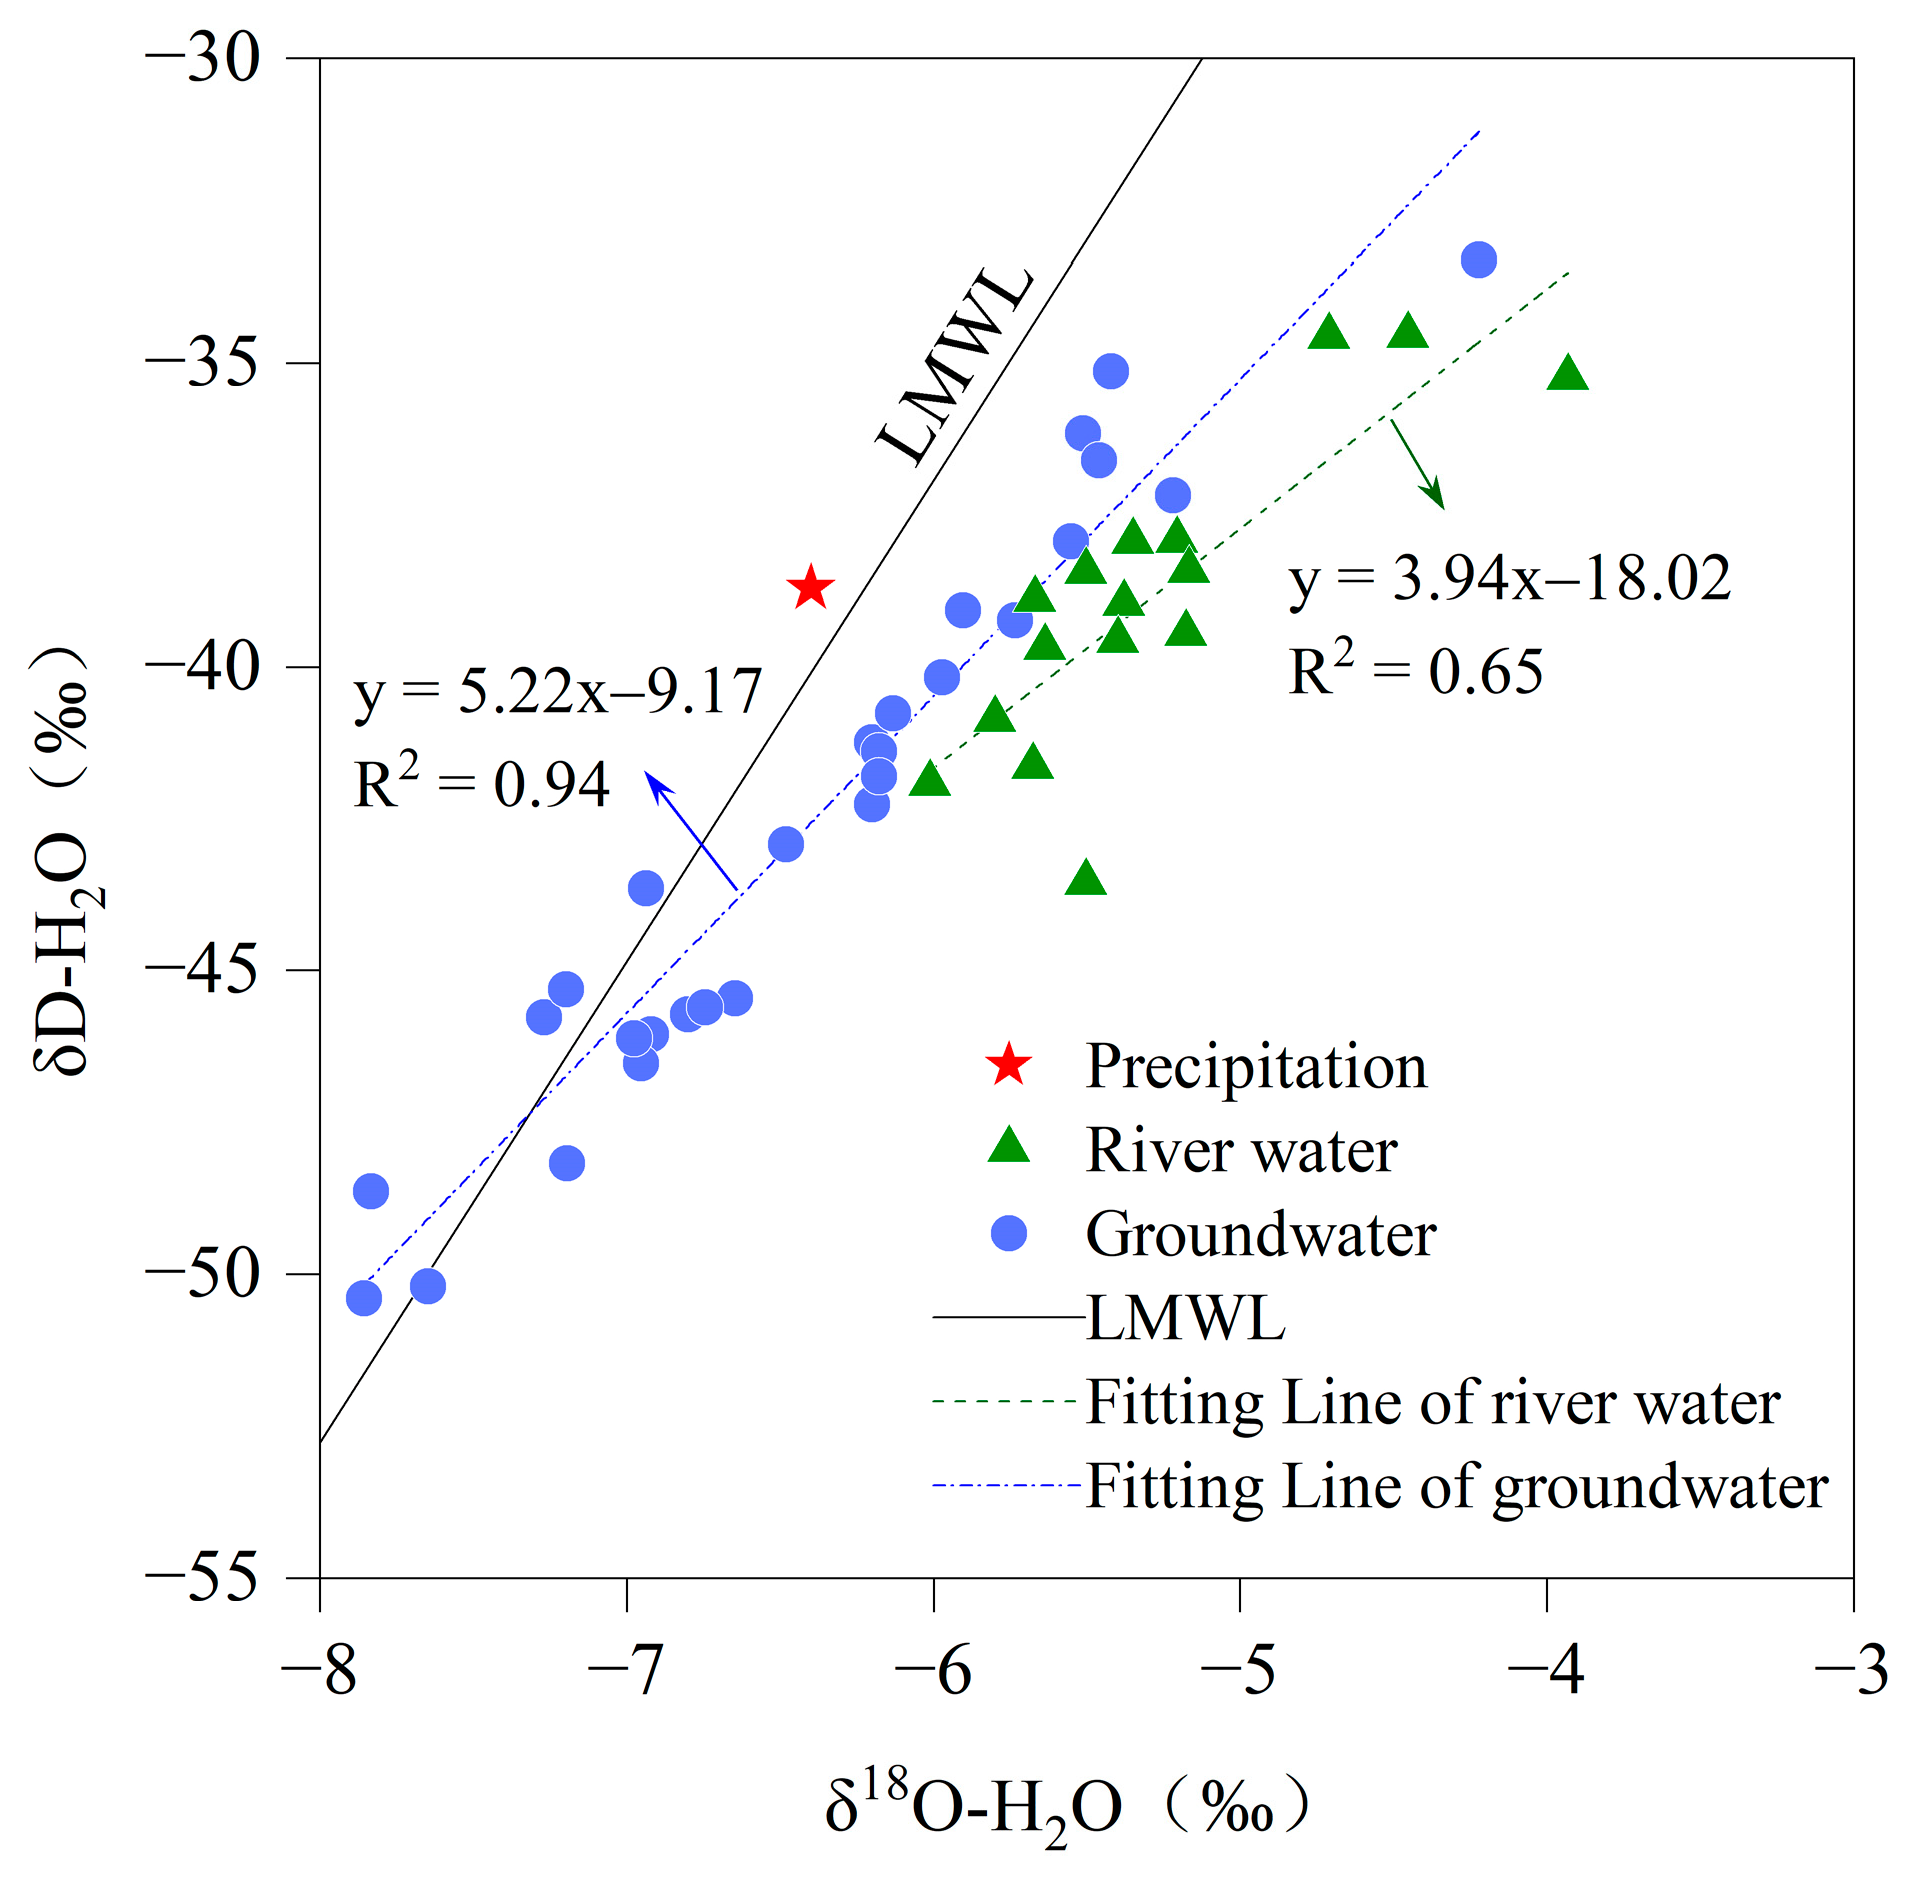
3.2. Origins of River Water and Groundwater

The isotopic ratios of hydrogen (δD-H2O) and oxygen (δ18O-H2O) have been widely used to explore the origins of water [30,31]. As shown in Figure 3, the river water samples and groundwater samples are basically distributed around the local meteoric water line (LMWL), indicating that they both originate from precipitation. The slopes of the fitting lines for river water (ΔδD/Δδ18O = 3.94) and for groundwater (ΔδD/Δδ18O = 5.22) are lower than that of the LMWL, indicating the influence of evaporation on both river water and groundwater, and suggesting that the river water is more strongly influenced by evaporation.

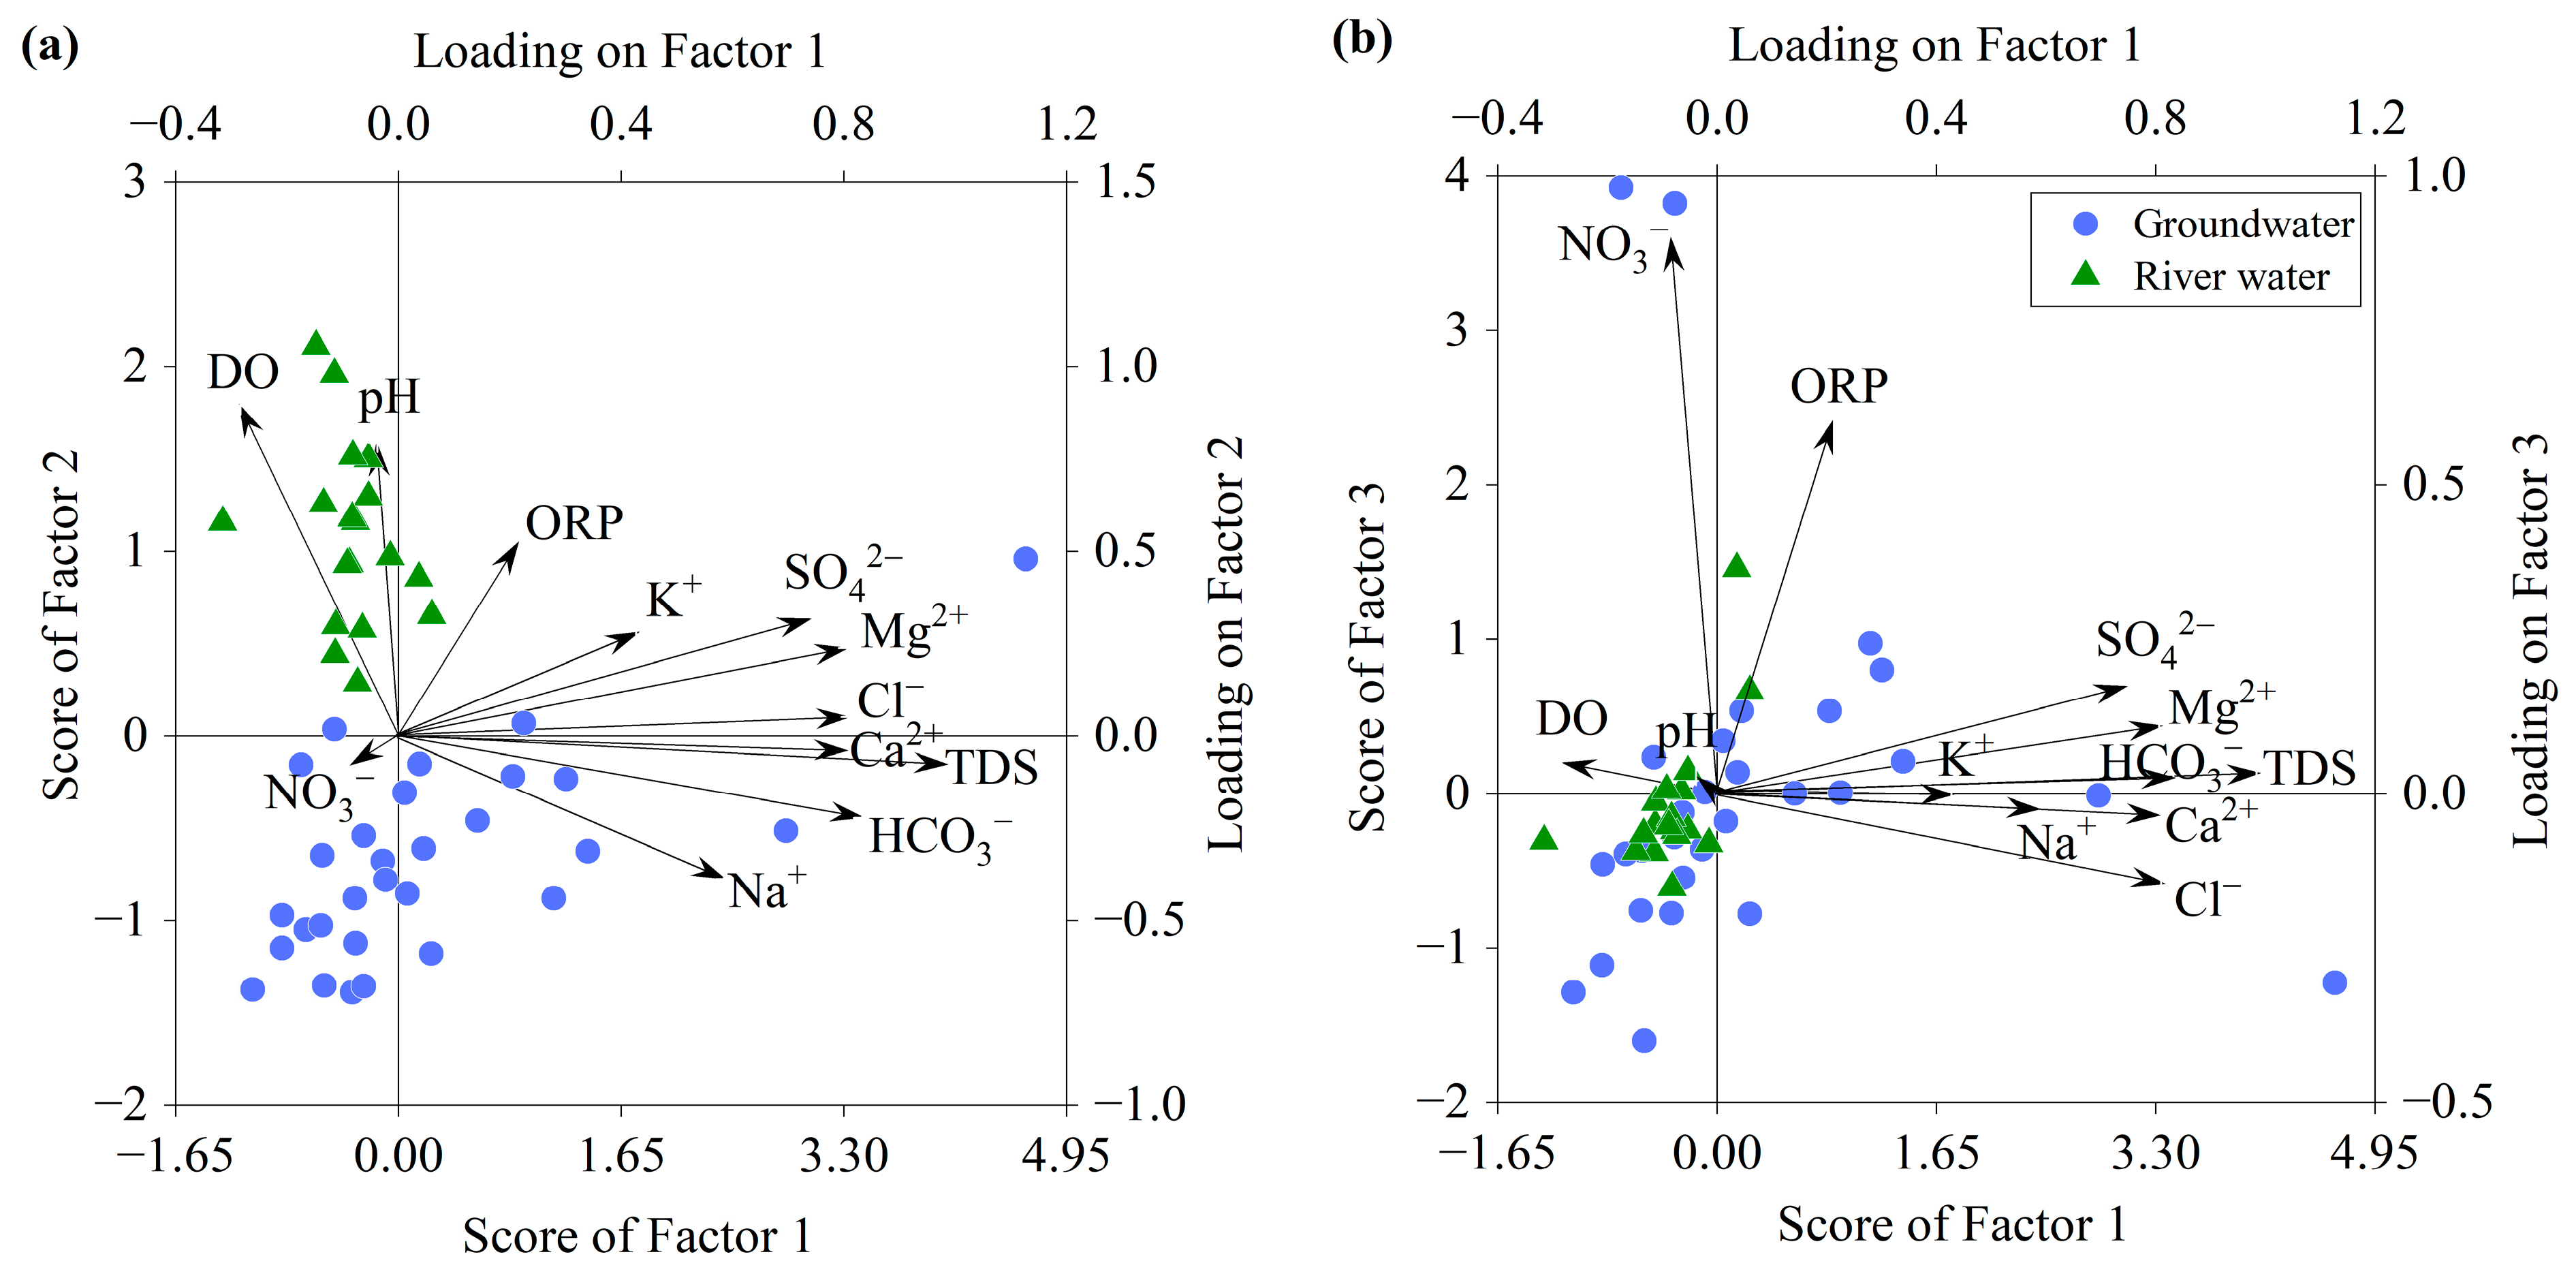
3.3. Factors Controlling Water Chemistry

The Gibbs diagram is commonly employed to assess the three main natural factors controlling the hydrochemical composition of water, including precipitation, water–rock interactions, and evaporation [13]. As shown in Figure 4, both the surface water and groundwater samples fall within the zone of rock–water interactions, indicating that the major elements of both surface water and groundwater are primarily influenced by rock weathering processes. The Na+/(Na+ + Ca2+) ratio in groundwater increases with rising TDS, suggesting the possible presence of cation exchange processes [32].
Due to the complexity of aquatic environments, the Gibbs diagram cannot illustrate all the key factors, such as human activity, that control the water chemistry. Further insights into the primary factors controlling the water chemistry can be obtained through factor analysis. Factor analysis refers to the statistical technique of extracting common factors from variable groups; it is a dimensionality reduction method. Through factor analysis, the few factors with a practical significance were identified and reflected the basic structure of the original data. Generally, the identified factors summarize most of the information about the original variable. Using factor analysis with a KMO coefficient = 0.61 and Bartlett’s test with p < 0.05, three main factors that can explain 86.4% of the total variance are extracted as shown in Figure 5. Factor 1 had positive high loadings on TDS (0.98), HCO3 (0.83), Mg2+ (0.81), Ca2+ (0.81), Cl (0.81), SO42− (0.74), and Na+ (0.59), which can be defined as a water–rock interaction factor. Factor 2 showed positive loadings on DO (0.90), pH (0.79), and ORP (0.52), mainly representing the influence of the physicochemical environment on the hydrochemistry. Factor 3 exhibited positive loadings on NO3 (0.90) and ORP (0.60), mainly reflecting the level of nitrate pollution. According to the results of the factor analysis, the water chemistry of river water is most influenced by physicochemical environmental factors while that of groundwater is mainly controlled by water–rock interactions. In addition, parts of the groundwater samples showed a higher influence of human activities like the application of fertilizers and the infiltration of manure and septic waste, which consequently elevated the NO3 levels. The formation of the water’s chemistry can be further elucidated based on the correlation among various ions in the water, as shown below.

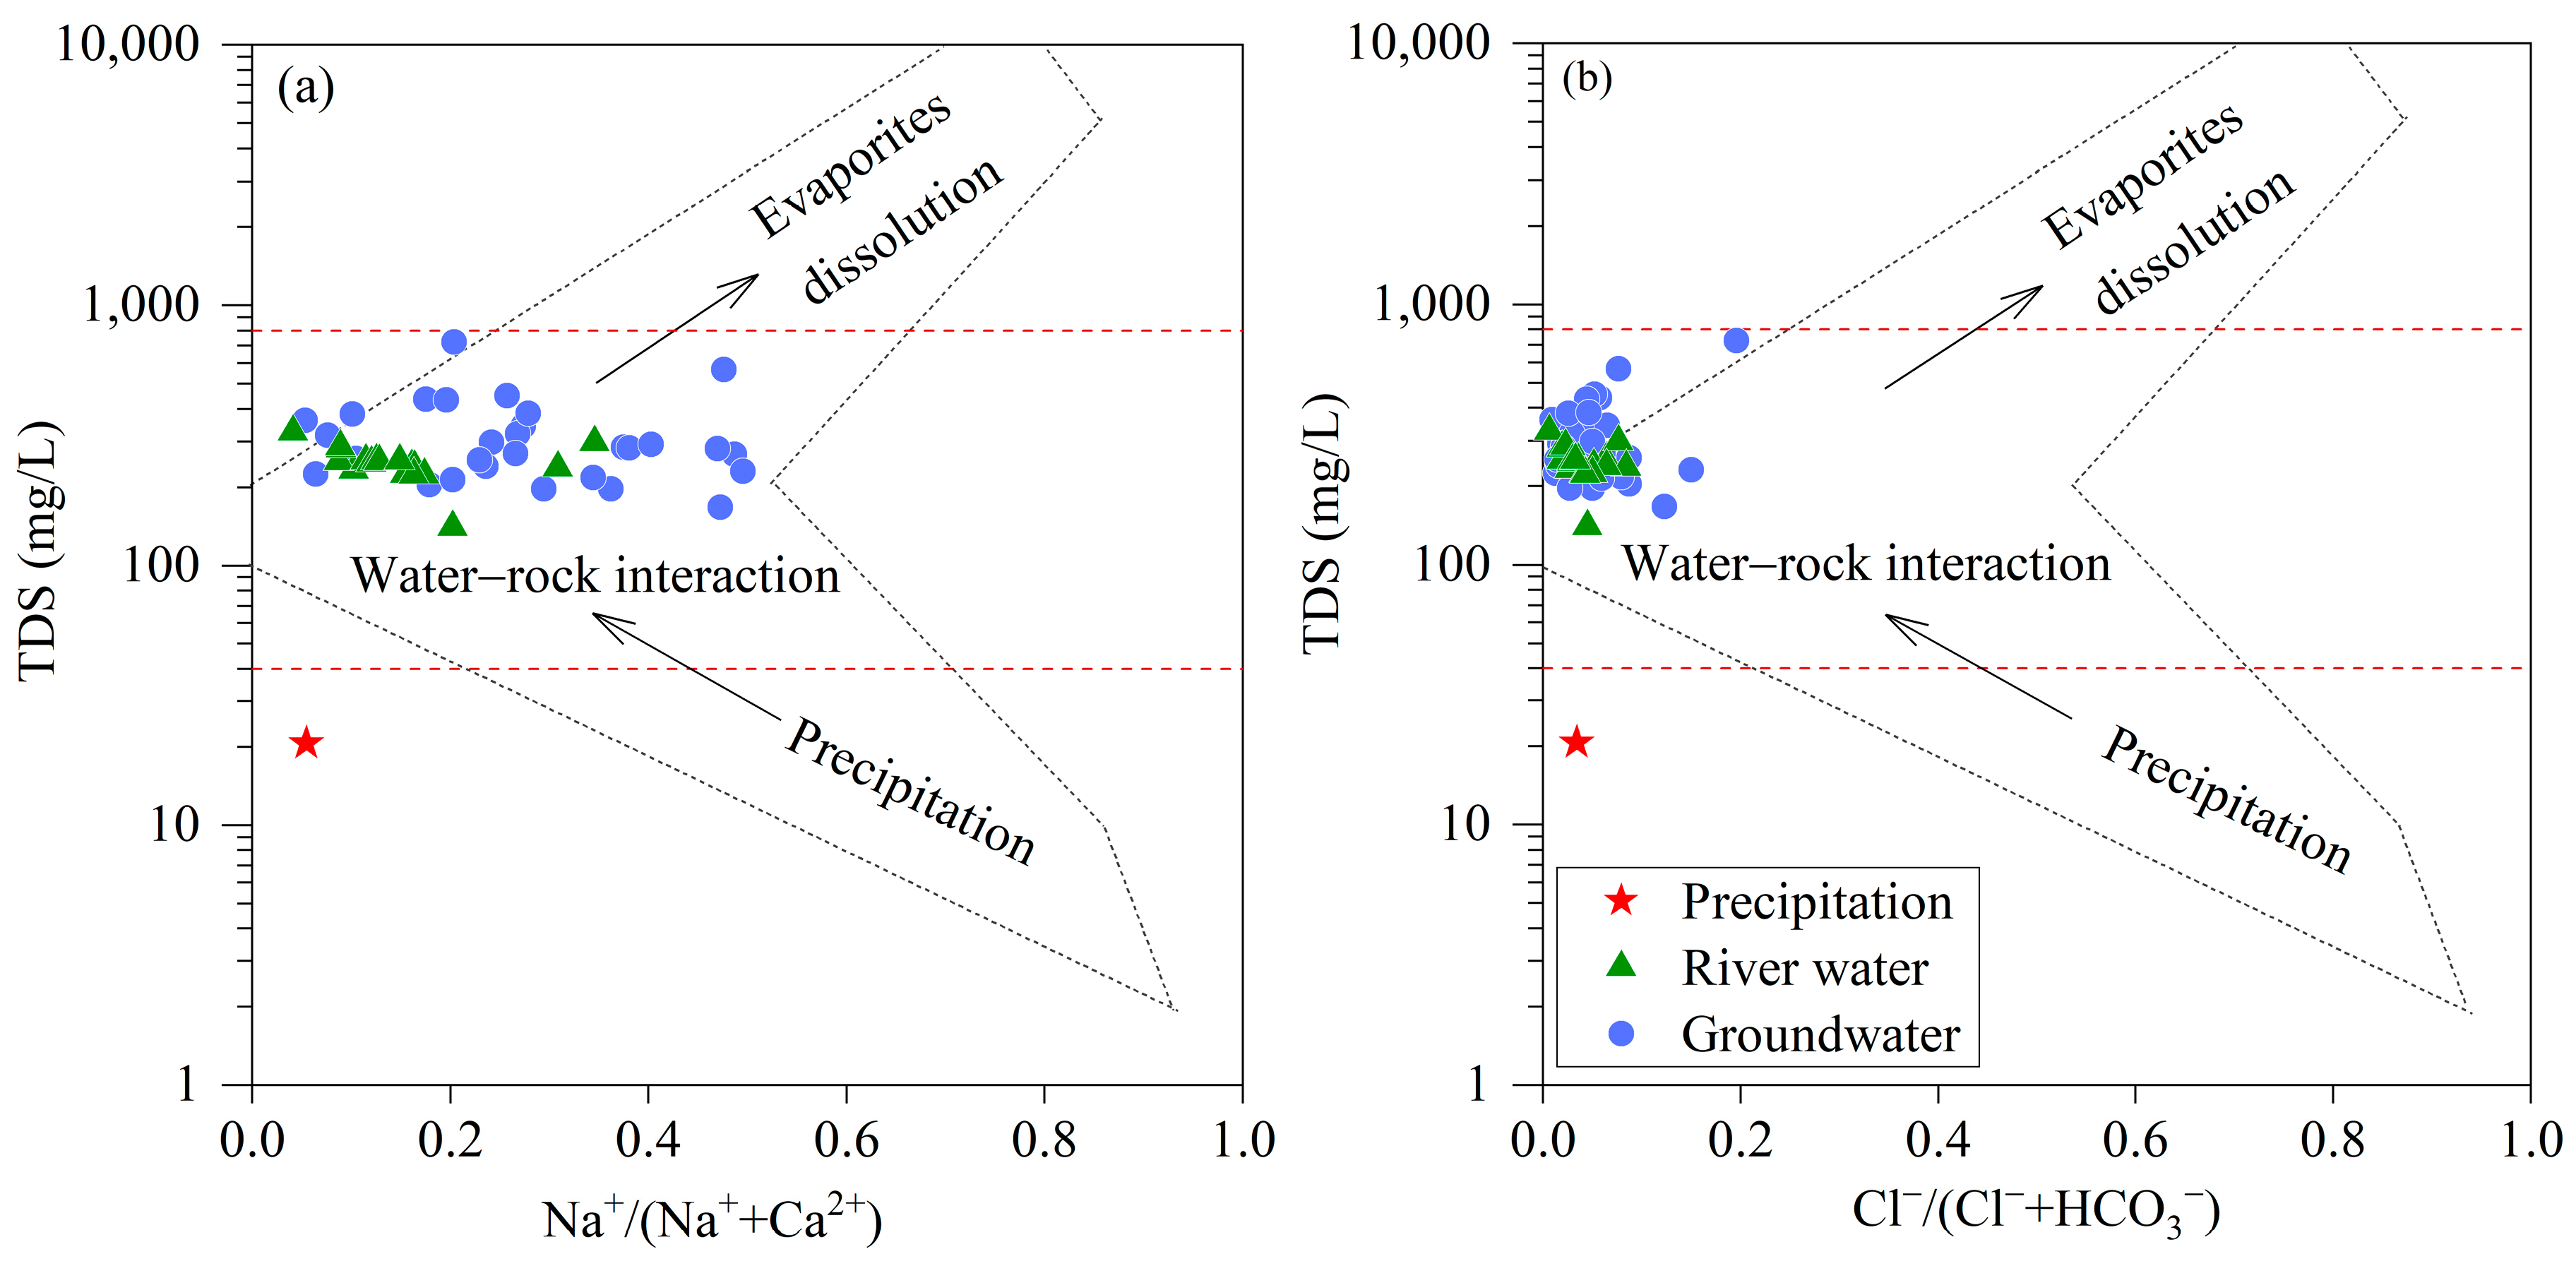
3.3.1. Water–Rock Interaction

The molar ratios between Ca/Na and Mg/Na and between Ca/Na and HCO3/Na are often used to assess the influence of different rock weathering processes on the hydrochemical composition [33]. As shown in Figure 6a,b, the river water samples and groundwater samples are both located between the silicate rock weathering zone and the carbonate rock weathering zone and are closer to carbonate rock weathering zone, indicating that the hydrochemical compositions of both river water and groundwater are mainly influenced by the dissolution of carbonate rocks, with some contribution from silicate rock weathering. The positive correlations between (HCO3+CO3) and Ca (Figure 6c) and between (HCO3+CO3) and (Ca+Mg) (Figure 6d) also indicated that the dissolution of carbonate rocks is the main source of Ca2+, Mg2+, and HCO3 in both river water and groundwater. The average dissolved Si concentrations in river water and groundwater are 4.03 mg/L and 12.82 mg/L, respectively, indicating the dissolution of silicate minerals. No significant positive correlation between Na+ and HCO3 was observed in either river water and groundwater (Figure 6f), and the Na/Cl milliequivalent ratio is farther from the 1:1 line (Figure 6e), suggesting that silicate rocks are not the sole source of Na+ in these waters. The positive relation between Na+ and Cl (Figure 6e) suggests that the Cl and parts of Na+ originate from the dissolution of salt rock minerals. The positive correlation between SO42− and Ca2+ in groundwater (Figure 6g) suggests that the SO42− also originated from the dissolution of carbonate rock minerals such as gypsum.

3.3.2. Ion-Exchange Processes

As shown in the Gibbs diagram (Figure 4), the Na+/(Na+ + Ca2+) ratio in groundwater increases with rising TDS, indicating that cation exchange may have certain impacts on the cation composition in groundwater. The relationship between (Na+K-Cl) and (Ca+Mg-HCO3-CO3-SO4) had been widely used to illustrate the cation exchange processes in groundwater [15]. As shown in Figure 7a, the (Na+K-Cl) versus (Ca+Mg-HCO3-CO3-SO4) shows a negative relationship, and the majority of the groundwater samples are located on both sides of the 1:1 line, demonstrating the existence of cation exchange between Na+/K+ and Ca2+/Mg2+ in the groundwater. The chloro-alkaline indices CAI1([Cl-(Na++K+)]/Cl) and CAI2 ([Cl-(Na++K+)]/(HCO3+CO32−+SO42−)) were generally applied to characterize the direction and intensity of cation exchanges [34]. The negative values of CAI1 and CAI2 represent the occurrence of Equation (1), while the positive values of CAI1 and CAI2 indicate the occurrence of Equation (2). The CAI1 and CAI2 values of the river water samples range from −1.73 to −0.14 and from −0.13 to −0.01, with mean values of −0.95 and −0.06, respectively, indicating a weak ion exchange between Na+/K+ in the sediment and Ca2+/Mg2+ in the water. The CAI1 and CAI2 values of groundwater range from −14.71 to 0.28 and −0.52 to 0.04, with mean values of −2.67 and −0.14, respectively, suggesting a stronger ion exchange between Na+/K+ in the sediment and Ca2+/Mg2+ in the groundwater.
Ca2+(Mg2+) + 2NaX → 2Na+ + Ca(Mg)X2
Ca(Mg)X2 + 2Na+ → Ca2+(Mg2+) + 2NaX

3.3.3. Influence of Human Activity

As mentioned above, the results of the factor analysis suggested that parts of the groundwater samples showed a higher influence of human activities. For the groundwater samples, the NO3 content varied from 0.07 to 15.12 mg/L with a mean of 2.47 mg/L, which was lower than the NO3 content in the precipitation (2.74 mg/L). As for the groundwater in the piedmont region, the NO3 content generally ranged from 2 to 4 mg/L. Near the outlet of the watershed, except for samples Q13 and Q15, the groundwater had a lower NO3 content, ranging from 0 to 2 mg/L. No significant spatial trend in the NO3 content variation was observed along the groundwater flow path (Figure 8a). According to the field investigation, the watershed’s outlet area is densely populated by humans and is impacted by many activities including poultry and livestock farming. Manure and agricultural fertilizers are common sources of nitrogen nutrients in the farmland. Samples Q13 and Q15 were taken from this region and had higher NO3 contents, indicating the influence of human activities, which is consistent with the results of the factor analysis.
For the river water samples, the NO3 content ranged from 0.10 to 2.95 mg/L with an average of 0.98 mg/L, which was also lower than the NO3 content in the precipitation. No significant trend in the NO3 content variation was observed along the river flow direction (Figure 8a).
The NO3 content in most river water samples and groundwater samples was lower than that of the precipitation sample, which could be due to their precipitation origin or the occurrence of denitrification processes in the aquatic environment. Denitrification is the microbial process of reducing NO3 to N2O or N2, typically occurring in anaerobic environments with DO concentrations below 4 mg/L [35]. As shown in Figure 8b, the DO contents of all river water samples are higher than 4 mg/L, indicating the absence of denitrification in the river water. However, the DO concentrations in the groundwater samples are lower than 4 mg/L near the outlet area of the catchment, indicating the possible presence of denitrification processes that reduce the NO3- content in groundwater. The specific discussion about denitrification is given in the subsequent section.

3.4. Nitrate Sources and Transformation Processes

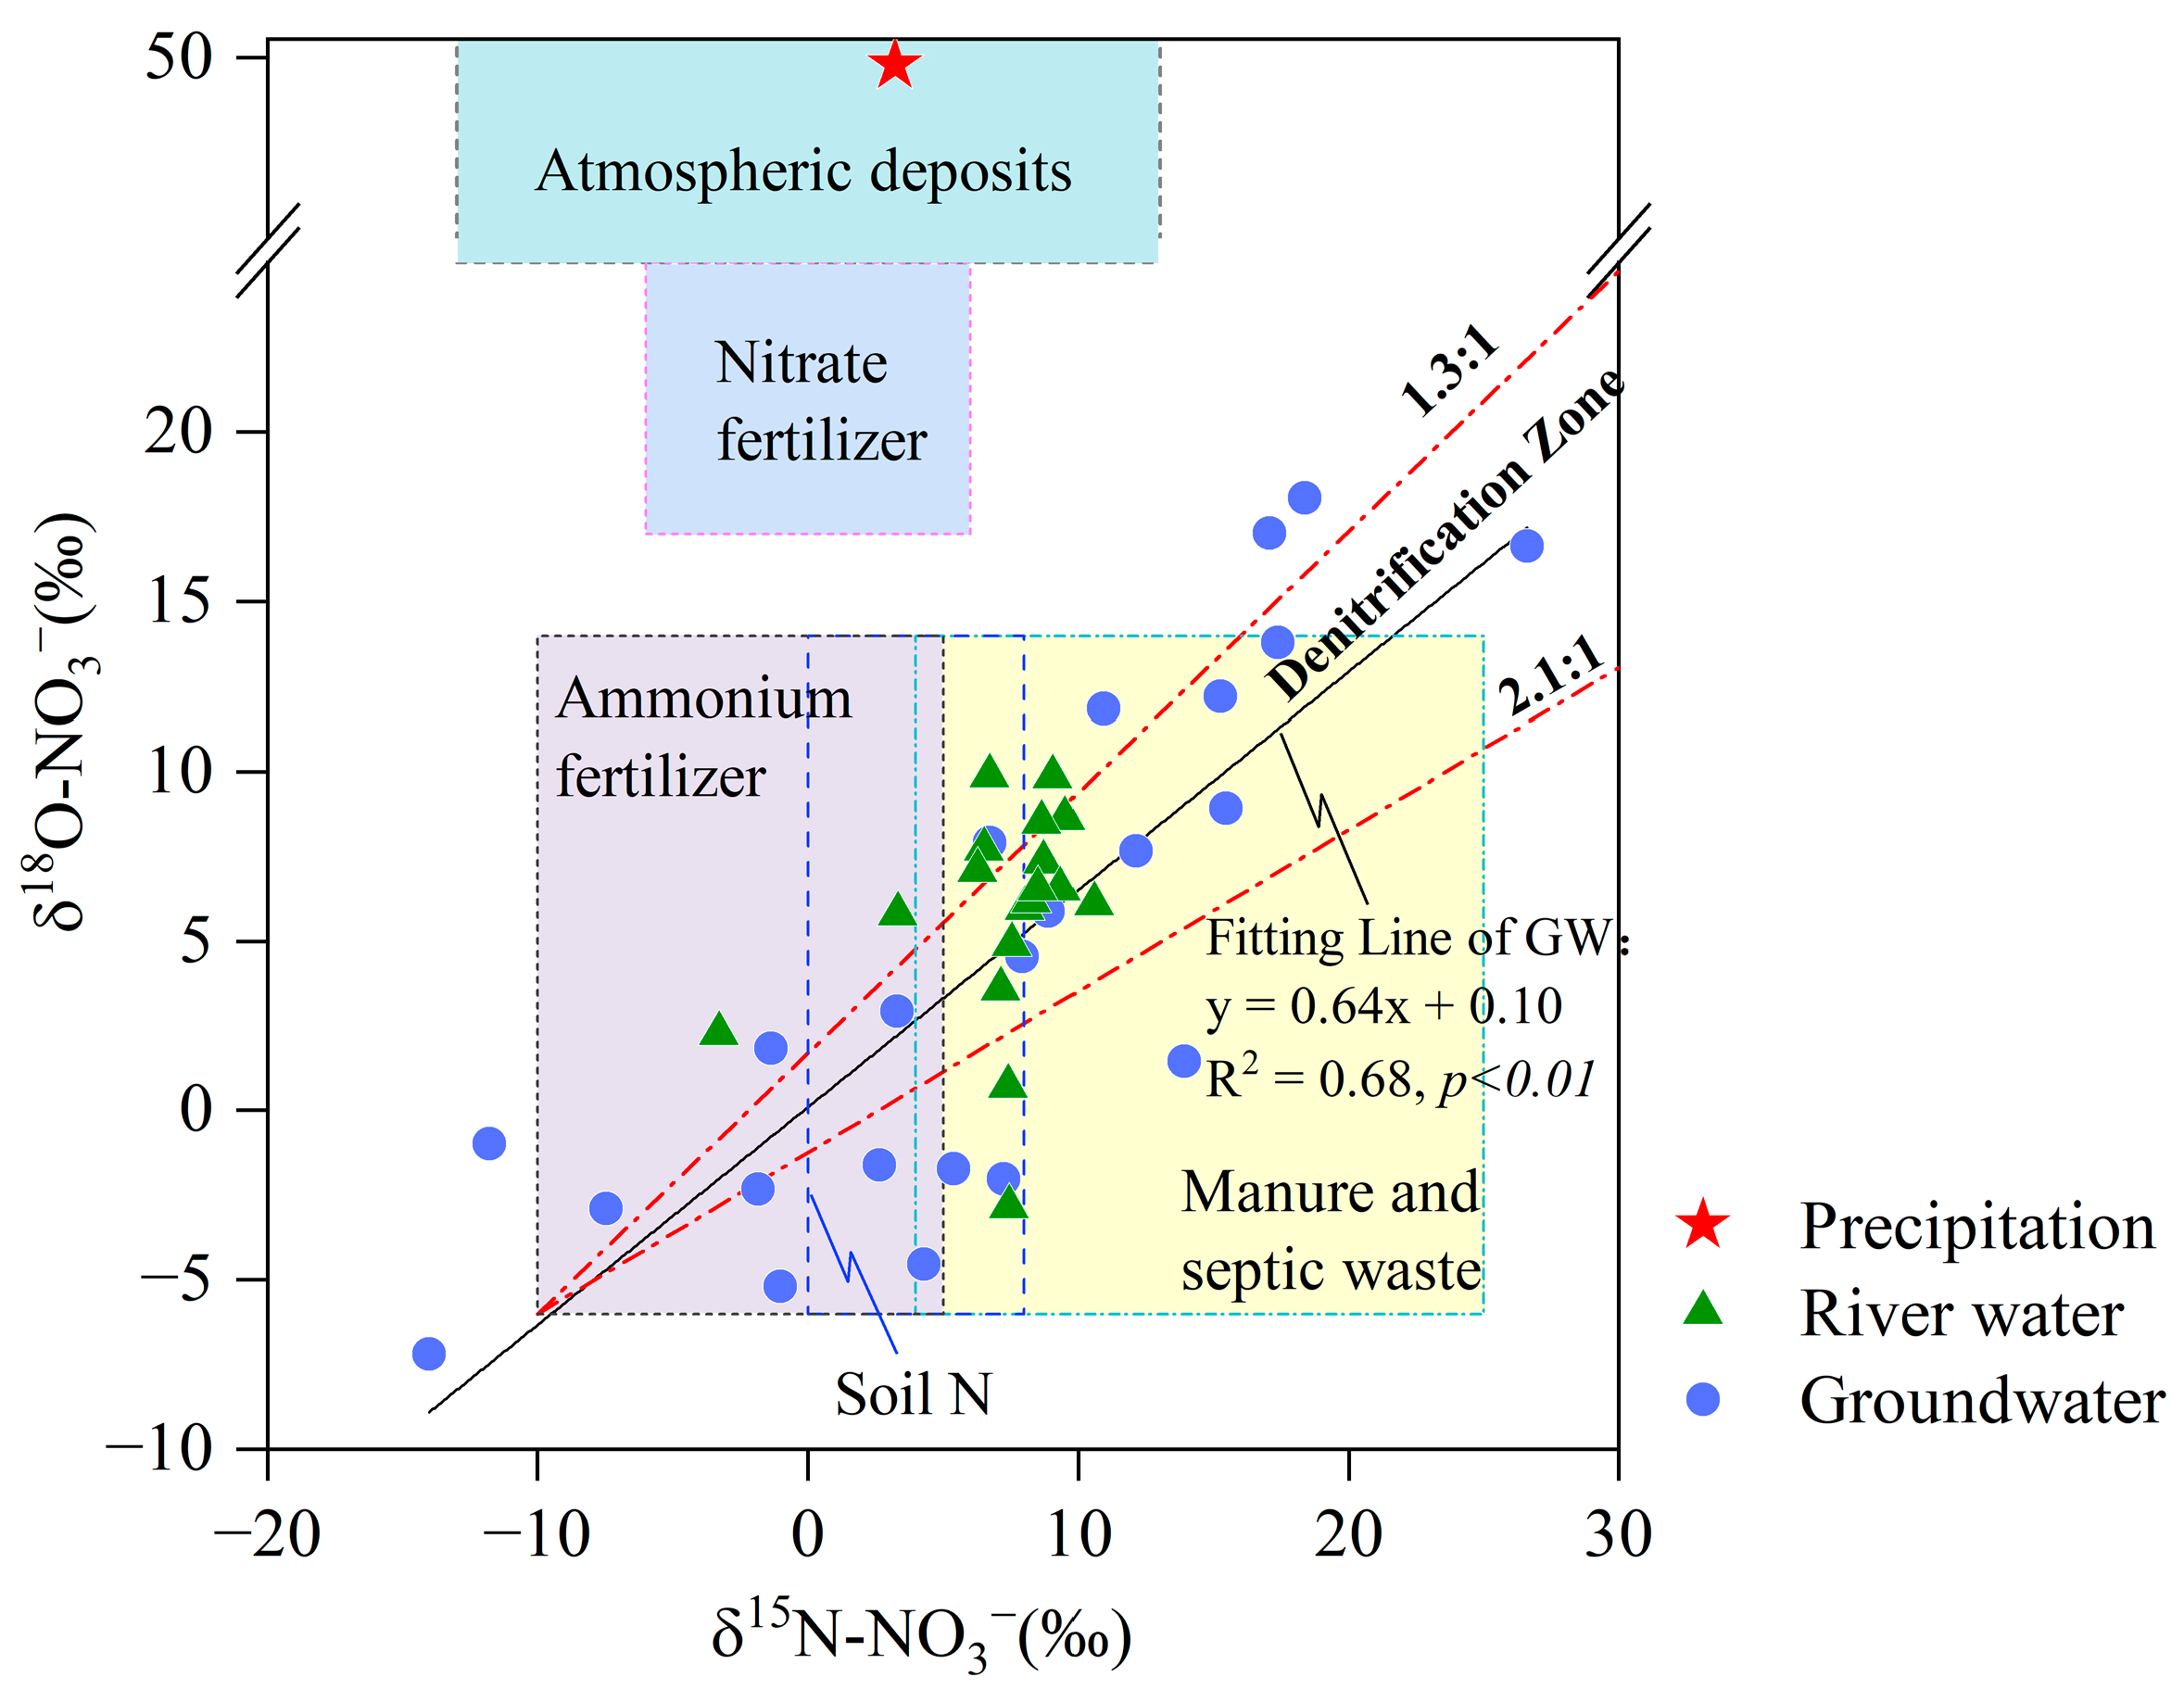
3.4.1. Qualitative Identification of Nitrate Sources

Nitrate source identification based on the dual isotope approach (δ15N-NO3 and δ18O-NO3) was widely conducted by comparing the isotopic composition between the possible nitrogen source and the water samples [36]. According to the field investigation, atmospheric nitrogen deposition, nitrate fertilizers, ammonium fertilizers, soil nitrogen, and manure and septic tank wastes are all potential sources of nitrate in the aquatic environments of the study area. The observed δ15N-NO3 and δ18O-NO3 values of most river water samples were within the expected ranges of soil nitrogen and manure and septic wastes (Figure 9), indicating that the NO3 in river water is primarily influenced by soil nitrogen and manure and septic wastes. The δ15N-NO3 and δ18O-NO3 values of the groundwater samples were within the expected ranges of ammonium fertilizers, soil nitrogen, and manure and septic wastes, suggesting that the NO3 in groundwater is all influenced by ammonium fertilizers, soil nitrogen, and manure and septic wastes.

3.4.2. Nitrate Transformation Processes

The dual stable isotope composition of nitrate has also been widely used to identify the occurrence of denitrification [13]. During denitrification, the denitrifying bacteria preferentially utilize the lighter isotopes of nitrogen, leading to the enrichment of heavier isotopes in the residual nitrate, resulting in a positive correlation between the δ15N-NO3 and δ18O-NO3 values, with δ15N/δ18O ratios typically falling in the range of 1.3 to 2.1 [5]. As shown in Figure 9, although some river water samples have δ15N/δ18O ratios within the range of 1.3:1 to 2.1:1, no significant correlation was observed between the δ15N-NO3 and δ18O-NO3 values, and the DO contents are unfavorable for denitrification, proving that denitrification did not occur in river water. For the groundwater samples, the δ15N-NO3 was positively correlated with δ18O-NO3, and the δ15N/δ18O ratios of some samples were in the range of 1.3 to 2.1, indicating the presence of denitrification in the groundwater. The DO content in the groundwater ranged from 3.08 to 8.19 mg/L with an average of 4.62 mg/L, and 24 percent of the groundwater samples had DO concentrations lower than 4 mg/L; these were mainly located in the outlet area of the watershed (Figure 8b), suggesting that denitrification is favorable in this particular area of the groundwater environment. Considering the spatial distribution of DO and the NO3 concentrations (Figure 8), it is evident that denitrification occurs mainly near the outlet of the watershed and is absent in the piedmont region. In the subsequent sections, a quantitative analysis using the stable isotope analysis in R (SIAR) model will exclude groundwater samples where denitrification has already taken place, and their fractionation factors (Cjk) will be set to 0.

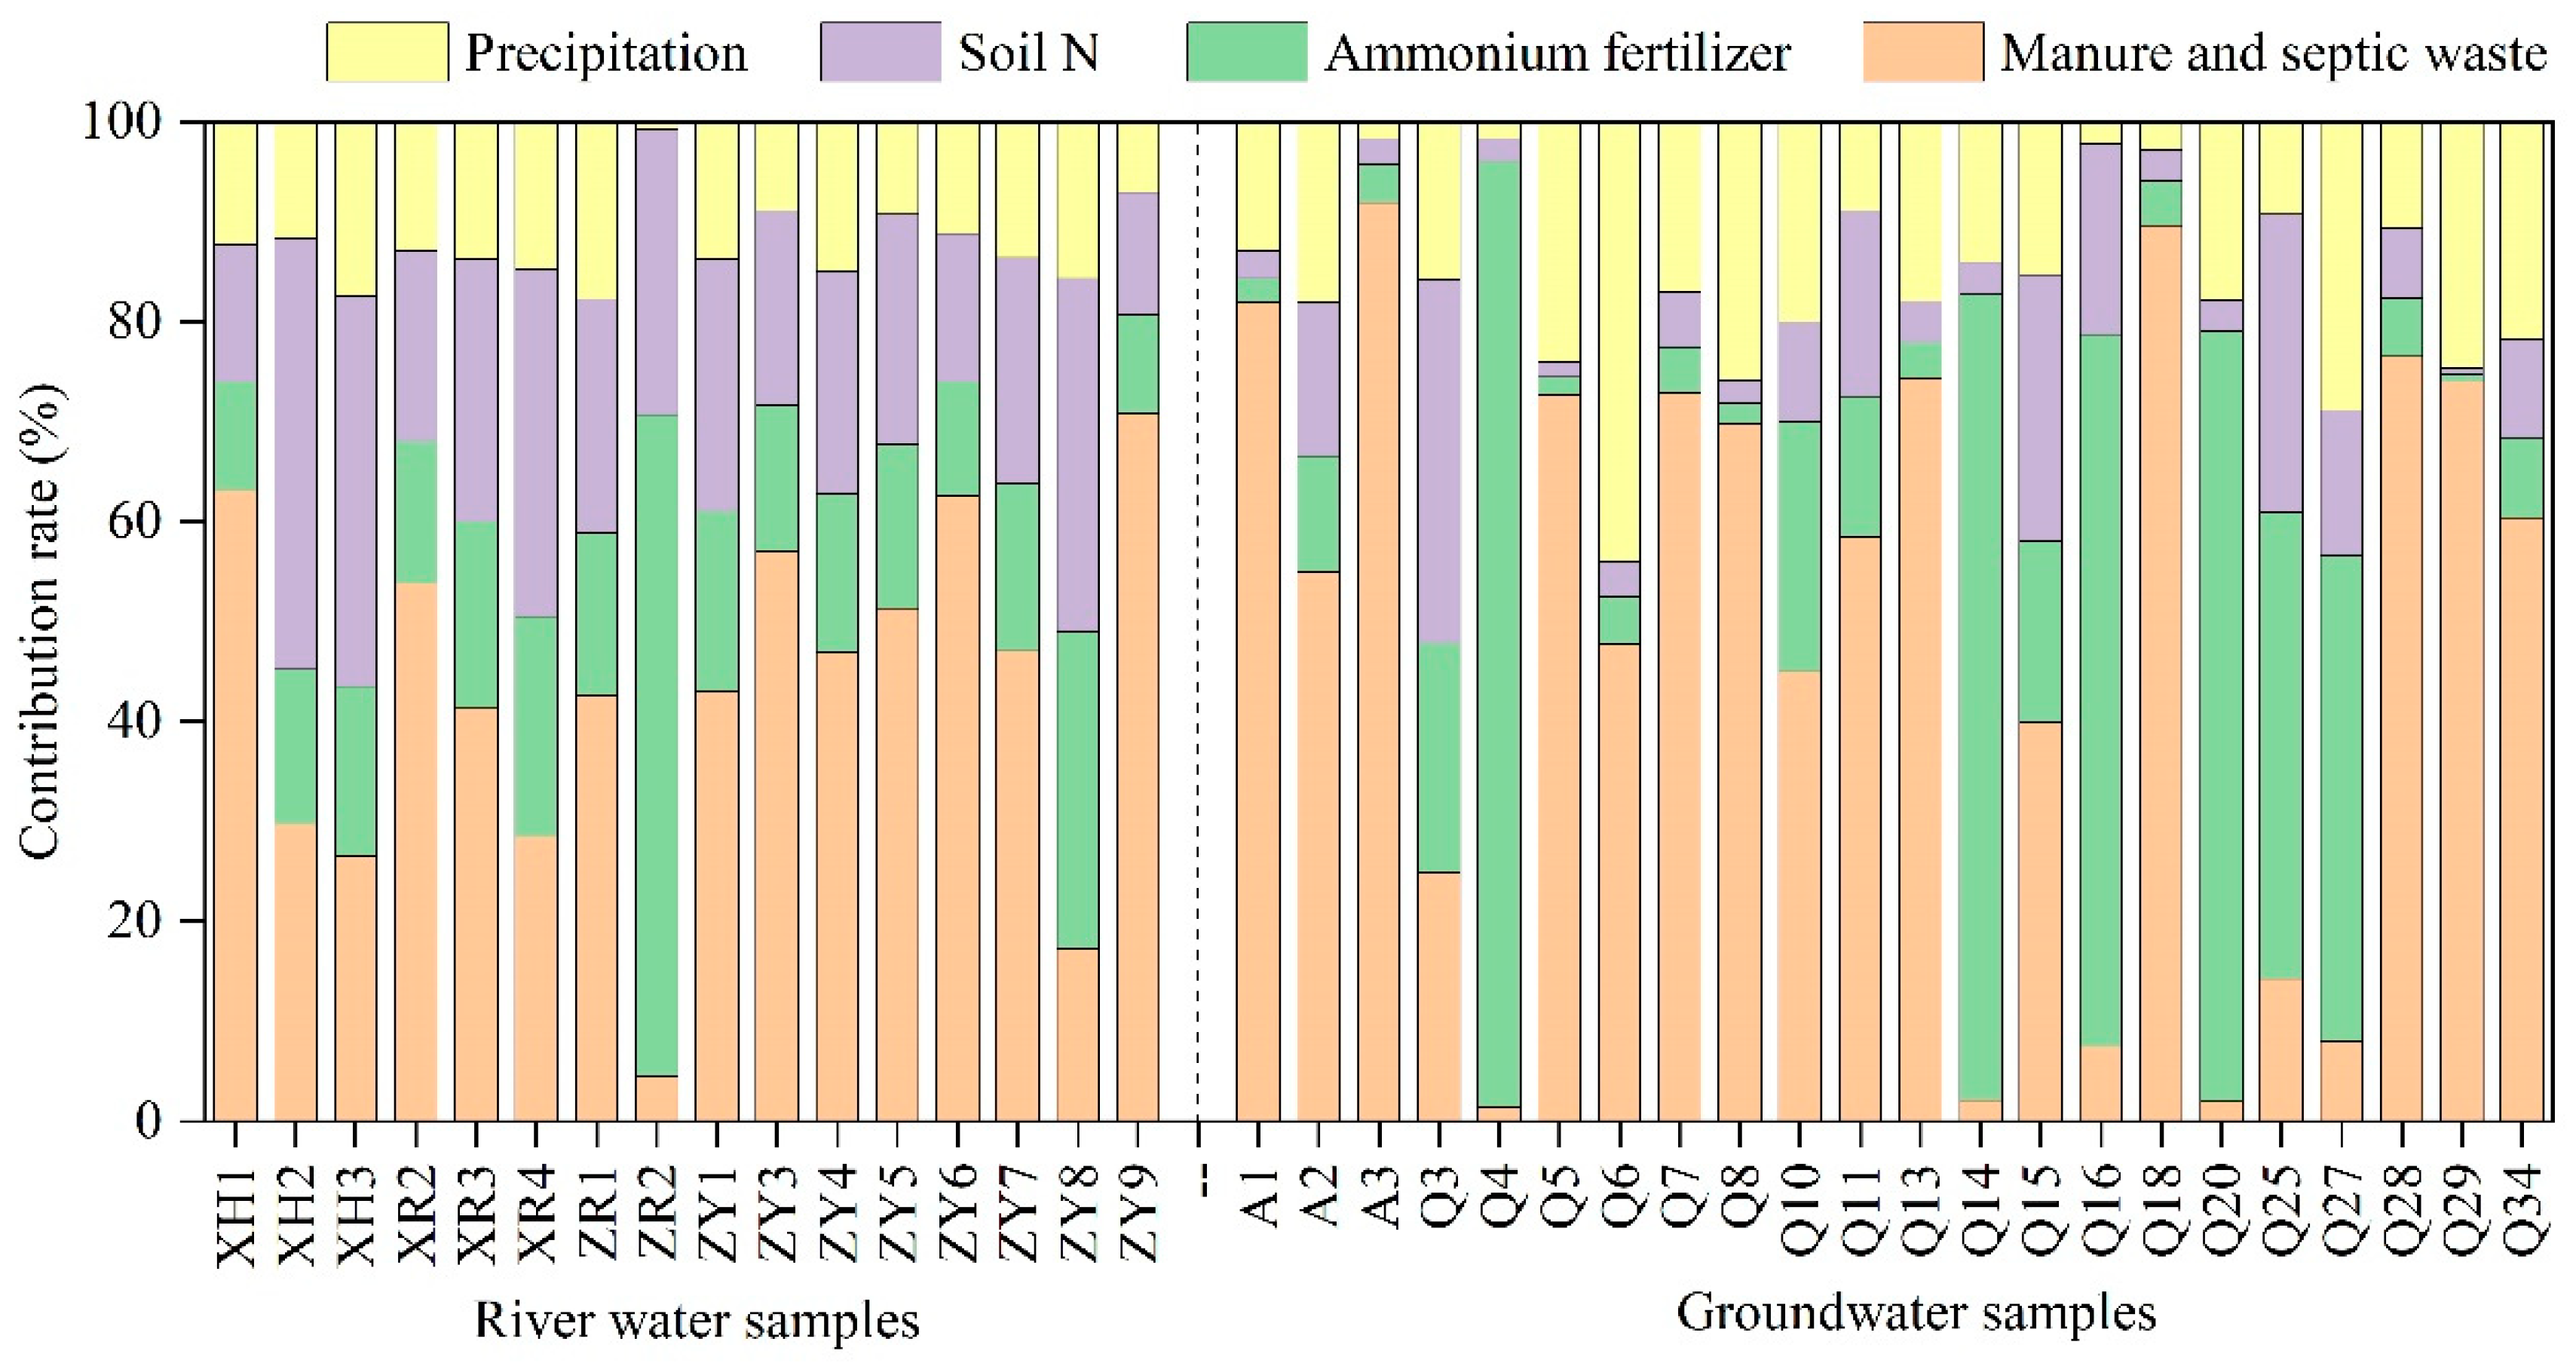
3.4.3. Quantitative Identification of Nitrate Sources

As mentioned above, the sources of river water and groundwater nitrate in the study area include atmospheric deposition, ammonium fertilizers, soil nitrogen, and manure and septic wastes. Based on the isotopic characteristics of nitrate sources, the quantitative identification of the contributions of these four sources of nitrate in the water was conducted using the stable isotope analysis in R (SIAR) model. The results obtained from the SIAR model (Figure 10) reveal that atmospheric deposition, ammonium fertilizers, soil nitrogen, and manure and septic wastes contribute to the nitrate content of surface water, with percentages of 12%, 21%, 25%, and 42%, respectively, and for the nitrate in groundwater, their respective contributions are 16%, 27%, 10%, and 47%, indicating that manure and septic wastes and soil nitrogen play a significant role in contributing to nitrate levels in the surface water, while manure and septic wastes and ammonium fertilizers are the main sources of nitrate in the groundwater. Overall, the quantitative source identification is consistent with the qualitative results that manure and septic tank effluents are important sources of nitrate in the river water and groundwater in the study area, and that protection against the leakage of manure and septic wastes is necessary when managing water resources.

4. Conclusions

A comprehensive understanding of the impacts of natural and human activities on groundwater evolution is critical for dynamic water resource management in the Jianghuai hilly region. Hence, the hydrochemical analysis, factor analysis, isotopic signals of water and nitrate, and SIAR model were integrated to elucidate the hydrochemical evolution and the sources and transformation of nitrate in the river water and groundwater in the study area. The relevant conclusions can be drawn as follows:
(1)
The river water is in a slightly alkaline and oxidizing environment, while the groundwater shows a slightly acidic to neutral environment, and both oxidizing and reducing environments were present in it. Both the surface water and groundwater were freshwater and were dominated by HCO3-Ca and HCO3-Ca·Mg types.
(2)
Both the river water and groundwater originate from precipitation and are influenced by evaporation, with the river water experiencing a stronger influence of evaporation. The main constituent ions in the river water and groundwater primarily originated from carbonate and silicate dissolution, with the presence of cation exchange in the groundwater where the displacement of Na+/K+ in the groundwater by Ca2+/Mg2+ on mineral surfaces is the dominant process. The water chemistry of the river water was greatly influenced by physicochemical factors, while that of the groundwater was mainly controlled by water–rock interactions.
(3)
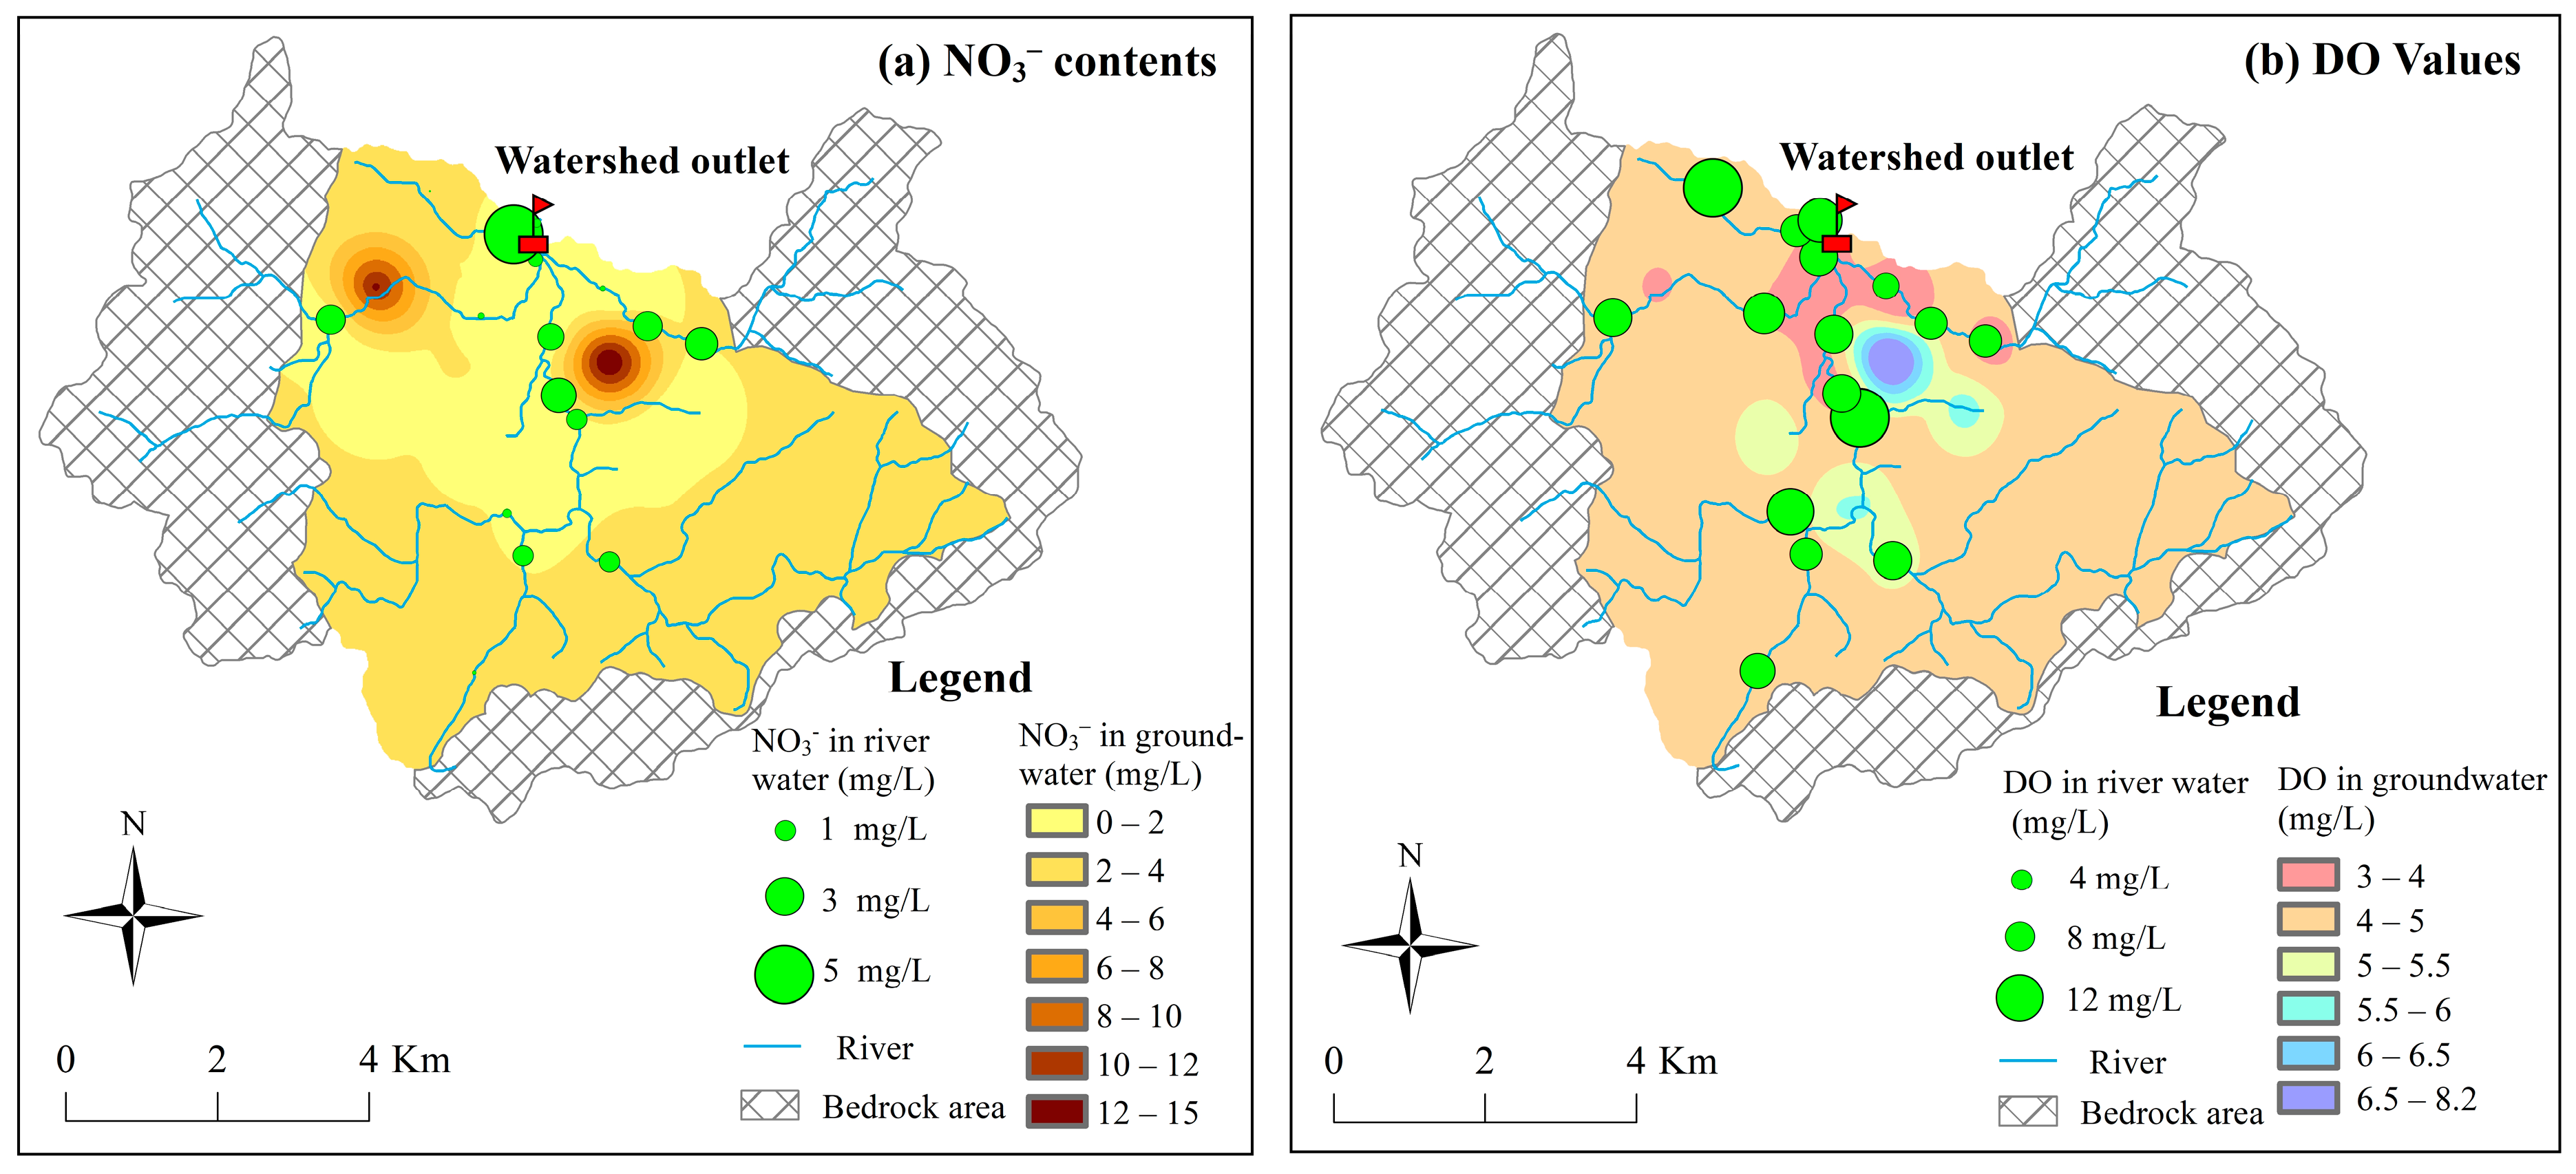
The nitrate isotopic analysis revealed that the NO3 in surface water was mainly influenced by soil nitrogen and manure and septic wastes, while the NO3 in groundwater was jointly affected by ammonium fertilizers, soil nitrogen, and manure and septic wastes. With the exception of denitrification observed in the groundwater at the watershed outlet, denitrification was absent in both the groundwater in the piedmont area and surface water.
(4)
SIAR model analysis results demonstrated that the contribution rates of atmospheric precipitation, ammonium fertilizers, soil nitrogen, and manure and septic wastes to nitrate in the river water were 12%, 21%, 25%, and 42%, respectively, while contribution rates to nitrate in the groundwater were 16%, 27%, 10%, and 47%, respectively. Overall, manure and septic wastes were the main sources of nitrate in the river water and groundwater in the study area. It is necessary to prevent the leakage of manure and septic wastes when managing water resources.

Author Contributions

Conceptualization, X.L.; Methodology, X.L.; Software, L.Z.; Formal analysis, L.Z. and X.M.; Investigation, H.W.; Data curation, L.Z. and J.H.; Writing—original draft, X.L.; Writing—review & editing, J.L.; Supervision, Y.D.; Funding acquisition, J.L. All authors have read and agreed to the published version of the manuscript.

Funding

This work was supported by the National Natural Science Foundation Youth Fund of China (grant No. 42202289), and the National Key R&D Program of China (grant No. 2021YFC3200501).

Data Availability Statement

The data presented in this study are available on request from the corresponding author.

Conflicts of Interest

The authors declare no conflict of interest.

References

  1. Wu, Z.; Zhang, F.; Ding, W.; Wang, K.; Peng, J.; Cao, N.; He, C. Native forests transformed into cash crops reduced soil multi-functionality by modifying the microbial community composition and keystone species’ abundance in the Jianghuai Hilly Region. Environ. Sci. Pollut. Res. 2023, 30, 113747–113757. [Google Scholar] [CrossRef] [PubMed]
  2. Lu, H.; Zhang, L.; Wang, N.; Zhou, Y. Impact of rainfall-runoff on phosphorus export from an agriculture watershed in the hilly region of Yangtze-Huaihe zone, China. J. Agro-Environ. Sci. 2019, 38, 2165–2173. (In Chinese) [Google Scholar]
  3. Chen, X.; Ren, M.; Li, G.; Zhang, J.; Xie, F.; Zheng, L. Identification of nitrate accumulation mechanism of surface water in a mining-rural-urban agglomeration area based on multiple isotopic evidence. Sci. Total Environ. 2023, 912, 169123. [Google Scholar] [CrossRef] [PubMed]
  4. Iori, V.; Muzzini, V.G.; Venditti, I.; Casentini, B.; Iannelli, M.A. Phytotoxic impact of bifunctionalized silver nanoparticles (AgNPs-Cit-L-Cys) and silver nitrate (AgNO3) on chronically exposed callus cultures of Populus nigra L. Environ. Sci. Pollut. Res. 2023, 30, 116175–116185. [Google Scholar] [CrossRef] [PubMed]
  5. Rivett, M.O.; Buss, S.R.; Morgan, P.; Smith, J.W.N.; Bemment, C.D. Nitrate attenuation in groundwater: A review of biogeochemical controlling processes. Water Res. 2008, 42, 4215–4232. [Google Scholar] [CrossRef] [PubMed]
  6. Ismail, A.H.; Hassan, G.; Sarhan, A.-H. Hydrochemistry of shallow groundwater and its assessment for drinking and irrigation purposes in Tarmiah district, Baghdad governorate, Iraq. Groundw. Sustain. Dev. 2020, 10, 100300. [Google Scholar] [CrossRef]
  7. Marandi, A.; Shand, P. Groundwater chemistry and the Gibbs Diagram. Appl. Geochem. 2018, 97, 209–212. [Google Scholar] [CrossRef]
  8. Zobkov, M.B.; Efremova, T.A. Microplastic Concentrations in Bottom Sediments of the Lakes of Specially Protected Natural Territories: Case Study of the Kizhskie Skerries, Lake Onega and Vodlozero Lake. Water Resour. 2023, 50, 901–912. [Google Scholar] [CrossRef]
  9. Fitts, C.R. (Ed.) Groundwater Science, 2nd ed.; Academic Press: Boston, MA, USA, 2013; pp. 421–497. [Google Scholar]
  10. Abdessamed, D.; Jodar-Abellan, A.; Ghoneim, S.S.; Almaliki, A.; Hussein, E.E.; Pardo, M.Á. Groundwater quality assessment for sustainable human consumption in arid areas based on GIS and water quality index in the watershed of Ain Sefra (SW of Algeria). Environ. Earth Sci. 2023, 82, 510. [Google Scholar] [CrossRef]
  11. Balcerowska-Czerniak, G.; Gorczyca, B. Rapid assessment of surface water quality using statistical multivariate analysis approach: Oder River system case study. Sci. Total Environ. 2023, 912, 168754. [Google Scholar] [CrossRef]
  12. Xiang, X.; De, K.; Lin, W.; Feng, T.; Li, F.; Wei, X.; Wang, W. Different fates and retention of deposited NH4+ and NO3 in the alpine grasslands of the Qinghai-Tibet plateau. Ecol. Indic. 2024, 158, 111415. [Google Scholar] [CrossRef]
  13. Nikolenko, O.; Jurado, A.; Borges, A.V.; Knller, K.; Brouyre, S. Isotopic composition of nitrogen species in groundwater under agricultural areas: A review. Sci. Total Environ. 2018, 621, 1415–1432. [Google Scholar] [CrossRef]
  14. Hosono, T.; Tokunaga, T.; Kagabu, M.; Nakata, H.; Orishikida, T.; Lin, I.T.; Shimada, J. The use of delta N-15 and delta O-18 tracers with an understanding of groundwater flow dynamics for evaluating the origins and attenuation mechanisms of nitrate pollution. Water Res. 2013, 47, 2661–2675. [Google Scholar] [CrossRef]
  15. Xuan, Y.; Mai, Y.; Xu, Y.; Zheng, J.; He, Z.; Shu, L.; Cao, Y. Enhanced microbial nitrification-denitrification processes in a subtropical metropolitan river network. Water Res. 2022, 222, 118857. [Google Scholar] [CrossRef]
  16. Parkinson, E.W.; Stoddart, S.; Sparacello, V.; Bertoldi, F.; Fonzo, O.; Malone, C.; Marini, E.; Martinet, F.; Moggi-Cecchi, J.; Pacciani, E.; et al. Multiproxy bioarchaeological data reveals interplay between growth, diet and population dynamics across the transition to farming in the central Mediterranean. Sci. Rep. 2023, 13, 21965. [Google Scholar] [CrossRef] [PubMed]
  17. Yang, G.; Li, S.; Niu, R.; Hu, M.; Huang, G.; Pan, D.; Yan, S.; Liu, T.; Li, X.; Li, F. Insights into nitrate-reducing Fe (II) oxidation by Diaphorobacter caeni LI3T through kinetic, nitrogen isotope fractionation, and genome analyses. Sci. Total Environ. 2023, 912, 168720. [Google Scholar] [CrossRef] [PubMed]
  18. Ren, X.; Yue, F.J.; Tang, J.; Li, C.; Li, S.L. Nitrate transformation and source tracking of rivers draining into the Bohai Sea using a multi-tracer approach combined with an optimized Bayesian stable isotope mixing model. J. Hazard. Mater. 2024, 463, 132901. [Google Scholar] [CrossRef] [PubMed]
  19. Torres-Martinez, J.A.; Mora, A.; Knappett, P.S.K.; Ornelas-Soto, N.; Mahlknecht, J. Tracking nitrate and sulfate sources in groundwater of an urbanized valley using a multi-tracer approach combined with a Bayesian isotope mixing model. Water Res. 2020, 182, 115962. [Google Scholar] [CrossRef]
  20. Ren, K.; Pan, X.; Yuan, D.; Zeng, J.; Liang, J.; Peng, C. Nitrate sources and nitrogen dynamics in a karst aquifer with mixed nitrogen inputs (Southwest China): Revealed by multiple stable isotopic and hydro-chemical proxies. Water Res. 2022, 210, 118000. [Google Scholar] [CrossRef]
  21. Kim, K.-H.; Yun, S.-T.; Mayer, B.; Lee, J.-H.; Kim, T.-S.; Kim, H.-K. Quantification of nitrate sources in groundwater using hydrochemical and dual isotopic data combined with a Bayesian mixing model. Agric. Ecosyst. Environ. 2015, 199, 369–381. [Google Scholar] [CrossRef]
  22. Weizu, G.U.; Jiaju, L.U.; Haixing, T.; Quanjiu, W. Challenges of basin study to traditional hydrological conceptions: The 50 years anniversary of hydrological basin study of PRC and the 20 years anniversary of Chuzhou Hydrological Laboratory. Adv. Water Sci. 2003, 14, 368–378. [Google Scholar]
  23. Buda, A.R.; Veith, T.L.; Folmar, G.J.; Feyereisen, G.W.; Bryant, R.B.; Church, C.D.; Schmidt, J.P.; Dell, C.J.; Kleinman, P.J.A. U.S. Department of Agriculture Agricultural Research Service Mahantango Creek Watershed, Pennsylvania, United States: Long-Term Precipitation Database. Water Resour. Res. 2011, 47, W08702. [Google Scholar] [CrossRef]
  24. Wang, J.; Wang, Y.; Guo, K.; Liu, S. Coupled Simulation of Runoff and Nitrogen in Huashan Hydrological Experimental Watershed. J. China Hydrol. 2015, 35, 6. (In Chinese) [Google Scholar]
  25. Gao, J.; Yu, L. Hydrological model for the Transformation of “three waters” in the Wudaogou Region. Groundwater 1996, 18, 40–44+81. (In Chinese) [Google Scholar]
  26. Li, J.; Zhang, L.; Li, H. Output Time Characteristics of Source Phosphorus from Agricultural Small Watershed in Jianghuai Hilly Area. J. China Hydrol. 2017, 37, 7. (In Chinese) [Google Scholar]
  27. Zhang, L.; Dai, Y.; Lin, J.; Han, J.; Sun, X.; Li, X.; Liu, P.; Liao, A. Evaluating Spatiotemporal Variations of Groundwater–Surface Water Interaction Using an Integrated Hydrological Model in Huashan Basin, China. Sustainability 2022, 14, 14325. [Google Scholar] [CrossRef]
  28. Wang, D.; Li, P.; Mu, D.; Liu, W.; Chen, Y.; Fida, M. Unveiling the biogeochemical mechanism of nitrate in the vadose zone-groundwater system: Insights from integrated microbiology, isotope techniques, and hydrogeochemistry. Sci. Total Environ. 2024, 906, 167481. [Google Scholar] [CrossRef] [PubMed]
  29. Gao, H.; Yang, L.; Song, X.; Guo, M.; Li, B.; Cui, X. Sources and hydrogeochemical processes of groundwater under multiple water source recharge condition. Sci. Total Environ. 2023, 903, 166660. [Google Scholar] [CrossRef]
  30. Dawson, T.E.; Pausch, R.C.; Parker, H.M. The role of hydrogen and oxygen stable isotopes in understanding water movement along the soil-plant-atmospheric continuum. In Stable Isotopes; Garland Science: New York, NY, USA, 2020; pp. 169–183. [Google Scholar]
  31. Barbeta, A.; Jones, S.P.; Clavé, L.; Wingate, L.; Gimeno, T.E.; Fréjaville, B.; Wohl, S.; Ogée, J. Unexplained hydrogen isotope offsets complicate the identification and quantification of tree water sources in a riparian forest. Hydrol. Earth Syst. Sci. 2019, 23, 2129–2146. [Google Scholar] [CrossRef]
  32. Moine, B.N.; Bolfan-Casanova, N.; Radu, I.B.; Ionov, D.A.; Costin, G.; Korsakov, A.V.; Golovin, A.V.; Oleinikov, O.B.; Deloule, E.; Cottin, J.Y. Molecular hydrogen in minerals as a clue to interpret∂ D variations in the mantle. Nat. Commun. 2020, 11, 3604. [Google Scholar] [CrossRef]
  33. Ma, W.; Ding, Y.; Zhang, M.; Gao, S.; Li, Y.; Huang, C.; Fu, G. Nature-inspired chemistry toward hierarchical superhydrophobic, antibacterial and biocompatible nanofibrous membranes for effective UV-shielding, self-cleaning and oil-water separation. J. Hazard. Mater. 2020, 384, 121476. [Google Scholar] [CrossRef] [PubMed]
  34. Yang, Y.; Li, X.; Zhou, C.; Xiong, W.; Zeng, G.; Huang, D.; Zhang, C.; Wang, W.; Song, B.; Tang, X.; et al. Recent advances in application of graphitic carbon nitride-based catalysts for degrading organic contaminants in water through advanced oxidation processes beyond photocatalysis: A critical review. Water Res. 2020, 184, 116200. [Google Scholar] [CrossRef] [PubMed]
  35. Fu, X.; Hou, R.; Yang, P.; Qian, S.; Feng, Z.; Chen, Z.; Wang, F.; Yuan, R.; Chen, H.; Zhou, B. Application of external carbon source in heterotrophic denitrification of domestic sewage: A review. Sci. Total Environ. 2022, 817, 153061. [Google Scholar] [CrossRef] [PubMed]
  36. Li, Z.; Tang, Z.; Song, Z.; Chen, W.; Tian, D.; Tang, S.; Wang, X.; Wang, J.; Liu, W.; Wang, Y.; et al. Variations and controlling factors of soil denitrification rate. Glob. Chang. Biol. 2022, 28, 2133–2145. [Google Scholar] [CrossRef]
Figure 1. Topographic map of Huashan watershed, with sampling sites and groundwater levels.
Sustainability 16 00423 g001
Figure 2. Piper diagram of the study area.
Sustainability 16 00423 g002
Figure 3. Plot of δD-H2O and δ18O-H2O for precipitation, river water, and groundwater in the study area compared with the local meteoric water line (LMWL).
Sustainability 16 00423 g003
Figure 4. Gibbs diagram for precipitation, river water, and groundwater in the study area. (a) represent TDS versus Na+/(Na++Ca2+), (b) represent TDS versus Cl/(Cl+HCO3).
Sustainability 16 00423 g004
Figure 5. Factor analysis of river water and groundwater hydrochemistry in the study area. (a) represent score of Factor 1 versus score of Factor 2, (b) represent score of Factor 1 versus score of Factor 3.
Sustainability 16 00423 g005
Figure 6. Relationships between Mg/Ca and Ca/Na (a), between HCO3/Na and Ca/Na (b), between Ca and (HCO3+CO3) (c), between (Ca+Mg) and (HCO3+CO3) (d), between Na and Cl (e), between Na and HCO3 (f), between Ca and SO4 (g), and between Na and SO4 (h) for precipitation, river water, and groundwater samples in the study area.
Sustainability 16 00423 g006
Figure 7. Relationship between (Na+K-Cl) and (Ca+Mg-HCO3-CO3-SO4) (a) and CAI1 and CAI2 (b).
Sustainability 16 00423 g007
Figure 8. Spatial distribution of (a) NO3 and (b) DO contents for river water and groundwater in the study area.
Sustainability 16 00423 g008
Figure 9. Plot of δ15N-NO3 versus δ18O-NO3 for river water and phreatic water in the study area. The typical ranges of the potential nitrate sources were taken from [15].
Sustainability 16 00423 g009
Figure 10. Contribution rates for the sources of river water and groundwater nitrate in the study area.
Sustainability 16 00423 g010
Table 1. Statistical summary of physicochemical parameters, chemical compositions, and isotopic values of precipitation, river water, and groundwater in Huashan watershed.
T
(°C)
pHDO
(mg/L)
ORP
(mV)
Na+
(mg/L)
K+
(mg/L)
Ca2+
(mg/L)
Mg2+
(mg/L)
Cl
(mg/L)
SO42−
(mg/L)
HCO3
(mg/L)
CO32−
(mg/L)
NO3
(mg/L)
Si
(mg/L)
TDS
(mg/L)
δD-H2O
(‰)
δ18O-H2O
(‰)
δ15N-NO3
(‰)
δ18O-NO3
(‰)
Precipitation (n = 1)
////0.370.816.330.450.451.3112.81 2.74 20.66−38.70−6.403.2349.79
River water samples (n = 16)
Min10.806.315.29125.907.170.993.654.065.050.2218.320.000.105.1998.08−47.84−7.59−3.29−2.84
Mean14.387.679.28158.5114.642.2855.3414.4110.4915.00220.666.460.9812.82230.10−39.51−5.506.824.92
Max18.609.4614.72211.3037.223.4588.2625.2924.1829.55329.8442.062.9516.68298.03−34.55−3.9310.589.89
Groundwater samples (n = 29)
Min16.506.433.08−91.705.130.1728.405.403.280.09164.920.000.070.31167.07−50.39−7.86−14.04−7.18
Mean18.586.824.62117.1127.071.0674.7916.9718.9016.79312.780.002.474.03313.89−42.60−6.416.784.45
Max20.807.168.19229.2084.454.94188.7656.23124.8664.47513.080.0015.126.02725.74−33.30−4.2226.6018.07
Disclaimer/Publisher’s Note: The statements, opinions and data contained in all publications are solely those of the individual author(s) and contributor(s) and not of MDPI and/or the editor(s). MDPI and/or the editor(s) disclaim responsibility for any injury to people or property resulting from any ideas, methods, instructions or products referred to in the content.

