Article

Socio-Economic Vulnerability Assessment for Supporting a Sustainable Pandemic Management in Austria

by
Vanessa Streifeneder
1,*,
Stefan Kienberger
1,2,
Steffen Reichel
3 and
Daniel Hölbling
1
1
Department of Geoinformatics—Z_GIS, University of Salzburg, 5020 Salzburg, Austria
2
GeoSphere Austria, RiskLab—Weather, Climate and Natural Hazards, 1190 Vienna, Austria
3
Spatial Services GmbH, 5020 Salzburg, Austria
*
Author to whom correspondence should be addressed.
Sustainability 2024, 16(1), 78; https://doi.org/10.3390/su16010078
Submission received: 27 October 2023 / Revised: 8 December 2023 / Accepted: 14 December 2023 / Published: 21 December 2023

Abstract

:
The outbreaks of a new pandemic in 2019 let humankind face a new type of challenge. People and groups in vulnerable situations were especially affected. Increasing urbanization, climate change, and global travel raise the likelihood of pandemics. COVID-19 has shown that sustainable and well-planned pandemic management is necessary, which also includes and identifies people in vulnerable situations. In this study, a socio-economic vulnerability assessment (VA) for supporting improved pandemic/epidemic risk management at the municipality level in Austria was conducted. The VA provides a holistic overview of the vulnerability under pre-event conditions in Austria, which can be used to support pandemic management. Therefore, we calculated a composite indicator with expert-based weighting. The necessary indicators were defined through a literature review and an expert consortium consisting of practical and scientific members. As a result, an interactive map containing the vulnerability index (VI) for each municipality was created, making it possible to also assess underlying vulnerable factors to support decision-making. The applicability of the VA was shown in the relationship between a high VI in a municipality and a high number of deaths. A limiting factor to the VA was the missing data for health indicators for the whole of Austria. Hence, we provide a list with recommendations on which data should be collected to improve the VA in the future.

1. Vulnerability and Sustainability in the Context of a Pandemic

Repeated serious outbreaks of disease can quickly develop into epidemics and worldwide pandemics, causing millions of deaths [1]. In contrast to epidemics, which affect a community or region, pandemics are worldwide infectious disease outbreaks [1]. They have a high social, economic, and political impact [2]. From 2002 to 2003, the first Severe Acute Respiratory Syndrome (SARS) pandemic appeared. The recent Coronavirus disease (COVID-19) pandemic also belongs to the SARS illnesses caused by the SARS-CoV-2 virus [3]. The virus spreads through droplet transmission. People affected by COVID-19 can have mild to moderate respiratory illness, allowing them to recover without special treatment. In the case of a serious illness, medical attention and special treatment are required. Mostly, older people and those with preexisting health conditions experience a more severe course of illness [4]. In 2023, the mortality rate for COVID-19 was 1.03% worldwide but varies between 0.45% (Germany) and 4.63% (Brazil) [5]. In January 2020, the first cases of COVID-19 were reported in Europe, and with the increasing number of infections, diverse measurements were established. This included, in particular, movement restrictions, the closing of public institutions, working from home, the promotion of social distancing, and face coverage [6].
The COVID-19 pandemic has shown that despite medical and technical progress, a pandemic in the 21st century can have serious social, political, and economic consequences [7]. COVID-19 showed us, for instance, the necessity to increase the social sustainability of health systems, not only in developing countries but also in developed nations, such as the USA [8]. The lockdowns harm the social sustainability of the economy, especially for employees and their families working in the supply chain [9]. The psychological impact of the pandemic on children, teenagers, and parents is also not to be underestimated. Quarantine, isolation, and continuous medical checks increase the stress level of children and parents, as well as the risk of child abuse and neglect [10].
Climate change and environmental degradation will further increase the outbreak of infectious diseases, leading to potential epidemics and pandemics in the future [11]. Donkor et al. [12] analyzed the impact of hazards and diseases on the achievement of Sustainable Development Goals (SDGs). Thereby, they showed the impact of COVID-19 on the SDGs through the enhancement of vulnerabilities, such as poverty, injustice, and inequalities. Therefore, next to environmental conservation and climate change strategies, sustainable disease management plans have to be developed, improved, and implemented. When applied correctly, they can reduce the social and economic impact of epidemics and pandemics and create a more resilient and enduring society in the future.
In sustainability studies, knowledge about the vulnerability of a system (in our study, municipalities) is very important [13]. In this study, we defined vulnerability according to [14] as the predisposition of society and people in the context of diseases. Vulnerability assessments (VA) evaluate spatial and temporal differences in socio-economic systems, physical aspects, and environmental conditions in a certain area to estimate their susceptibility and resilience against disasters [2]. They can support sustainable management plans, strategies, and measurements by identifying groups in vulnerable positions, as well as other vulnerability indicators [15]. There is no consensus on the use of a specific framework or method for VAs, as they tend to become very complex and include various dimensions (physical, economic, psychological, etc.) [16,17]. Depending on the objective, the VA can include information on the exposure (risk assessment) or only focus on the vulnerability aspects defined by the susceptibility and resilience of a system. However, the common approach to VA is an indicator-based methodology. The selected indicators can be quantitative or qualitative and are identified using a literature review, the adaptation of existing frameworks, and expert interviews [17].
Bizimana et al. [18] carried out a VA to assess the socio-economic vulnerability to malaria in Rwanda based on a composite indicator. The results support malaria control in Rwanda by providing information on vulnerability indicators that should be targeted in national intervention strategies to increase community resilience. Prieto et al. [2] conducted an urban VA for pandemic surveillance in Colombia, using different vulnerability factors for disaster risk reduction. They analyzed the probability distribution of the different factors and grouped them, as well as aggregated them to obtain a vulnerability index. Bian et al. [13] used a regression model to analyze the spatial risk of bacterial foodborne diseases and identified environmental factors influencing the spread of foodborne diseases. Macharia et al. [15] suggested a combined social and epidemiological vulnerability index to assess vulnerability to COVID-19 in Kenya. Their findings can help to identify weaknesses in healthcare provision and vulnerable groups. The results can support management plans to establish a sustainable healthcare system. In Austria, different VAs regarding COVID-19 have been conducted, including a preliminary study by [19]. Most studies focus on one aspect of vulnerability. Bachtrögler et al. [20] investigated economic vulnerability at the district level. Simon et al. [21] focused on vulnerabilities regarding well-being, mental health, and social support during lockdowns.
This study aimed to perform a VA for pandemics in Austria at the municipality level to support community engagement, decision-makers, and stakeholders to identify groups and people in vulnerable situations. The resulting vulnerability index (VI) for each municipality was integrated into a web tool to provide easy access to information for stakeholders and decision-makers. In contrast to other studies, we provide a more holistic VA, including social as well as economic aspects, considering the individual perspective as well as the society as a whole to calculate a VI. Social and economic vulnerabilities are often related to each other. Furthermore, they depend on the vulnerability of each individual within society, as well as the ability of governments, businesses, and stakeholders to adapt, recover, and mitigate disasters. Hence, it is important to consider both the vulnerabilities of individuals and communities to create sustainable management plans, which can further help to identify people in vulnerable situations [14]. The VI in this study was based on a composite indicator with expert weights. We analyzed two scenarios. One for a vector disease similar to Dengue fever and the other one for an influenza similar to COVID-19.

2. Study Area

Austria has over 8.8 million inhabitants living in nine federal states, 94 districts, and over 2000 municipalities. In Austria, the first publicly known COVID-19 cases were reported in Ischgl, a mountain municipality in Tyrol and a famous winter sports spot. The COVID-19 outbreak occurred during the tourist high season. To avoid the further spread of the COVID-19 virus, the municipality was placed under quarantine and the border with Italy was closed [6]. Most deaths caused by COVID-19 occurred between autumn 2019 and spring 2020, whereas the highest number of confirmed cases occurred from the end of 2021 until spring 2022. Overall, over 6.08 million cases of COVID-19 and 22,534 deaths were reported in Austria between 2020 and August 2023 [22]. Figure 1 illustrates the total number of cases by district at the end of 2021. In particular, densely populated areas show high numbers. To better identify people in vulnerable situations and support sustainable management at the local level, the VA was carried out at the municipality level.

3. Method and Data

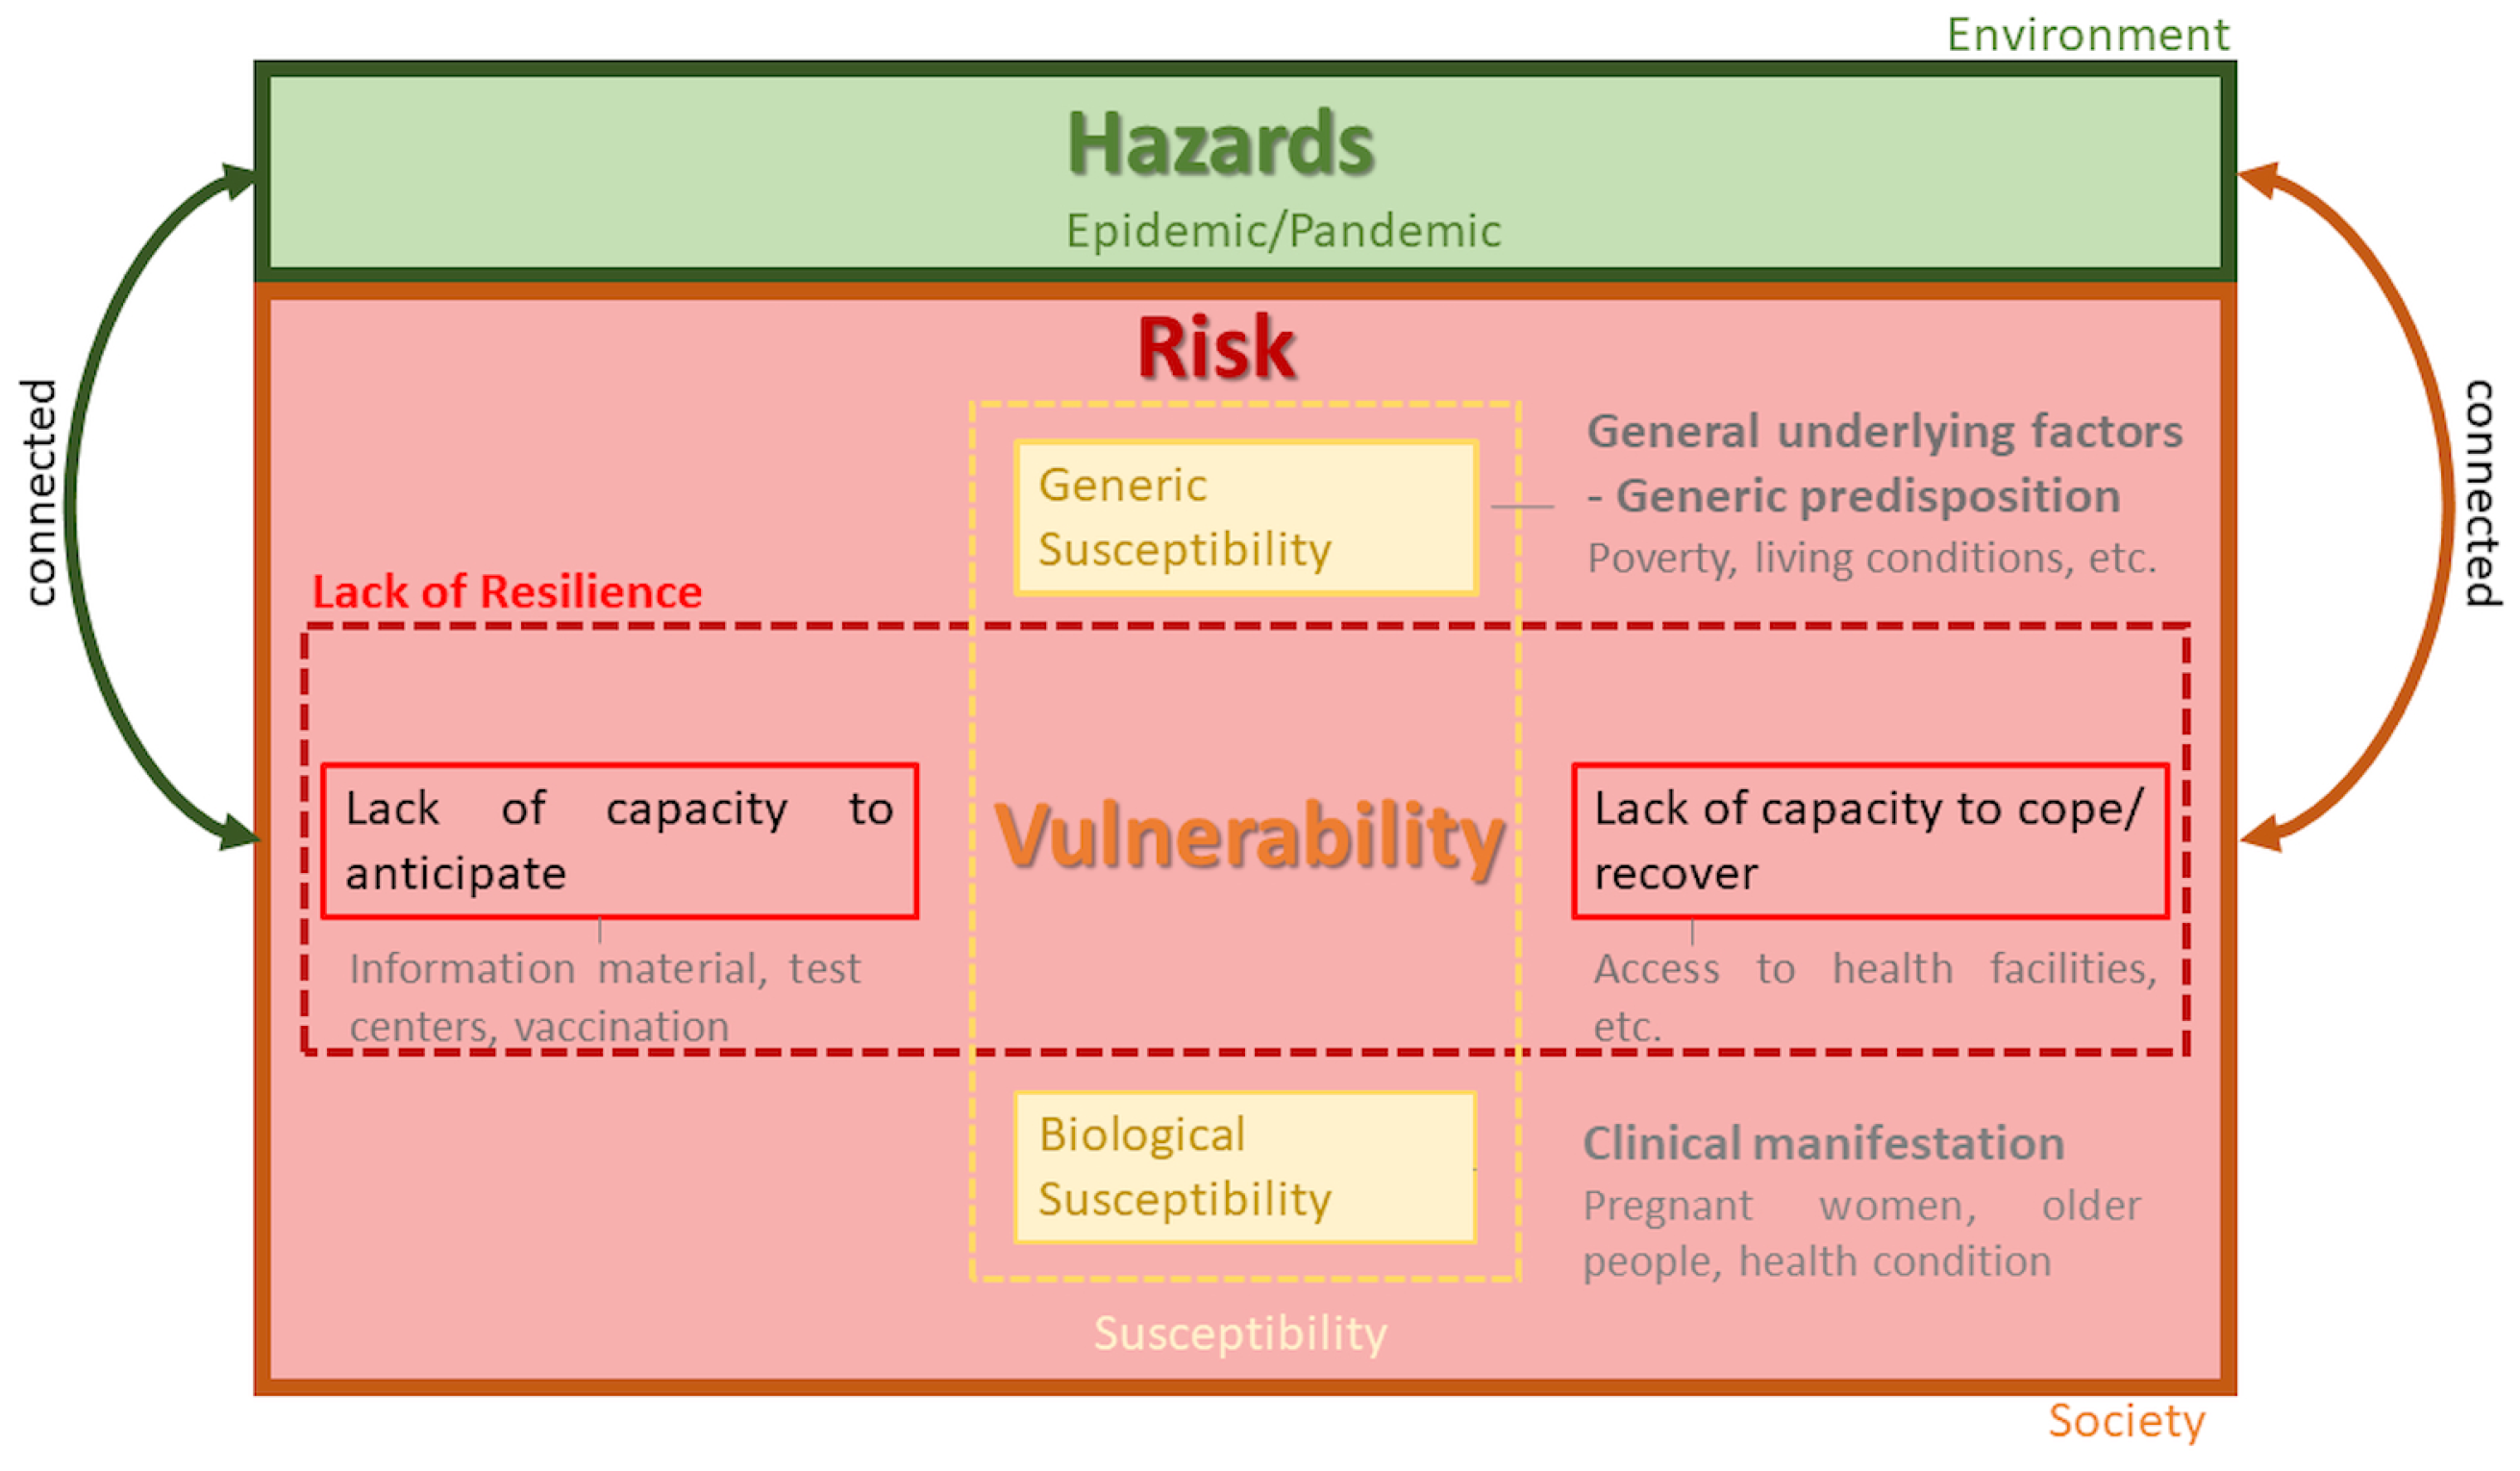
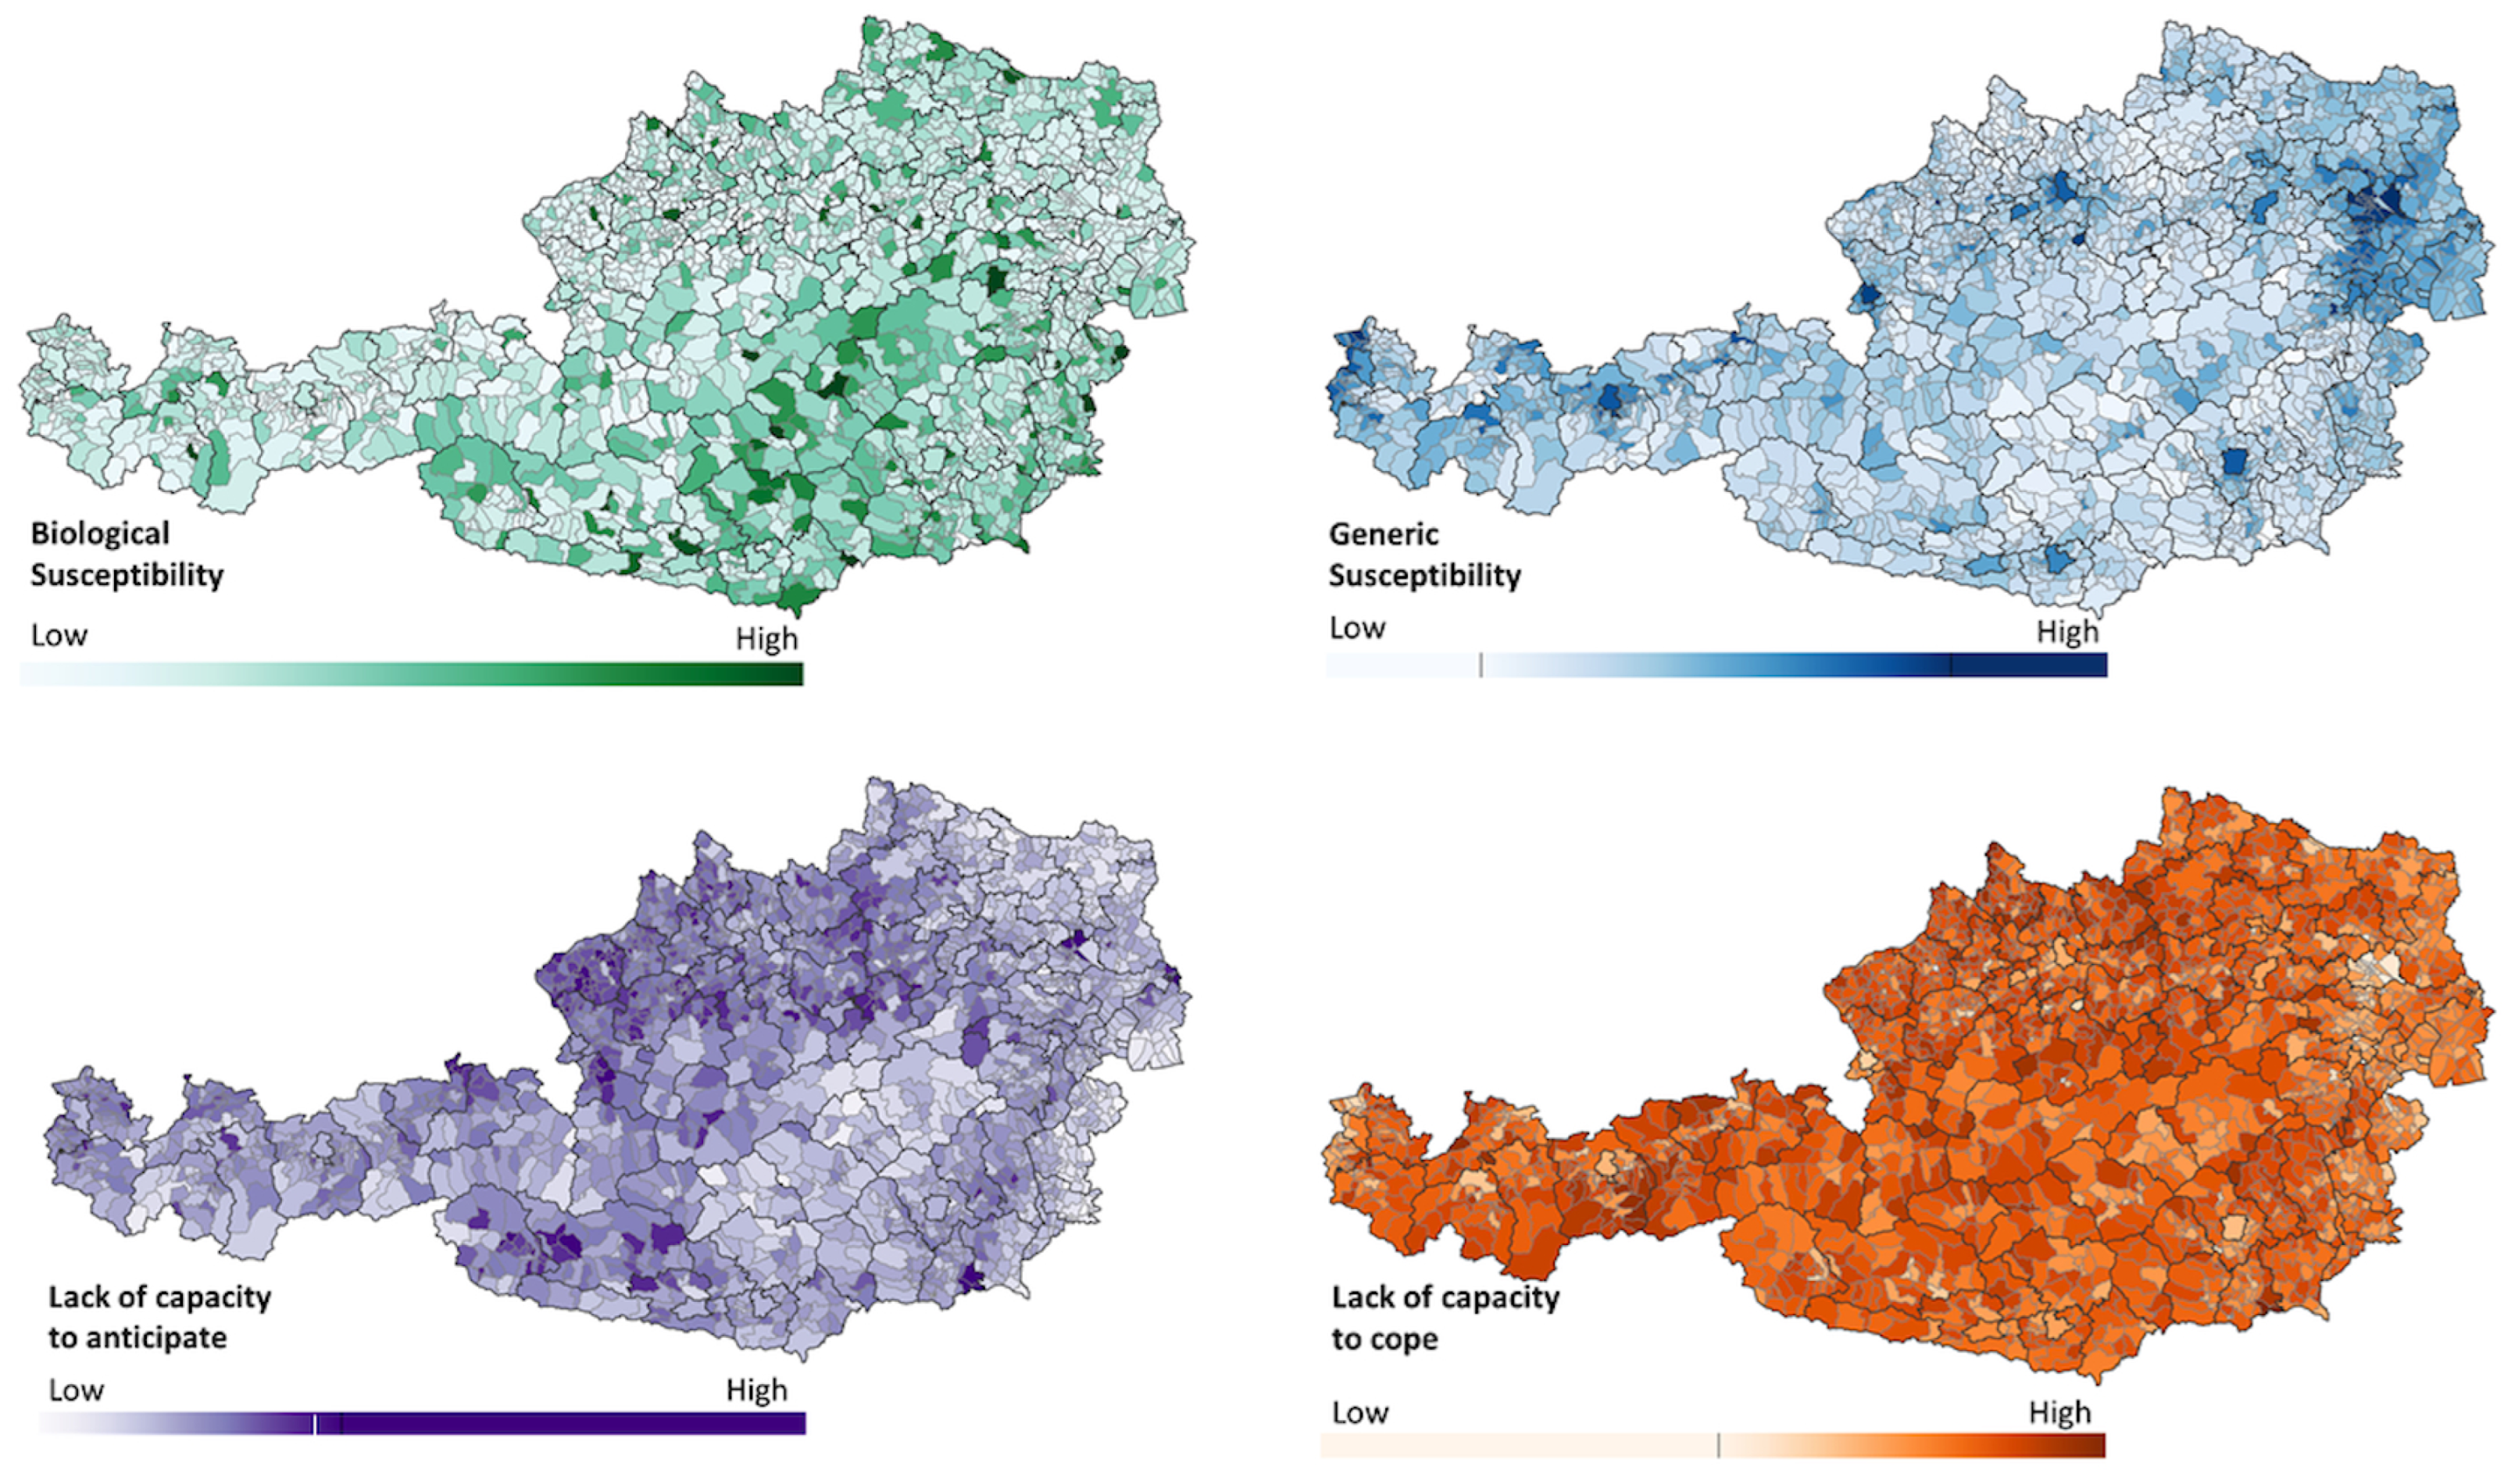
3.1. Vulnerability Assessment Framework

For the VA, we adapted the MOVE (Methods for the Improvement of Vulnerability Assessment in Europe) framework from [23]. Originally designed for the vulnerability analysis of natural hazards, the framework was adapted for analyses in the context of public health [14] (Figure 2). In our framework, in contrast to the MOVE framework, the exposure component was excluded, although exposure and vulnerability belong to a holistic risk assessment. An epidemic/pandemic disease is not a local phenomenon. Hence, our goal was not to estimate the epidemic/pandemic risk, but the socio-economic vulnerability of municipalities focusing on the residents to better identify people/groups in vulnerable situations [24]. In the adapted framework, hazard, risk, and vulnerability are connected but rest in different dimensions. Hazards like diseases belong to the environmental dimension, whereas vulnerability is located in the social dimension and is defined by different factors. The possibility of being affected, the intensity of the infection, and the socio-economic impact on residents depend on (1) biological susceptibility, (2) generic susceptibility, and (3) corresponding resilience capacities (or lack thereof). The former describes the clinical manifestation of the viruses for an individual through the biological and health conditions of a person (e.g., gender, pre-existing diseases). Generic susceptibility describes the genetic predisposition of a resident, which are external factors such as poverty and population structure. The lack of resilience describes external conditions that influence the potential for anticipation, mitigation, and recovery of society, as well as an individual after an epidemic or pandemic outbreak [14].

3.2. Indicators and Data Acquisition

Different approaches have been used to conduct a VA like composite indicators or regression models [13,14,15]. In our study, we used a composite indicator weighted by experts to calculate the VI. A composite indicator was constructed by different individual indicators, which were aggregated into a single index [25]. We first defined indicators based on a literature review and interviews with experts from medical and psychological research, non-governmental organizations (NGOs), and governmental institutions. The indicators were grouped into categories that describe the susceptibility and the lack of resilience of a municipality (Table 1 and Table 2). Biological susceptibility is defined by the individual health conditions of the residents. Pre-existing diseases such as autoimmune diseases, diabetes, (non-)communicable diseases, etc., as well as mental issues or other disabilities, increase a person’s vulnerability to becoming infected, and influence the severity of an infection [26,27]. Mental and physical disabilities can affect understanding and compliance with measurements [28].
The generic susceptibility was defined by four categories: (1) Population density, which influences the infection rate as well as the possibility of social isolation and social distancing during an epidemic/pandemic [15]. (2) Demographic factors, such as age and gender, can affect the severity of the disease [2]. Depending on the disease, different age groups can be more affected. Age also affects factors such as mobility, financial status, social contacts, autonomy, and disabilities [15,29]. (3) National origin and (4) living situation are further important factors in assessing genetic susceptibility. Living conditions influence not only the ability to follow measurements such as isolation and hygiene but also provide information about housing and financial security, the capacity to get medical attention, being able to care for themselves, and having social interaction [30,31,32]. Nationality can be an indicator of ethnic minority communities. During an epidemic/pandemic, these communities can be victims of hate crimes, struggle with measurements because they obstruct their social and regional traditions, and have difficulties communicating due to potential language barriers [33,34,35].
The capacity to anticipate and adapt to an epidemic/pandemic was described through economic, political, and educational factors. In the literature, the economic situation commonly refers to the financial status of residents [15,36]. The economic situation can be estimated through purchasing power and unemployment. Having a stable financial situation can help residents overcome an economic crisis following an epidemic/pandemic [15]. Moreover, a good economic situation can help to set up a sustainable health system and implement management strategies. It is further important to consider the political situation, which can be described by the trust of people in political institutions and the willingness to follow certain measures like vaccination recommendations. A lack of trust in institutions to handle risks can lower the acceptance of measurements and lead to avoidance and insurrection [37]. Another factor associated with the capacity to anticipate and adapt is formal education. Many studies show the importance of education to inform people about diseases and understand and follow protection measures like social distancing or home office [15,38,39].
Finally, we identified five categories to estimate the lack of capacity to cope and recover. The status of employment offers information about the possibility of acting on governmental measures like social distancing due to home office [15]. Employment provides further information about income and the possibility of recovering from a pandemic by affording medical treatment [40]. Furthermore, people with lower incomes or in sectors without the possibility of mobile work fear losing their jobs after a pandemic and have fewer savings to survive a certain time with lower or non-income [2]. O’Sullivan and Bourgoin [29] describe the problem of mental stress among service workers and the higher risk of contamination at certain workspaces. Commuting to work by public transport can further increase the danger of getting infected [2]. Timely access to medical faculties as well as urban centers is important for fast treatment and recovery, as well as getting supplies during lockdowns. Moreover, the capacity of hospitals, as well as medical equipment, plays an important role in the treatment of patients [15,23,27].
For some of the indicators, data were not available at the municipality level or at all. Therefore, we excluded the indicators listed in Table 2 from further calculations. For the indicators, data provided by Statistic Austria, the Gesundheit Österreich GmbH, and the ministries from 2021 or earlier were used because they do not include any bias created by the COVID-19 pandemic [41,42,43,44,45,46,47,48]. The administrative boundaries for the municipalities are from 2023 to include changes caused by the union of smaller municipalities in recent years.
Table 1. Selected indicators per domain and category, including expert weights for both scenarios.
DomainCategoryIndicator (Level 1)Indicator (Level 2)UnitWeights Influenza-DiseaseWeights
Vector-Disease
Data Source
Biological susceptibility (BS)Health condition (BS_HC)Care Level (BS_HC_CL)Low care Level (1–3) [ambulant]Percentage of people per municipality0.150.15Federal Ministry for Labor, Social Affairs, Health, and Consumer Protection (BMSGPK)/Association of Austrian Social Insurance Institutions (DVSV)—Care Allowance Statistics 2019; Gesundheit Österreich GmbH (GÖG)—G. Fülöp [41]
(BS_HC_CL_1)
High care Level (4–7) [ambulant] 0.30.29
(BS_HC_CL_2)
Low care Level (1–3) [stationary] 0.20.19
(BS_HC_CL_3)
High care Level (4–7) [stationary] 0.360.37
(BS_HC_CL_4)
Generic susceptibility (GS)Population Density (GS_PD)Population Density (GS_P) Number of inhabitants per km²0.070.06Statistic Austria (data as of 20 May 2019) [42].
Demography (GS_D)Older people < 65 (GS_D_1) Percentage of people per municipality0.390.39
Children < 5 (GS_D_2) 0.210.23
Teenagers 5–18 (GS_D_3) 0.180.16
Women of childbearing age (16–49) (GS_D_3) 0.220.22
National origin (GS_NO)Austria (GS_NO_1) 0.10.06Statistic Austria (data as of 31 October 2019 [43]
EU states (14) (GS_NO_2) 0.050.03
EU states (10) (GS_NO_3) 0.040.04
EU states (3) (GS_NO_4) 0.050.05
Former Yugoslavia (without Slovenia, Croatia) (GS_NO_5) 0.140.13
Turkey (GS_NO_6) 0.130.15
EWR, Switzerland, associated small states (GS_NO_7) 0.030.02
Other European states (GS_NO_8) 0.050.04
Africa (GS_NO_9) 0.120.15
North America (GS_NO_10) 0.040.04
Latin American (GS_NO_11) 0.080.11
Asia (excluding Turkey and Cyprus) (GS_NO_12) 0.090.1
Oceania (GS_NO_13) 0.080.1
Living situation (GS_LS)Institutional households (nursing homes, prisons, monasteries, boarding schools, etc.) (GS_LS_1) Number of institutions per municipality0.590.51Statistic Austria (data as of 31 October 2019) [44].
Number of household members (GS_LS_2) Average per municipality0.150.2
One-parent-family (only mother) (GS_LS_3) Percentage per municipality0.160.13
One-parent-family (only father) (GS_LS_4) 0.110.11
Economic situation (GS_ES)Unemployment (GS_ES_U) Percentage of people per municipality0.070.09Statistic Austria (data as of 30 Oktober 2021) [45].
Lack of capacity to anticipate (LA)Political situation (LA_PS)Full immunization (COVID-19) Percentage of people per municipality0.050.06Ministry of Health (2021). Basic immunized [46]. data as of 1 December 2021)
Formal education (LA_FE)Compulsory school (LA_FE_1) 0.250.28Statistic Austria (data as of 31 October 2019) [43].
Apprenticeship (LA_FE_2) 0.120.13
Technical school (LA_FE_3) 0.10.11
High school (LA_FE_4) 0.090.1
Technical high school (LA_FE_5) 0.090.1
College (LA_FE_6) 0.070.07
Academy (LA_FE_7) 0.070.07
University/ College (LA_FE_8) 0.060.06
Not applicable (LA_FE_9) 0.070.08
Lack of capacity to recover (LC)Work (LC_W)Primary economic sector [male] (LC_W_1) Percentage of people per municipality0.10.1Statistic Austria (data as of 31 October 2019 [43].
Secondary economic sector [male] (LC_W_2) 0.10.08
Tertiary economic sector [male] (LC_W_3) 0.10.12
Private households [male] (LC_W_4) 0.070.07
Exterritorial organizations [male]] (LC_W_5) 0.050.05
Not applicable [male] (LC_W_6) 0.030.04
Primary economic sector [female] (LC_W_7) 0.10.1
Secondary economic sector [female] (LC_W_8) 0.110.09
Tertiary economic sector [female] (LC_W_9) 0.120.14
Private households [female] (LC_W_10) 0.090.07
Exterritorial organizations [female]] (LC_W_11) 0.050.05
Not applicable [female] (LC_W_12) 0.030.04
Outbound commuters (LC_W_13) 0.060.07
Access (LC_A)Access to health facilities (traveling time) (LC_A_1) Average from all raster cells for each municipality0.560.55Statistic Austria (2017). Grid-based indicators of accessibility of public utility infrastructure [47].
Access to service centers (traveling time) (LC_A_2) 0.440.45
Hospitals (LC_HF)Systemic beds (LC_HF_1) Number of beds per inhabitant0.430.43Gesundheit Österreich GmbH (2016). Austrian Health Information System—AHIS [48].
Actual deployed beds (LC_HF_2) 0.580.57
Table 2. Selected indicators per domain and category that had to be excluded due to the resolution (FS: Federal States; D: District).
DomainCategoryIndicator (Level 1)Indicator (Level 2)ResolutionData Source
Biological susceptibility (BS)Health condition (BS_HC)Non-communicable diseasesAsthmaFSHealth survey—Statistic Austria
Chronic illness
Autoimmune diseases
Blood pressure
Organically diseases
Diabetic
Communicable diseases NA
VaccinationsTetanus, Diphtheria, Measles, etc.FSHealth survey—Statistic Austria
Mental HealthDrugs
General well-being
Psychological illnesses
Physical disabilitiesSeeing and hearing issues
Mobility issues
Generic susceptibility (GS)Living situation (GS_LS)Nursing staffMobile nursing staffFS
24-h caretaking
Economic situation (GS_LS)Purchasing power
Lack of capacity to anticipate (LA)Trust in political institutions NA
Criminality
DisseminationMedia use
Internet connection
Formal education (LA_FE)Illiterate NA
Writing and Reading weakness
Lack of capacity to recover (LC)Health insuranceNumber of insured people NA
LanguageSpoken language
Hospitals (LC_HF)Special medical equipment D
Medical personal
Intensive care unity
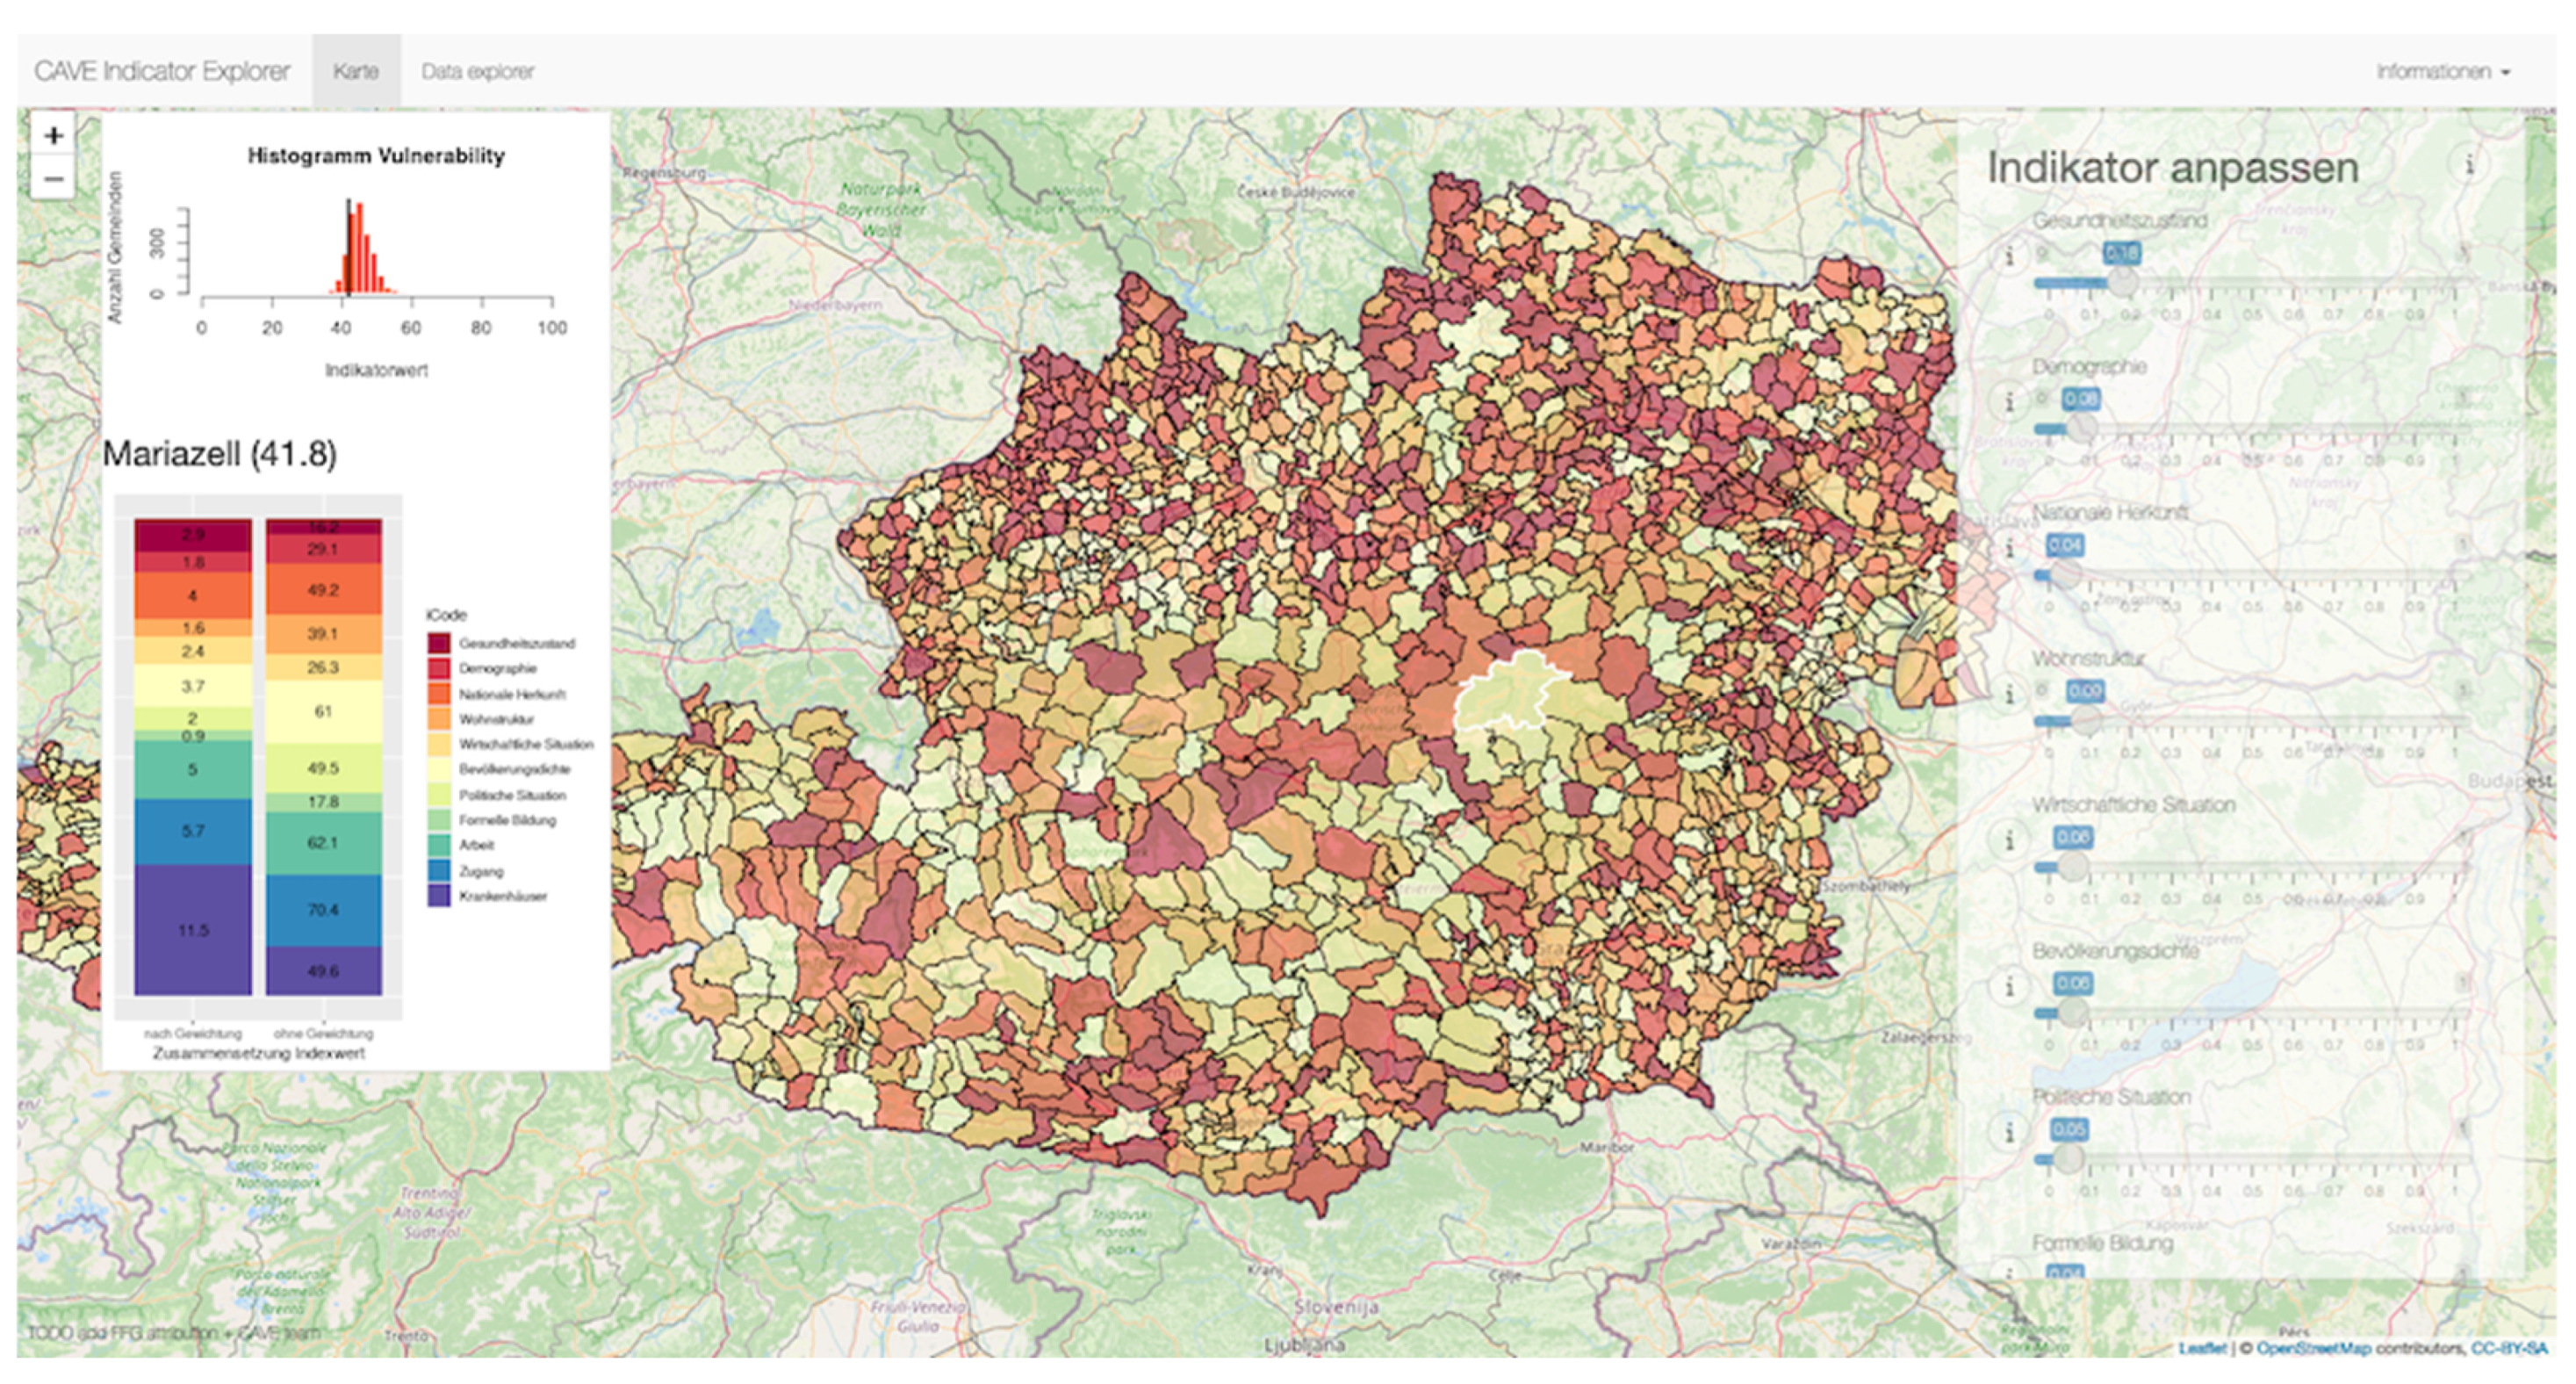
After the identification, categorization, and assessment of the different indicators, we conducted expert weighting. Not all indicators and factors have the same influence on socio-economic vulnerability. Depending on the disease, some indicators have a stronger influence than others, for instance, age. For weighting the different indicators, the experts were selected based on their expertise in the field. This included researchers with medical and psychological backgrounds, as well as employees from humanitarian NGOs and the government. For instance, the Austrian Red Cross, Lebenshilfe, the Medical University of Vienna and the University of Innsbruck. All experts worked in an environment where they conduct research regarding or work daily with people/groups in vulnerable situations. COVID-19 provided partaking NGOs with hands-on experience on the impact of a pandemic on institutions and people. For the expert weighting, we used the so-called “Budget Allocation” method. In this method, each expert received a predefined budget to distribute to a number of indicators. The allocated budget was equal to the weight of each indicator [49]. In our study, each expert received 100 points to weigh the single categories in comparison to each other. In the second round, they received another 100 points for each category to weigh the single indicators within these categories. The final weight for each category and indicator was then calculated as the average of all expert weights divided by 100. This was done separately for each scenario. The final weights for the different indicators and scenarios are shown in Table 1. To validate and understand the potential differences between the individual weightings, the final weights were discussed with the experts.

3.3. Tools

For the calculation of the composite indicator, the R-COIN tool developed by Becker et al. was used. Therefore, a correlation analysis was conducted to reduce redundancy. Indicators that exhibited a very high dependency (>0.9) influenced each other, and consequently, the VI as well. In such cases, only one of the two indicators was retained for further use. This was the case for nine indicators. These nine indicators were then individually assessed, and in the end, five of them were excluded. The remaining indicators were standardized, normalized, and weighted (Table 2) before they were implemented into the R-COIN tool. For the visual representation and spatial analysis of the results, ArcGIS Pro (version: 3.0) was used.

Interactive Web Map

An interactive web map has been developed to offer interested parties an interactive insight into the VA and its inner workings (Figure 3). Users can easily modify the categorical weights to adapt the VI to scenarios beyond the ones presented in this paper (e.g., COVID-19 and Dengue fever). The web map enables users to individually inspect the indicator value for each municipality to obtain a deeper understanding of the underlying reasons for a specific indicator value. Additionally, the web map offers data in a tabulated form per municipality.
The web map was developed using the RShiny [50] framework to integrate well with the R-COIN library. Due to the nature of the underlying data, the web map is not publicly available.

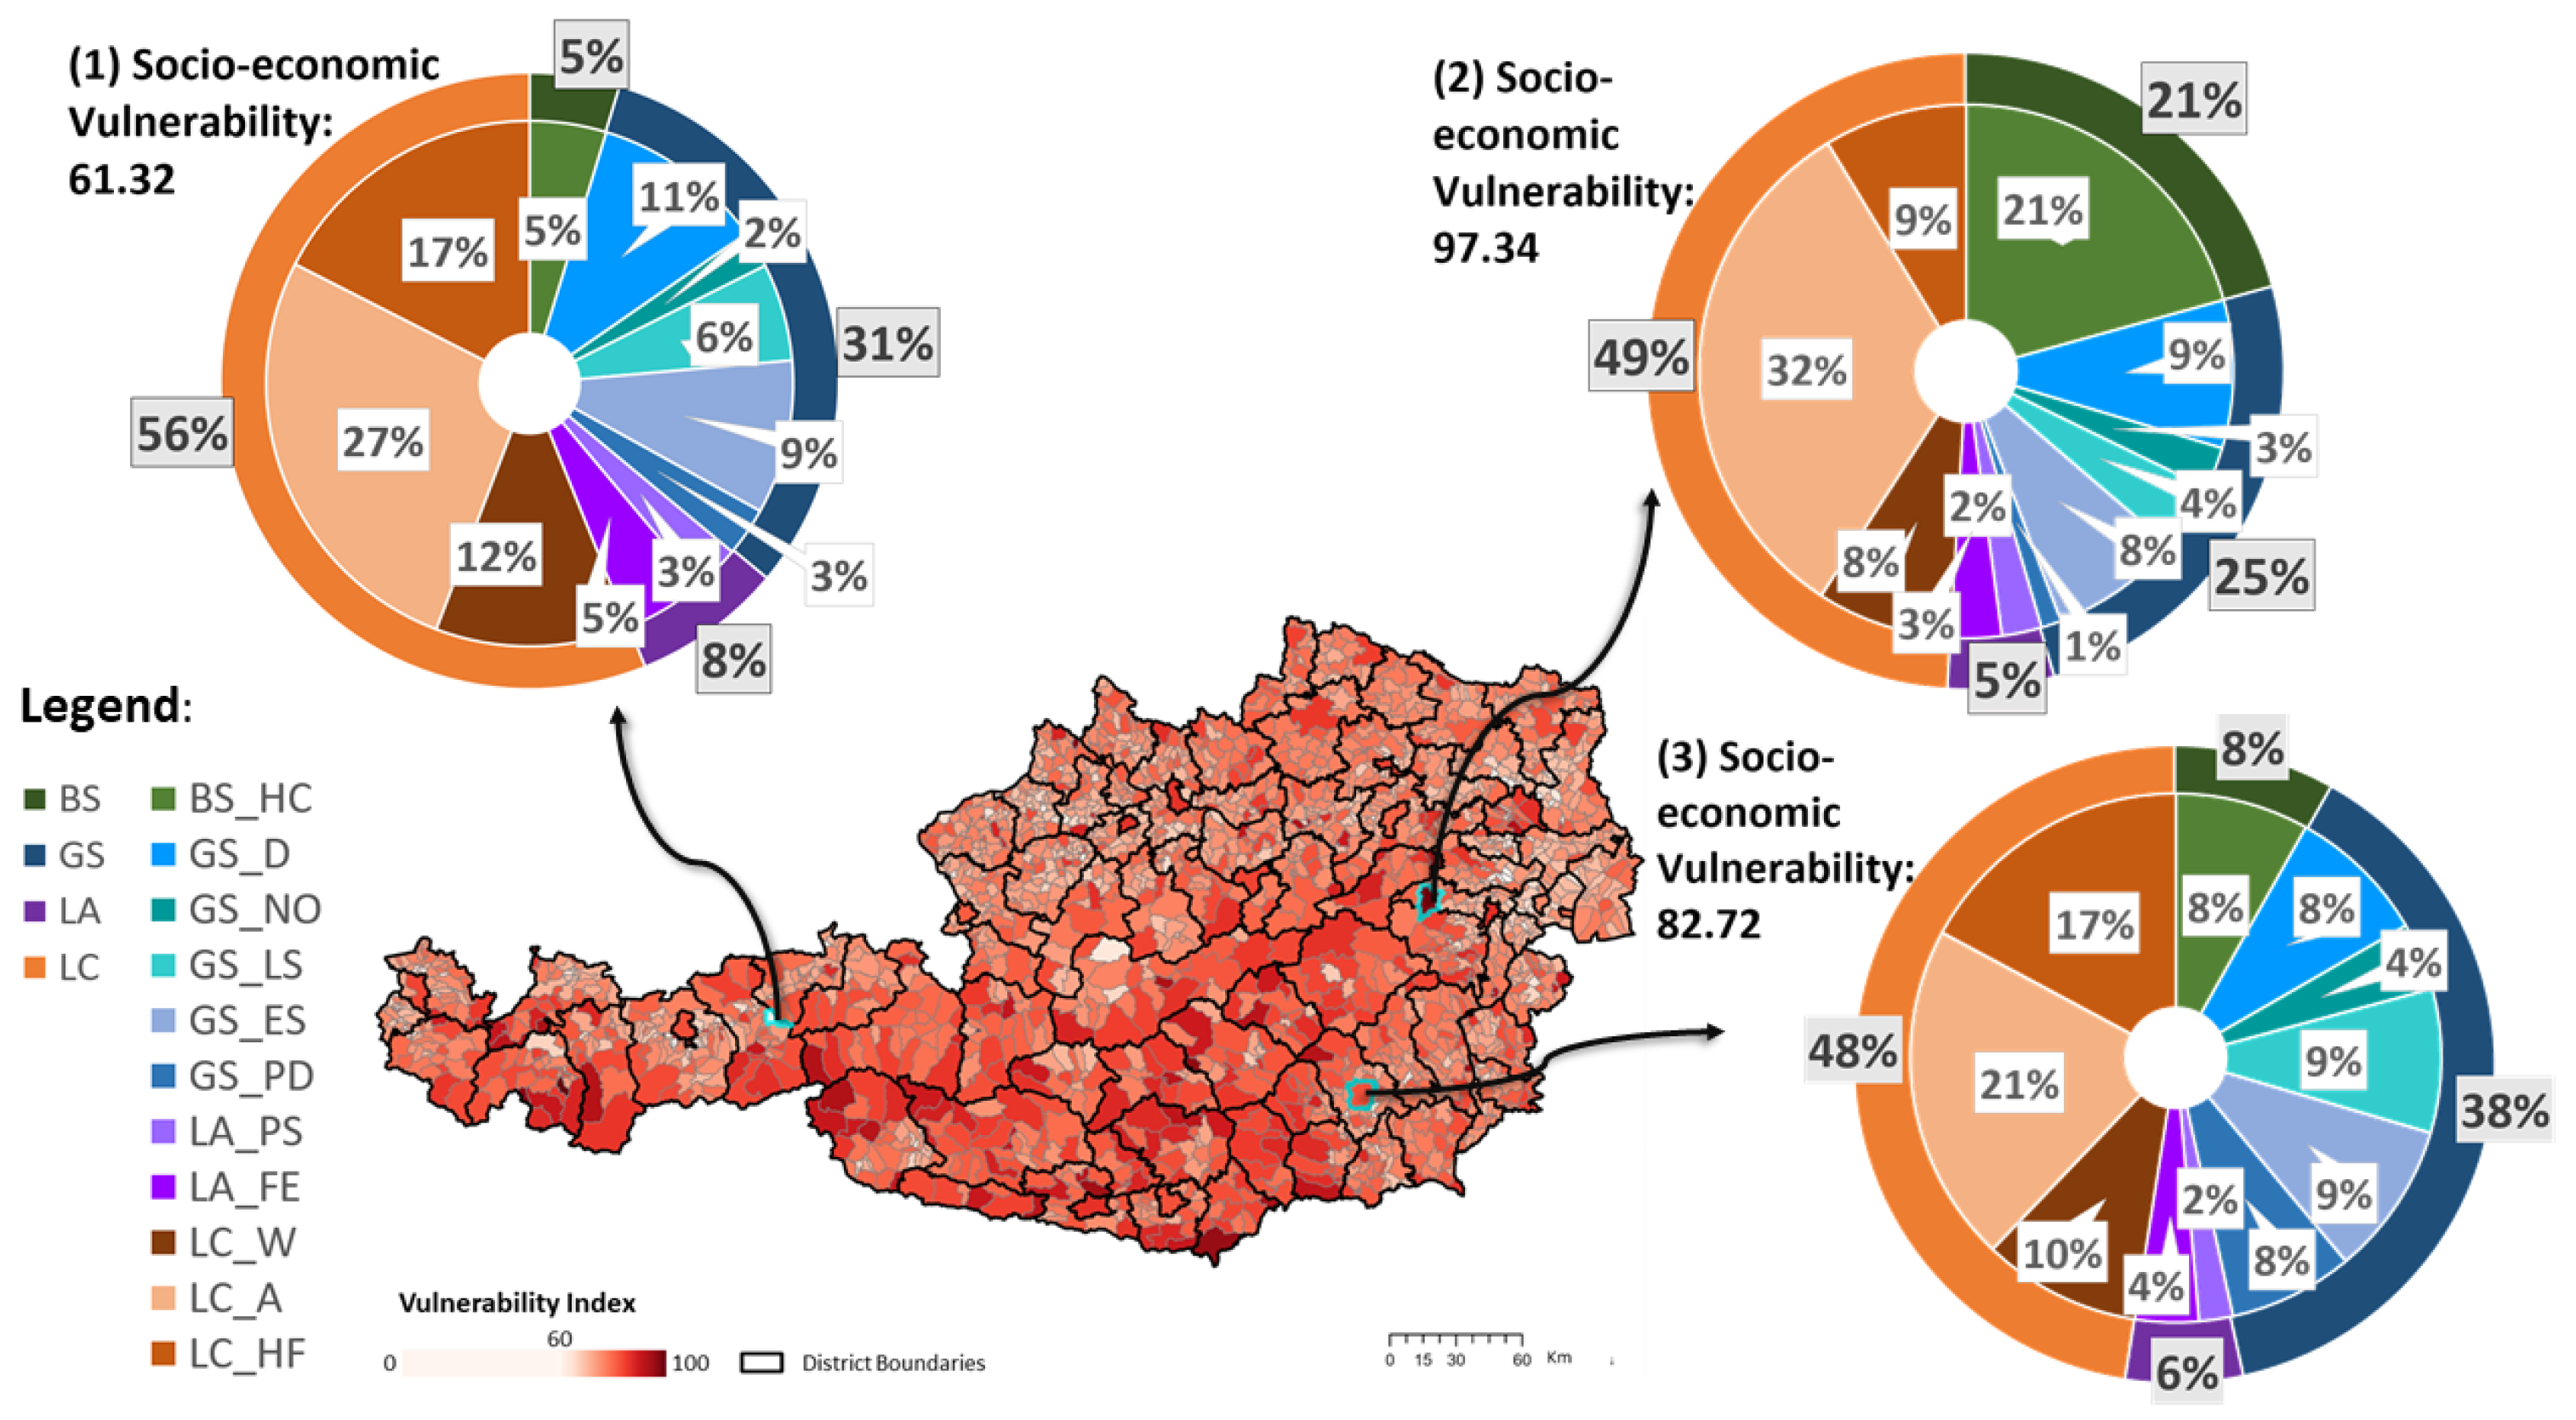
4. Results: Vulnerability Index

4.1. Socio-Economic Vulnerability to Influenza Diseases

Figure 4 shows the socio-economic vulnerability to influenza diseases in the individual municipalities in Austria. The vulnerability index was normalized between 0 and 100; dark red areas indicate a high VI (max value = 100), while bright areas indicated a low VI (min value = 0) compared to the other municipalities. A higher VI could be found more in the mountain regions and to the south in municipalities located in the federal states of Styria, Carinthia, and Tyrol, as well as in larger cities (Innsbruck, Linz, Salzburg, Wels, and Vienna). Areas with a lower VI are in the northern part of Austria in the federal states of Burgenland, Upper Austria, and Lower Austria, as well as in the district Innsbruck-Land. The pie charts in Figure 4 offer a more detailed perspective to better understand the vulnerability of individual municipalities. For three selected municipalities, the contributions of the different categories to the single domains are shown. The greatest influence had a domain lack of capacity to recover, with approximately 50%. Here, the most important category was Access with over 20%. The least influence had the domain’s lack of capacity to anticipate.
The contribution of the single domains to the VI per municipality is displayed in Figure 5 using a continuous classification scheme. Darker coloration indicates a higher magnitude of contribution. Depending on the region, the susceptibilities and capacity to anticipate had a varying influence on the VI of a municipality. In the south-eastern part (Styria, Carinthia, and Burgenland), biological susceptibility exerted a higher influence than in the northern and western parts (Tyrol, Salzburg). The generic susceptibility, on the other hand, demonstrated a greater impact in Vienna and Lower Austria, as well as in Tyrol and the major urban centers throughout Austria. The lack of capacity to anticipate was strongest in Upper Austria, as well as in parts of Carinthia and Tyrol. Conversely, the domain’s lack of capacity to cope had a notable influence across the whole of Austria.

4.2. Socio-Economic Vulnerability to Vector-Borne Diseases
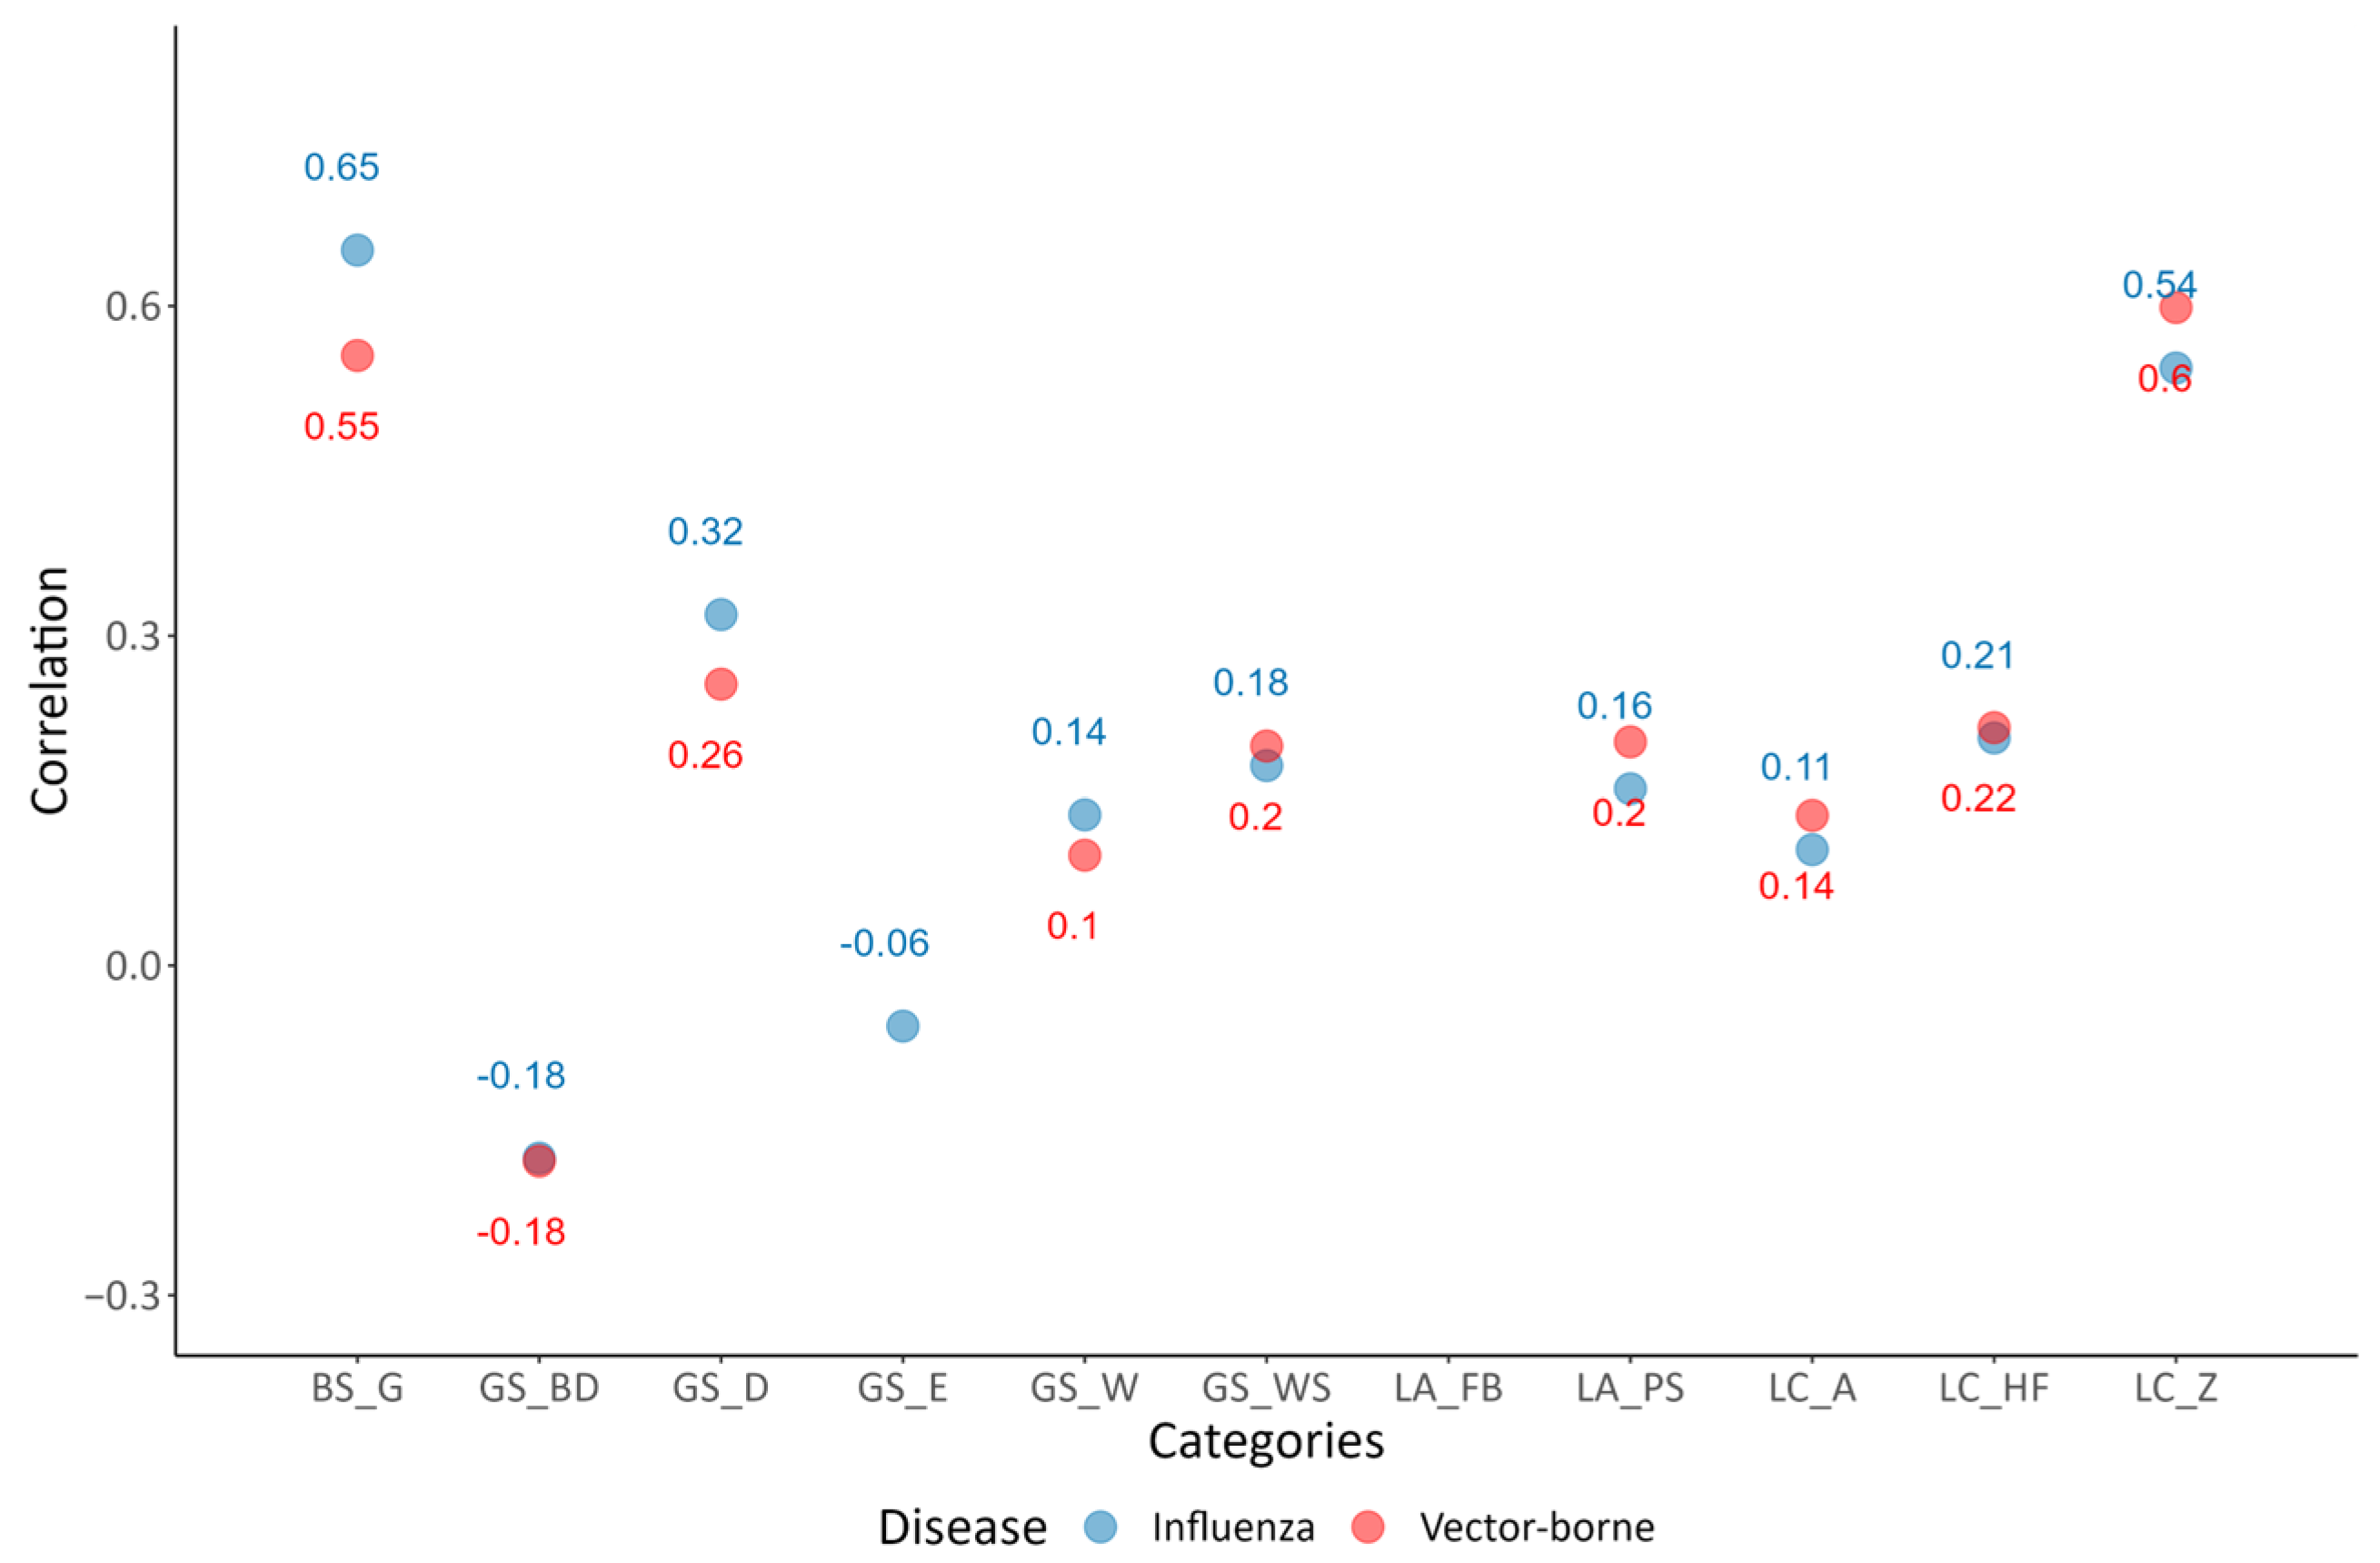
For the second scenario, we defined a vector-borne disease similar to Dengue fever. Figure 6 shows the results of the VI for each municipality. As in Figure 4, a continuous color scheme was chosen, where white indicates a low VI (min = 0) and red indicates a high VI (max = 100) compared to the other municipalities. The three pie charts show the same municipalities as in Figure 4 and provide information about the contributions of the domains and categories. Similar to influenza diseases, the highest contribution showed a lack of capacity to cope and the least lack of anticipation.
When comparing the VI of vector-borne diseases to that of influenza diseases, no significant difference was evident. The observed variation did not exceed five points on the VI scale. In general, Austria demonstrated a higher vulnerability to vector-borne diseases, with over 1400 municipalities displaying an increased VI compared to influenza diseases. Notably, increased vulnerability to influenza diseases appeared to be concentrated in Burgenland and Styria.
Examining the average contributions from the individual categories, it became apparent that vulnerability to influenza diseases was predominantly influenced by indicators related to the state of local hospitals, work environments, and living conditions. On the other hand, vulnerability to vector-borne diseases was primarily shaped by indicators such as the state of local hospitals, accessibility, and working and employment conditions.

5. Validation

5.1. Comparing Influenza VI with COVID-19

To validate the VI in a practical context, we compared the total number of COVID-19 cases during 2020 with the VI value. The results can be seen in Figure 7 and Figure 8, where different temporal maps represent the situation from February 2020 to February 2021. Two continuous color schemes represent the VI (red) and COVID-19 (purple) situations. The spatio-temporal percentual change of COVID-19 cases per district normalized by inhabitants is presented in Figure 7. VI showed the highest values in the federal states of Styria and Carinthia. In contrast, the number of cases per inhabitant initially increased in Burgenland and the southern part of Carinthia from February 2020 to August 2020. Subsequently, during the winter months, the percentage of cases increased the most in Upper Austria and Tyrol. At the beginning of 2021, Vienna and Lower Austria displayed the lowest percentage of cases.
Figure 8 illustrates the spatial-temporal development of the death cases in the districts normalized by the number of inhabitants (blue color schema) compared to the VI (red color schema). In the first half of 2020, a relatively low percentage of COVID-19-related deaths could be observed across all districts within Austria. The majority of deaths during this period were recorded in Lower Austria and Burgenland. In the second half of the year and at the beginning of 2021, an increase in mortality was recorded, with a notable rise in fatalities documented particularly in districts in Styria, Burgenland, as well as in parts of Carinthia and Upper Austria.
To better understand the relation between the VI- and COVID-19-induced deaths, a Pearson correlation for each of the timestamps from Figure 8 was calculated (Figure 9). Initially, no significant correlation was evident; however, from autumn onwards, a moderate correlation emerged, indicating a connection between COVID-19 deaths and increased VI. Only for December 2020 and February 2021 was the correlation minimal above the significance level (5%).

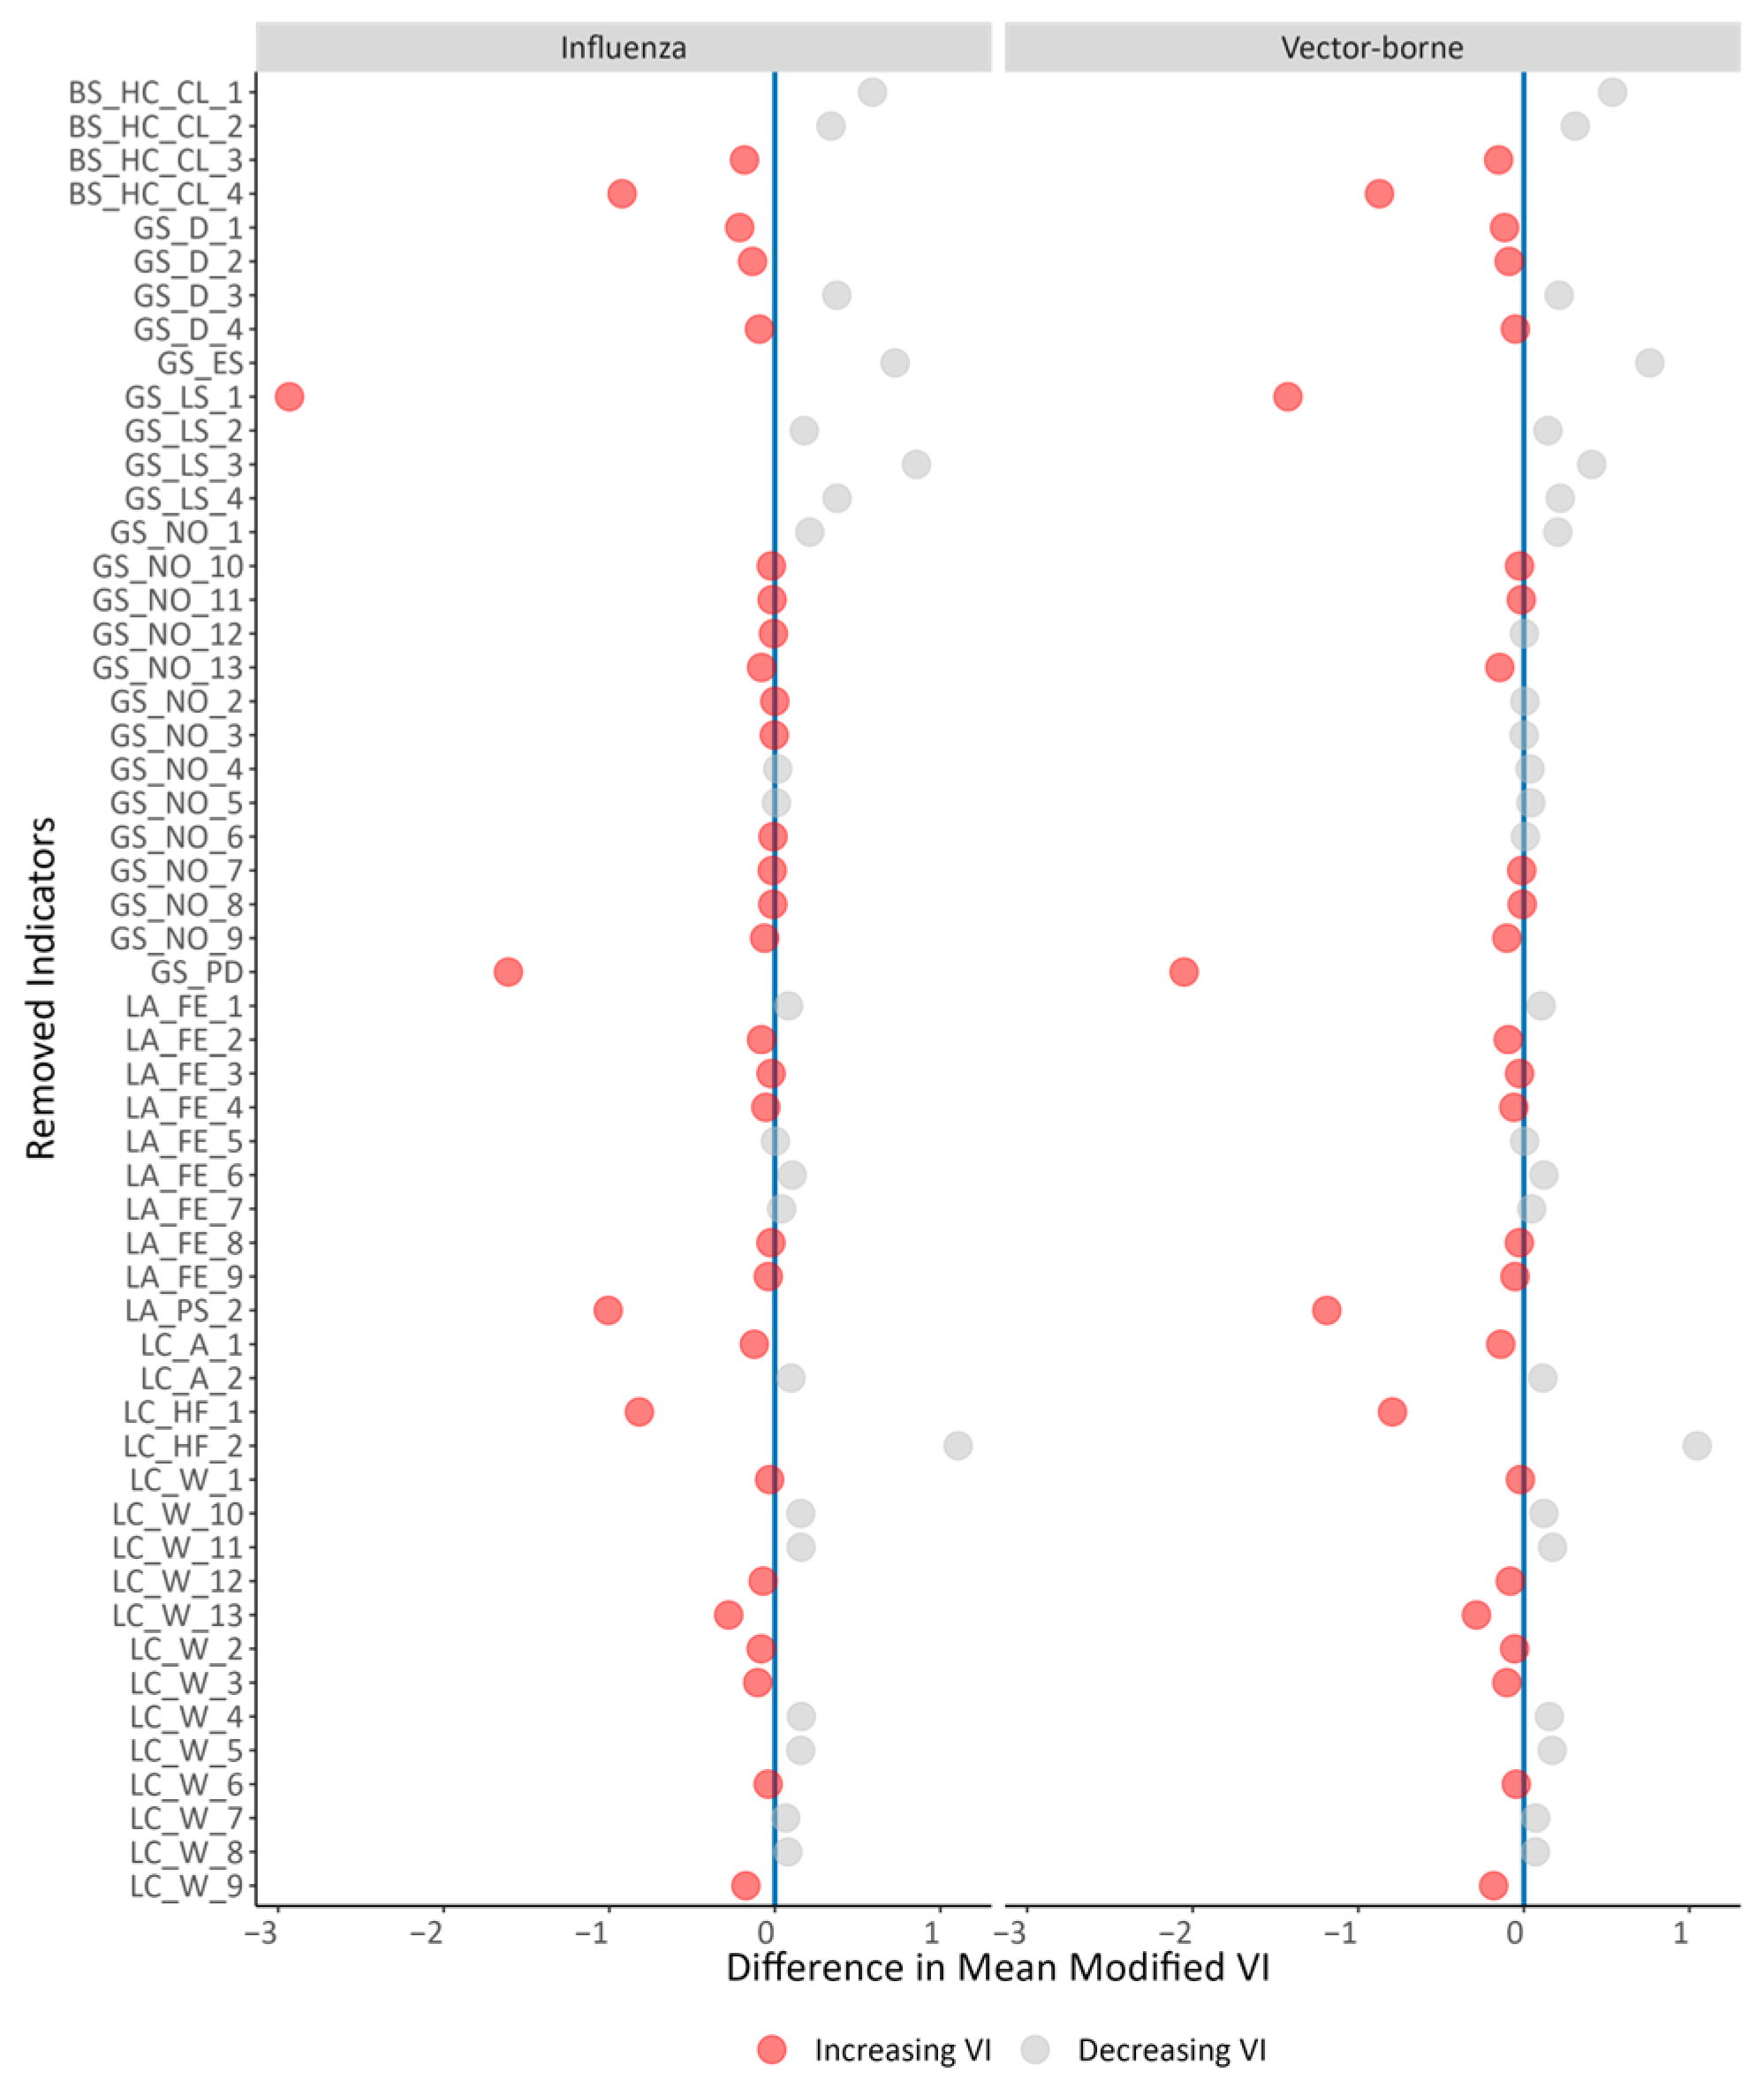
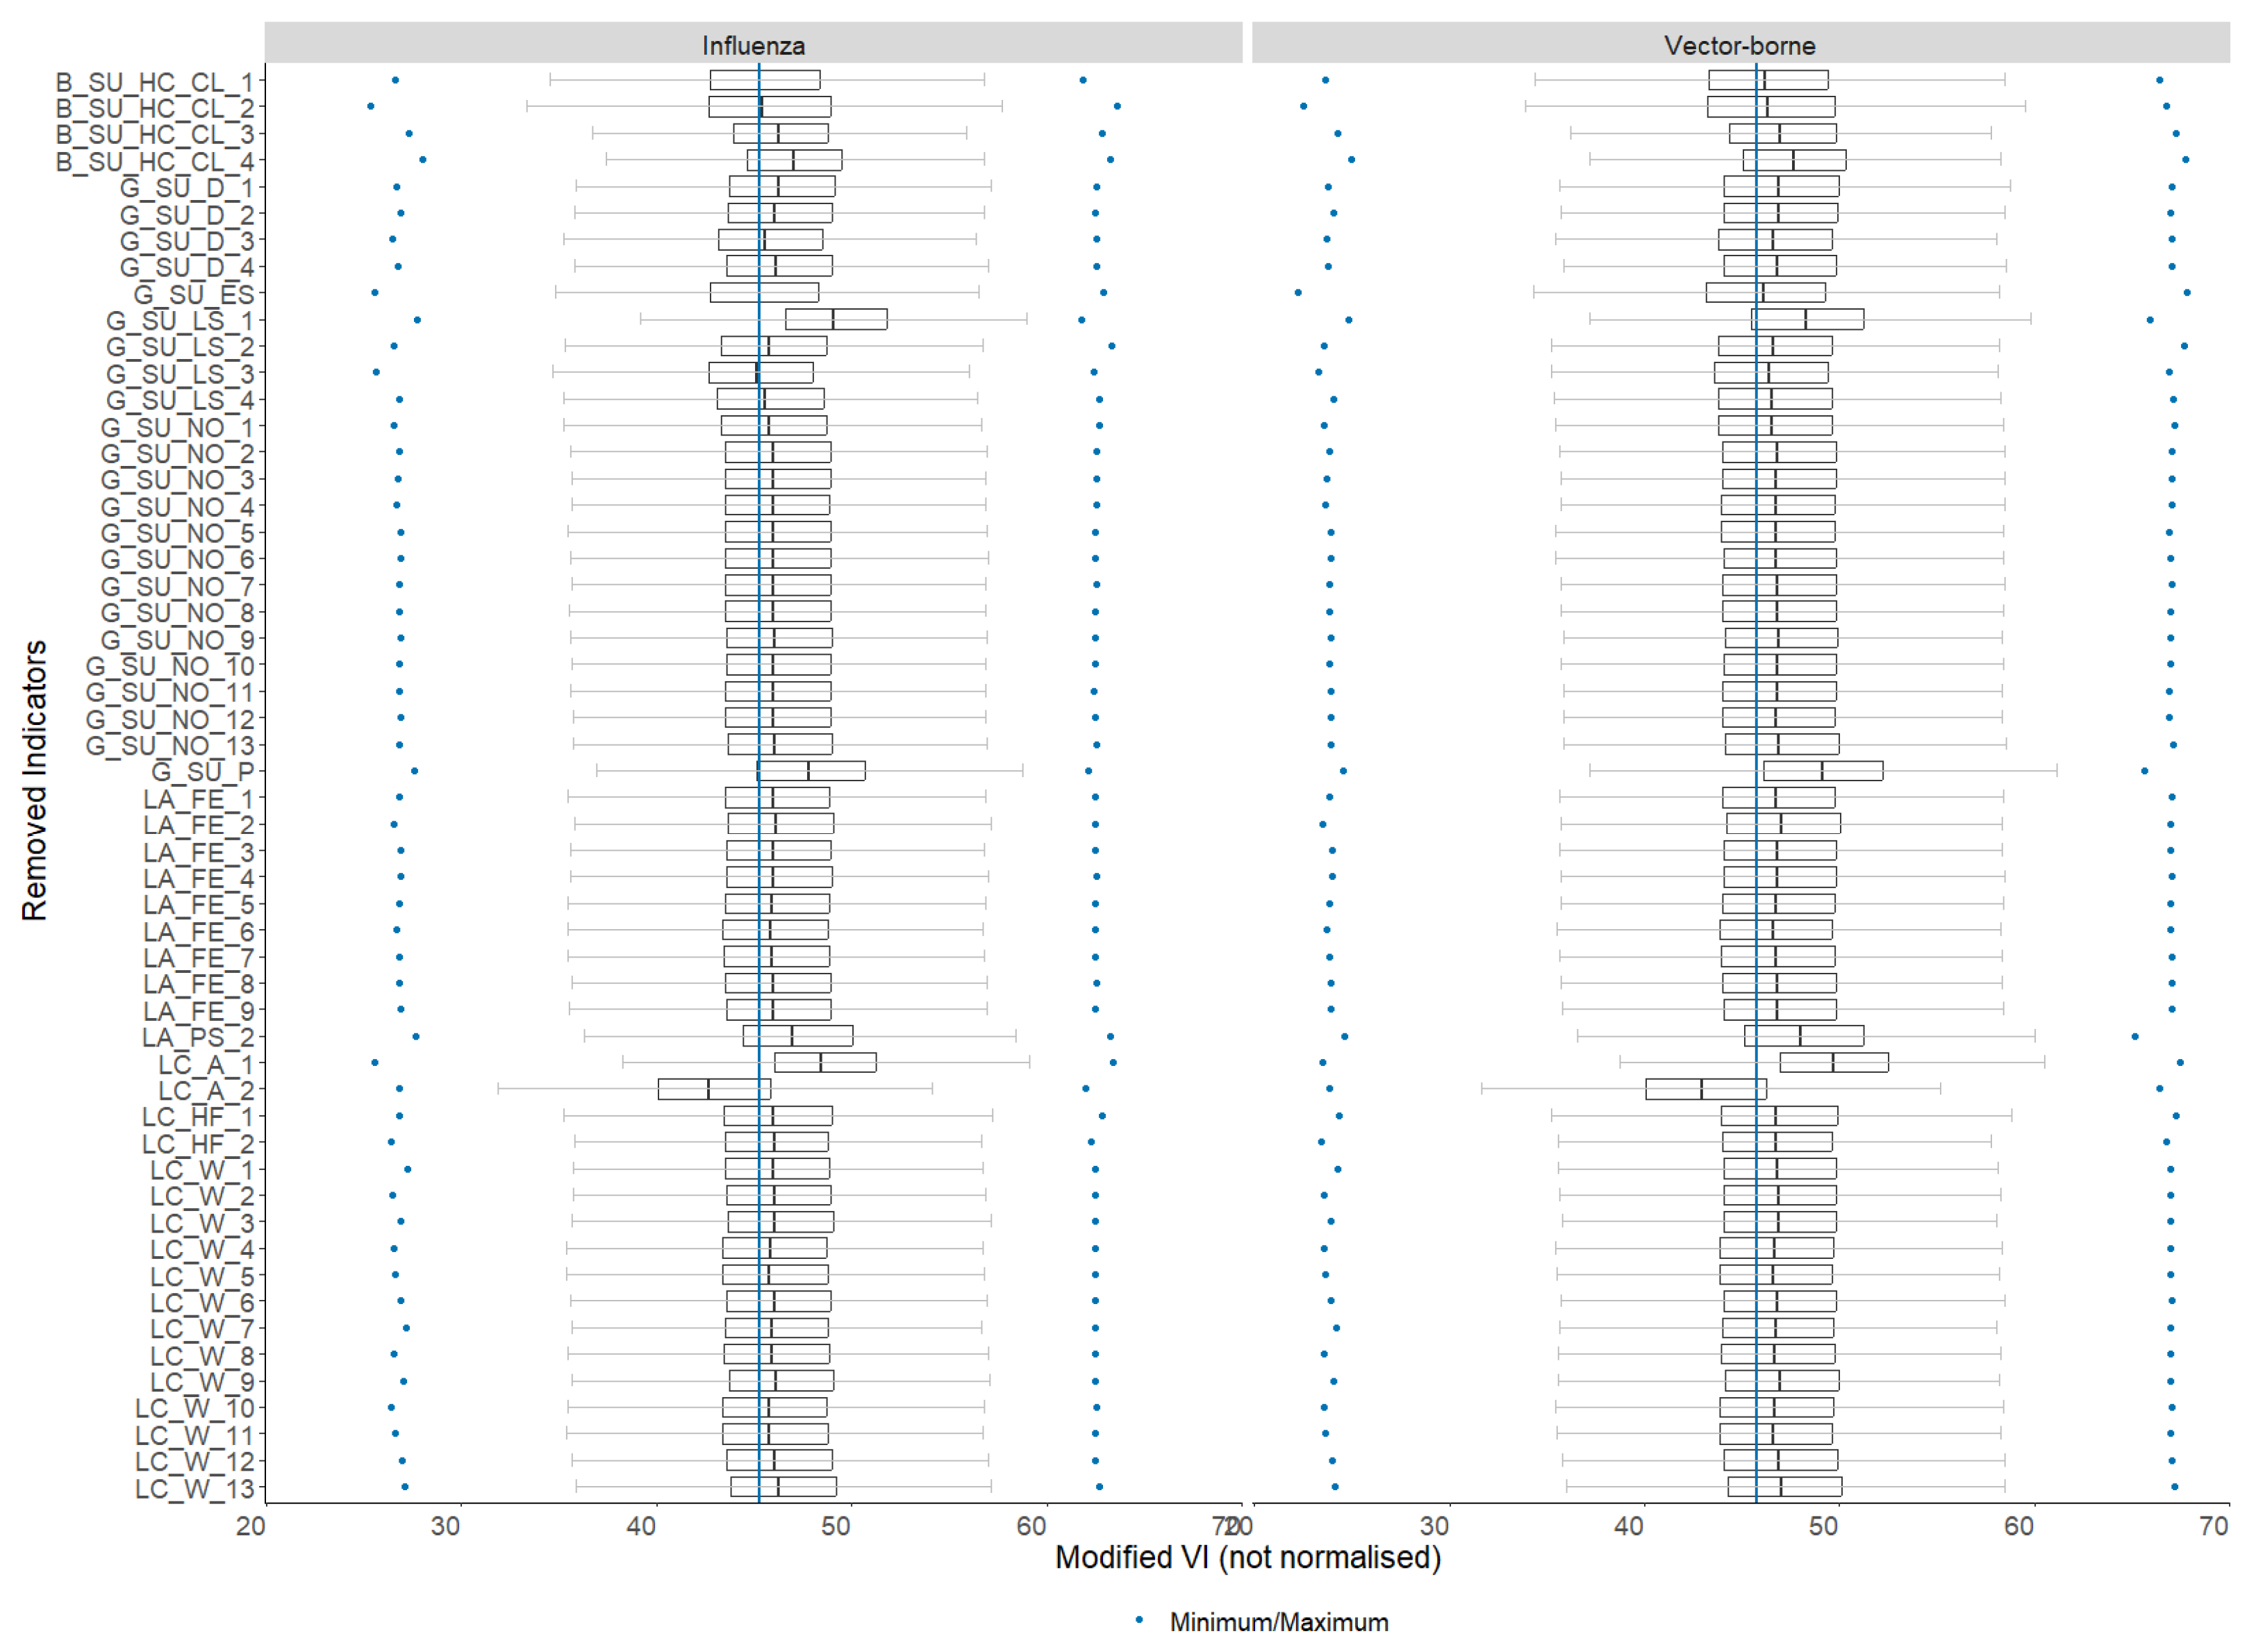
5.2. Sensitivity Analysis

A composite indicator is constructed by choosing different indicators and categories. As described above, the influence of the different indicators and categories on the index can vary greatly. It is therefore important to assess this influence in more detail to better understand the vulnerability and the importance of chosen indicators. Therefore, a sensitivity analysis was conducted following the example of [14].
To estimate the influence of the single indicators, we conducted a correlation analysis for the single categories using the Pearson correlation coefficient (p). The correlation analysis is shown in Figure 10. It indicates a minor impact on the VI by the categories nationality (pinfluenza = −0.06, pvector = 0), work (pinfluenza = 0.11, pvector = 0.14), as well as living situation (pinfluenza =0.14, pvector = 0.1). In contrast, indicators belonging to the categories of health conditions (pinfluenza =0.65, pvector = 0.55), demography (pinfluenza =0.32, pvector = 0.26), and access (pinfluenza = 0.54, pvector=0.6) showed a high influence on vulnerability.
The influence of the selected indicators on the VI was assessed by removing single indicators and calculating the VI anew. Figure 11 shows the results of this sensitivity analysis. For a better interpretation of the results, the mean VI for Austria was calculated for each analysis. On the x-axis, the difference between the original VI and the modified VI is plotted. The y-axis lists the indicators, which were excluded from the calculation.
It can be seen that excluding certain indicators such as the care level (ambulant), number of household members, unemployment, and number of existing beds would decrease the VI, while indicators such as population density, care level (stationary), institutions, vaccination, and number of theoretical beds would increase the VI for both scenarios. Removing other indicators from the calculation had a low impact on the mean VI. Still, this change did not exceed the three scores of the mean VI.
More comprehensive results are illustrated in Figure 12. Figure 12 presents two boxplots displaying the newly calculated mean VI for each removed indicator, compared to the original mean VI (blue line), along with the minimum and maximum VI values (blue points). As expected, considering the above findings, the results for the two diseases did not differ significantly from each other. In alliance with Figure 10, discarding the indicators for the population density, institutions, and vaccination results in the greatest change of the VI.

6. Discussion

The socio-economic vulnerability in Austria shows significant spatial variations depending on the underlying indicators. More detailed information about the different factors influencing local vulnerability can be obtained using the created web map. The web map shows the spatial distribution of the VI, providing a holistic few of Austria at the municipality level while allowing for analyzing the underlying factors more closely. Thereby, people/groups in vulnerable situations and shared vulnerable aspects can be easily identified, and potential hotspots can be located. Consequently, the VA offers the advantage of enhancing the sustainability of future epidemic management by supporting the planning process and providing a comprehensive overview of the pre-event situation.
This VA used an expert-based weighting approach, which offered, compared to statistical weighting, the opportunity to include practical as well as scientific knowledge. In this study, the team of experts was well mixed with different backgrounds in the areas of the health system. In particular, the input of people working with persons/groups in vulnerable situations was very important for providing new viewing angles. Still, the use of more than ten indicators can lead to cognitive stress among the experts [49]. Therefore, a clear definition of the meaning of single indicators, as well as the meaning of high and low weights, needs to be given. A different weighting method could be used in further research to address this issue and to further analyze the potential differences between statistical and expert-based weights [49]. In the web map, users can only choose the weights for the categories, as this allows for easier use while still enabling the creation of new disease scenarios.
Moreover, the chosen weights do not always correctly represent the importance of the indicator, which is often misunderstood [51]. Examining the correlation between VI and the underlying categories depicted in Figure 10, the strongest correlation was evident for Health Conditions and Access. This aligns with the high weighting indicated in Table 1. Upon examining the Demography category, which showed the third-highest correlation with the VI, and comparing it to the assigned weighting, it became apparent that the Living and Economic Situation categories should have a greater influence. Additionally, when comparing the influence of individual indicators with the VI (as illustrated in Figure 11 and Figure 12), it was noticeable that the indicator Vaccinations was assigned only a moderate weight compared to the other indicators. This was inconsistent with the actual impact of the Vaccination indicator on the VI. In order to avoid these effects, an optimization of the weights generated by experts would need to be implemented in a future study [51].
Furthermore, depending on the underlying weight distribution, the influence of single indicators can vary. For vector-borne and influenza diseases, the vulnerability and underlying influences of the indicators display remarkable similarities, suggesting shared vulnerable factors and similar groups in vulnerable situations. A dominant influence on the VI showed the category Lack of capacity to cope, indicating a need for more hospital beds as well as better access to health facilities. It is important to keep in mind that the indicator of the number of beds for each municipality was calculated based on the hospital matrix from Gesundheit Österreich GmbH (2016). Here, the assumption has been made that all beds in the hospital are available for each municipality within reach of the hospital, not considering that other patients already occupy the beds. For this reason, this indicator has to be viewed with care, and a better approach should be defined for future analysis.
Additionally, the categories Demography and the Health Condition had a high impact on the VI. Libório et al. [52] used a composite indicator approach to estimate the exposure of countries to COVID-19 and established that age had the highest influence on the exposure to COVID-19. Hence, this is the driving factor for vulnerability on a countrywide scale. Comparing this with our findings and expert knowledge, we observed a different trend for vulnerability in Austria. Here, Health Conditions and Health Facilities exhibited a higher influence. One possible explanation might be that we analyzed age independently of health conditions, which could also be summarized in one category [52].
However, comparing the VI for a disease like COVID-19 and the actual course of the outbreak, dissimilarities could be observed (Figure 7 and Figure 8), particularly in the number of cases compared to the VI score. This can be attributed to the omission of factors contributing to the onset of the COVID-19 outbreak in the analysis. The VI does not provide information regarding the probability of an outbreak occurring in a specific municipality. The index describes the vulnerability to severe disease progression based upon pre-event conditions, in this case from 2019. This means that high vulnerability is an indicator of an increased likelihood of experiencing more severe cases within this municipality in comparison to other municipalities. The differences found between the number of cases and the VI are therefore not unexpected. It is important to keep in mind that VA is based on the available data for the indicators. Moreover, the VA is not dynamic or automized, implying that changes in the data during the event are not considered. The only way to adapt the VI during the outbreak without data collection is by changing the weights for the different categories and indicators if new knowledge about the disease is obtained. Therefore, to validate the VI, considering the death cases is more suitable. In Figure 9, we see a relation between a high VI and an increased number of deaths indicating a successful application of the VA. This correlation has also been confirmed in other studies [36]. Still, some differences can be seen. One of the reasons for this difference is data scaling. The VI was calculated based on municipalities and aggregated to fit the information at the district level. This could have led to an over- or underestimation of the vulnerability at the district level. Furthermore, the correlation between COVID-19 and VI was influenced by the creation of the composite indicator. In addition to the impact of different weighting methods, the selection of indicators is also important [36]. In our case, important indicators are missing due to the lack of data at the municipality level. In Table 2, the indicators could not be included in the analysis but would provide important information to identify people and groups in vulnerable situations as well as improve the accuracy of the VI. Additional socioeconomic indicators at both the individual and institutional levels were considered, aligning with the research objective of identifying groups and individuals in vulnerable situations. Other factors, including the industry’s susceptibility to the impacts of a pandemic and the consequent financial implications for the municipality, have not been considered because of increasing complexity. Nevertheless, the industry’s vulnerability to pandemics is a crucial aspect that contributes to individual vulnerability and should be taken into consideration in future studies.
An additional outcome of this study is thus a list of missing data, which should be raised and made available to researchers and decision-makers to implement sustainable management strategies. Furthermore, it is important to keep in mind the sensitivity of the collected data, as well as the defying and identification of people/groups in vulnerable situations. Here, the risk of stigmatization arises, which must be put into perspective and explained to the concerned people/groups. Still, identifying groups and people in vulnerable situations is not only relevant for disease management but can also help to improve management strategies regarding natural hazards, such as flooding, or man-made hazards, such as blackouts, and reach the SDGs.

7. Conclusions

In this study, we present a method for conducting a socio-economic VA with a composite indicator weighted by experts. In the context of sustainable risk management for future epidemics/pandemics, the VA can support decision-makers, and governmental and non-governmental organizations to identify people and groups in vulnerable situations as well as vulnerable regions. The web map can be used to adapt the analysis for other disease scenarios by changing the weights for the categories and, if desired, for the underlying indicators. However, this requires a good understanding of the data used and the calculation of the VI. Precautionary measures to reduce vulnerability can be defined by a closer analysis of the contribution of the different categories and indicators. For instance, increasing the number of hospital beds or creating strategies to protect people with the need for caretakers. Moreover, the VI and the web map can be used to define policy suggestions and serve as the starting point for community engagement. However, the underlying data and indicators must be improved to increase the significance of the VI. Important indicators to identify more people in vulnerable situations (homeless, people with health problems, etc.) could not be added due to the lack of data on the municipality level. Hence, we strongly suggest providing opportunities to collect these data concerning privacy rights and sensitivity. For further improvement of the VI, other weighting methods as well as new calculation methods such as regression methods should be tested.
The VA is a quantitative method working at the administrative level, while strongly depending on the available data. It does not consider qualitative data like individual perceptions of the municipal residents. Hence, a sustainable epidemic management plan should also include methods such as community engagement, focusing more on the integration of individuals, especially in vulnerable situations.

Author Contributions

Conceptualization, V.S., S.K., S.R. and D.H.; Methodology, V.S. and S.K.; Software, S.R.; Validation, V.S.; Formal analysis, V.S.; Investigation, V.S.; Data curation, V.S., S.K. and D.H.; Writing—original draft, V.S.; Writing and editing, V.S., D.H., S.R. and S.K.; Visualization, V.S. and S.R.; Supervision, D.H. and S.K.; Project administration, D.H. and S.K.; Funding acquisition, S.K. All authors have read and agreed to the published version of the manuscript.

Funding

This research has been supported by the Austrian Research Promotion Agency (FFG) in the Austrian Security Research Programme (KIRAS) through the project CAVE (contract no. FO999886351).

Institutional Review Board Statement

Not applicable.

Informed Consent Statement

Not applicable.

Data Availability Statement

Some of the indicator data are freely available from the mentioned sources. Access to the web map can be provided upon request.

Conflicts of Interest

Author Steffen Reichel was employed by the company Spatial Services GmbH. The remaining authors declare that the research was conducted in the absence of any commercial or financial relation-ships that could be construed as a potential conflict of interest.

References

  1. Das Deutsche Rote Kreuz. Epidemien und Pandemien: Hilfe bei Infektionsausbrüchen. Available online: https://www.drk.de/hilfe-weltweit/wann-wir-helfen/katastrophe/epidemien-pandemien/ (accessed on 12 July 2023).
  2. Prieto, J.; Malagón, R.; Gomez, J.; León, E. Urban Vulnerability Assessment for Pandemic Surveillance—The COVID-19 Case in Bogotá, Colombia. Sustainability 2021, 13, 3402. [Google Scholar] [CrossRef]
  3. Piret, J.; Boivin, G. Pandemics Throughout History. Front. Microbiol. 2021, 11. Available online: https://www.frontiersin.org/articles/10.3389/fmicb.2020.631736 (accessed on 10 August 2023).
  4. World Health Organization (WHO). Coronavirus Disease (COVID-19); World Health Organization: Geneva, Switzerland; Available online: https://www.who.int/health-topics/coronavirus#tab=tab_1 (accessed on 12 July 2023).
  5. Worldometer. Letalitätsrate Beim Coronavirus (COVID-19) in Den am Stärksten Betroffenen Ländern (Stand: 24. Juli 2023) [Graph]; Statista: New York, NY, USA, 2023; Available online: https://de.statista.com/statistik/daten/studie/1103785/umfrage/mortalitaetsrate-des-coronavirus-nach-laendern/ (accessed on 24 July 2023).
  6. Al-Salem, W.; Moraga, P.; Ghazi, H.; Madad, S.; Hotez, P.J. The Emergence and Transmission of COVID-19 in European Countries, 2019–2020: A Comprehensive Review of Timelines, Cases and Containment. Int. Health 2021, 13, 383–398. [Google Scholar] [CrossRef]
  7. Sarkodie, S.A.; Owusu, P.A. Global Assessment of Environment, Health and Economic Impact of the Novel Coronavirus (COVID-19). Environ. Dev. Sustain. 2021, 23, 5005–5015. [Google Scholar] [CrossRef] [PubMed]
  8. Macassa, G.; Tomaselli, G. Rethinking Developed Nations’ Health Systems through A Social Sustainability Perspective in the Light of the COVID-19 Pandemic. A Viewpoint. J. Public Health Res. 2020, 9, jphr.2020.1834. [Google Scholar] [CrossRef] [PubMed]
  9. Sajjad, A. The COVID-19 Pandemic, Social Sustainability and Global Supply Chain Resilience: A Review. Corp. Gov. Int. J. Bus. Soc. 2021, 21, 1142–1154. [Google Scholar] [CrossRef]
  10. Imran, N.; Zeshan, M.; Pervaiz, Z. Mental Health Considerations for Children & Adolescents in COVID-19 Pandemic. Pak. J. Med. Sci. 2020, 36, S67–S72. [Google Scholar] [CrossRef]
  11. Blanco, E.; Baier, A.; Holzmeister, F.; Jaber-Lopez, T.; Struwe, N. Substitution of Social Sustainability Concerns under the Covid-19 Pandemic. Ecol. Econ. 2022, 192, 107259. [Google Scholar] [CrossRef]
  12. Donkor, F.K.; Mitoulis, S.-A.; Argyroudis, S.; Aboelkhair, H.; Canovas, J.A.B.; Bashir, A.; Cuaton, G.P.; Diatta, S.; Habibi, M.; Hölbling, D.; et al. SDG Final Decade of Action: Resilient Pathways to Build Back Better from High-Impact Low-Probability (HILP) Events. Sustainability 2022, 14, 15401. [Google Scholar] [CrossRef]
  13. Bian, W.; Hou, H.; Chen, J.; Zhou, B.; Xia, J.; Xie, S.; Liu, T. Evaluating the Spatial Risk of Bacterial Foodborne Diseases Using Vulnerability Assessment and Geographically Weighted Logistic Regression. Remote Sens. 2022, 14, 3613. [Google Scholar] [CrossRef]
  14. Kienberger, S.; Hagenlocher, M. Spatial-Explicit Modeling of Social Vulnerability to Malaria in East Africa. Int. J. Health Geogr. 2014, 13, 29. [Google Scholar] [CrossRef] [PubMed]
  15. Macharia, P.M.; Joseph, N.K.; Okiro, E.A. A Vulnerability Index for COVID-19: Spatial Analysis at the Subnational Level in Kenya. BMJ Glob. Heal. 2020, 5, e003014. [Google Scholar] [CrossRef] [PubMed]
  16. Hagenlocher, M.; Hölbling, D.; Kienberger, S.; Vanhuysse, S.; Zeil, P. Spatial Assessment of Social Vulnerability in the Context of Landmines and Explosive Remnants of War in Battambang Province, Cambodia. Int. J. Disaster Risk Reduct. 2016, 15, 148–161. [Google Scholar] [CrossRef]
  17. Diaz-Sarachaga, J.M.; Jato-Espino, D. Analysis of Vulnerability Assessment Frameworks and Methodologies in Urban Areas. Nat. Hazards 2020, 100, 437–457. [Google Scholar] [CrossRef]
  18. Bizimana, J.-P.; Twarabamenye, E.; Kienberger, S. Assessing the Social Vulnerability to Malaria in Rwanda. Malar. J. 2015, 14, 2. [Google Scholar] [CrossRef] [PubMed]
  19. Streifeneder, V.; Kienberger, S.; Hölbling, D. Vulnerabilitätsanalyse Für Zukünftige Epidemien in Österreich. In Proceedings of the Disaster Research Days 2022, Innsbruck, Austria, 13–14 October 2022; pp. 125–127. [Google Scholar]
  20. Bachtrögler, J.; Firgo, M.; Fritz, O.; Klien, M.; Mayerhofer, P.; Piribauer, P.; Streicher, G. Regionale Unterschiede Der Ökonomischen Betroffenheit von Der Aktuellen COVID-19-Krise in Österreich. Ein Strukturansatz Auf Ebene Der Bundesländer [Regional Differences in the Economic Vulnerability to the Current COVID-19 Crisis in Austria]. WIFO Work. Pap. 2020, 597, 1–44. [Google Scholar]
  21. Simon, J.; Helter, T.M.; White, R.G.; van der Boor, C.; Łaszewska, A. Impacts of the COVID-19 Lockdown and Relevant Vulnerabilities on Capability Well-Being, Mental Health and Social Support: An Austrian Survey Study. BMC Public Health 2021, 21, 314. [Google Scholar] [CrossRef]
  22. WHO COVID-19 Dashboard; World Health Organization: Geneva, Switzerland, 2019; Available online: https://covid19.who.int/ (accessed on 12 July 2023).
  23. Birkmann, J.; Cardona, O.D.; Carreño, M.L.; Barbat, A.H.; Pelling, M.; Schneiderbauer, S.; Kienberger, S.; Keiler, M.; Alexander, D.; Zeil, P.; et al. Framing Vulnerability, Risk and Societal Responses: The MOVE Framework. Nat. Hazards 2013, 67, 193–211. [Google Scholar] [CrossRef]
  24. Hagenlocher, M.; Delmelle, E.; Casas, I.; Kienberger, S. Assessing Socioeconomic Vulnerability to Dengue Fever in Cali, Colombia: Statistical vs Expert-Based Modeling. Int. J. Health Geogr. 2013, 12, 36. [Google Scholar] [CrossRef]
  25. Rovan, J. Composite Indicators. In International Encyclopedia of Statistical Science; Lovric, M., Ed.; Springer: Berlin/Heidelberg, Germany, 2011; pp. 275–276. [Google Scholar] [CrossRef]
  26. Toubasi, A.A.; AbuAnzeh, R.B.; Tawileh, H.B.A.; Aldebei, R.H.; Alryalat, S.A.S. A Meta-Analysis: The Mortality and Severity of COVID-19 among Patients with Mental Disorders. Psychiatry Res. 2021, 299, 113856. [Google Scholar] [CrossRef]
  27. Treskova-Schwarzbach, M.; Haas, L.; Reda, S.; Pilic, A.; Borodova, A.; Karimi, K.; Koch, J.; Nygren, T.; Scholz, S.; Schönfeld, V.; et al. Pre-Existing Health Conditions and Severe COVID-19 Outcomes: An Umbrella Review Approach and Meta-Analysis of Global Evidence. BMC Med. 2021, 19, 212. [Google Scholar] [CrossRef] [PubMed]
  28. Wojczewski, S.; Grohma, P.; Kutalek, R. Communication Is Key: Die Rolle von Community Engagement in Der Bewältigung von COVID-19 in Österreich. In Proceedings of the Disaster Research Days 2022, Innsbruck, Austria, 13–14 October 2022; pp. 27–29. [Google Scholar]
  29. O’Sullivan, T.; Bourgoin, M. Vulnerability in an Influenza Pandemic: Looking Beyond Medical Risk. 2010. Available online: https://ighhub.org/sites/default/files/Lit%20Review%20-%20Vulnerability%20in%20Pandemic_FINAL.pdf (accessed on 28 August 2023).
  30. Venkatapuram, S. Human Capabilities and Pandemics. J. Hum. Dev. Capab. 2020, 21, 280–286. [Google Scholar] [CrossRef]
  31. Burton-Jeangros, C.; Duvoisin, A.; Lachat, S.; Consoli, L.; Fakhoury, J.; Jackson, Y. The Impact of the COVID-19 Pandemic and the Lockdown on the Health and Living Conditions of Undocumented Migrants and Migrants Undergoing Legal Status Regularization. Front. Public Health 2020, 8, 596887. [Google Scholar] [CrossRef] [PubMed]
  32. Molarius, A.; Persson, C. Living Conditions, Lifestyle Habits and Health among Adults before and after the COVID-19 Pandemic Outbreak in Sweden—Results from a Cross-Sectional Population-Based Study. BMC Public Health 2022, 22, 171. [Google Scholar] [CrossRef] [PubMed]
  33. Mahmood, F.; Acharya, D.; Kumar, K.; Paudyal, V. Impact of COVID-19 Pandemic on Ethnic Minority Communities: A Qualitative Study on the Perspectives of Ethnic Minority Community Leaders. BMJ Open 2021, 11, e050584. [Google Scholar] [CrossRef] [PubMed]
  34. Peacock, I.; Ryo, E. A Study of Pandemic and Stigma Effects in Removal Proceedings. J. Empir. Leg. Stud. 2022, 19, 560–593. [Google Scholar] [CrossRef]
  35. Partida, Y. Language Barriers and the Patient Encounter. AMA J. Ethics 2007, 9, 566–571. [Google Scholar] [CrossRef]
  36. Libório, M.P.; Martinuci, O.S.; Bernardes, P.; Krohling, N.C.A.C.C.; Castro, G.; Guerra, H.L.; Ribeiro, E.A.; Fonzar, U.J.V.; Francisco, Í.C. Social Vulnerability and COVID-19 in Maringá, Brazil. Spat. Inf. Res. 2023, 31, 51–59. [Google Scholar] [CrossRef]
  37. Storopoli, J.; Braga da Silva Neto, W.L.; Mesch, G.S. Confidence in Social Institutions, Perceived Vulnerability and the Adoption of Recommended Protective Behaviors in Brazil during the COVID-19 Pandemic. Soc. Sci. Med. 2020, 265, 113477. [Google Scholar] [CrossRef]
  38. Kashem, S.B.; Baker, D.M.; González, S.R.; Lee, C.A. Exploring the Nexus between Social Vulnerability, Built Environment, and the Prevalence of COVID-19: A Case Study of Chicago. Sustain. Cities Soc. 2021, 75, 103261. [Google Scholar] [CrossRef]
  39. De Coninck, D.; D’Haenens, L.; Matthijs, K. Perceived Vulnerability to Disease and Attitudes towards Public Health Measures: COVID-19 in Flanders, Belgium. Pers. Individ. Dif. 2020, 166, 110220. [Google Scholar] [CrossRef] [PubMed]
  40. Sannigrahi, S.; Pilla, F.; Basu, B.; Basu, A.S.; Molter, A. Examining the Association between Socio-Demographic Composition and COVID-19 Fatalities in the European Region Using Spatial Regression Approach. Sustain. Cities Soc. 2020, 62, 102418. [Google Scholar] [CrossRef] [PubMed]
  41. Fülöp, G (Austrian Public Health Institute (GÖG), Vienna, Austria). Pflegegeldstatistik 2019. Bundesministerium für Arbeit, Soziales, Gesundh. und Konsum./Dachverband der österreichischen Sozialversicherungen—Pflegegeldstatistik 2019. 2019; (Personal Communication, Unpublished Work). [Google Scholar]
  42. Statistik Austria. Population at the Beginning of the Year 2019 (Regional Status of 2022). Available online: https://www.data.gv.at/katalog/de/dataset/stat_bevolkerungsstand-2019dbafe (accessed on 30 April 2022).
  43. Statistik Austria. Paket Demographie, Erwerbsstatus und Bildung—Gemeinde. Regionalstatistische Raster. Available online: https://www.statistik.at/atlas/reg-datenkatalog/ (accessed on 30 May 2022).
  44. Statistik Austria. Paket Haushalte—Gemeinde. Regionalstatistische Raster. Available online: https://www.statistik.at/atlas/reg-datenkatalog/ (accessed on 30 May 2022).
  45. Statistik Austria. Gemeindeergebnisse der Abgestimmten Erwerbsstatistik und Arbeitsstättenzählung ab 2011. Available online: http://data.statistik.gv.at (accessed on 1 July 2022).
  46. Dachverband der Sozialversicherungsträger, COVID-19: Impfungen auf Gemeindeebene 2020. Available online: https://www.data.gv.at/katalog/de/dataset/covid-19-impfdaten-auf-gemeindeebene-2022-11-22 (accessed on 1 June 2022).
  47. Saul, S. Grid-Based Indicators of Accessibility of Public Utility Infrastructure: Project Report Eurostat Grant “Merging Statistics and Geospatial Information in Member States”; (Agreement No. Agreement Number 08143.2015.001-2015.712); Statistik Austria: Vienna, Austria, 2017. [Google Scholar]
  48. Fülöp, G. Austrian Health Information System (AHIS); Gesundheit Österreich GmbH: Vienna, Austria, 2016. [Google Scholar]
  49. Greco, S.; Ishizaka, A.; Tasiou, M.; Torrisi, G. On the Methodological Framework of Composite Indices: A Review of the Issues of Weighting, Aggregation, and Robustness. Soc. Indic. Res. 2019, 141, 61–94. [Google Scholar] [CrossRef]
  50. Chang, W.; Cheng, J.; Allaire, J.; Sievert, C.; Schloerke, B.; Xie, Y.; Allen, J.; McPherson, J.; Dipert, A.; Borges, B. Shiny: Web Application Framework for R. 2023. Available online: https://github.com/rstudio/shiny (accessed on 15 June 2023).
  51. Becker, W.; Saisana, M.; Paruolo, P.; Vandecasteele, I. Weights and Importance in Composite Indicators: Closing the Gap. Ecol. Indic. 2017, 80, 12–22. [Google Scholar] [CrossRef]
  52. Libório, M.P.; Ekel, P.Y.; de Abreu, J.F.; Laudares, S. Factors That Most Expose Countries to COVID-19: A Composite Indicators-Based Approach. GeoJournal 2022, 87, 5435–5449. [Google Scholar] [CrossRef]
Figure 1. Study area. The map shows the total number of COVID-19 cases per district in Austria at the end of 2021.
Sustainability 16 00078 g001
Figure 2. Adapted risk and vulnerability framework (modified from [14]).
Sustainability 16 00078 g002
Figure 3. Screenshot of the developed web map, which was created in German. On the left side, detailed information for a selected municipality is illustrated to offer a better understanding of vulnerability. On the right side, the weights for the single categories can be adjusted, and the vulnerability index will be calculated accordingly. Further information about the data and the underlying method is provided through the information buttons and the data explorer window.
Sustainability 16 00078 g003
Figure 4. Socio-economic vulnerability to influenza diseases in municipalities in Austria. Figure 4 represents the VI for individual municipalities in Austria. The three pie charts show examples of how different single categories influence the VI. These graphs can be created for each municipality to better understand the underlying vulnerable factors and identify vulnerable groups.
Sustainability 16 00078 g004
Figure 5. Domains of socio-economic vulnerability per municipality in Austria as a percentage. The share of the contribution of the different domains to vulnerability is shown. A high contribution indicates a higher vulnerability.
Sustainability 16 00078 g005
Figure 6. Socio-economic vulnerability to vector diseases in municipalities in Austria. Figure 6 represents the VI for individual municipalities in Austria. The three pie charts show examples of how different single categories influence the VI. These graphs can be created for each municipality to better understand the underlying vulnerable factors and identify vulnerable groups.
Sustainability 16 00078 g006
Figure 7. Number of COVID-19 cases [%] per district normalized by the number of inhabitants. The temporal-spatial percentage change in the number of COVID-19 cases per district (continuous color schema: blue to purple) in comparison to the calculated VI (continuous color schema: white to red) from February 2020 to February 2021 is shown. The difference in the color schema from February 2020 to August 2020 and from February 2020 to February 2021 arises due to the low number of total cases at the beginning of the pandemic in 2020. To better visualize the outbreak and spreading of COVID-19, the color scheme was shifted.
Sustainability 16 00078 g007
Figure 8. Number of deaths by COVID-19 [%] per district normalized by the number of inhabitants. The temporal-spatial percentage change in the number of deaths by COVID-19 per district (continuous color schema: white to blue) in comparison to the calculated VI (continuous color schema: white to red) from February 2020 to February 2021 is shown.
Sustainability 16 00078 g008
Figure 9. Pearson correlation coefficient between VI and COVID-19. A moderate correlation can be observed from December 2020 onward, with a significance level slightly above 5%.
Sustainability 16 00078 g009
Figure 10. Correlation coefficient between the categories and the VI. Figure 9 shows the Pearson correlation coefficient (p) for influenza (blue) and vector-borne (red) diseases per category.
Sustainability 16 00078 g010
Figure 11. Uncertainty analysis showing the difference in the mean VI by removing indicators. The difference in the mean modified VI is shown. On the x-axis, the removed indicator is listed, and on the x-axis, the difference in the mean VI for the whole of Austria compared to the original VI is shown. Red indicates an increase in the mean VI, grey a decrease in the mean VI, and black no change.
Sustainability 16 00078 g011
Figure 12. Uncertainty analysis showing the modified VI (not normalized) by removing indicators. Box plots show the influence of the single indicators on the VI for both diseases. On the y-axis, the discarded indicator is listed, and on the x-axis, the resulting modified VI (not normalized). The blue line represents the mean original VI.
Sustainability 16 00078 g012
Disclaimer/Publisher’s Note: The statements, opinions and data contained in all publications are solely those of the individual author(s) and contributor(s) and not of MDPI and/or the editor(s). MDPI and/or the editor(s) disclaim responsibility for any injury to people or property resulting from any ideas, methods, instructions or products referred to in the content.

