Article

A Traceability Platform for Monitoring Environmental and Social Sustainability in the Textile and Clothing Value Chain: Towards a Digital Passport for Textiles and Clothing

1
Instituto Politécnico de Viana do Castelo, Praça General Barbosa 44, 4900-348 Viana do Castelo, Portugal
2
CITEVE—Centro Tecnológico das Indústrias Têxtil e do Vestuário, Rua Fernando Mesquita 2785, 4760-034 Vila Nova de Famalicão, Portugal
3
ALGORITMI Research Lab, Escola de Engenharia–Universidade do Minho, Campus de Azurém, 4800-058 Guimarães, Portugal
4
Centro de Computação Gráfica, Campus de Azurém, Edifício 14, 4800-058 Guimarães, Portugal
5
INFOS-Informática e Serviços S.A., Rua Veloso Salgado 971 1011, 4450-801 Leça da Palmeira, Portugal
*
Author to whom correspondence should be addressed.
Sustainability 2024, 16(1), 82; https://doi.org/10.3390/su16010082
Submission received: 8 November 2023 / Revised: 14 December 2023 / Accepted: 14 December 2023 / Published: 21 December 2023

Abstract

:
Textile and clothing is one of the most important industrial sectors, not only due to the significant number of jobs generated, but also because it addresses one of the people’s fundamental needs (clothing). It is, however, a sector with a huge global environmental impact, and also an important negative social impact, especially in developing countries. Sustainability in the textile and clothing value chain is a known issue, concerning both environmental and economic-social facets of sustainability. One way to improve sustainability in this sector is by measuring and monitoring the environmental, economic and social impacts of activities along the value chain and, ultimately, computing an environmental and circular score for each batch of textile and clothing product, and an economic and social score for each involved company, reflected in their products. The consumer will then have the opportunity and responsibility for selecting products with the least negative environmental, economic and social impact. This article aims to propose a decentralized traceability platform for the textile and clothing value chain, based on blockchain technology, for tracing textile product batches and activities, along the value chain, classifying them with a score, which measures their environmental and social impact. The environmental, economic and social impact scores are based on a set of proposed indicators. The results are assessed through two test scenarios, namely a face towel (home textile) and a T-shirt (clothing).

1. Introduction

The textile and clothing (T&C) sector is an important part of the European manufacturing industry, and it plays a crucial role in the general economic and social well-being. According to Euratex, in 2021 this industrial sector had more than 143,000 companies, employing 1.3 million people and generating a turnover of €147 billion, 56% from textiles and human-made fibers, and 44% from clothing. Italy, Germany, France, Spain and Portugal account for three quarters of European Union (EU) production in this sector [1].
The textile and clothing value chain, from the creation of raw materials to the creation of the final product, is long and very diversified in terms of the raw materials used. There are raw materials of different origins such as natural fibers, like cotton, linen, wool, silk, etc.; artificial fibers, like viscose, modal, etc.; and synthetic fibers, like polyester, nylon or acrylic. There are different industries associated with creating these different raw materials.
Regardless of the types of raw materials used, creating a textile or clothing item typically involves the following main activities [2,3]:
  • Spinning: A fiber processing technique where fibers undergo preparation, drafting, and twisting to transform them into yarn. During spinning, the fibers are drafted, or attenuated, to achieve consistent thickness, and simultaneously twisted to bind the fibers together, resulting in the formation of yarn;
  • Weaving: A method of fabric production in which two sets of yarns, known as the warp and weft, interlace with each other at right angles to form a woven fabric. These interlacements create a stable and structured fabric.
  • Knitting: A technique where loops of yarn are interlocked to create fabric. It involves manipulating a set of knitting needles or a knitting machine to form rows of interlocking loops.
  • Printing, dyeing, and finishing: Printing involves adding colors, patterns, or designs to fabrics, enhancing their visual appeal. Dyeing provides fabrics with vibrant and consistent colors while finishing treatments improve their appearance, texture, and performance.
  • Textile manufacturing: The process of transforming fabric into garments or textile products through cutting, sewing, and assembling. The final outcome is a completed garment or textile product ready for distribution or sale.
Each of these activities or steps in the value chain involves a series of industrial processes that are performed by different industry types and different companies, and impact the environment in different ways [4]. These companies may be located in places, and countries, that are far from each other, which leads to large displacements. In other words, products (raw materials, intermediate products, or final products) may travel many kilometers from the creation of the raw material to reaching the final consumer.
The fabric itself is sometimes made up of different types of yarn. For example, a fabric maybe composed of cotton, wool, polyester, nylon, etc. This increases the number of companies involved in the creation of a piece of textile or clothing and increases the complexity of the value chain.
Producing different raw materials causes different impacts on the environment, making some materials more harmful to the environment than others. In the end, creating a piece of textile or clothing can be more, or less, harmful to the environment [5].
With economy globalization, also in the textile and clothing sector, and the search for cheaper labor by the companies, products and by-products often travel many kilometers around the world. These transports usually have a great negative environmental impact.
With regard to the social factor, some companies treat their employees better than others. Some companies pay better wages, provide health insurance, fairer working hours, and other perks. Companies that give fewer perks to their employees normally produce cheaper products, achieving market advantages.
Consumers need, and deserve, to be informed about the social and environment impact of the piece of textile/clothing they are about to buy, in order to decide what to buy according to their conscience.
The need for safe and reliable information on the sustainability of textile products derives from the great impact that this sector has on the environment and on people’s lives, especially in developing countries with precarious social and working conditions and corruption. According to the Global Fashion Agenda 2019 Pulse of the Fashion Industry report, the industry’s social and environmental performance has improved, but the global fashion industry is still far from being considered sustainable. So, increasing the supply chain’s traceability and transparency is one of the priorities specified, in order to raise the degree of sustainability [6]. To promote this view, Fashion Revolution publishes an annual report on transparency in the fashion industry (Fashion Transparency Index), using a methodology to compare brands and taking into account five key areas: policy and commitments, governance, supply chain traceability, supplier assessment and remediation, as well as concerns like gender equality, decent work, tackling climate change, and responsible consumption and production [7]. According to this report, no brand (of the 200 included in the study) has transparency levels above 70%, while the great majority (90%) has transparency levels below 50%. Additionally, it shows that, of the five areas assessed, traceability has the lowest average score [7].
The European Commission is working on establishing sustainability principles and other appropriate ways to regulate multiple aspects of product life cycles to improve product durability, reusability, upgradability, and reparability, as well as addressing the presence of hazardous chemicals in products and increasing their energy and resource efficiency, as part of its Circular Economy Action Plan [8]. The Action Plan mentions “mobilising the potential of digitisation of product information, including solutions such as digital passports, tagging, and watermarks [8]. The Wuppertal Institute has released a wide definition of a digital product passport (DPP), defining it as a data collection that summarizes a product’s components, materials, and chemical compounds, as well as information on reparability, spare parts, and proper disposal instructions. The data contained in the DPP are collected from all phases of the product life cycle and can be utilized to optimize design, production, usage, and disposal [9,10]. In the context of this project, and in this article, the DPP is a tool that can be used to promote transparency and responsibility in the production of products, allowing consumers to obtain detailed information about what they are buying and how it has been produced. At the same time, it can also be used by companies that wish to demonstrate their commitment to sustainability and social responsibility. In this way, there is a need for a solution that can successfully provide value-chain-wide distributed traceability for tracing textile and clothing products [11]. Various indicators should be traced, such as resource consumption (e.g., water, energy) and pollutants emitted (e.g., CO 2 and other greenhouse gases, sewage), to know information about each one of the value chain activities [12].
This traceability platform should, then, provide its users, i.e., the value chain operators and end costumers, with environmental, economic and social indicators of each of the traced product batches and respective value chain activities (e.g., spinning, weaving, dyeing), enabling the environmental, economic and social scoring of every traced product batch. This way, it is possible to capture information from the primary production activities, all the way through each and every production activity of a T&C item, until its ultimate use, and even about its disposal or materials reuse, in a circular economy model [3].
The work presented in this article has been developed in the scope of the PPS1 parcelar project (“Sustainable and Circular Textile ID 4.0”) of the European mobilization project “STVgoDIGITAL: Digitization of the textile and clothing Value Chain” (http://www.stvgodigital.pt, accessed on 7 June 2023), which aims to encompass a set of research and development (R&D) initiatives, with the central involvement of companies in the textile and clothing sector, for fostering digital transition to the new paradigm of Industry 4.0, with an emphasis on information and communication technologies.
The rest of this article is structured as follows. The next section presents the research methodology. Then, Section 3 presents a brief survey of the related works and existing platforms for traceability in the textile and clothing value chain. In Section 4, the results of this research are presented, namely the environmental, economic and social indicators, traced by the proposed platform, and our proposal for a new blockchain-based platform for tracing environmental, economic and social indicators throughout the (T&C) value chain is also presented. We calculate a sustainability index for each textile product batch. Section 5 presents results and discusses limitations and challenges. And, finally, Section 6 draws conclusions and provides some guidelines for future work.

2. Research Methodology

Several works have highlighted the opportunity that digital transformation of supply chains offers for the advancement of the circular economy and the resolution of environmental challenges [13,14]. The lack of a traceability platform for the textile and clothing sector, assessing the environmental, economic and social impact of the textile and clothing items, is a research gap that hinders the ability of the final consumer to select a product with less negative impact, in environmental, economic or social terms, as well as the ability of any business partner, at any level of the value chain, to select its suppliers or batches of intermediate products/materials based on information about their respective environmental, economic or social impact.
The research methodology followed within this research work has been design science research (DSR). This methodology approaches the research for a solution to a previously identified problem through a building/evaluation loop [15]. This loop allows the researched solution to be adapted progressively as it is tested, through the creation of an artifact. This enables us to assess how the evolving artifact is suitable for solving the problem, being able to improve the artifact until reaching an adequate solution to the problem [16].
This research work is positioned within a sequence of research phases that include previous works from the same authors on which this research work is based. The goal of this research work (phase 3 in Figure 1) is to propose a traceability platform for tracing environmental, economic and social indicators of value chain activities, and of every final or intermediate product lot/batch.
In Figure 1, the research process followed can be seen. This approach has been designed to obtain, as a result, a proof of concept traceability platform for environmental, economic and social sustainability indicators in the (T&C) value chain.
In phase 1, the literature review has been carried out [3]. In phase 2, the analysis and modeling of a blockchain-based architecture and smart contract system prototype, capable of tracing environmental, economic and social indicators, has been made [12]. Phase 3, the objective of this article, is where the integrated proof of concept traceability platform is designed and developed. In this article, the design model of the proposed platform is presented, along with implemented features and experimentation of the traceability platform and integrated applications.

3. Related Work

Product traceability, or the ability to trace or monitor a product, is receiving special attention as a result of the globalization of supply chains, especially in the food supply chains for reasons related to public health. To ensure the authenticity of a product’s origin, prevent forgeries, and be able to assess a product’s environmental impact, the (T&C) value chain must also be able to trace products, i.e., knowing its origin, and knowing a set of attributes’ values related with its production and usage in producing other products, and related with its transportation. In previous work by some of this article’s authors, a state-of-the-art survey of the current approaches for traceability in the textile and clothing value chain has been presented [3]. A summary of the literature review about existing approaches to traceability in the (T&C) value chain is presented here, as well as some practical approaches available to the industry.

3.1. Literature Review

Existing solutions for traceability in the textile and clothing (T&C) value chain are compiled in Table 1 and summarized next.
In [17], Kumar et al. proposed a system based on a relational database management system (RDBMS) and extensible markup language (XML) to register information, with the purpose of tracing a textile item’s lifecycle within a value chain operator of the supply chain as well as more complex inter-actor value chains.
Agrawal et al. [18] suggested a traceability solution that relies on quick response (QR) code tags that are mapped with a secure code to add an extra layer of authenticity and verification to combat the industry’s susceptibility to fake goods. This is ideal for a circular economy (CE) model, provided that these tags last long enough until the user chooses to recycle.
Besides traditional supply chain management implementations, blockchain-based solutions have also been proposed to tackle the transparency issues identified in the (T&C) value chain. Blockchain is a decentralized, distributed, and immutable database of transactions that can be tracked and verified. It has been applied in a number of financial uses because of these distinctive qualities. To enhance transparency, and traceability in particular, there has been a shift toward exploring these uses in the context of supply chains [19]. Blockchain implementations can bring benefits in terms of decentralization, auditability, autonomy and transparency [3].
A blockchain-based traceability framework for the textile business sector has been proposed by Agrawal et al. [19]. The authors propose a distributed ledger configuration structural solution for applicability on their use case while maintaining data safety and trust among the value chain operators and securing interactions between operators.
In [20], Pérez et al. explore how the application of blockchain technology can aid in the authentication of participants in the (T&C) supply chain as well as the identification of goods’ sources. They came to the conclusion that the use of a permissioned and open distributed ledger to keep significant data from the transactions of the manufacturing processes would be advantageous for the ultimate aim of textile traceability, using a case study of a woman’s shirt.
The work of [21] integrates the use of blockchain with big data to enhance supply chain traceability and information sharing in the textile sector, a recurrent issue due to the global scale of the industry. It resulted in a solution that greatly reduces the risks associated with centralized information systems, and allows a more secure, distributed, transparent, and collaborative system by providing real-time information on the state of textile products to all participants in the supply chain.
In [22], the authors study the way German companies in the (T&C) sector are dealing with sustainability, how they are preparing for the transition to the CE and the role that digital technologies can play in that transition. The authors conclude that these technologies still need to be further explored and new approaches must be developed.
In the last row of Table 1, the STVgoDigital solution, proposed here, has been added for comparison with the surveyed related works. From the surveyed solutions for traceability in the T&C value chain, one can see that all enable tracing a product along the value chain, and most have IoT integration. However, only some of the solutions offer support for the circular economy, in the sense that they allow the traceability of products to continue after these are returned by the end customer for recycling. Some of the solutions focus on offering traceability information to the business players along the value chain (B2B), while most enable traceability information to reach the end costumer (B2B2C). None of the surveyed solutions allows the traceability of sustainability indicators, nor offers a measurement of the environmental and/or socio-economic impact.
The proposal presented in this article offers a new blockchain-based solution for traceability in the T&C value chain, with support for circular economy. Traceable information has batch-level granularity for measurements related to environmental impact and company-level granularity for measurements related to socioeconomic impact.
Table 1. Solutions for traceability in the T&C value chain (adapted and extended from [3]).
Technology UsedSupport for Circular EconomySupport for TraceabilityTraceability of Sustainability IndicatorsIoT IntegrationB2B/B2C AppsMeasurement of Environmental and/or Social-Economic ImpactReferences
Blockchain-based framework for supply chain traceabilityBlockchain--B2BNo[19]
A secured tag for implementation of traceability in textile and clothing supply chainQR Code and Data Server-B2B2CNo[18]
Developing a framework for traceability implementation in the textile supply chainRDBMS and XML--B2B2CNo[17]
Applying integrated blockchain and big data technologies to improve supply chain traceability and information sharing in the textile sectorBlockchain and big data---B2BNo[21]
Traceability of ready-to-wear clothing through blockchain technologyPermissioned blockchain-B2B2CNo[20]
STVgoDigital proposalPermissioned blockchainB2B2CYes

3.2. Solutions from the Industry

There are already several industrial practical solutions for the traceability and transparency of the T&C value chain, some of which (the most significant) are presented next. The first two solutions are initiatives developed to establish a standard for the DPP of a garment. CIRPASS (https://cirpassproject.eu/, accessed on 12 July 2023) has been developed to establish a standard for the DPP of a garment. In order to lay the foundations for the digital product passport that will be proposed by the European Commission, the digital product passport Ecosystem (CIRPASS) has been set up to prepare the ground for pilot projects and the gradual implementation of the digital product passport, aligned with the requirements of the Ecodesign for Sustainable Products Regulation.
The French initiative (https://www.ecologie.gouv.fr/encadrement-des-allegations-environnementales-et-information-du-consommateur-sur-produits, accessed on 12 July 2023) is also working on the DPP of a garment. In this way, and according to Article 13 I of the law on the fight against waste and the circular economy (https://www.legifrance.gouv.fr/jorf/article_jo/JORFARTI000041553778, accessed on 12 July 2023), which was published on 10 February 2020, the harmonization, framing and specification of a series of environmental claims is envisaged.
The BCome (https://bcome.biz/, accessed on) project is designed to enable textile and garment companies to build responsible supply chains and assure transparency from the production process to the final customer.
The Circular.Fashion initiative (https://circular.fashion/en/, accessed on 12 July 2023) has been developed with the main purpose of increasing the number of recycled fabrics in the next few years. This initiative currently has a diverse set of awards, a significant number of partners, and a wide range of operations, such as circular business models, recycling process management, and software development.
EON (https://www.eon.xyz/, accessed on 12 July 2023) is a joint initiative by several European companies and organizations to create a digital product passport. The DPP can be used to offer precise information on a product’s environmental and social effects. The DPP is designed to increase transparency and traceability throughout the supply chain by allowing stakeholders to track a product’s path from its origin until its disposal.
TextileGenesis (https://textilegenesis.com/, accessed on 12 July 2023) is another DPP initiative aimed at boosting transparency and traceability in the textile business. The TextileGenesis digital product passport intends to provide complete information on a product’s journey across the supply chain, including information about materials used, manufacturing processes, and environmental and social effects.
The TRICK project (https://www.trick-project.eu/, accessed on 12 July 2023) is an EU-funded initiative aimed at developing a DPP for textile items, and provides information about a product’s environmental impact and sustainability throughout its existence.
In addition to the aforementioned initiatives, and to accelerate sustainable transformation within global brands, the TrustTrace (https://trustrace.com/, accessed on 12 July 2023) initiative has been put into practice. The TrustTrace initiative empowers brands and suppliers to collaborate on the digital traceability of products and materials. The technology used in this initiative is based on IoT and artificial intelligence, to streamline data collection, and enables connections with existing supply chain solutions via OpenAPI (https://www.openapis.org, accessed on 7 June 2023).
In Table 2, the different existing solutions are classified in several aspects. The first two solutions in the table are initiatives developed to establish a standard for the DPP of a piece of textile or clothing. The table compares digital product passport initiatives with regard to the treatment, or not, of several factors. The main factors addressed in the comparison are explained next.
Data Carrier Tag: 
Data carrier type refers to the tag that interconnects the physical product and the digital product. There are numerous product ID technologies available, including one-dimensional barcodes, QR codes, radio frequency identification (RFID), and near field communications (NFC). QR codes are two-dimensional codes that can be scanned with smartphones to convey product information. RFID uses radio waves to identify and monitor products in real time. Barcodes are also commonly used for product identification, with each product being issued a unique barcode that can be scanned using a barcode reader. NFC technology enables wireless data transfer between compatible devices.
Traceability: 
The type of data that the platform is able to trace along the value chain. Environmental and circular and real and/or estimated data can provide information about a product’s environmental score (environmental and circular score (ECS)). Social and economic data can provide information about a company’s social and economic score (economic and social score (ESS)). These four dimensions (environmental, circular, social, economic) can comprise real or estimated values, such as, for the environmental dimension, water and energy consumption, effluent production, CO2e production and other environmental indicators, and life cycle assessment (LCA) indicators; for the circularity indicators, the percentage of recycled content, recyclability of products, and design for circularity and durability; for the economic dimension, company certifications, financial data, profitability and investments; for the social dimension, if workers’ rights are respected, if workers are justly paid and have safety at work, and community involvement.
Data Storage: 
-
Centralized: The practice of storing all data in one centralized location, such as a data center or a cloud server. Centralized storage makes it easier to scale up storage capacity as needed and ensures that all users have access to the same data, eliminating the need for duplicate copies of data to be stored in multiple locations. However, there are also potential drawbacks to centralized storage, e.g., the risk of data loss or corruption if the central storage location fails.
-
Decentralized: Decentralized data storage spreads data across numerous locations, such as the cloud or different servers. This makes it more resistant to system faults and increases data accessibility. However, because the data are dispersed, the data might be more difficult to manage and safeguard, requiring more complicated management systems.
All the existing digital product passport initiatives for T&C items offer a way of tracing textile products along the supply chain. From the surveyed industrial solutions, one can conclude that none of the solutions offer an easy way for the end customer to understand the global sustainability factor of a textile piece, as a sustainability score could do.
The STVgoDigital platform, proposed herein, has been added as the last row of the comparison Table 2. The proposed solution has as main objective the development of an innovative approach for textile products traceability that is enhanced with products’ identity (product ID), focusing on the clothing and home textile sectors, to make it more transparent, traceable, and circular. One of the main aspects is to enable the collection of indicators that make it possible to calculate the sustainability index (environmental and social) of a textile product. This index will provide the end customer with information to choose more sustainable T&C pieces when purchasing them.

4. Results

4.1. Environmental, Circular, economic and social Indicators

To provide a clearer and quantitative measurement of the total environmental, economic and social impact of every textile product throughout its production lifecycle, the STVgoDigital approach proposes the provision of a sustainability index. This index is based on a simple and visual scale according to the total score, which ranges from A to F, with the following distribution:
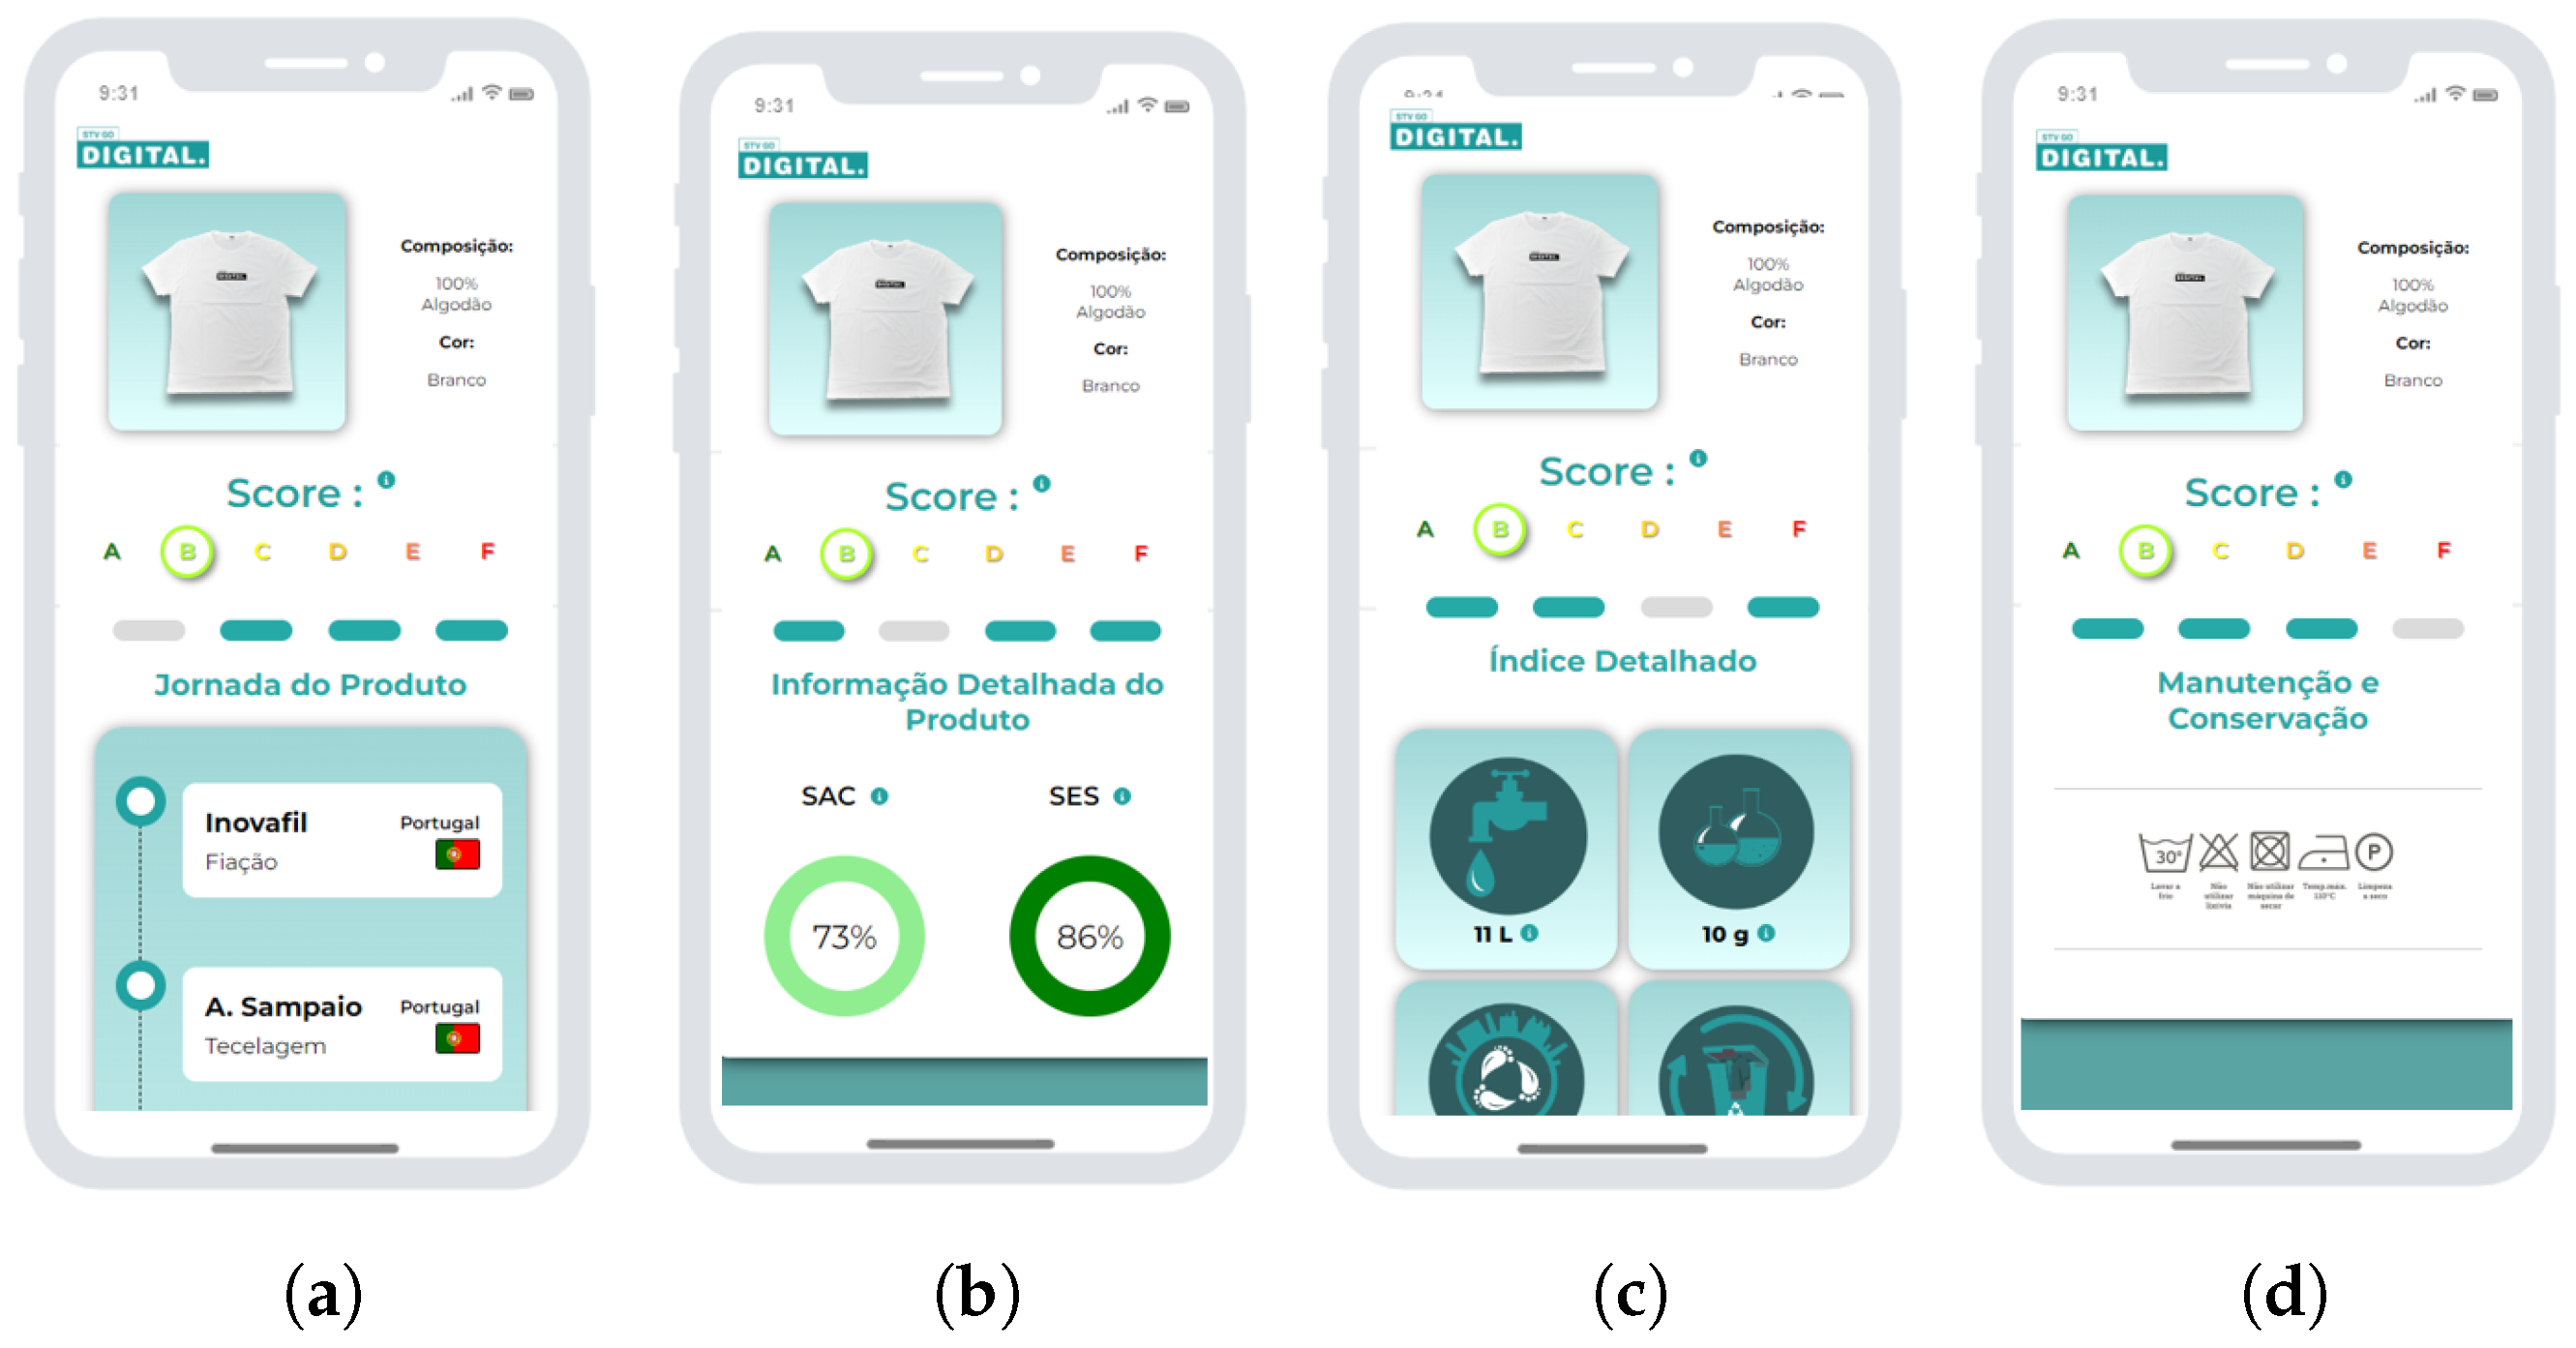
  • A: greater than 85%;
  • B: between 75% and 85%;
  • C: between 65% and 75%;
  • D: between 55% and 65%;
  • E: between 45% and 55%;
  • F: lower than 45%.
This index helps the consumer to easily visualize the overall impact of the desired product and therefore raise awareness for sustainability and promote more sustainable and ethical practices among their purchasing habits, while also empowering consumers to make more informed and responsible choices.
The sustainability index considers two different scores, the environmental and circular score (ECS), and the economic and social score (ESS). Together, these scores enable the calculation of the total sustainability index, which allows the analysis of the product performance in terms of environmental, economic and social sustainability.
Each of these two scores individually groups data values of indicators collected along the production activities in the textile value chain.
The ECS score addresses environmental and circular aspects of the product batch being traced, and the ESS score addresses the economic and social aspects of the company engaged in that specific industrial activity.
After a brainstorming session between researchers and industrial technicians, a list of several possible indicators with potential environmental or economic-social impact has been drawn up. Then, the final indicators were selected primarily based on the potential impact on the overall score (i.e., indicators with the highest impact were selected, while indicators with residual impact were discarded), relevance to the specific score (ECS or ESS) and the ease of obtaining real data rather than estimated data.
Data used to calculate these indicator scores are collected from the various stakeholders throughout the T&C value chain. Furthermore, each score refers to different levels of information, with the ECS score being specific to a particular product/batch and the gathered data provided whenever a batch is produced, whereas the ESS score refers to a specific company and must be updated annually.
Since the ECS indicator score is specific to the product/batch being produced, the data collected is related to a wide range of activities, such as logistics activities, like transportation, and productive activities like spinning, weaving, dyeing, finishing, and textile/clothing manufacturing. For instance, the environmental footprint of each logistic activity is estimated based on the means of transport used (e.g., airplane, train, container ship, etc.), the distance, and environmental data from known LCA databases that consider the estimated consumption of each type of transport. LCA provides a tool for assessment of the environmental impact of a product along its entire life cycle or value chain, with the potential for identifying the most efficient measures in a product’s life cycle for reducing its environmental impact [23]. Similarly, productive activities are assessed based on the consumption of water, energy and chemicals, the generation of liquid effluents and solid waste, and the product estimated durability assessed by quality control tests. The full list of indicators considered is presented in Table 3. After collecting all the data, each of these variables is suitably normalized and combined into a data model to create indicators that can be used effectively to analyze the environmental impact of these activities. For each of the selected indicator the first step was to normalize the values and define the goal function, to be maximized or minimized. For example, regarding water consumption, the total amount of used water, in m 3 , was registered for a specific batch. This amount was normalized to vary between (−1) and (+1) taking into account the typical values for that production step in the value chain, where these values will correspond to our goal, depending on the used function. In this particular case, we want to minimize the water consumption, and therefore, (−1) was set as our goal, whereas in the case of recycled water (the second indicator for ECS), we want to maximize this function, so our goal is set at (+1).
The ESS indicator score, on the other hand, is derived from economic and social parameters of the engaged companies in the value chain, such as the number of employees, their salaries and differences in salaries, age, type of employment contracts, work schedules and training, as well as the company’s economic situation, certifications, and social initiatives. The full list of indicators considered is depicted in Table 4. After the collection of the data, and similarly to the ECS indicator process, these variables are also normalized and combined using a predetermined model scale, in order to calculate the ESS indicator score.
Overall, the ECS and ESS scores provide a comprehensive method to evaluate the environmental and social sustainability of textile products. By calculating the total sustainability index using these indicator scores, it is possible to determine the performance of a textile product in terms of sustainability and identify areas for improvement in the textile value chain.
In the rest of this section, the proposed platform architecture is presented in Section 4.2. Then, the platform’s domain entities model is presented in Section 4.3. Also, some notes on the developed smart contract (Section 4.4) and off-chain backend and application programming interface (API) (Section 4.5) are given.

4.2. Architecture of the Proposed Solution for Traceability in the T&C Value Chain

The proposed solution provides traceability features that allow tracing the previously presented environmental and social indicators/scores along the T&C value chain. The solution for the traceability problem includes the use of Hyperledger Fabric, which is an open-source consortium-oriented digital ledger platform [28]. Being consortium-oriented, it is a permissioned network that enables the definition of different participant profiles, which respond to different needs in a value chain context. This means that authorization profiles need to be defined for the platform users to access the network and take part in transactions.
Figure 2 illustrates the different components that integrate the architecture of the proposed traceability platform, and the way they interact with each other. From top to bottom, one can see that enterprise resource planning (ERP) applications, from value chain’s business partners, integration portals, and other third-party applications (e.g., Internet of Things (IoT) agents, mobile apps) integrate with the traceability backend services through an integration layer API. A user interacts with these types of front-end applications (view layer), which make a request to the API. Subsequently, the following actions may occur:
  • A security layer, represented by the blue arrow in Figure 2, ensures that the user is authenticated and has authorization to perform the intended operations;
  • Data insertion operations are put into a message queue (message layer in Figure 2), to be handled sequentially by the business layer, which calls the smart contract’s/chaincode’s methods for inserting traceability data onto the blockchain;
  • Data query operations are directly sent to the business layer, which calls the chaincode’s methods for querying traceability data from the blockchain;
  • The chaincode, which is installed on every non-orderer peer and channel, directly reads, writes or deletes the assets represented as documents on the CouchDB key-value-based database (Hyperledger Fabric’s World State database). This database contains the world state, meaning the latest and up-to-date representation of the items of the blockchain network’s ledger;
  • If the transaction consensus is reached, the ledger and the world state database update themselves (if this was an invoke/put transaction). Query/get transactions do not need consensus approval.

4.3. On-Chain and Off-Chain Data Models

The traceability platform data model is divided into two parts: on-chain data (stored in a blockchain) and off-chain data (stored in a relational database). On-chain data refer to the core traceability data and are persisted in the Hyperledger Fabric distributed ledger. This includes information on each product’s lot/batch environmental and social scores, the activities with environmental, economic and/or social impact, and its relation to other products’ batches. The on-chain data model is presented in Section 4.3.1. The off-chain data refer to the non-traceability data, including the production unit that produced a product batch, and the registration of all the measurements of each activity’s environmental, economic and social indicators, stored in a relational database. These measurements are used for computing the social and environmental scores stored in the blockchain. The off-chain data model is presented in Section 4.3.2.

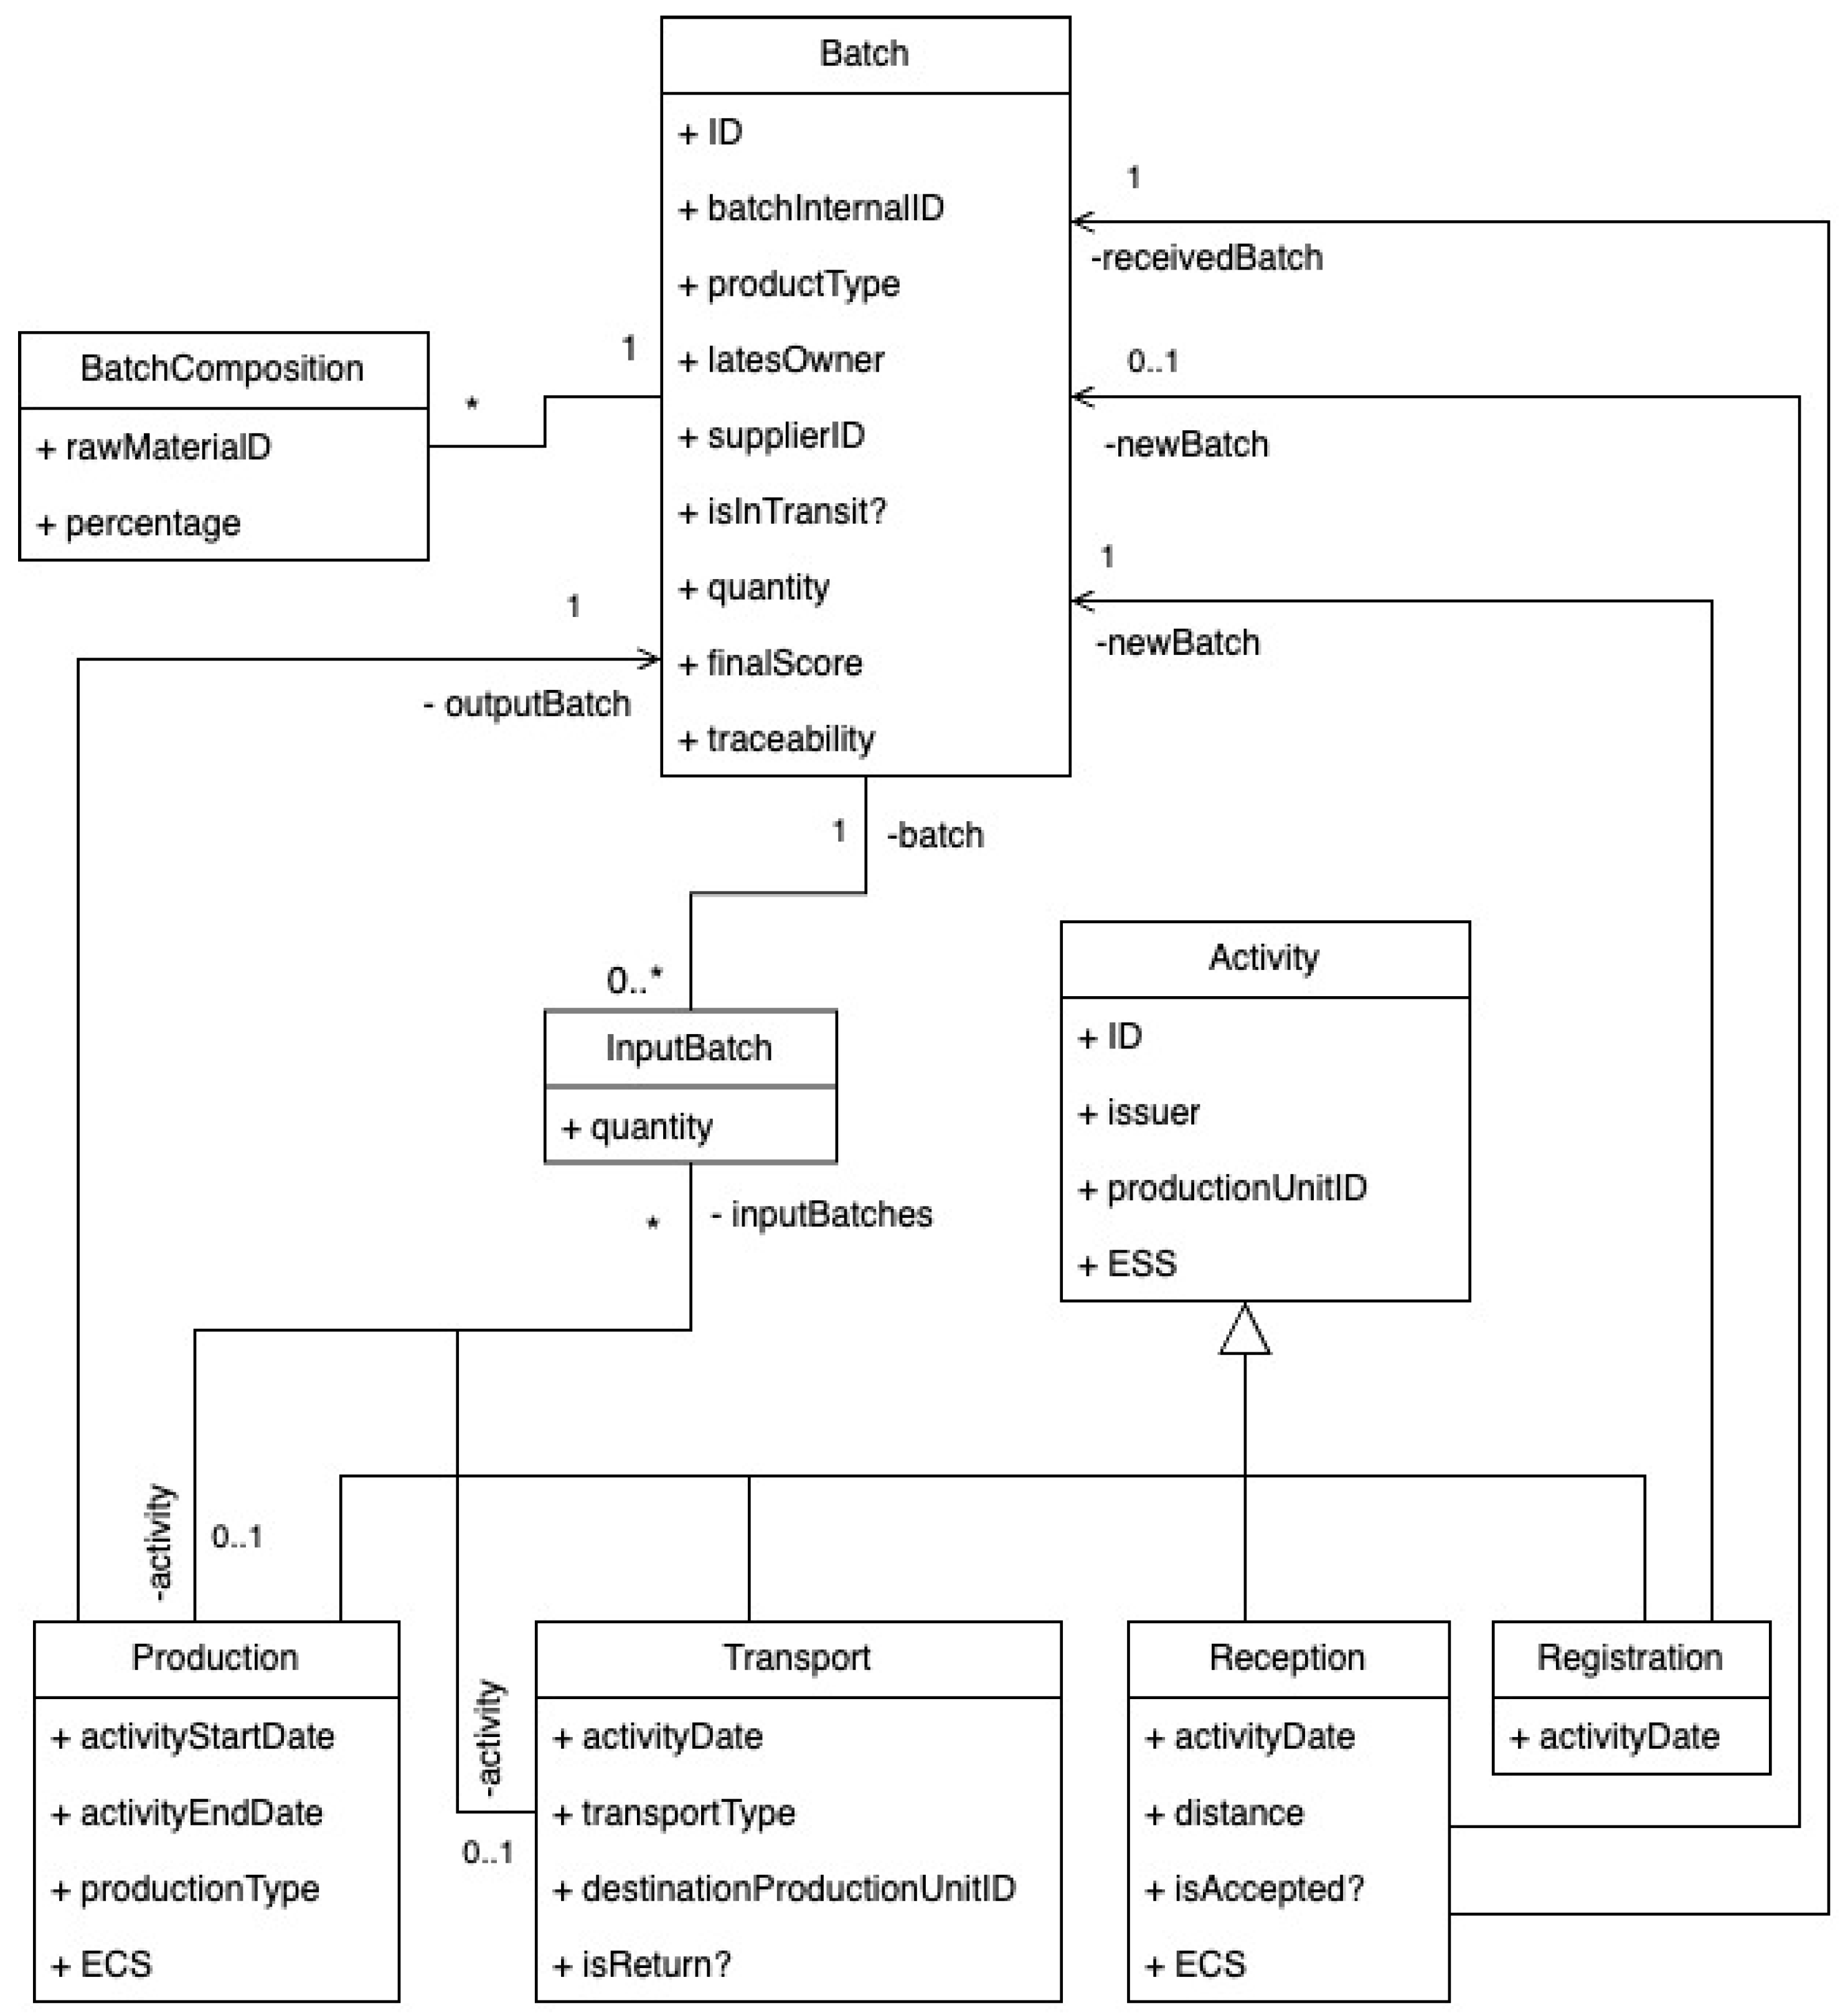
4.3.1. On-Chain Data

Figure 3 represents the (on-chain) data model, corresponding to the data structures to be persisted in the blockchain.
The main entity to consider is Batch, the digital representation of a product lot or batch in the value chain. Other entities have been defined to model each product batch’s activities (Activity) within the value chain, with activity type granularity, resulting in the definition of Registration, Production, Transport and Reception.
Some attributes are identifiers of other entities that are off-chain (e.g., productionUnitID), which identifies the production unit that is endorsing the activity transactions that the issuer is invoking. Here is a more detailed explanation of the on-chain data entities:
  • Batch: The main asset to be tracked on which the value chain operations work on. The batch definition contains an identification of its (productType). A batch has attributes to reference off-chain entities, such as the production unit that owns it, supplier and internal batch identifiers, for referencing a batch within the scope of a single company-productionUnitID, supplierID and batchInternalID, respectively. The attribute finalScore is what holds the final score and ranks the batch sustainability claims. The calculations to reach the final score of the batch are made off-chain by other modules of the system, registering on-chain just the final value, inside the batch entity. The boolean attribute isInTransit, with a default value of false upon batch creation, helps to truthfully represent the batch’s current owner state when it is being transported between production units. Lastly, the attribute Traceability will append the activities’ “objects” for each activity that a batch goes through, resulting in a recursive collection of activities and its input/output batches throughout the value chain activities until it reaches the current instance of a batch. Visually, a batch traceability’s representation results in an inverted tree, where the root is the current batch and the straight branches are activities with no aggregation.
  • BatchComposition: The information about what materials and their percentages constitute a given batch (e.g., {cotton: 50%, polyester: 50%}). MaterialID references the off-chain entity RawMaterial.
  • Activity: A value chain activity. It is executed by a production unit of a company, which has a given economic-social score (ESS). The ESS assesses the company level relative to its social impact on its workers and operators. An activity may be of one of four types (Registration, Production, Transport, or Reception).
  • Registration: An activity used when a production unit wants to register a batch that is created outside of the developed system. This may be used to register a batch of raw material, not resulting from a production activity, that needs to enter the value chain traceability system to be used as an input batch for production activities.
  • Production: An activity that consumes input batch(es) and creates a batch, making it the only activity that can converge the history of one or more batches’ with a new batch, by using them as Input Batches. For timing purposes, activityStartDate and activityEndDate represent the start and finish date and times of the production activity. Finally, ECS is a value of the computed environmental-circular score that assesses the sustainability level of the batch, until this point in the value chain.
  • Transport: An activity used to register the transportation of a batch to another participant in the value chain. To support this functionality, this entity has an off-chain identifier (ID) for specifying the origin and destination for the transport (roductionUnitID and destinationProductionUnitID, respectively). Even though a transportation may carry more than a single batch, the transaction on-chain to log the transport activity only registers one batch per activity. The reasoning behind this decision is to decouple the batches’ traceability in the shipment from each other, maintaining a reliable tracking and tracing of each batch. Other attributes of this entity include predefined data related to its transportation type (transportType) and traveling distance (distance). A boolean isReturn attribute with a default value of false is also present to indicate if the shipment is a return transport in case the destination production unit rejects the batch upon receiving it (more in Reception activity below). Lastly, activityDate logs the timestamp of departure. The date and time of arrival are only registered when receiving the batch, leading to a Reception activity.
  • Reception: An activity issued upon the arrival of batches to a production unit. This activity is required after a transport activity because the transported batch should be properly received and its quality assessed, to continue through the value chain. ECS score of the transportation is only registered, in the reception activity, upon reception of the transported batches.

4.3.2. Off-Chain Data

In this architecture, the off-chain database is a relational database composed of thirty-four tables. For simplicity, only the main entities are depicted in the off-chain domain model in Figure 4. This model’s data, which add to the data that are stored on the blockchain, serve as a starting point to calculate the identified environmental and social indicators.
There are five main data entities, which reference relevant on-chain entities:
  • Company, which is a company that performs value chain activities;
  • Logistics activity, which corresponds to transportation between two production units;
  • Registration activity, which models a registration of a new batch from outside the traceability system;
  • Production activity, which corresponds to a value chain activity, such as spinning, weaving, dyeing, etc.;
  • Batch, corresponding to a product batch created and handled by the identified value chain activities.
These entities add detail to the information persisted in the on-chain entities with the same name. This detail includes the individual values of the environmental and social indicators used to calculate the environmental and social scores registered in the blockchain. The entities where the values from these calculations are stored are:
  • ESS_score, which stores the calculated economic and social score (ESS) for a company/year;
  • SocialEconIndAttValue, which stores values of a company’s economic and social indicator (c.f. Table 4) for calculating the ESS;
  • SocialEconAttValue, which stores other values of a company’s data;
  • company_certification, which stores a company’s certificates yielded by a certifying entity;
  • EvironIndAttValue, which stores temporary values of an activity’s environmental indicator (c.f. Table 3);
  • FinalEnvIndAttValue, which stores the final/end values of an activity’s environmental indicator (c.f. Table 3);

4.4. Smart Contract/Chaincode

To operate the previously presented on-chain data model, a set of chaincode transaction methods have been defined to support the desired traceability functionality for the platform. The code available for the repository of this developed solution is available in https://github.com/lcvalves/stvgd-chaincode (accessed on 30 June 2023). Table 5 presents these methods, which mainly support the management of the batch activities that happen on the T&C value chain, as well as reading a batch’s information and traceability data. Some arguments are automatically filled, especially those with information regarding the production unit calling the transaction method, as well as the score’s data. Other methods need data to be manually inserted such as batches’ information, quantities and other information regarding the activity.
Referring to Table 5, the asterisk symbol (*) in the output batches of Transport and Reception indicates that the batch has an optional cardinality. On transport activities, when the batch to be shipped is not entirely used, it creates a “leftover” batch with the remaining quantity kept in the used one. On reception activities, if the production unit rejects the batch it does not refactor its IDs; therefore, it does not need to create a new batch for that refactoring process. As stated, on both transport and reception activities, the creation of an output batch is entirely dependent on the activity’s arguments, hence the optional cardinality. The double asterisk (**) in Table 5 indicates the presence of the boolean attributes of isReturn and isAccepted in both automatic and manual arguments in Transport and Reception activities, respectively. This happens due to the arguments having an automatic default value of false, which can be manually set to true. Hence, both attributes are in the two columns, for automatic and manual attributes, in Table 5.

4.5. Backend, API and User Applications

For integrating on-chain and off-chain data, and providing applicational business logic through services for frontend applications, such as the companies’ ERPs and the integration Web platform, a backend component with a REST API has been developed.
The proposed traceability platform has been designed to be used along the textile and clothing value chain, giving consumers access to the traceability information and sustainability index of textile products at the moment of purchase, also giving traceability and sustainability information about every intermediate product to every business partner along the value chain. This enables any user to be aware of the socio-economic and environmental impact associated with a textile product’s manufacturing and transportation along the value chain, and to know every company that has been directly or indirectly involved in that textile product’s production and transportation, including each company’s socio-economic and environmental responsibility score. Moreover, the system also contains information about the textile product composition and components, thereby facilitating the tasks of properly disposing of the item and assisting with recycling sorting, simplifying the process to identify the best recycling method for a given textile product.
To have this functionality available to every business player in the value chain, a set of front-end applications has been developed.
Business players, both industrial and logistics, along the T&C value chain typically use ERP software for managing their daily business activities, such as accounting, procurement, production, and supply chain operations, among other activities. The integration of ERP software of the T&C business players with the traceability platform will simplify and streamline the registration of traceability information on the platform.
Overall, the integration brings advantages to companies using integrated ERPs, since data are automatically sent to the STVgoDigital platform, thus avoiding the sharing of delayed data, errors, and penalties from the platform with manual data inputs, mainly concerning the consumption of energy, water, etc., which are used in a product’s production.
In order to create an inclusive platform, one that allows companies with non-integrated ERPs to integrate their data with the traceability platform, a Web portal has been created. The created Web portal provides an alternative solution for companies in the textile supply chain who lack access to an integrated ERP or other type of organizational application.
Overall, the Web portal offers a practical and cost-effective solution for textile value chain companies that want to join this traceability system and improve their sustainability and ethical production practices, but lack the resources to implement or acquire an organizational application. The web portal makes use of a data validator that issues warnings on specific parameters that appear to be out of context, adding this additional layer to validate the data that is provided.
Other integration solutions may be developed in the future, as the backend API is available for new software integrations.

5. Analysis and Discussion of Results

To assess and validate the STVgoDigital prototyped system, a set of validation tests has been performed.
Two test scenarios have been designed, one focusing on an article of clothing, with a horizontally partitioned supply chain, and another one focusing on an article of home textiles, with a vertical supply chain. For each test scenario, two items were considered, one with a light color and one with a dark color, to understand the system’s flexibility in evaluating two comparable products with different colors, which should result in different environmental performances. These test scenarios have been developed as part of a pilot project with Portuguese textile companies. The fact that only Portuguese companies have participated in the test scenarios should not affect global results, as the participating companies encompass all the productive activities associated with the production of a textile product.

5.1. Test Scenario 1: A Home Textile Product (Towel)

In the first test scenario, the focus of the pilot test was a home textile product, resulting from a vertical supply chain. This means that all productive activities, from spinning to manufacturing, passing through weaving and dyeing, were carried out by the same company. Because the supply chain is vertical, and all productive activities are performed within the same company, there are no logistical activities between the various productive activities. Furthermore, the granularity studied is at the batch level, implying that the processing and analysis are being performed on a collection of textile products (batch) that originated from the same productive activities, rather than on individual items.
For these tests, the measured indicators for computing the ESS and ECS started on the spinning activity; hence, the consumptions associated with the cultivation/production of the raw material were estimated according to defined LCA databases. As a result, the company only needed to specify each raw material associated with the textile product, as well as the origin of the raw material, for the system to input the consumption of the cultivation/production of the raw material considered to the textile article performance. Following this activity, data were gathered across the various productive activities associated with the creation of the home textile product, encompassing all activities from spinning and weaving, to dyeing, finishing and manufacturing the textile product. Following this collection of data, the company needed to specify to which customer the batch was sent in order to complete the data collection process and input the consumption of this logistical activity to the textile product performance.
Following the completion of the data gathering, it was possible to aggregate the data into a comprehensible manner, allowing the consumer to access the information by scanning a QR code, enabling the consumer to make a more conscious and responsible purchase.
The analysis of the case study created for the home textile product can be further detailed by referring to Figure 5 and Figure 6, which present a set of the consumer app screens (in Portuguese). In Figure 5, screens related to the light-colored towel are shown. In Figure 5a, it is possible to see the textile product’s composition and color, as well as its environmental score. It is also possible to see the product batch’s journey along the supply chain, which in this case has been inside the same company. This journey has all the activities and intermediate batches for the production of this final product batch. In Figure 5b, one can assess the environmental and circular score (ECS) and environmental and social score (ESS) indicators. In Figure 5c, the specific consumptions for producing this final product’s batch are revealed, namely water consumption, chemicals consumption, percentage of generated and recovered waste and CO 2 footprint. In Figure 5d, one can see the maintenance and care instructions for the textile product.
In addition, in this case study, a pilot test was developed to analyze the performance of a dark-colored towel, compared with a light-colored towel. Thus, in Figure 6, it is possible to analyze the data related to the dark-colored towel. The images in Figure 6 correspond to the same images in Figure 5 for the white-colored towels.

5.2. Test Scenario 2: A Garment (T-Shirt)

In the second test scenario, the focus was on a clothing product and its underlying supply chain. In this case, the supply chain is partitioned, so each productive activity is developed by a different company.
The gathering of data for this case study begins with the company that does the spinning process by registering, in the traceability platform, the raw material associated with the textile product, as well as the origin of the raw material. After registering the lot for the raw material, this company registered a production activity (“Spinning”) together with the required data for characterizing the environmental performance of its production activity. The registration of the production activity in the traceability platform demands, as explained before, the identification of all input batches and the produced output batch.
Since this pilot’s supply chain is partitioned, upon completing the production activity, the company sends the batch of yarn produced to a customer or business partner downstream in the value chain. This leaves a trace on the traceability platform in the form of a transport activity registration. For registering the transport activity, the company identifies where the batch is dispatched and how it is transported.
When receiving the batch of yarn, the next company in the value chain registers a Reception activity in the platform. When registering the reception, the company may modify the Batch reference, eventually creating a new batch with the same or less quantity as the received batch.
This company, responsible for the knitting process, has then registered a new production activity (“Knitting”) along with the required environmental indicators of its production activity. Once again, registering the production activity requires the identification of all input batches and of the output batch of fabric produced.
This process has been repeated for the knitting, dyeing and finishing, and manufacturing production activities, bearing in mind that each time that the batch was transported from one company to another, the company responsible for ensuring the transport needed to specify where the batch was sent to, as well as its means of transportation.
To finalize the data registration process in the traceability platform, the last company in the supply chain responsible for the manufacturing production activity needed to specify to which customer the batch was being sent and input the consumption of this logistical activity to the textile product performance.
At any time in the described process, it was possible to access the data through the scanning of a QR code with the batch reference, enabling any business partner to trace any intermediate product batch.
In the end, with all traceability information registered in the platform, the end consumer could also trace the final product batch, enabling them to make a more conscious and responsible purchase.
It is possible to better understand the way the data has been aggregated and presented to the consumer, for the light-colored T-shirt, in Figure 7, and for the dark-colored T-shirt, in Figure 8. In each figure, in image (a) it is possible to see the product’s composition and color, and its environmental score, together with its journey along the supply chain. This journey shows the activities and companies involved in producing all intermediate batches for the production of this final product batch. Image (b) shows the ECS and ESS indicators. Image (c) shows the specific consumptions for producing this final product’s batch, namely water consumption, chemicals consumption, percentage of generated and recovered waste and CO2 footprint. Image (d) shows the maintenance and care instructions for the textile product.
These case study scenarios have shown how the developed system meets the functional and technological requirements of the textile ecosystem regarding the registration and exchange of traceability and sustainability information throughout the whole supply chain. The system performed equally well for both test scenarios considered, whether with a vertical or a partitioned supply chain.
The way the data are presented in the mobile application enables the user to know the traceability chain and environmental and socio-economic scores of each product batch (respectively, SAC and SES indicators in Figure 7 and Figure 8). In the case of the end consumer, this information provides data on the environmental impact of their choice when purchasing a textile product and, over time, also increases consumer awareness regarding the environmental impact of producing a textile product in general, helping to create awareness of the need to progress towards a circular economy in this sector.
In the clothing case study, the consumer can clearly perceive that the dark-colored T-shirt has a worse sustainability score than the light-colored T-shirt, as well as much more consumption regarding water and chemicals (Figure 7c and Figure 8c).
In addition, the consumer may also access the product’s maintenance and care instructions, as well as its composition, which could be seen as an opportunity to replace the compulsory physical tags with this information.

6. Conclusions and Future Work

With a global value chain, as is the T&C, it is important to ensure that environment and workers are being given the attention and respect they require while maintaining the company’s economic health. Monitoring environmental and socio-economic indicators throughout the global T&C value chain is a challenging topic, as it involves several companies from different countries. Keeping this information in an independent platform shared by all stakeholders in the value chain, but not controlled by any of them individually, is essential for enabling a trustable and transparent traceability of product batches along the value chain.
In this article, the main results of the subproject PPS1 of the STVgoDigital project have been presented. This project’s main goal was to design and prototype a platform for allowing traceability along the textile and clothing value chain, monitoring a set of indicators for computing the environmental and socio-economic score of every product batch. This traceability platform should also enable to monitor how and where each company and activity impacts on those indicators, and on the final score for a given product batch.
The created platform uses blockchain technology, namely Hyperledger Fabric, as a way to decentralize and share the collected information. Only the information needed to trace a product batch is stored in the blockchain (mostly codes and scores). Other detailing information is stored in a relational database.
To demonstrate the platform, two case studies have been developed, together with several Portuguese textile companies. From these two case studies, one may say that the created platform is able to collect environmental, circular, economic and social indicators covering all activities and companies in the textile supply chain. It also allows the calculation of a sustainability index and improves the traceability and transparency through the value chain, from the spinning mill to the final product.
This project, and its results, are especially relevant and useful for the following:
  • Providing environmental and social traceability information for every business partner in the value chain: The platform enables any industry or logistics company in the value chain, through their ERP/MRP applications integrated with the platform, to know the origin and monitored indicators values of any product batch, when it was manufactured, stored, transported, who was responsible for each activity, and which previous product batches have been used in producing that batch. This enables any business partner in the T&C value chain to make informed choices when buying from their suppliers.
  • Providing traceability information to the end customer: The platform allows assessing the environmental impact of every product batch, and the socio-economic impact of every company. This enables every end costumer to know when, where and how the final product that is for sale in a retail store has impacted the environment, and how the involved companies support social welfare. This enables the end costumer to make an informed selection of T&C products.
Besides enabling traceability and adding transparency to a global value chain, the data collected and stored by this platform will enable an analysis of environmental and social indicator trends.
Some limitations of the developed system prototype still exist. Mainly, the system does not consider that different products are expected to have different consumptions, and therefore different environmental performances, so the sustainability score should address the corresponding type of product. This can be seen in the home textile case study (first test case scenario), where two batches of towels were produced, and although the dark-colored towel had a higher environmental impact, the sustainability score was still the same for the light-colored towel, which reveals a need to consider the different type of products associated with the textile industry. This problem does not have to do with the traceability platform itself, but with the way the scores are computed.
For future work, we intend to apply this system to a circular supply chain, involving sorting and recycling companies. This would allow determining if and how this platform could be also applicable to stakeholders operating on upcycling activities in a circular economy setting. Another topic for future work is to further adapt ERP and MRP applications, used by industries in the value chain, for feeding the platform with traceability information.
Other future work will be to determine the deterioration of the platform performance, with the increase in the number of blockchain transactions. The chaincode design uses a traceability attribute that increases in size when augmenting the number of activities on one product batch. Future work will also align the proposed traceability platform with the guidelines proposed by the European Commission regarding the digital product passport.

Author Contributions

Conceptualization, M.S. (Miguel Sá), E.F.C. and A.M.R.d.C.; methodology, A.M.R.d.C.; software, L.A. and T.A.; validation, A.M.R.d.C., J.O. and M.S. (Manuel Santos); formal analysis, A.M.R.d.C.; investigation, L.A., M.S. (Miguel Sá), E.F.C. and A.M.R.d.C.; resources, J.O. and M.S. (Miguel Sá); writing—original draft preparation, L.A., M.S. (Miguel Sá), E.F.C., M.A. and A.M.R.d.C.; writing—review and editing, E.F.C. and A.M.R.d.C.; supervision, J.O., M.S. (Manuel Santos) and A.M.R.d.C. All authors have read and agreed to the published version of the manuscript.

Funding

This work has been partially developed within the scope of the project “STVgoDigital: Digitalização da Cadeia de Valor do Setor Têxtil e Vestuário”, specifically in its PPS1, with reference POCI-01-0247-FEDER-046086, financed by the European Regional Development Fund (ERDF), through the Competitiveness and Internationalization Operational Program (COMPETE 2020), and partially within the scope of the project “BE@T: Bioeconomia Sustentável fileira Têxtil e Vestuário-Medida 1”, financed by the “Recovery and Resilience Plan” (PRR), through of measure TC-C12-i01 of the Environmental Fund.

Institutional Review Board Statement

Not applicable.

Informed Consent Statement

Not applicable.

Data Availability Statement

No new data were created or analyzed in this study. Data sharing is not applicable to this article.

Conflicts of Interest

Author Marcelo Alves was employed by the company INFOS-Informática e Serviços S.A. The remaining authors declare that the research was conducted in the absence of any commercial or financial relationships that could be construed as a potential conflict of interest.

Abbreviations

The following abbreviations are used in this manuscript:
APIApplication programming interface
ATPTextile and Clothing Association of Portugal
BLLBusiness logic layer
CACertificate authority
CECircular economy
CLICommand line interface
CRUDCreate, retrieve, update and delete
DPPDigital product passport
DSRDesign science research
ECSEnvironmental and circular score
ERDFEuropean Regional Development Fund
ERPEnterprise resource planning
ESSEconomic and social score
EUEuropean Union
IDIdentifier
IoTInternet of Things
LCALife cycle assessment
NFCNear field communications
RESTRepresentational state transfer
R&DResearch and development
RDBMSRelational database management system
QRQuick response
RFIDRadio frequency identification
T&CTextile and clothing
XMLExtensible markup language

References

  1. EURATEX, Economic and Statistics. FACTS and KEY FIGURES 2022 OF THE EUROPEAN TEXTILE AND CLOTHING INDUSTRY, 2022. August Update. Available online: https://euratex.eu/wp-content/uploads/EURATEX_FactsKey_Figures_2022rev-1.pdf (accessed on 27 April 2023).
  2. Cura, K.; Sheenam, J.; Niinimäki, K. Transparency and Traceability in the Textile Value Chain; Technical Report; Aalto University: Espoo, Finland, 2022. [Google Scholar]
  3. Alves, L.; Ferreira Cruz, E.; Lopes, S.I.; Faria, P.M.; Rosado da Cruz, A.M. Towards circular economy in the textiles and clothing value chain through blockchain technology and IoT: A review. Waste Manag. Res. 2022, 40, 3–23. [Google Scholar] [CrossRef] [PubMed]
  4. Toprak, T.; Anis, P. Textile industry’s environmental effects and approaching cleaner production and sustainability, an overview. J. Text. Eng. Fash. Technol. 2017, 2, 429–442. [Google Scholar] [CrossRef]
  5. Ramesh, M.; Deepa, C.; Kumar, L.R.; Sanjay, M.; Siengchin, S. Life-cycle and environmental impact assessments on processing of plant fibres and its bio-composites: A critical review. J. Ind. Text. 2022, 51, 5518S–5542S. [Google Scholar] [CrossRef]
  6. Lehmann, M.; Arici, D.; Boger, E.; Martinez-Pardo, A.; Krueger, N.; Schneider, L.; Carrière-Pradal, M.; Schou, K. Pulse of the Fashion Industry. Report, 2019. Global Fashion Agenda, Boston Consulting Group, and Sustainable Apparel Coalition. Available online: https://www.bcg.com/2019-pulse-of-the-fashion-industry (accessed on 30 April 2023).
  7. Fashion Revolution. Fashion Transparency Index; 2022 edition; Fashion Revolution: London, UK, 2022; Available online: https://www.fashionrevolution.org/about/transparency/ (accessed on 30 April 2023).
  8. European Comission. A New Circular Economy Action Plan For a Cleaner and More Competitive Europe. 2020. Available online: https://eur-lex.europa.eu/legal-content/EN/TXT/?qid=1583933814386&uri=COM:2020:98:FIN (accessed on 27 April 2023).
  9. Götz, T.; Adisorn, T.; Tholen, L. Der Digitale Produktpass als Politik-Konzept; Technical Report; Wuppertal Institut für Klima, Umwelt, Energie: Wuppertal, Germany, 2021. [Google Scholar] [CrossRef]
  10. Götz, T.; Adisorn, T.; Tholen, L. Towards a Digital Product Passport Fit for Contributing to a Circular Economy. Energies 2021, 14, 2289. [Google Scholar] [CrossRef]
  11. Huang, S.; Wang, G.; Yan, Y.; Fang, X. Blockchain-based data management for digital twin of product. J. Manuf. Syst. 2020, 54, 361–371. [Google Scholar] [CrossRef]
  12. Alves, L.; Cruz, E.F.; Rosado Da Cruz, A.M. Tracing Sustainability Indicators in the Textile and Clothing Value Chain using Blockchain Technology. In Proceedings of the 2022 17th Iberian Conference on Information Systems and Technologies (CISTI), Madrid, Spain, 22–25 June 2022; pp. 1–7. [Google Scholar] [CrossRef]
  13. Nguyen, K.; Akbari, M.; Quang, H.T.; McDonald, S.; Hoang, T.H.; Yap, T.L.; George, M. Navigating Environmental Challenges through Supply Chain Quality Management 4.0 in Circular Economy: A Comprehensive Review. Sustainability 2023, 15, 16720. [Google Scholar] [CrossRef]
  14. Akbari, M. Revolutionizing supply chain and circular economy with edge computing: Systematic review, research themes and future directions. Manag. Decis. 2023. ahead-of-print. [Google Scholar] [CrossRef]
  15. Peffers, K.; Tuunanen, T.; Gengler, C.E.; Rossi, M.; Hui, W.; Virtanen, V.; Bragge, J. Design Science Research Process: A Model for Producing and Presenting Information Systems Research. arXiv 2020, arXiv:2006.02763. [Google Scholar]
  16. Baskerville, R. What design science is not. Eur. J. Inf. Syst. 2008, 17, 441–443. [Google Scholar] [CrossRef]
  17. Kumar, V.; Hallqvist, C.; Ekwall, D. Developing a Framework for Traceability Implementation in the Textile Supply Chain. Systems 2017, 5, 33. [Google Scholar] [CrossRef]
  18. Agrawal, T.K.; Koehl, L.; Campagne, C. A secured tag for implementation of traceability in textile and clothing supply chain. Int. J. Adv. Manuf. Technol. 2018, 99, 2563–2577. [Google Scholar] [CrossRef]
  19. Agrawal, T.K.; Kumar, V.; Pal, R.; Wang, L.; Chen, Y. Blockchain-based Framework for Supply Chain Traceability: A Case Example of Textile and Clothing Industry. Comput. Ind. Eng. 2021, 154, 107130. [Google Scholar] [CrossRef]
  20. Bullón Pérez, J.J.; Queiruga-Dios, A.; Gayoso Martínez, V.; Martín del Rey, Á. Traceability of Ready-to-Wear Clothing through Blockchain Technology. Sustainability 2020, 12, 7491. [Google Scholar] [CrossRef]
  21. Hader, M.; Tchoffa, D.; Mhamedi, A.E.; Ghodous, P.; Dolgui, A.; Abouabdellah, A. Applying integrated Blockchain and Big Data technologies to improve supply chain traceability and information sharing in the textile sector. J. Ind. Inf. Integr. 2022, 28, 100345. [Google Scholar] [CrossRef]
  22. Wiegand, T.; Wynn, M. Sustainability, the Circular Economy and Digitalisation in the German Textile and Clothing Industry. Sustainability 2023, 15, 9111. [Google Scholar] [CrossRef]
  23. Dahllöf, L. Life Cycle Assessment (LCA) applied in the Textile Sector: The Usefulness, Limitations and Methodological Problems—A Literature Review; Technical Report, Environmental Systems Analysis; Chalmers Tekniska Högskola: Göteborg, Sweden, 2003. [Google Scholar]
  24. ISO 105-C06:2010. Available online: https://www.iso.org/standard/51276.html (accessed on 19 June 2023).
  25. ISO 105-B02:2014. Available online: https://www.iso.org/standard/65209.html (accessed on 19 June 2023).
  26. ISO 12945-2:2020. Available online: https://www.iso.org/standard/75375.html (accessed on 19 June 2023).
  27. ISO 12947-2:2016. Available online: https://www.iso.org/standard/61058.html (accessed on 19 June 2023).
  28. Androulaki, E.; Barger, A.; Bortnikov, V.; Cachin, C.; Christidis, K.; De Caro, A.; Enyeart, D.; Ferris, C.; Laventman, G.; Manevich, Y.; et al. Hyperledger Fabric: A Distributed Operating System for Permissioned Blockchains. In Proceedings of the Thirteenth EuroSys Conference; Association for Computing Machinery: New York, NY, USA, 2018. [Google Scholar] [CrossRef]
Figure 1. Research design.
Sustainability 16 00082 g001
Figure 2. STVgoDigital Traceability Platform architecture.
Sustainability 16 00082 g002
Figure 3. On-chain domain model. The asterisk in a relation between entity classes means a multiple relation. Diagram uses UML notation (https://www.omg.org/spec/UML/2.5.1/, accessed on 8 May 2023).
Sustainability 16 00082 g003
Figure 4. Main entities of the off-chain domain model. The asterisk in a relation between entity classes means a multiple relation. Diagram uses UML notation (https://www.omg.org/spec/UML/2.5.1/, accessed on 8 May 2023).
Sustainability 16 00082 g004
Figure 5. Consumer application depicting traceability and other product information for the home textile value chain—white color towel. (a) White towel app product journey; (b) White towel app detailed information about the product; (c) White towel app detailed index; (d) White towel app maintenance and preservation.
Sustainability 16 00082 g005
Figure 6. Consumer application depicting traceability and other product information, for the home textile value chain—dark-colored towel. (a) Dark towel app product journey; (b) dark towel app detailed information about the product; (c) Dark towel app detailed index; (d) Dark towel app maintenance and preservation.
Sustainability 16 00082 g006
Figure 7. Consumer application depicting traceability and other product information for the clothing value chain—white-colored T-shirt. (a) White T-shirt app product journey; (b) White T-shirt app detailed information about the product; (c) White T-shirt app detailed index; (d) White T-shirt app maintenance and preservation.
Sustainability 16 00082 g007
Figure 8. Consumer application depicting traceability and other product information for the clothing value chain—dark-colored T-shirt. (a) Dark T-shirt app product journey; (b) Dark T-shirt app detailed information about the product; (c) Dark T-shirt app detailed index; (d) Dark T-shirt app maintenance and preservation.
Sustainability 16 00082 g008
Table 2. Comparison of different digital product passport solutions.
SolutionData Carrier TagTraceabilityData Storage
Barcodes(s)RFIDNFCProduct (ECS)Company (ESS)Sustainability
Score
CentralizedDecentralized
EnvironmentalCircularSocialEconomic
CIRPASSQR------
French Initiative-------
BComeQR-------
circular.fashionQR--
EON1D + QR--
TextileGenesis1D + QR-------
TRICKQR-----
TrusTraceQR-----
STVgoDigitalQR-
Table 3. Environmental and circular Indicators considered for computing the environmental and circular score (ECS).
DataDescription
Water consumptionWater consumption for the product under evaluation, per batch
Quantity of recycled waterQuantity of recycled water, per batch
Electricity consumption, totalElectricity consumption for the product under evaluation, per batch
Renewable electricity billAnnual average of the amount indicated in the monthly electricity bills and/or established in the contract
Self-consumption of renewable energyTotal consumption of own renewable electricity for the product under evaluation, per batch, as a percentage
Natural gas consumptionConsumption of natural gas for the product under evaluation, per batch
Steam consumptionSteam consumption for the product under evaluation, per batch
Steam pressureVapor pressure (gauge) of the acquired vapor
Hot water consumptionHot water consumption for the product under evaluation, per batch
Hot water consumptionAverage temperature of hot water acquired
Consumption of thick fuel oilConsumption of thick fuel oil for the product under evaluation, per batch
Biomass consumptionBiomass consumption for the product under evaluation, per batch
Coal consumptionCoal consumption for the product under evaluation, per batch
Consumption of other types of energyConsumption of another type of energy for the product under evaluation, per batch
Diesel consumptionDiesel consumption for the product under evaluation
Gasoline consumptionGasoline consumption for the product under evaluation
Liquid petroleum gas (LPG) consumptionConsumption of propane gas for the product under evaluation, per batch
Consumption of chemicalsConsumption of chemicals for the product under evaluation, per batch
Quantity of recovered chemicalsConsumption of recovered chemicals, for the product under evaluation, per batch
Quantity of non-hazardous chemicalsConsumption of non-hazardous chemicals for the product under evaluation, per batch
SVHC quantity in productsSVHC consumption for the product under evaluation, per batch
Wastewater volumeWastewater volume for the product under evaluation, per batch
COD concentrationAnnual average of chemical oxygen demand (COD) concentration based on liquid effluent characterization reports
BOD5 concentrationAnnual average of biochemical oxygen demand (BOD5) concentration based on liquid effluent characterization reports
TSS concentrationAnnual average of total suspended solids (TSS) concentration based on liquid effluent characterization reports
Quantity of solid wasteTotal amount of solid waste generated for the product under evaluation, per batch
Quantity of textile wasteQuantity of textile waste generated for the product under evaluation, per batch
Quantity of non-hazardous wasteQuantity of non-hazardous waste generated for the product under evaluation, per batch
Quantity of recovered wasteQuantity of total waste valued for the product under evaluation, per batch
Quantity of valued textilesQuantity of textiles valued for the product under evaluation, per batch
Quality control to color changingColor fastness to washing–color changing (ISO 105 C06) [24]
Quality control to stainingcolor fastness to washing–staining (ISO 105 C06) [24]
Quality control to artificial lightcolor fastness to artificial light (EN ISO 105 B02) [25]
Quality control to pilling resistancePilling resistance of the woven fabrics (EN ISO 12945-2) [26]
Quality control to abrasion resistanceAbrasion resistance of the woven fabrics (EN ISO 12947-2) [27]
Table 4. Economic and social indicators considered for computing the economic and social score (ESS).
DataDescription
Total number of employeesPaid and unpaid persons employed by the company
Total number of womenWomen at the service of the company
Total number of menMen at the service of the company
Number of women in functions other than top managementEmployees who perform functions other than top management
Number of men in functions other than top managementEmployees who perform functions other than top management
Number of women in top managementNumber of women with positions in the administration and/or direction of the company
Number of men in top managementNumber of men with positions in the administration and/or direction of the company
Average salary of women in roles other than top managementAverage salary of female employees who perform functions other than top management
Average salary of men in positions other than top managementAverage salary of male employees who perform functions other than top management
Average salary for women in top managementAverage salary of female employees with positions in the administration and/or direction of the company
Average salary for men in top managementAverage salary of male employees with positions in the administration and/or direction of the company
Lowest monthly salary (interpretative)Lowest gross monthly remuneration, after removing the lowest 5%
Higher monthly salary (interpretative)Highest gross monthly remuneration, after removing the top 5%
Number of employees with fixed-term contractsCount of employees with fixed-term contracts
Number of employees with open-ended contractsCount of employees with open-ended contracts
Age of the youngest employeeThe age of the youngest employee in the company
Average number of weekly hours worked/employeeThe average number of weekly hours worked per employee
Number of training hours/total number of employeesThe total number of training hours per the total number of employees
Percentage of company profit distributed to social institutionsThe percentage of company profit that is distributed to social institutions
Financial autonomyValue resulting from the operation: (Equity/Assets)×100
EBITDAEarnings before interest, taxes, depreciation and amortization
SolvencyValue resulting from the operation: (Equity/Liabilities)×100
CertificationsCertifications that the company holds (e.g., GOTS, GRS, STEP)
Table 5. Contract transaction methods.
Transaction
Method
  DescriptionAutomatic
Arguments
Manual
Arguments
Output
CreateRegistrationCreates a Registration activityid,issuer,
productionUnitID,
activityDate
newBatchregistration,
batch
  ReadRegistrationReads a Registration activity by id-idregistration
midrule   CreateProductionCreates a Production activityid,issuer,
productionUnitID,
activityStartDate,
activityEndDate,
productionScore,ses
inputBatches,
outputBatch,
productionType
production,
batch
  ReadProductionReads a Production activity by id-idproduction
  CreateTransportCreates a Transport activityid,issuer,
originProductionUnitID,
activityDate,
isReturn **
transportType,
destinationProductionUnitID,
inputBatch,
isReturn **
transport,
batch *
  ReadTransportReads a Transport activity by id-idtransport
  CreateReceptionCreates a Reception activityid,issuer,
productionUnitID,
isAccepted **,
activityDate,
transportScore,ses
receivedBatch,
newBatch,
isAccepted **,
distance
reception,
batch *
  ReadReceptionReads a Reception activity by id-idreception
  ReadBatchReads a Batch by id-idbatch
  TraceBatchByInternalIDLists the batch and its activities,
as well as its previous
traceable batches’ activities
-batchInternalIDbatch.Traceability
* argument dependent; ** activity dependent
Disclaimer/Publisher’s Note: The statements, opinions and data contained in all publications are solely those of the individual author(s) and contributor(s) and not of MDPI and/or the editor(s). MDPI and/or the editor(s) disclaim responsibility for any injury to people or property resulting from any ideas, methods, instructions or products referred to in the content.

