Abstract
In order to achieve sustainable development, China has proposed to “strive to peak carbon dioxide emissions by 2030 and strive to achieve carbon neutrality by 2060”. Virtual power plants (VPPs) are an effective means to achieve carbon neutrality goals. In order to improve the economy and low-carbon performance of virtual power plants, this paper proposes a low-carbon economic optimization dispatching model considering the combined operation of oxygen-enriched combustion (OEC) and electricity-to-ammonia (P2A). Firstly, the mechanism of the combined operation of OEC and P2A is proposed. The oxygen-enriched combustion technology can reduce the carbon emissions of the system and enhance the flexibility of the system operation; P2A can effectively consume renewable energy and improve the energy utilization rate. The by-product of the P2A process, oxygen, is the raw material needed for oxygen-enriched combustion, which reflects the complementary nature of the OEC and P2A.Then, an optimal dispatching model is established with the objective function of minimizing the total cost. Finally, the validity of the proposed model is verified by comparing and analyzing the simulation results of five different models. After the introduction of the combined operation of OEC and P2A, the total cost of the system decreases by 10.95%, and the carbon emission decreases by 34.79%.
1. Introduction
The emission of greenhouse gases (mainly carbon dioxide) leads to global warming, which seriously threatens the survival and sustainable development of human beings [1]. In recent years, the penetration of renewable energy has been increasing to reduce fossil energy consumption and carbon emissions. Virtual power plants (VPPs) with low-carbon potential are an effective way to improve renewable energy consumption and rationalize the reallocation of resources. With the help of advanced network communication technology, VPP can effectively integrate distributed energy resources in different scopes and effectively realize cooperative and optimized management among units, thus obtaining a good operation economy. Compared with microgrids, VPPs can combine and match various resources within a large geographic area; microgrids are usually traded only in the form of retail distribution, while VPPs can build bridges to the wholesale market; and microgrids are faced with legal and political barriers, whereas VPPs can be implemented on the basis of an existing structure and statutory tariffs [2,3,4]. So far, the VPP model has been developed in many countries, such as Australia, Germany, and Canada, and the potential of this model can be seen in [5,6,7,8].
Carbon capture and storage (CCS) technology can effectively reduce the carbon emissions of the system [9]. Oxygen-enriched combustion (OEC) technology has the characteristics of low energy consumption, high carbon capture, and a strong regulating ability, which is a breakthrough for the flexibility and low-carbonization of virtual power plants [10]. OEC is based on the existing boiler system of coal power units and the introduction of oxygen to obtain a high concentration of CO2 flue gas to participate in the cycle, which is able to realize low-cost CO2 sequestration [11,12], thus realizing carbon emission reduction. In Ref. [13], it is pointed out that the energy consumption of oxygen-enriched combustion can be reduced by 35% compared with the post-combustion carbon capture method, which proves the potential of the low-carbon and economic operation of oxygen-enriched combustion technology. Ref. [14] introduced OEC into the integrated energy system of electricity–gas–heat and established a low-carbon economic dispatch model, which showed that, at the same level of maximum carbon capture, the cost and carbon emissions of the integrated energy system of a power plant with oxygen-enriched combustion is 1.21% and 7.52% less than that of a power plant with post-combustion capture, which proves that the former is better able to balance the economy and low-carbon performance. However, this model fails to fully utilize the oxygen produced during natural gas production. Ref. [15] proposed a coupled OEC-P2G model in which the P2G process provides high-purity oxygen to the OEC plant to expand the oxygen source, and the OEC plant provides the reaction feedstock for the P2G plant, with the actual carbon emission at only 35.08% of the carbon allowance. However, natural gas is not a zero-carbon fuel, and the carbon dioxide produced from its combustion still requires specialized treatment.
Due to the strong volatility and intermittency of renewable energy, the system needs to be equipped with high-capacity energy storage devices to ensure the stability and economy of the system [16]. Currently, the response time of pumped storage for large-scale applications cannot meet the demand of the power system, while electrochemical energy storage, although the corresponding time can meet the demand, is still insufficient in its capacity as well as the duration of discharge [17,18], and with the large-scale access to wind power, theoretically, there is a need for inter-seasonal long-time energy storage [19].
Hydrogen, due to its high energy density, is considered a promising option [20]. However, it has high transportation and storage costs due to its low density and high flammability. Meanwhile, ammonia has high density and low flammability, which makes it an attractive option for energy storage [21]. Power-to-ammonia (P2A) technology is an effective way to solve the high cost of hydrogen storage and transportation and to realize the large-scale storage of renewable energy by converting electric energy into ammonia for storage through ammonia synthesis after using the electrolysis of water to produce hydrogen and the separation of air to produce nitrogen.
Ref. [22] proposed a novel integrated solar ammonia synthesis and fuel cell system with an overall energy efficiency of about 16.44% to 16.67% throughout the year and an overall energy efficiency of about 15.68% to 15.83%, and the developed system has the advantages of high energy density and longer storage time compared to other energy storage methods. In Ref. [23], a multi-timescale model for the synergistic optimization of decarbonization operation and seasonal sequestration of a coal-fired power plant with green-ammonia co-combustion was developed, and the simulation results showed that the overall efficiency of ammonia combustion was about 13.92%, and ammonia–coal co-combustion technology could effectively reduce the carbon emissions of CFPP. However, the model did not introduce carbon capture technology, and there was still room to reduce carbon emissions. In ref. [24] considering the load regulation characteristics of hydrogen production and the ammonia synthesis process, a multi-stage dispatchable region (MSDR) method based on dynamic planning and computational geometry theory is proposed to visualize the flexible load regulation potential of P2A system based on wind and solar energy and lay a theoretical foundation for its participation in power load-side regulation. Ref. [25] addresses the problem of energy abandonment in wind–solar complementary integrated energy systems with high wind penetration and proposes the use of a combination of P2A and ammonia–coal co-firing in thermal power units to improve the wind-solar utilization rate, which reduces the total cost of the system by 1.74% and carbon emissions by 2.81%. However, the model does not consider carbon capture technology and does not utilize the oxygen produced in the P2A process. Ref. [26] constructs a framework for an integrated P2A technology multi-energy hub (MEH) powered by renewable energy sources, which can effectively reduce the operating costs and carbon emissions of the proposed MEH by cooperatively managing coupled multi-energy in the MEH, with the operating costs decreasing by 14.28% and carbon emissions decreasing by 3.87%. Ref. [27] establishes a full life-cycle cost analysis of ammonia-doped combustion, and the feasibility of this methodology is significantly improved when low-cost green power obtained from wind and light abandonment is used in a green-ammonia co-firing system. In regions with high carbon taxes or low renewable energy costs, the levelized cost of electricity from a low-cost green ammonia co-firing system is lower than that of a thermal power plant equipped with a carbon capture and storage (CCS) unit. It demonstrates the great potential of P2A technology. However, this study did not consider the complementary nature of the P2A system with oxygen-enriched combustion capture technology and failed to investigate their combined operation.
In summary, there is no research to construct the OEC-P2A combined operation system and study its coupling effect. Oxygen-enriched combustion capture technology can effectively capture carbon dioxide produced by coal-fired power plants and reduce carbon emissions. OEC and P2A can increase the consumption of new energy and reduce the loss of wind and solar energy. The main by-product of the P2A process is oxygen, which is the raw material required for the operation of the OEC plant, and OEC and P2A have a good complementary effect.
In this study, a low-carbon economic dispatch model of a virtual power plant based on the combined operation of oxygen-enriched combustion (OEC) and power to ammonia (P2A) is constructed to improve the economic and low-carbon performance of the system. The oxygen-enriched combustion model is introduced to analyze the operation mechanism of OEC and the regulatory role of the CCS and air separation unit (ASU) on the net output of OEC power plants. The P2A model, including the chemical reaction process and mathematical modeling, is introduced. The objective function of minimizing the total operating cost of the system is used, and the constraints on the energy balance of the system and the operating range of each unit are determined. Finally, the simulation results are compared and analyzed to verify the validity of the model proposed in this paper.
2. Materials and Methods
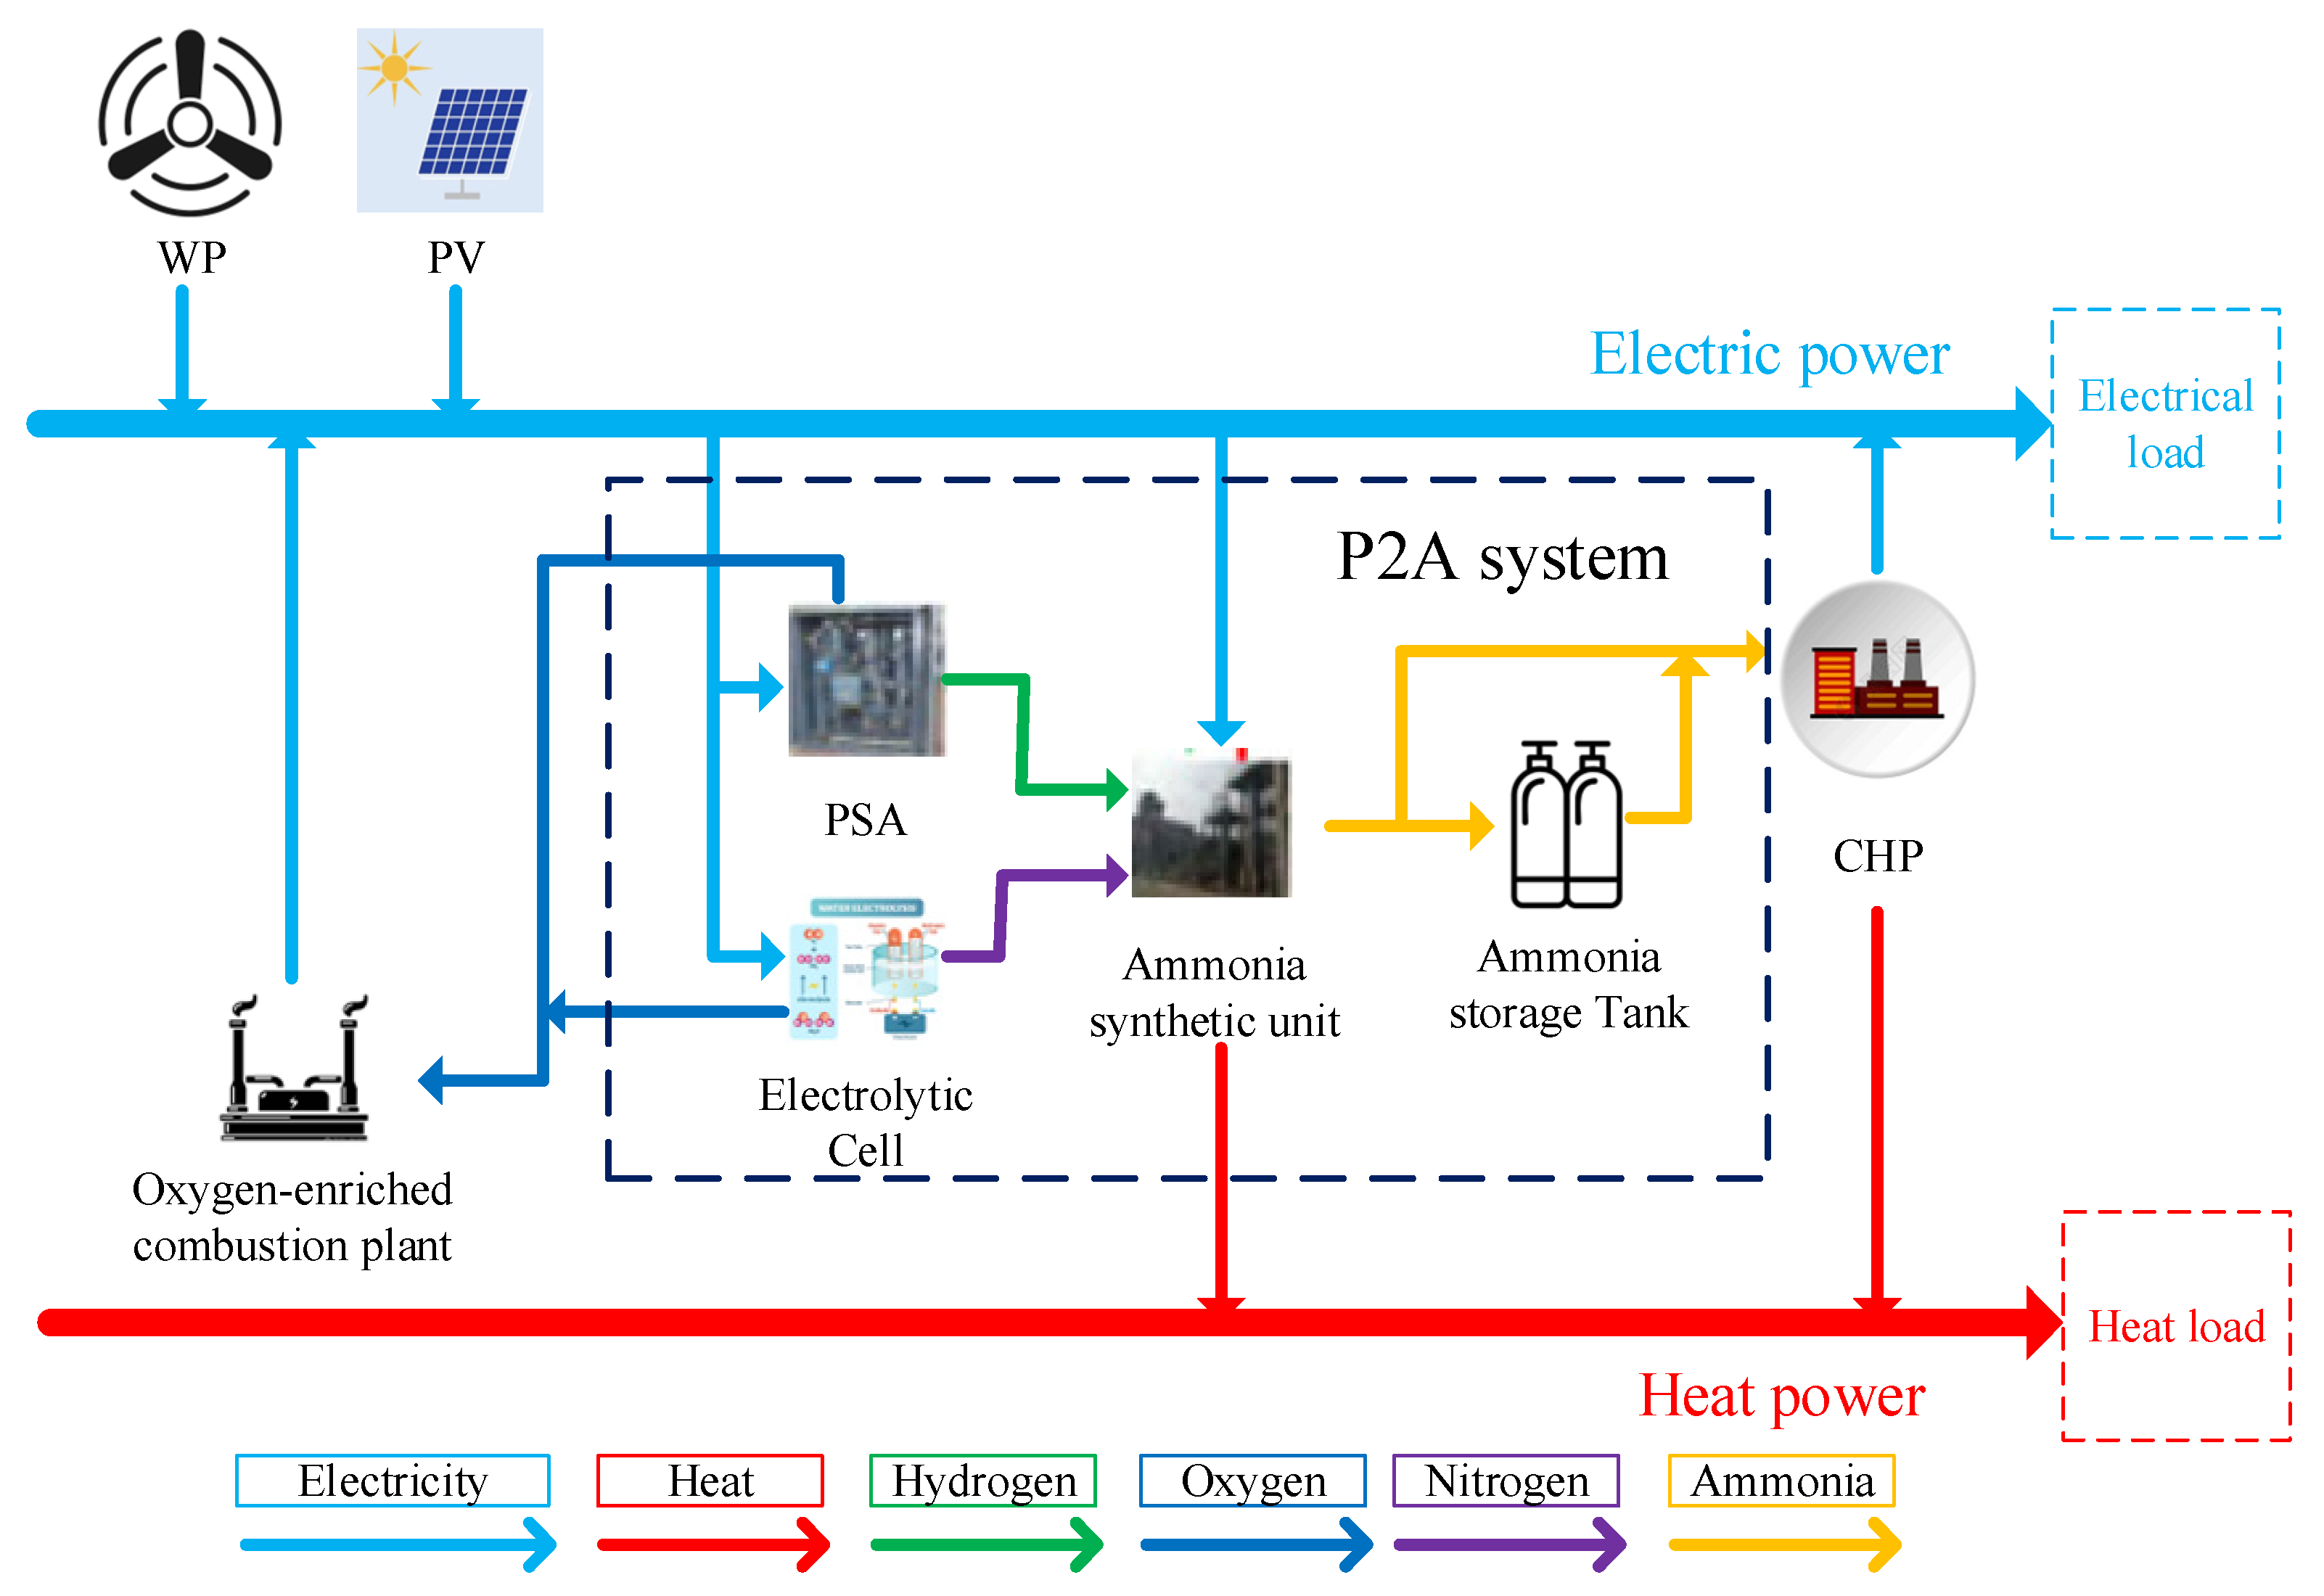
The VPP constructed in this paper is shown in Figure 1, including the wind power plant (WP), photovoltaic power plant (PV), ammonia synthesis plant (ASP), electrolytic cell(EL), air separation unit (ASU), pressure swing adsorption device (PSA),oxygen-enriched combustion plant (OEC), combined heat and power unit (CHP), oxygen storage tank (OST), ammonia storage tank (AST), and carbon capture and storage device (CCS). Among them, the electrical demands are provided by the WP, PV, OEC, and CHP; the heat demands are provided by the CHP and ASP.
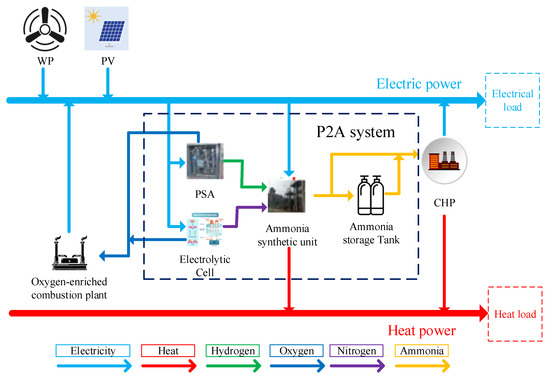
Figure 1.
Structure of wind–solar–thermal–ammonia virtual power plant.
When OEC and P2A are added to the power network, the system power output path can be divided into two: one is to supply the electric demands, and the other is to supply various devices in the system. The coordination of the operation between the components in the power network is the key to the optimization of the whole VPP dispatching framework.
2.1. Oxygen-Enriched Combustion Model
2.1.1. Energy Flow Analysis of the Oxygen-Enriched Combustion Plant
The OEC system replaces air with a gaseous mixture of oxygen and partially circulating carbon dioxide for combustion, where fossil fuels are combusted in oxygen-enriched (more than 21% oxygen) air, resulting in a high concentration of carbon dioxide in the flue gas, which can be easily captured.
The operating energy consumption of an OEC unit consists of two types of energy consumption, the CCS device and ASU device, and the ASU device is generally equipped with an oxygen storage tank (OST), which can store a large amount of oxygen [14], and the energy flow analysis of the OEC plant when it operates independently is shown in Figure 2. Electricity mainly flows to the electric demands of the CCS device and air ASU device; carbon capture and storage are in demand in the OEC system; and the oxygen required for oxygen-enriched combustion by ASU and OST are provided by the two synergistic.
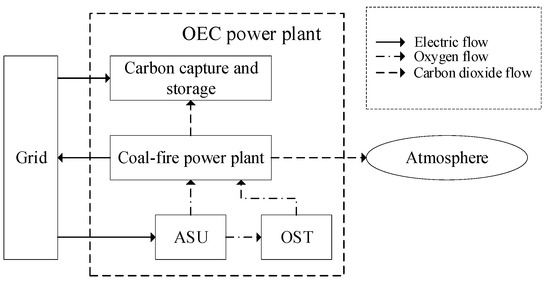
Figure 2.
Energy flow analysis of the oxygen-enriched combustion plant.
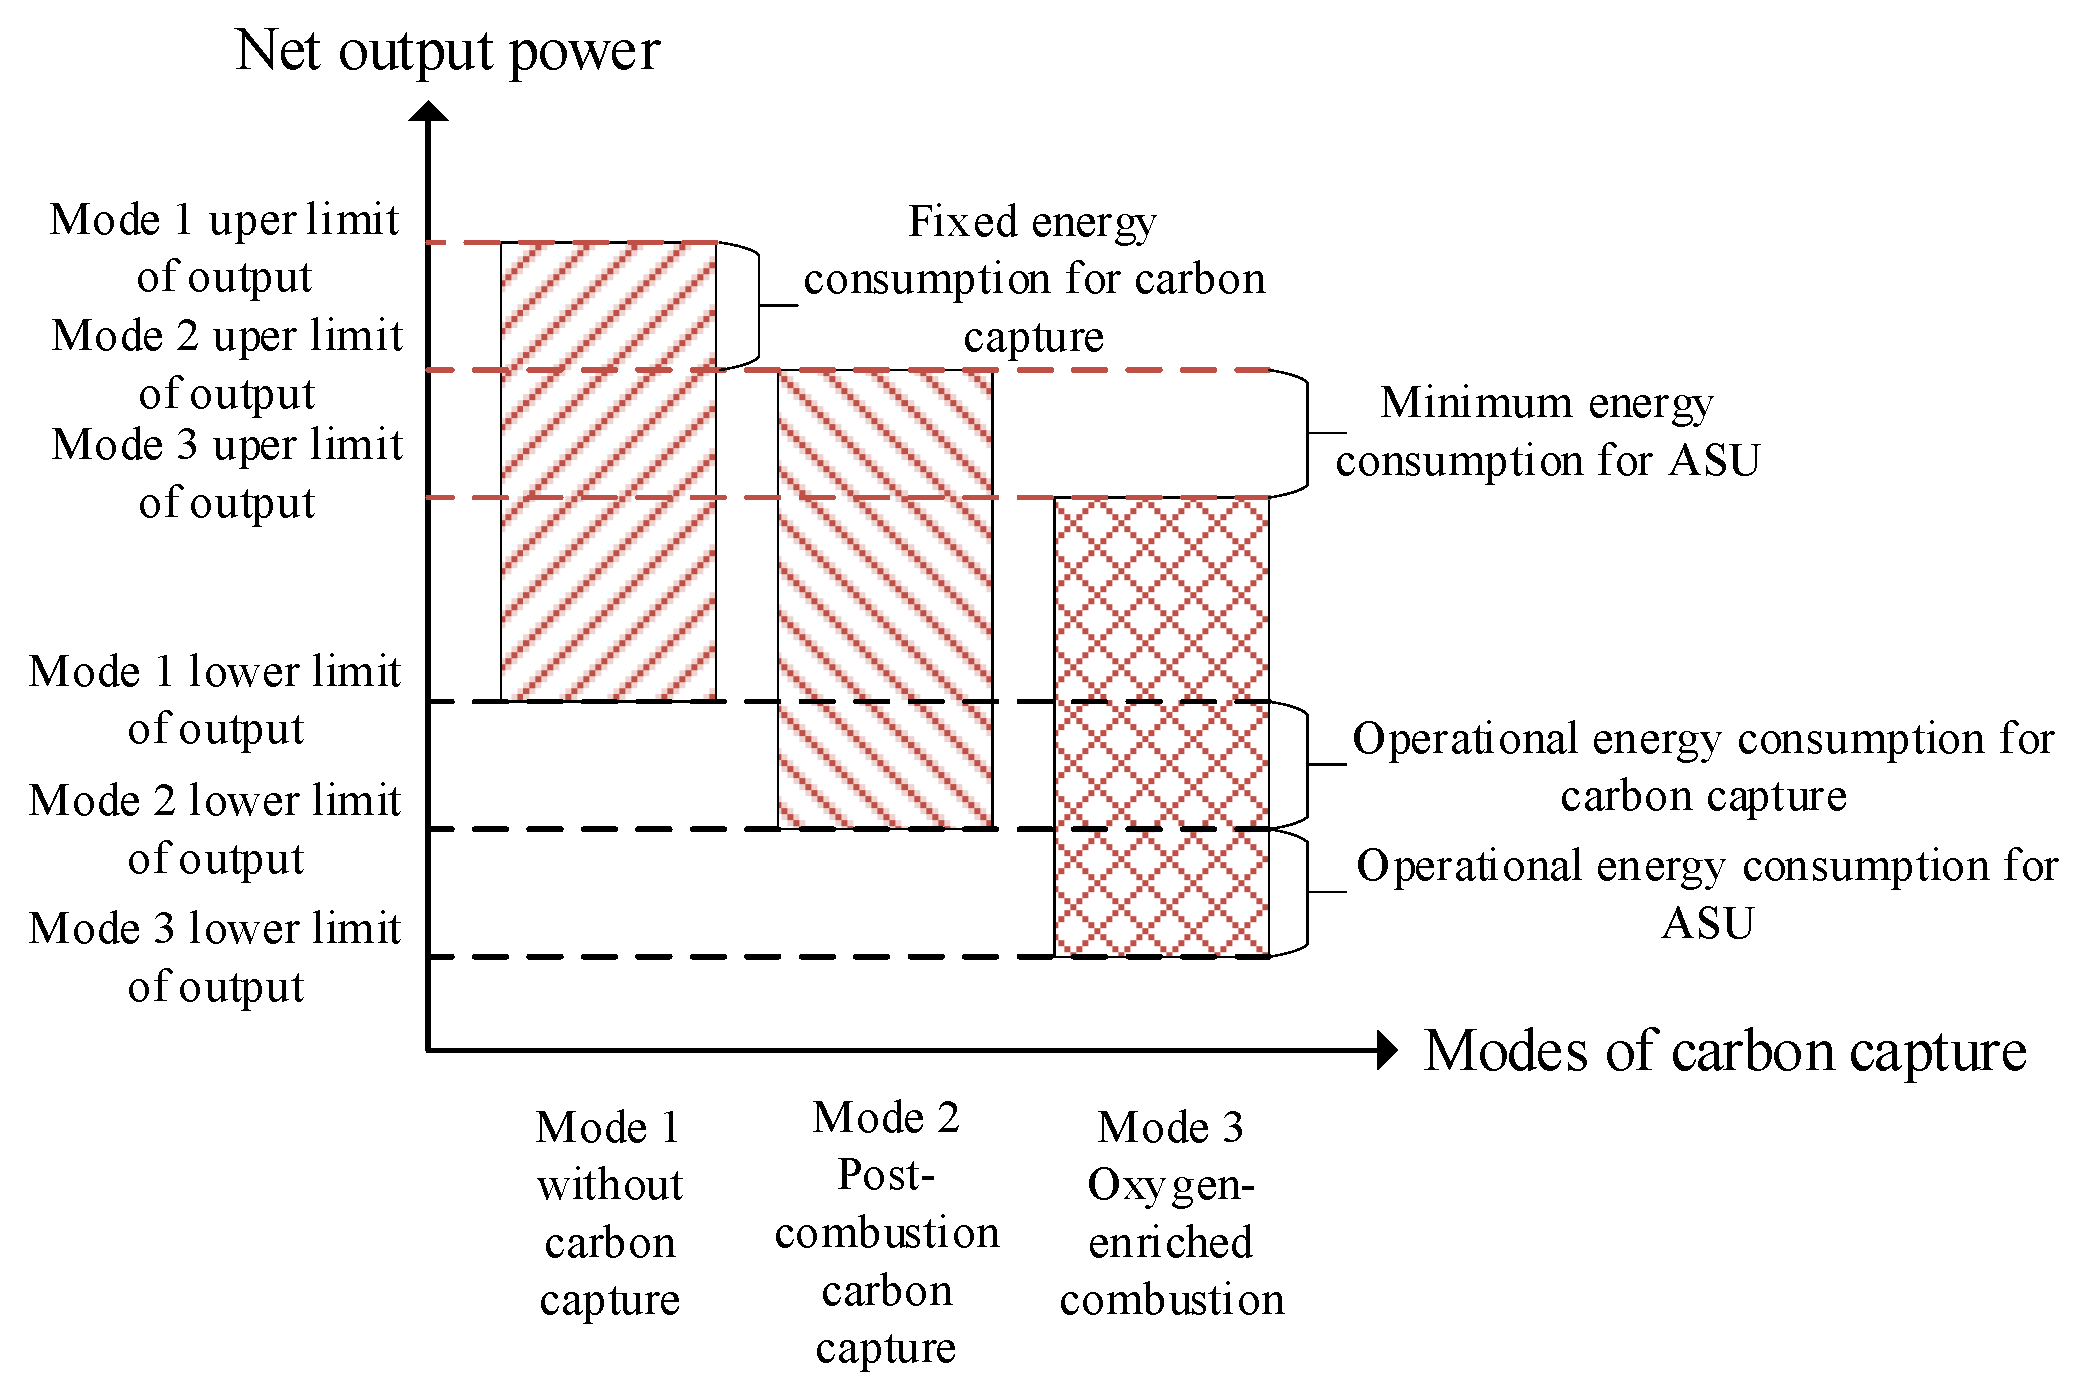
A comparison of the net output power of carbon capture power plants with different capture methods is shown in Figure 3. Oxygen-enriched combustion plants can increase their net output by reducing the energy consumption of the ASU without affecting the level of carbon capture. During low-demand periods, post-combustion carbon capture power plants can extend their operating range by capturing carbon dioxide to reduce the minimum net output. However, at this time, the total output of the plant is low, the amount of carbon dioxide produced is low, and the range of the net output that can be adjusted is limited. If oxygen-enriched combustion is used to capture carbon, the plant’s net output limit can be lowered, and its operating range widened by increasing the energy consumption of the ASU and storing the excess oxygen in an oxygen storage tank.

Figure 3.
Comparison of the net output power of different carbon capture power plants.
From the above analysis, it can be seen that the oxygen-enriched combustion power plant can utilize ASU with OST to realize shifting demands and regulate its net output in multiple time periods, which plays a role in peak shaving and valley filling.
2.1.2. Mathematical Mode of the Oxygen-Enriched Combustion Plant
According to the energy conservation relationship followed in Figure 2, the mathematical model of an oxygen-enrich combustion power plant operating independently is expressed as follows [28,29]:
where is the output power of the coal-fired power plant at time t; and are the power of the ASU and CCS at time t; is the net output power of the oxygen-enriched combustion power plant at time t; is the mass of oxygen produced by the ASU at time t; is the mass of carbon dioxide captured by the CCS at time t; and are the energy consumed to produce a unit mass of oxygen or carbon dioxide; is the mass of oxygen consumed by the OEC power plant at time t; and is the mass of oxygen consumed per unit of power for the CFFP.
2.2. Power-to-Ammonia Model
In this paper, the P2A system includes hydrogen production, nitrogen production, and ammonia synthesis. Hydrogen production adopts the alkaline electrolytic water hydrogen production technology with mature technology, with low investment costs and long life [30,31]; nitrogen production adopts the pressure swing adsorption (PSA) method, which has the advantages of a simple process, convenient operation, no environmental pollution, low investment and low consumption [21]; and the ammonia synthesis adopts the mature Harbor–Bosch process, which consists of a synthesis tower, ammonia separation, recycle loop, etc. Its synthesis reaction can be represented as follows [32]:
The energy consumption of ammonia synthesis depends mainly on three processes, which are the electrolysis of water for hydrogen production (8.57 MWh/t NH3), nitrogen purification (0.46 MWh/t NH3) and HB’s ammonia synthesis (4.57 MWh/t NH3) [21]. Oxygen is generated during the electrolysis of water and nitrogen production; 1.66 tons of oxygen is generated per ton of ammonia. HB ammonia synthesis is an exothermic reaction, and the rest of the thermal power can be used to supply the system’s heat demands. The mathematical model of ammonia synthesis is as follows:
where , , and are the P2A power, EL power, PSA power, and HB ammonia synthesis power at time t; and are the masses of hydrogen and nitrogen produced at time t; is the conversion efficiency; is the calorific value of hydrogen; is the mass of nitrogen per unit of power; is the mass of ammonia produced at time t; is the mass of ammonia synthesized per unit of power; is the mass of oxygen produced by P2A at time t; is the proportionality coefficient; is the power of the heat supply of the P2A system; and is the amount of heat supplied per ton of ammonia synthesized.
3. Low-Carbon Economic Dispatching Model for Virtual Power Plants
3.1. Objective Function
3.1.1. Cost of Total System
The optimal low-carbon economic dispatching model constructed in this paper takes the minimization of the system’s total cost as the objective function:
where and are the cost of electricity generation for the wind power plant and photovoltaic plant; is the penalty for renewable energy abandonment; is the cost of coal purchase; is the cost of device operation and maintenance; and is the cost of carbon trading.
3.1.2. Cost of WP and PV
The cost of WP, PV operation, and renewable energy abandonment is as follows:
where and are the actual output power of WP and PV at time t; and are the cost coefficients of WP and PV generation; and are the wind and solar abandonment power; and is the renewable energy abandonment penalty coefficient.
3.1.3. Cost of Coal Purchase
The coal-fired units in this paper include the coal-fired power plant (CFPP) of the oxygen-enriched combustion plant and the combined heat and power plant, and the coal consumptions of CFPP and CHP are calculated separately according to the operating characteristics of the coal-fired units:
where is the total coal consumption during the dispatching cycle, and and are the coal consumption of CFPP and CHP at time t.
The coal consumption of the coal-fired power plant is as follows:
where , and are the consumption characteristic coefficients of CFPP.
The pumped-steam CHP has good regulation flexibility and can be combined with electric heating and energy storage equipment to enhance thermoelectric regulation capabilities. The ammonia produced by P2A is used to replace coal in combustion at a certain heat ratio to realize CHP ammonia co-firing [21], which reduces coal consumption and the carbon emissions of the system. The coal consumption of CHP ammonia co-firing is as follows:
where , , and are the consumption characteristic coefficients of CHP; and are the electric power and thermal power of CHP at time t; is the ammonia consumption of CHP at time t; and and are the calorific values of ammonia and coal.
The proportion of ammonia mixing at time t can be defined as follows:
where is the proportion of ammonia mixing.
The cost of purchased coal is the following:
where is the price of a unit mass of coal.
3.1.4. Cost of Device Operation and Maintenance
Since the equipment maintenance cost of coal-fired units is only about 0.29% of the fuel cost [23], it was ignored in this paper to simplify the calculation. The operation and maintenance cost and carbon storage cost of other devices are as follows:
where , and are the operation and maintenance cost coefficients for ASU, CCS, and P2A; is the CO2 storage cost coefficient.
3.1.5. Cost of Carbon Trading
China established a carbon trading mechanism, which treats carbon emission quotas as commodities, and implemented a free-trading mechanism, accounting for carbon trading costs in corporate production in order to reduce carbon dioxide emissions. The cost of carbon trading is as follows:
where is the carbon emission quota; and are the carbon quota per unit of electricity supply and the carbon quota per unit of heat supply; is the total carbon emission; is the carbon emission per unit mass of coal; and is the penalty coefficient per unit of carbon dioxide emission.
3.2. Constraint Conditions
3.2.1. Electric, Thermal, Oxygen and Ammonia Balance
The balance of electricity, thermal, oxygen, and ammonia in the system is shown as follows:
where and are the electrical and thermal demands of the system at time t; , , and are the mass of oxygen and mass of ammonia in and out of the oxygen and ammonia storage tanks at time t.
3.2.2. Output Constraints of WP and PV
The output constraints of WP and PV are shown as follows:
where and are the predicted power of the WP and PV at time t.
3.2.3. Operating Range Constraints
The operating range constraints are shown as follows:
where , , , , and are the maximum and minimum power of P2A, ASU and CCS; and are the upper and lower output limits of CFPP; and are the upper and lower generating power limits of pumped-steam CHP units under pure condensing conditions; and is the upper limit of the thermal generation power of CHP.
3.2.4. Climbing Constraints of Coal-Fired Units
The climbing constraints of coal-fired units are shown as follows:
where , and are the maximum climbing power for supplying electricity and heat to CFPP and CHP.
3.2.5. Ammonia Mixing Ratio Constraints
The climbing constraints of the CHP unit are shown as follows:
where is the maximum ammonia mixing ratio of CHP. At present, IHI in Japan has successfully realized ammonia–coal mixing combustion with a heat ratio of 20% on a 1.2 MW test furnace and is planning to carry out ammonia–coal doping tests on a 1000 MW coal-fired unit at the Binan Thermal Power Plant, with a plan to realize mixing combustion with 20% ammonia by the middle of 2030 [33]. Therefore, the maximum ammonia doping ratio was taken as 20% in this paper.
3.2.6. Carbon Capture Constraint
The constraint of carbon capture is shown as follows:
where is the maximum capture coefficient.
3.2.7. Oxygen and Ammonia Storage Tanks Constraints
The constraints of oxygen and ammonia storage tanks are shown as follows [23]:
where is the mass of gas stored in the tank; and are the gas inflow and outflow efficiencies; is the maximum storage capacity of the tank; and are the maximum inflow and outflow masses of the tank.
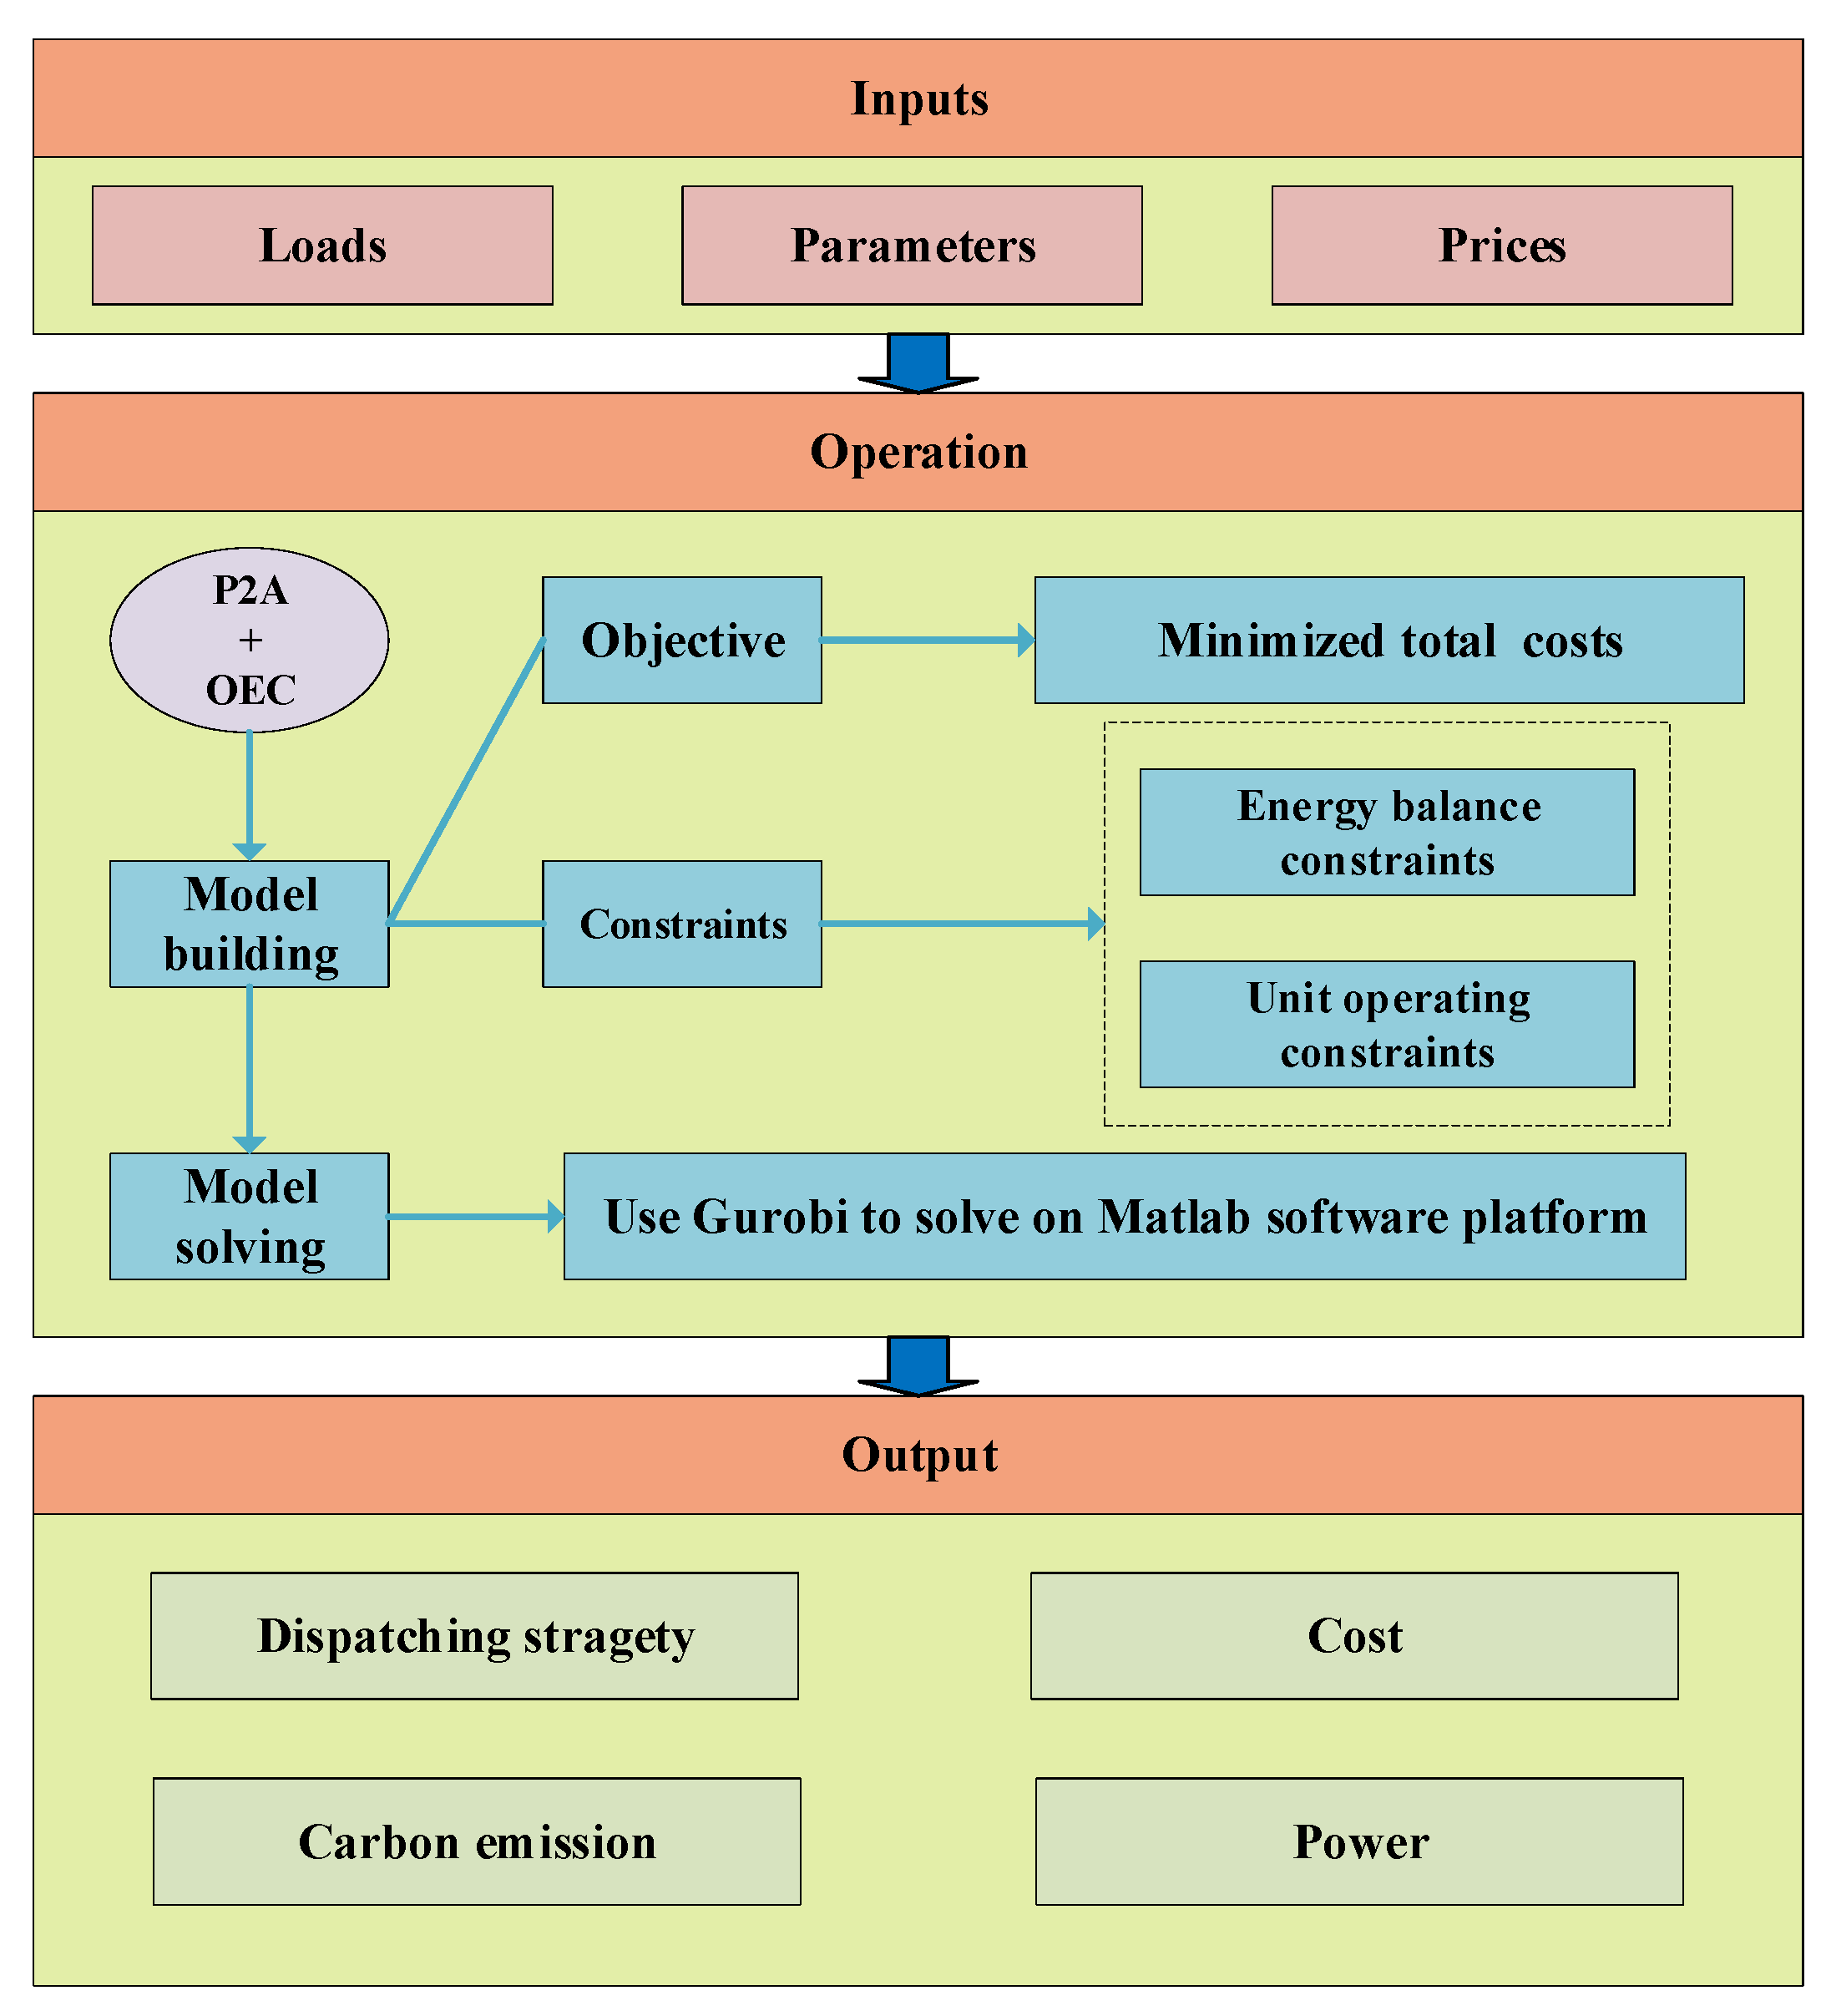
3.3. Solution Method
In this study, the Gurobi solver was invoked through the Yamilp toolbox in MatlabR2022b software, and the solver optimized and solved the established low-carbon and economic optimal dispatching model of the VPP based on the combined operation of OEC and P2A. The solution flow is shown in Figure 4.
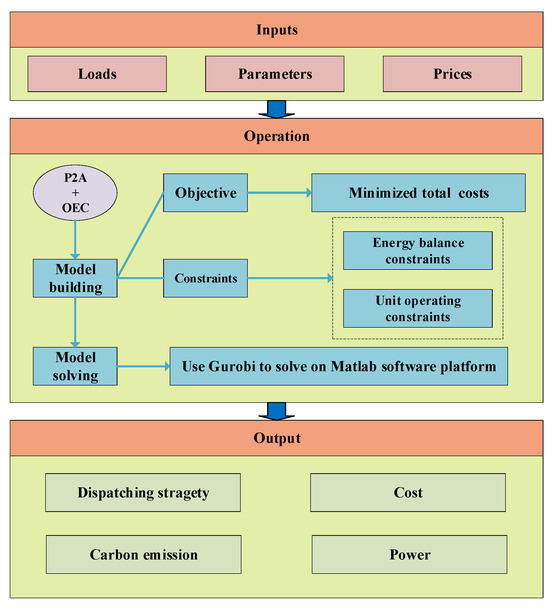
Figure 4.
Optimized dispatching framework.
4. Case Study
4.1. Parameters and Scenarios Settings
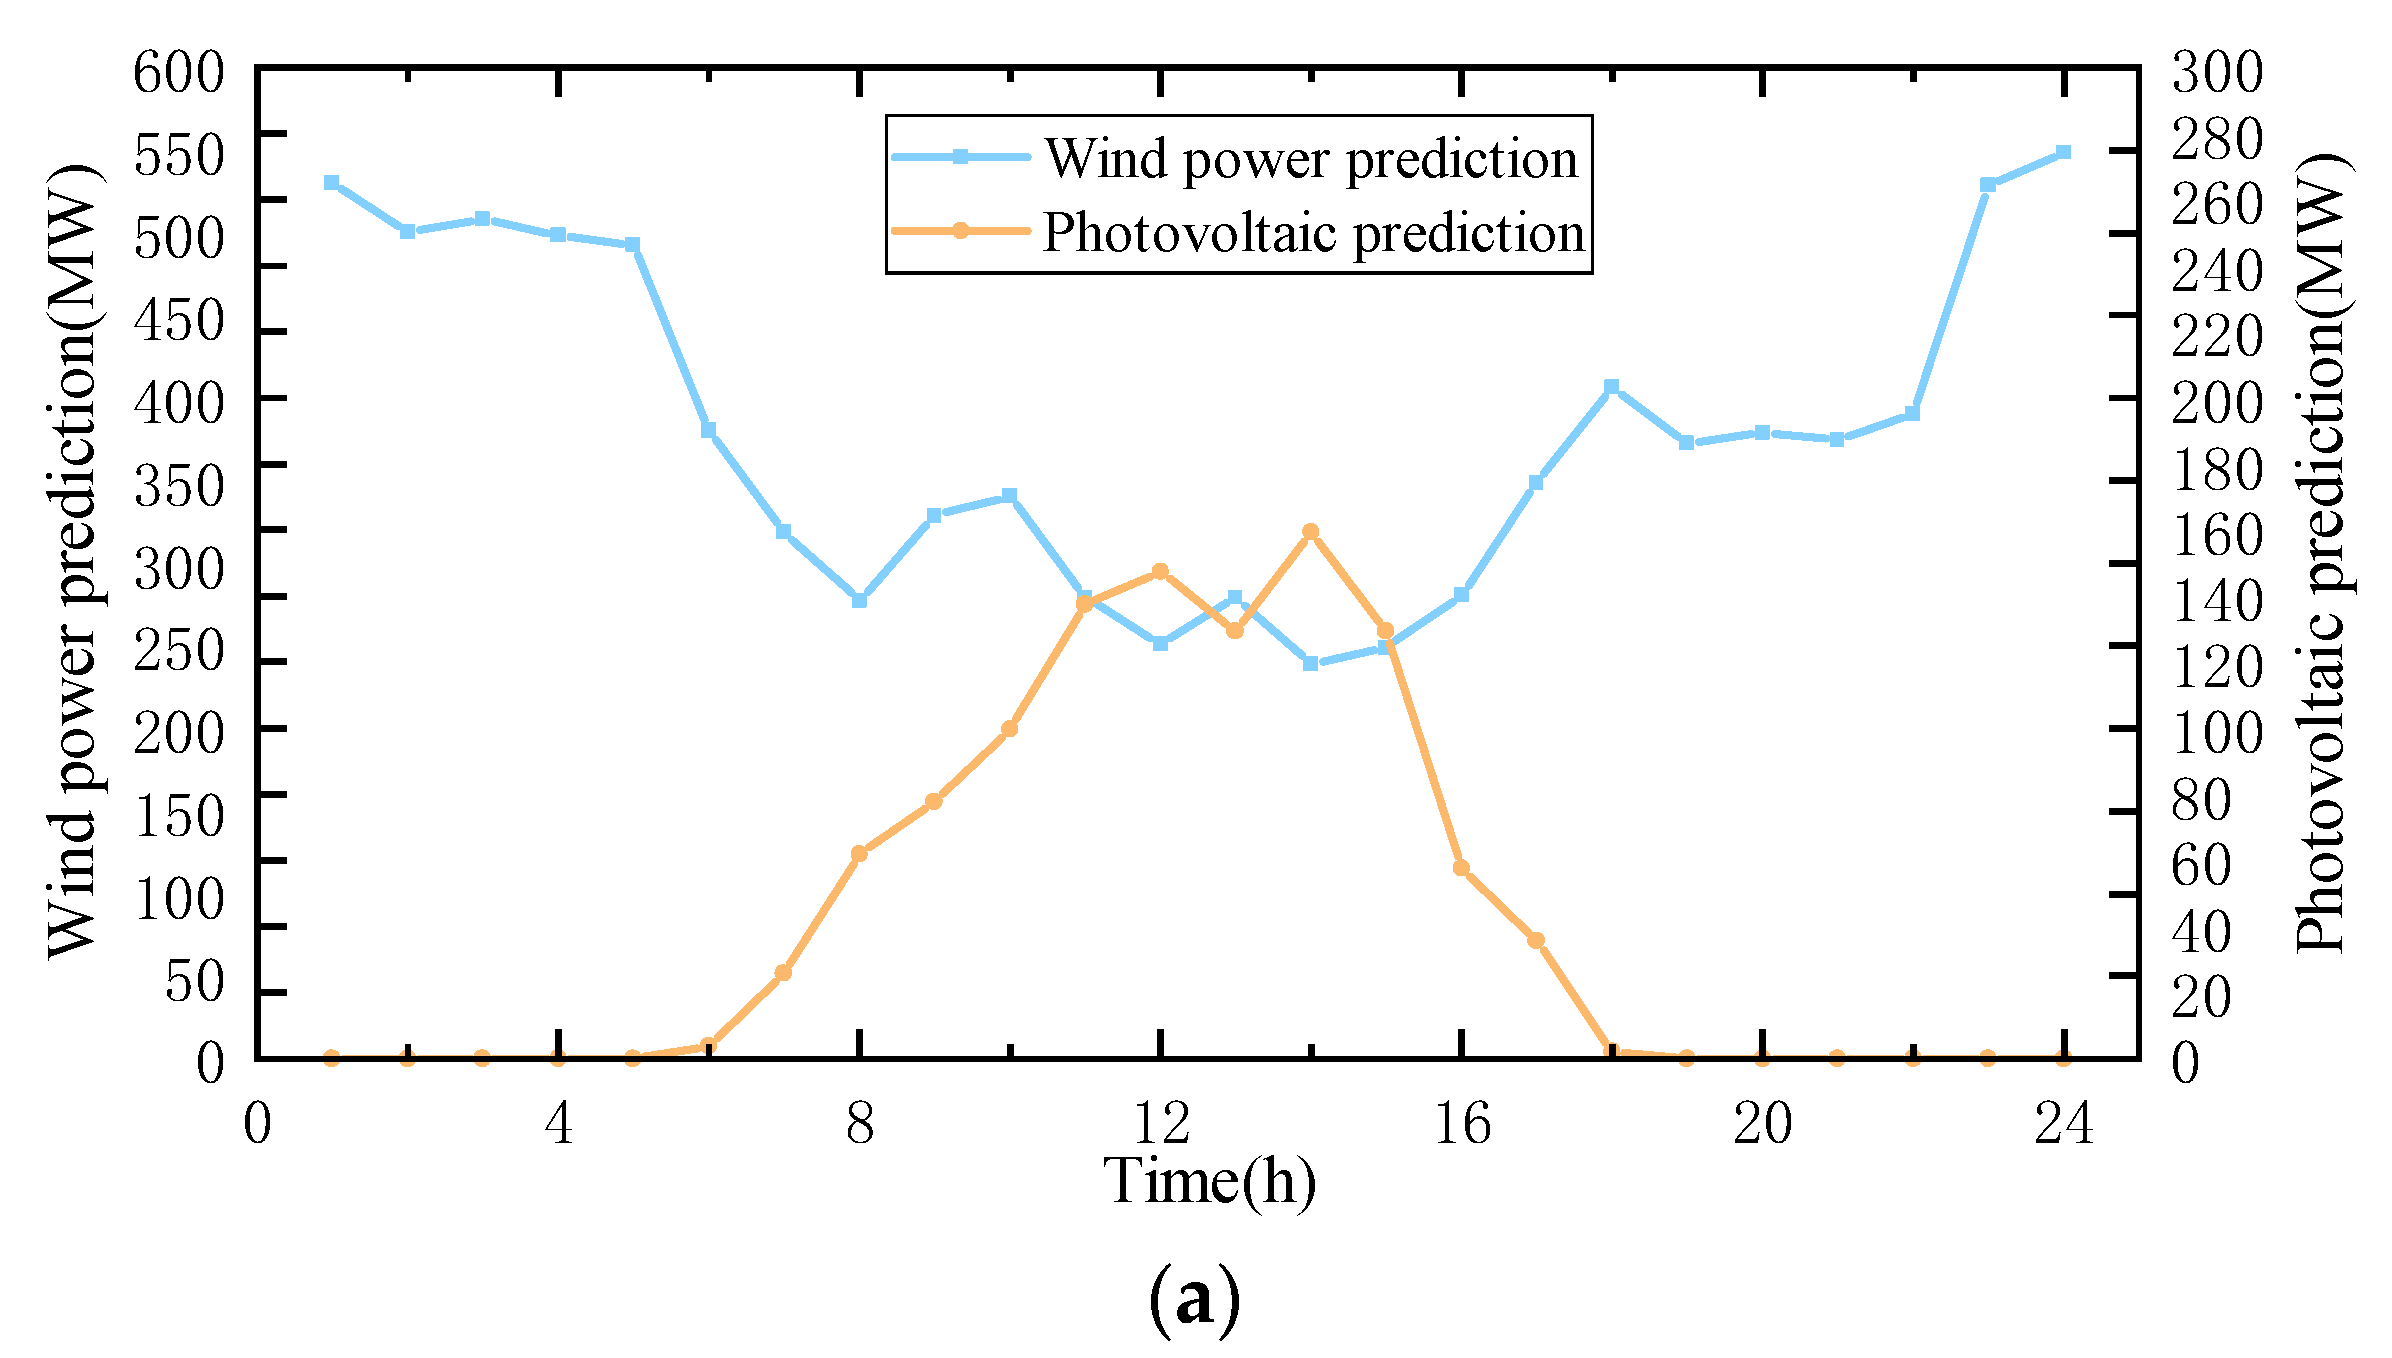
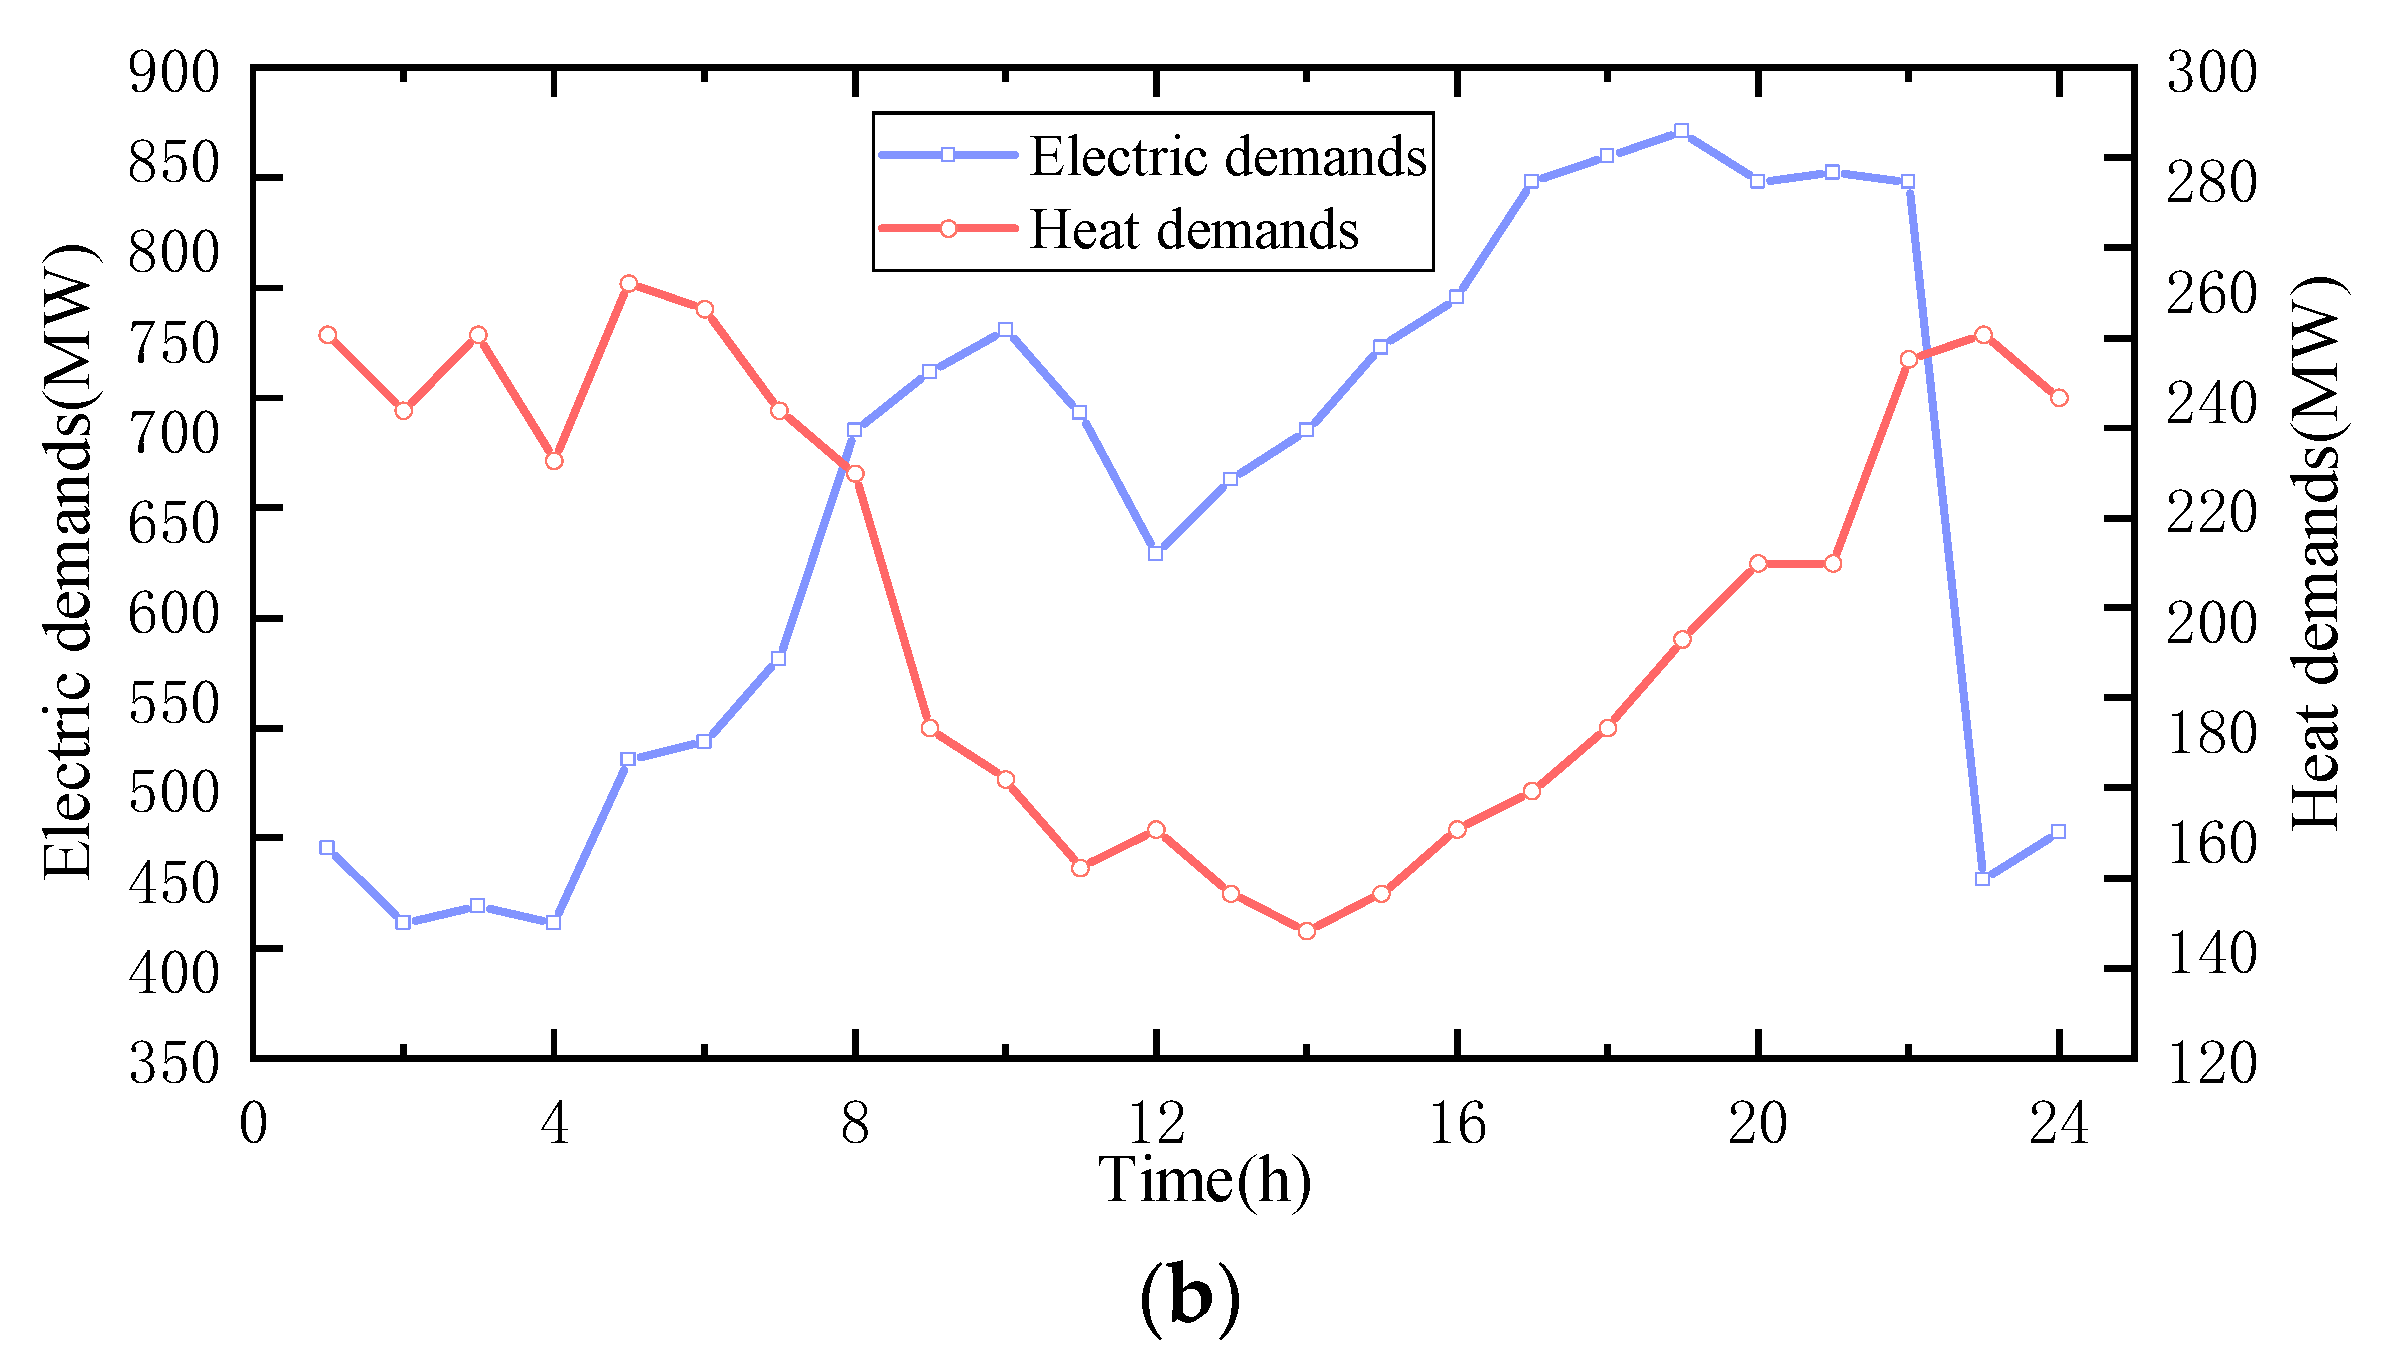
In this paper, a typical day in a region in Northwest China is taken as the object of study; the dispatch period T is 24 h; and the unit dispatch interval is 1 h. The renewable energy prediction and demand prediction of this typical day is shown in Figure 5. In the VPP, the installed capacities of wind power and photovoltaic are 600 MW and 200 MW, respectively; the maximum generation power of the CHP unit is 212 MW, and its maximum heat generation power is 300 MW; and the maximum power of the P2A is 100 MW. The parameters of the CFPP unit and the CHP unit are shown in Table 1. Other important parameters in the model are shown in Table 2.
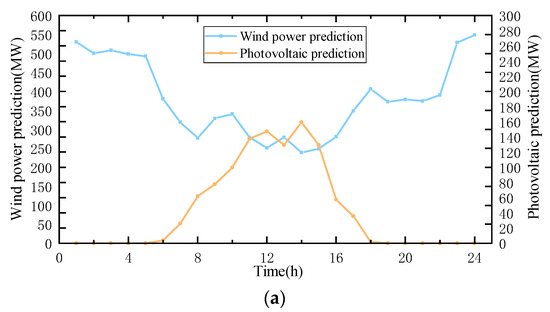
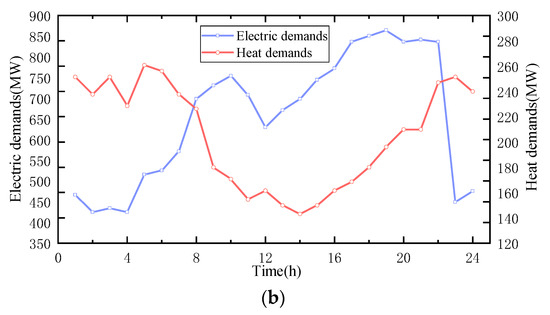
Figure 5.
Prediction of renewable energy power and demands. (a) Renewable energy prediction. (b) System energy demands.

Table 1.
Parameters of CFPP and CHP [25].
Table 2.
System parameters [23,25,31,34,35].
In order to analyze the economic and carbon emission characteristics of the combined operation model of P2A and OEC constructed in this paper, the following five models were established for comparative analysis:
Model 1: VPP without P2A and OEC.
Model 2: VPP disregarding OEC technology in a coal-fired power plant using common post-combustion capture without P2A.
Model 3: VPP with OEC without P2A.
Model 4: VPP with P2A and without OEC.
Model 5: VPP with the combined operation of P2A and OEC.
4.2. Dispatch Results and Analysis
4.2.1. Comparison of Five Models
The results of low-carbon dispatch are shown in Table 3.
Table 3.
Low-carbon dispatch results.
Compared with Model 1 and Model 2, system carbon emissions and system carbon trading costs decreased significantly due to the introduction of carbon capture and storage (CCS) technology. The energy consumption of the carbon capture device decreases the net output of the carbon capture plant, the system renewable energy utilization increases slightly, and the system renewable energy abandonment cost decreases.
Compared with Model 2 and Model 3, the use of oxygen-enriched combustion (OEC) technology in Model 3 reduces the carbon capture energy consumption and increases the carbon capture rate, which leads to a further decrease in carbon emissions and carbon trading costs in Model 3, with the carbon emissions decreasing from 6723 t to 6592 t (1.95%) and the carbon trading costs decreasing from CNY 7,524,412 to CNY 7,275,552 (3.3%). Since the oxygen-enriched combustion power plant includes an air separation unit, which makes its minimum net output larger than that of a normal carbon capture power plant, this leads to a significant increase in renewable energy utilization in Model 3 to Model 2, from 80% to 94.02%, and a decrease in the cost of renewable energy abandonment from CNY 406,599 to CNY 121,626 (70%).
Compared with Model 4 and Model 1, Model 4 uses power-to-ammonia (P2A) technology, which allows it to consume system renewable energy rejections, and the ammonia produced is burned in the combined heat and power (CHP) unit, thereby reducing coal consumption and carbon emissions. The carbon emissions in Model 4 decreased from 9874 t to 9722 t (1.54%), the carbon trading cost decreased from CNY 1,237,171 to CNY 1,202,747 (2.78%), the renewable energy utilization increased from 79.35% to 86.68%, and the renewable energy abandonment cost decreased from CNY 4,197,850 to CNY 270,923 (35.46%).
Compared with Models 3, 4, and 5, Model 5 is under the combined operation of OEC and P2A technologies, where oxygen, as a byproduct of the P2A process, is provided to the OEC unit as a feedstock, reducing the energy consumption of the air separation unit (ASU) in the OEC plant and increasing the net output range of the OEC plant. Both the OEC plant and P2A technology consume a large amount of renewable energy abandonment, which results in Model 5 having a higher renewable energy utilization rate. Both OEC and P2A technologies can reduce system carbon emissions, which leads to a further reduction in carbon emissions and carbon trading costs in Model 5 compared to Model 4.
Most of the metrics in Model 5 are the best of the five models. Compared to Model 1, Model 5 shows a decrease in the total cost from CNY 5,748,942 to CNY 5,119,610 (10.95%), a decrease in carbon emissions from 9874 t to 6440 t (34.79%), a decrease in the carbon trading cost from CNY 1,237,171 to CNY 695,254 (43.8%), an increase in the renewable energy utilization rate from 79.35% to 98.75%, and a decrease in the cost of renewable energy abandonment from CNY 419,758 to 2CNY 5,493 (93.93%).
4.2.2. Virtual Power Plant Electric Balance Analysis
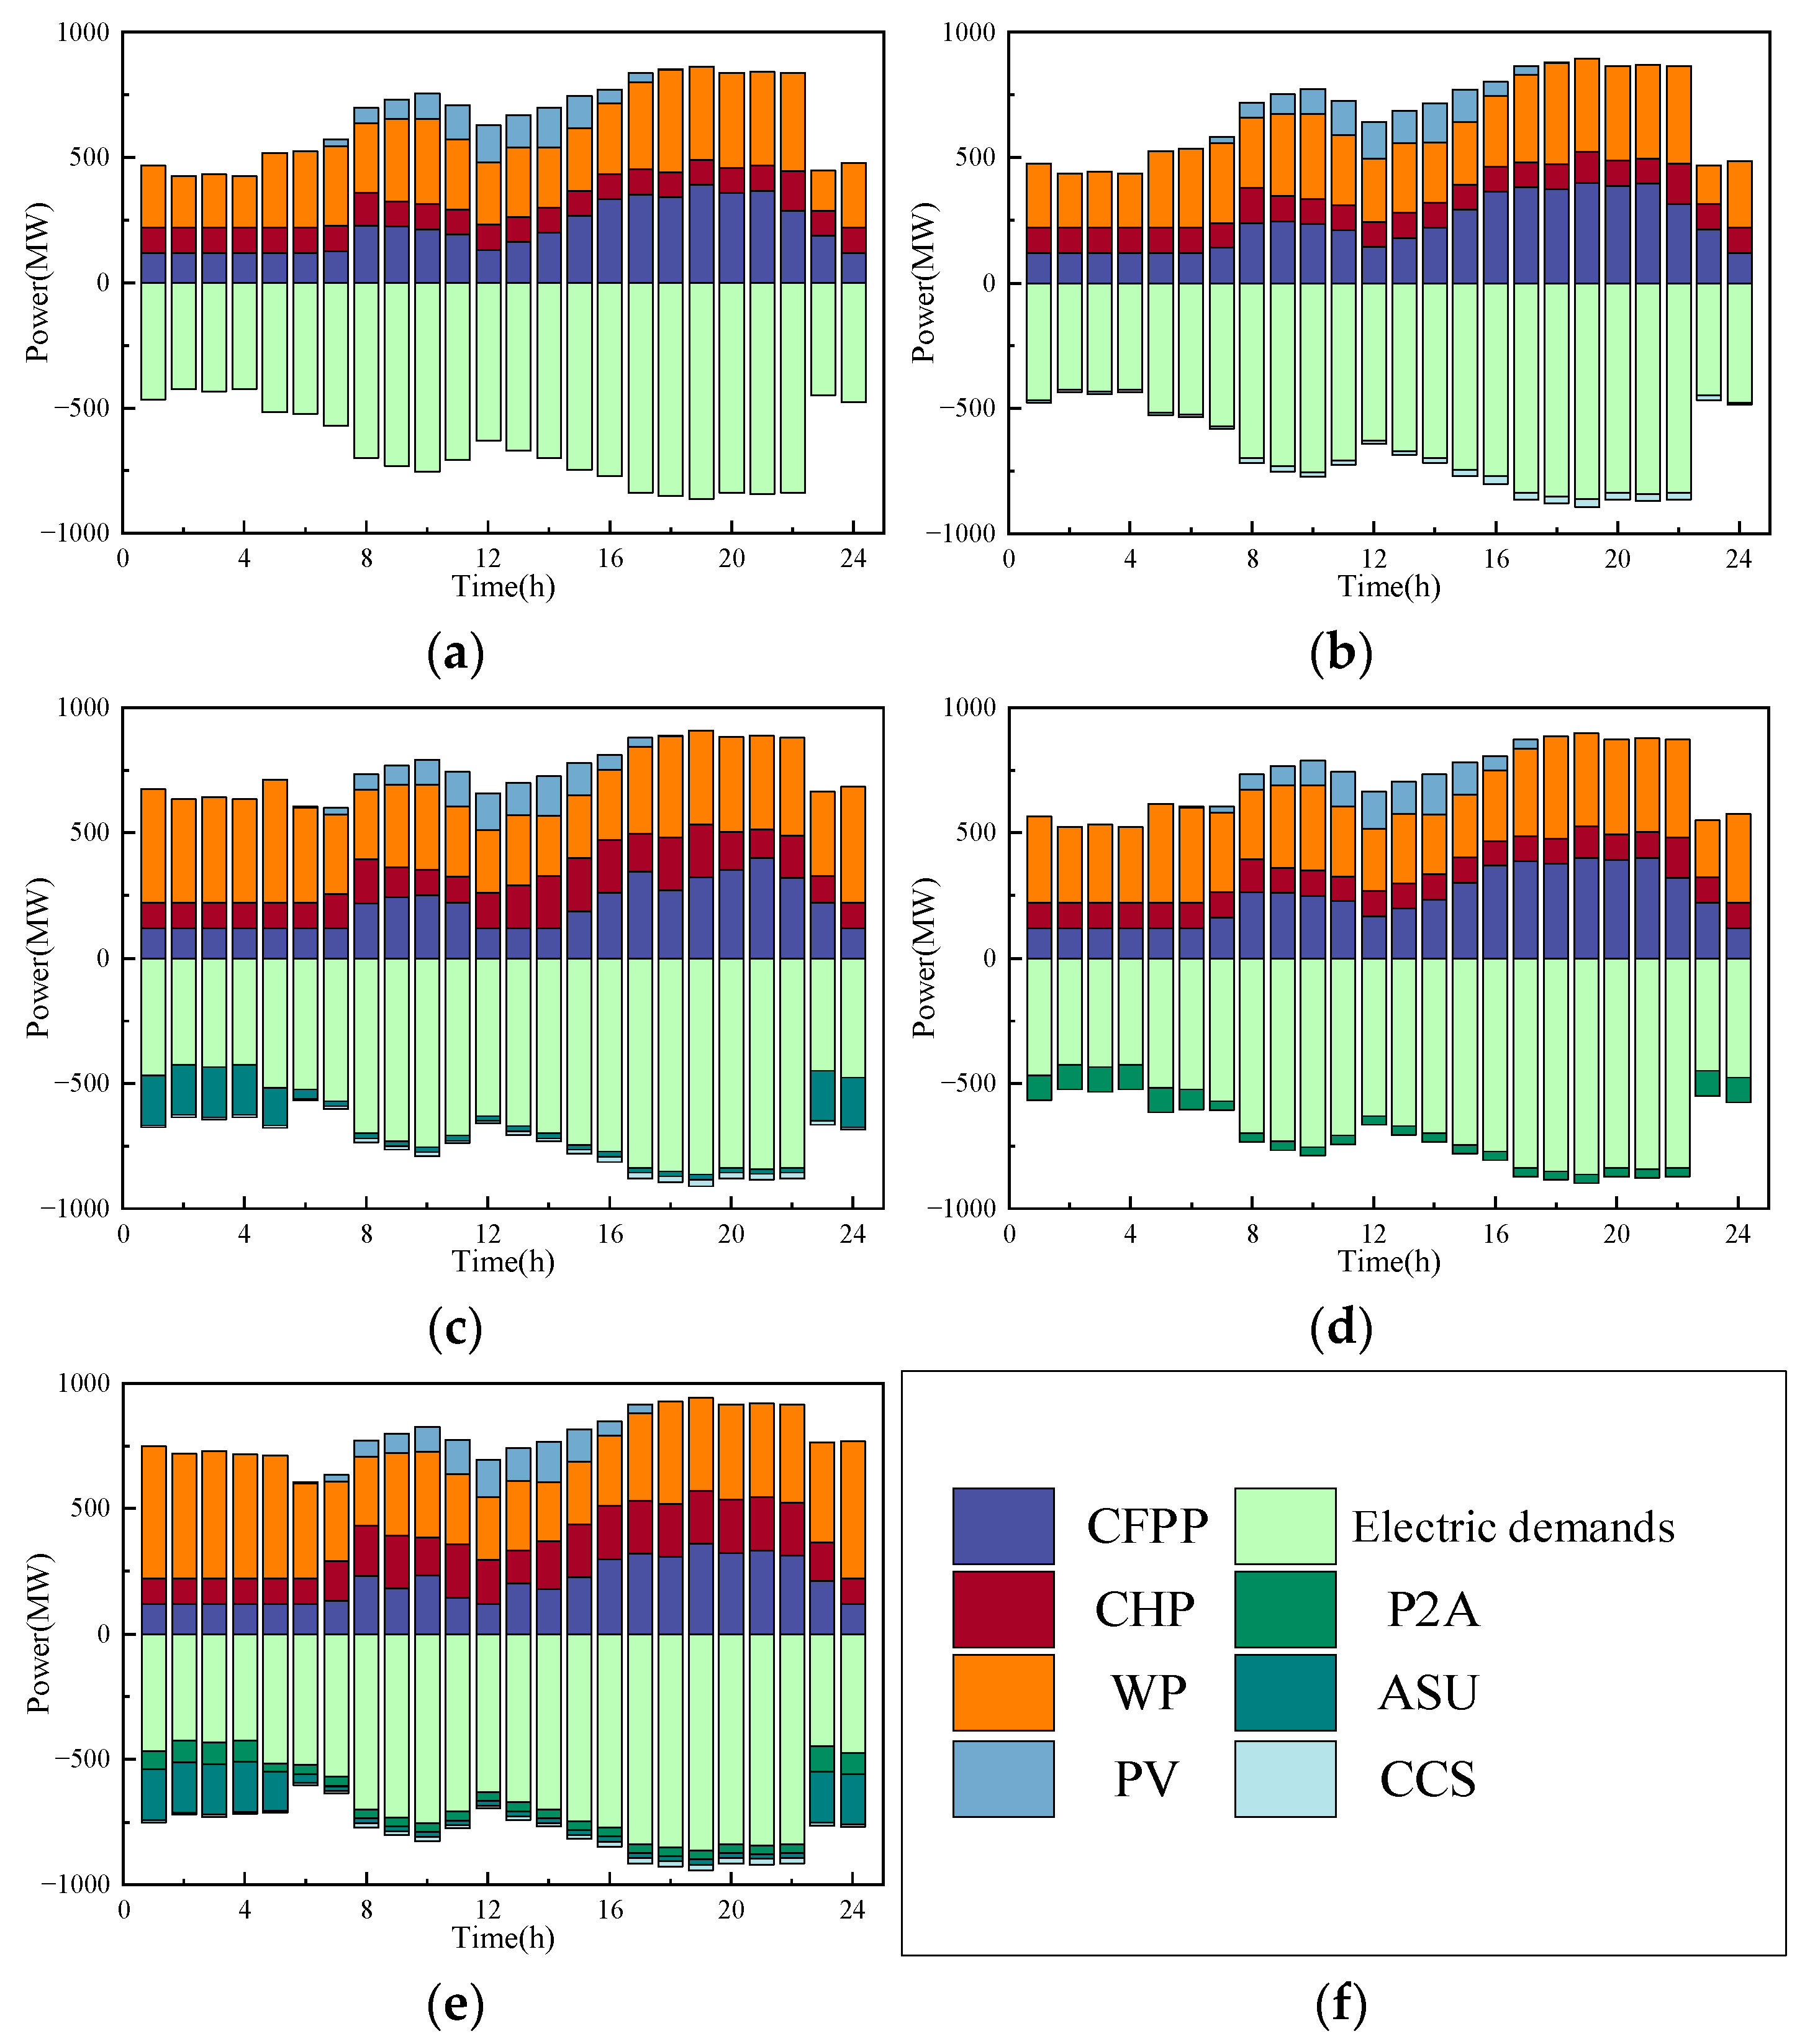
The power balance of the virtual power plant is shown in Figure 6.
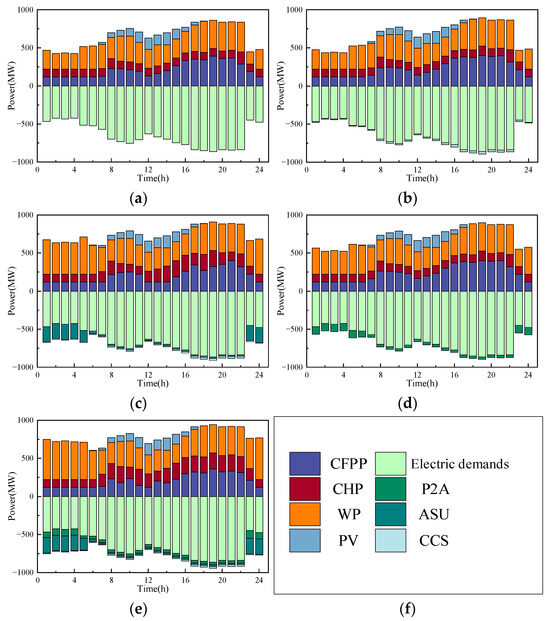
Figure 6.
The electric balance of each model. (a) Model 1. (b) Model 2. (c) Model 3. (d) Model 4. (e) Model 5. (f) Illustration.
As shown in Figure 6a, in Model 1, the coal-fired power plant (CFPP) combined the heat and power unit (CHP), wind power (PV) and photovoltaic (PV) to supply electric demands, and the electric demands were lower at 23:00–5:00, generally on the rise at 5:00–17:00 and peaked at 18:00–22:00. CFPP had lower output in the 24:00–7:00, and higher output in the 13:00–23:00 period. CHP had a smooth output throughout the dispatch process and always stayed at a low output level. The wind was more abundant at 5:00–17:00, but due to lower electric demands, WP output was lower, and more wind was abandoned. At 18:00–6:00, illumination was insufficient, and PV output was 0. At 11:00–15:00, illumination was stronger, and PV output was at its peak.
As shown in Figure 6b,c, in Model 2, the electrical demands of the system increased due to the addition of carbon capture and storage devices (CCS), but because the energy consumption of the CCS was relatively small, the change in the output of the system’s various power generation units is not clear; in Model 3, oxygen-enriched combustion technology (OEC) was used, and the air separation unit (ASU) consumed more energy, and its energy consumption reached a peak at 23:00–5:00.
As shown in Figure 6d, in Model 4, the electric ammonia transfer system was incorporated, which had a higher operating condition at 23:00–6:00, and its energy consumption was higher, consuming part of the renewable energy. The ammonia produced by the P2A was mixed into the CHP for combustion, which reduces part of the coal consumption.
As shown in Figure 6e, OEC and P2A were used in Model 5, and the system energy consumption greatly increased. At 23:00–5:00, both ASU and P2A were in maximum operation, which consumed a large amount of renewable energy. At 6:00–22:00, both ASU and P2A were in minimum operation, reducing their energy consumption. At 17:00–22:00, CFPP was more powerful, and CCS had a larger operation state.
4.2.3. Virtual Power Plant Thermal Balance Analysis
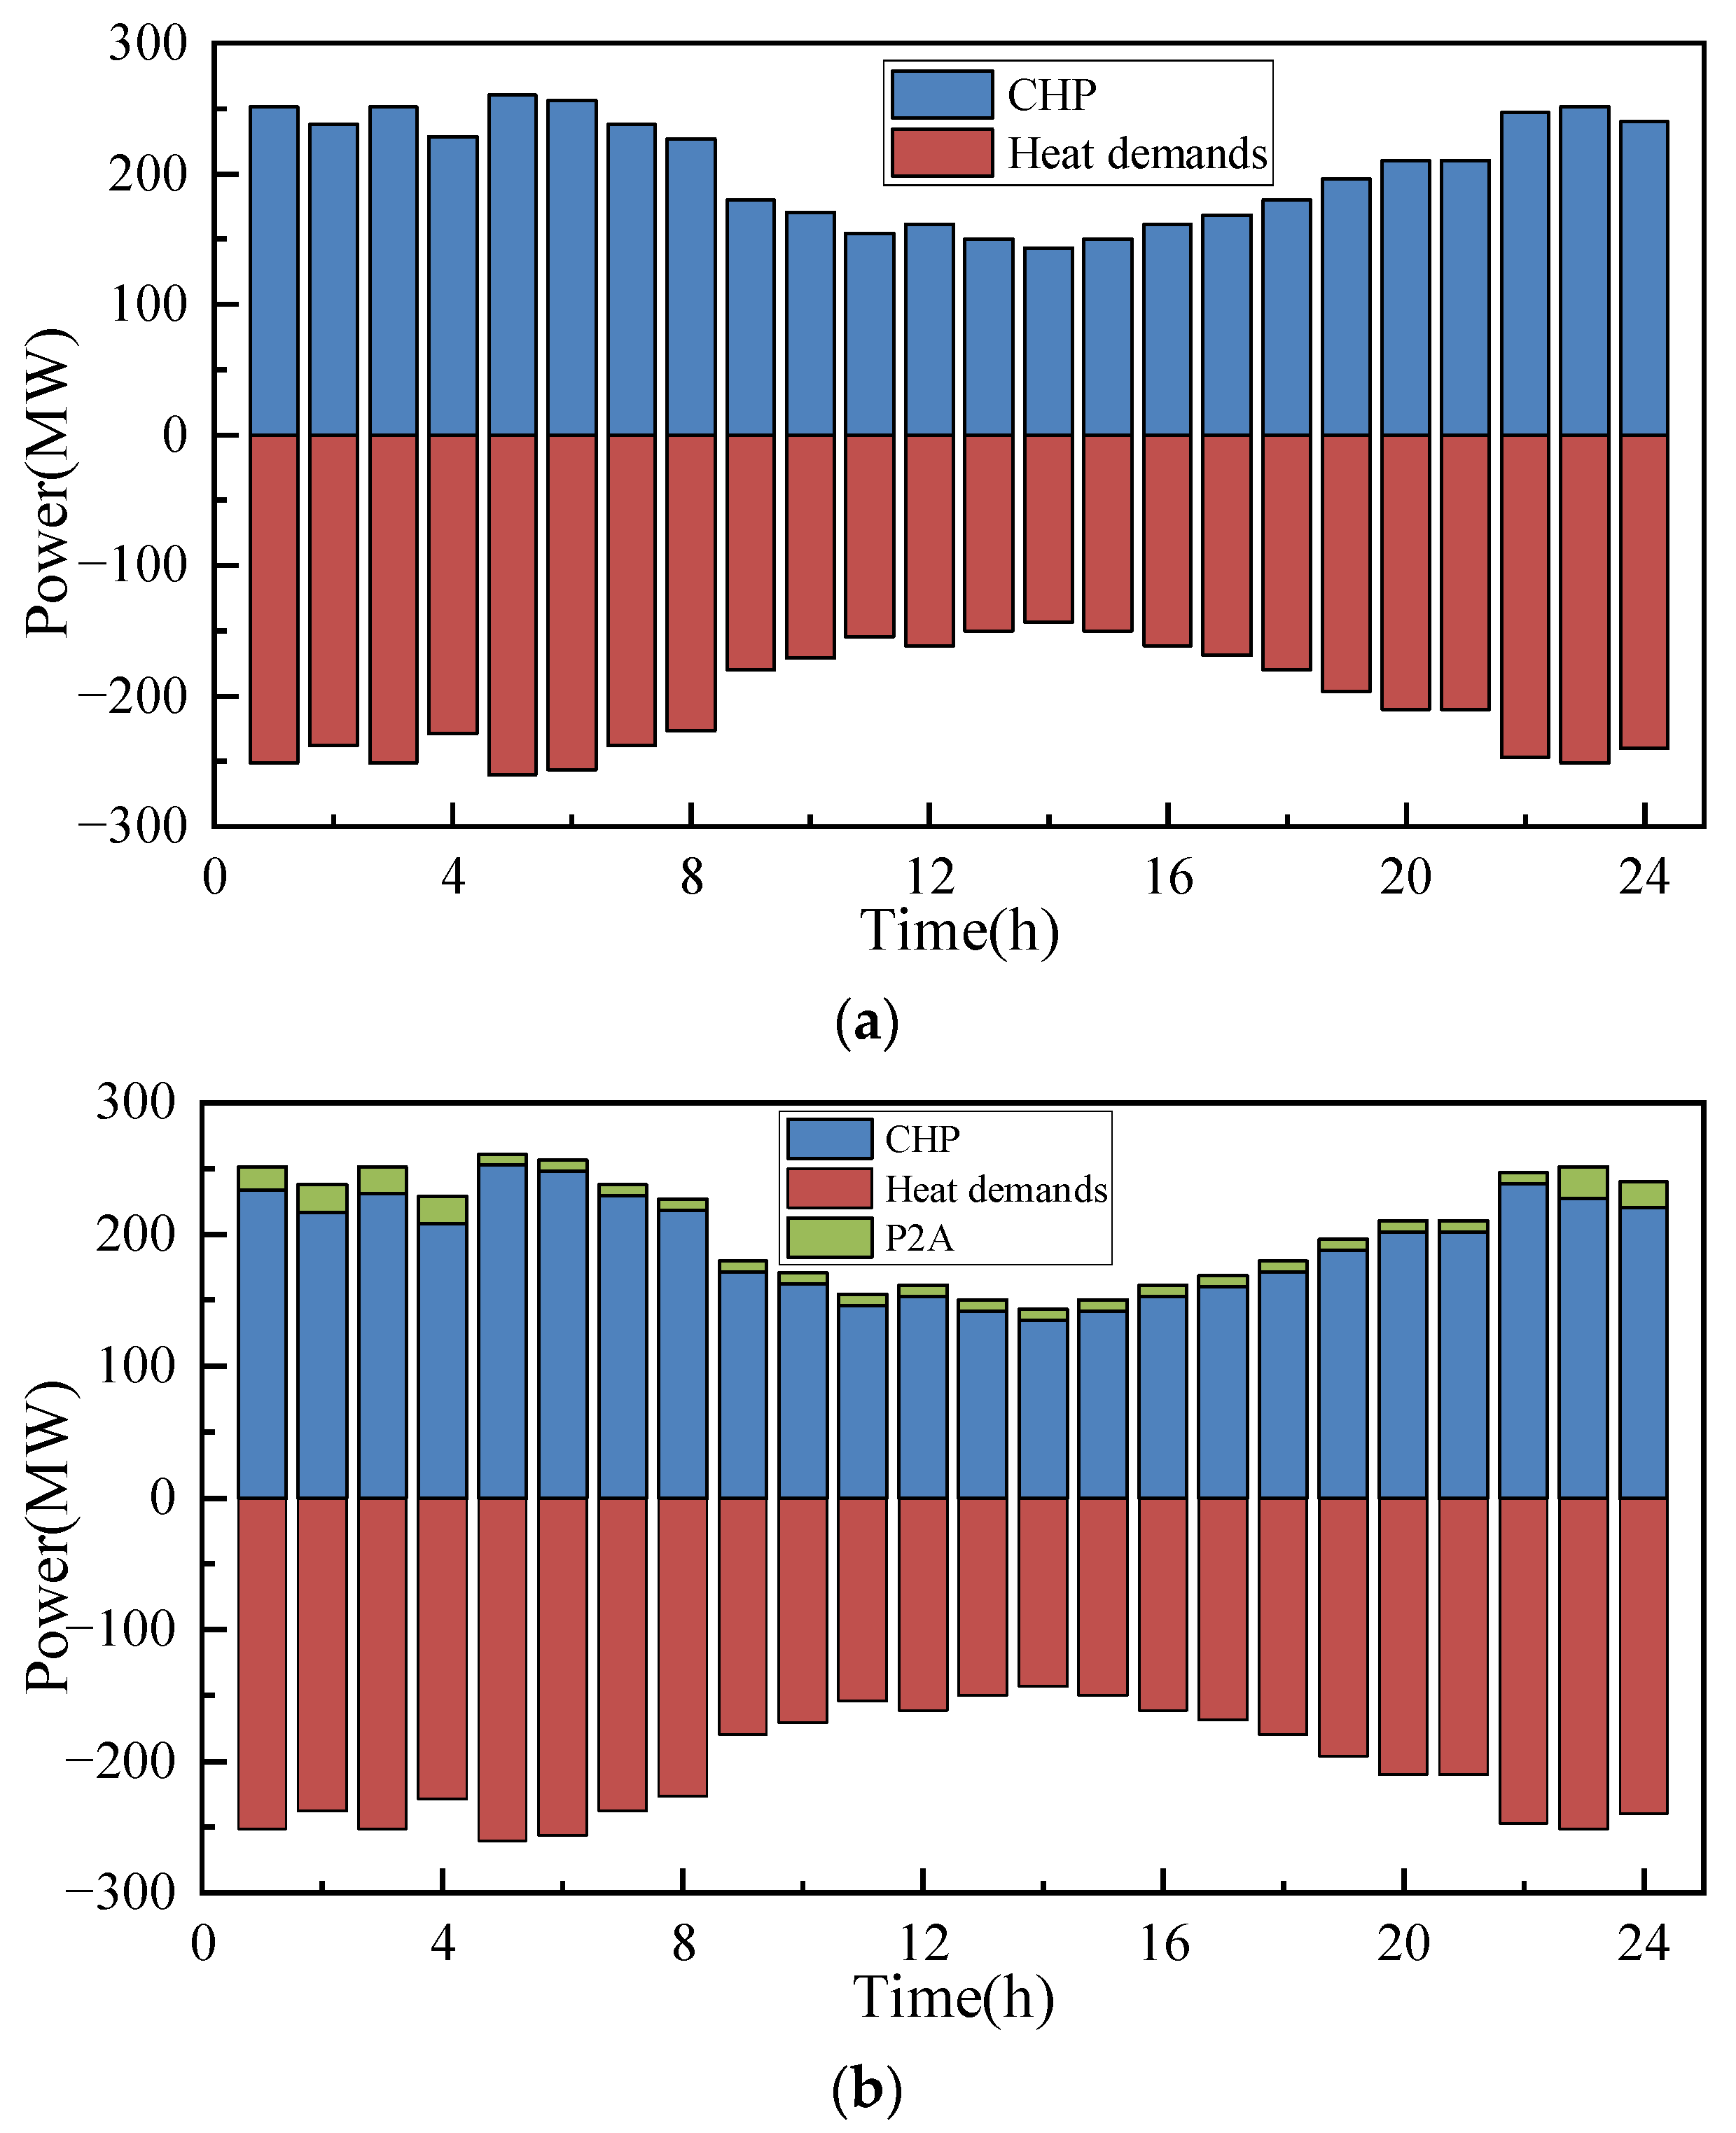
The thermal balance of the virtual power plant is shown in Figure 7.
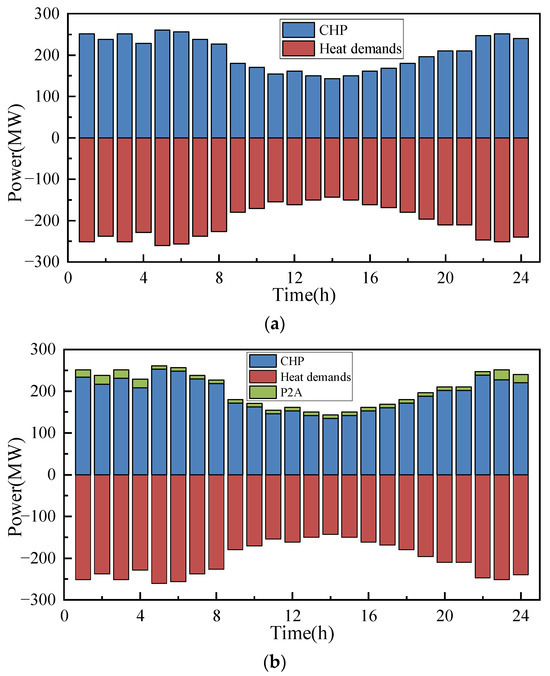
Figure 7.
The thermal balance. (a) Models 1, 2 and 3. (b) Model 5.
As shown in Figure 7, the heat dispatch results were the same for all three models since the heat was supplied exclusively by CHP in Models 1, 2, and 3. At 11:00–19:00, the heat demand was low. At 20:00–10:00, the heat demand was at its peak. In Model 5, P2A technology was introduced, and the waste heat generated in the ammonia synthesis process provided part of the heat demand, which reduced the coal consumption for the CHP heat supply and improved the economy and low-carbon performance of the system. The ammonia plant provided a total of 275.44 MWh of heat energy during the entire dispatch process.
4.2.4. Oxygen-Enriched Combustion Plant Output Analysis
The oxygen-enriched combustion plant output is shown in Figure 8.
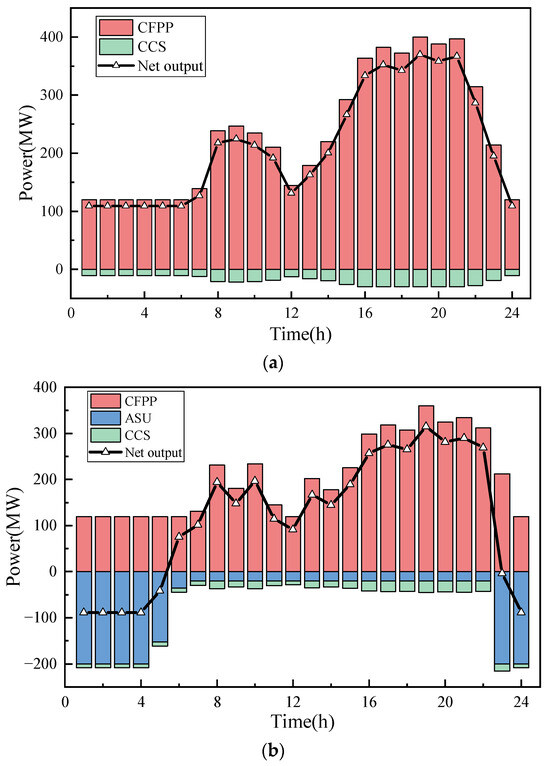
Figure 8.
Oxygen-enriched combustion plant output. (a) Model 2. (b) Model 5.
As shown in Figure 8, in Model 2, the net output of CFPP using common post-combustion capture was adjusted over a smaller range. At 24:00–6:00, wind resources were more abundant, but the net output of CFPP remained at a high level, preventing it from effectively consuming renewable energy. In Model 5, the ASU in the oxygen-enriched combustion power plant consumed more energy, and its net output adjustment range became larger. At 23:00–6:00, ASUs operated at maximum power, which made the net output of the oxy-fuel plant negative and effectively consumed the discarded energy from renewable energy sources during this period. At 7:00–22:00, the ASU operated at lower power, which had less impact on the net output of the oxy-fuel plant.
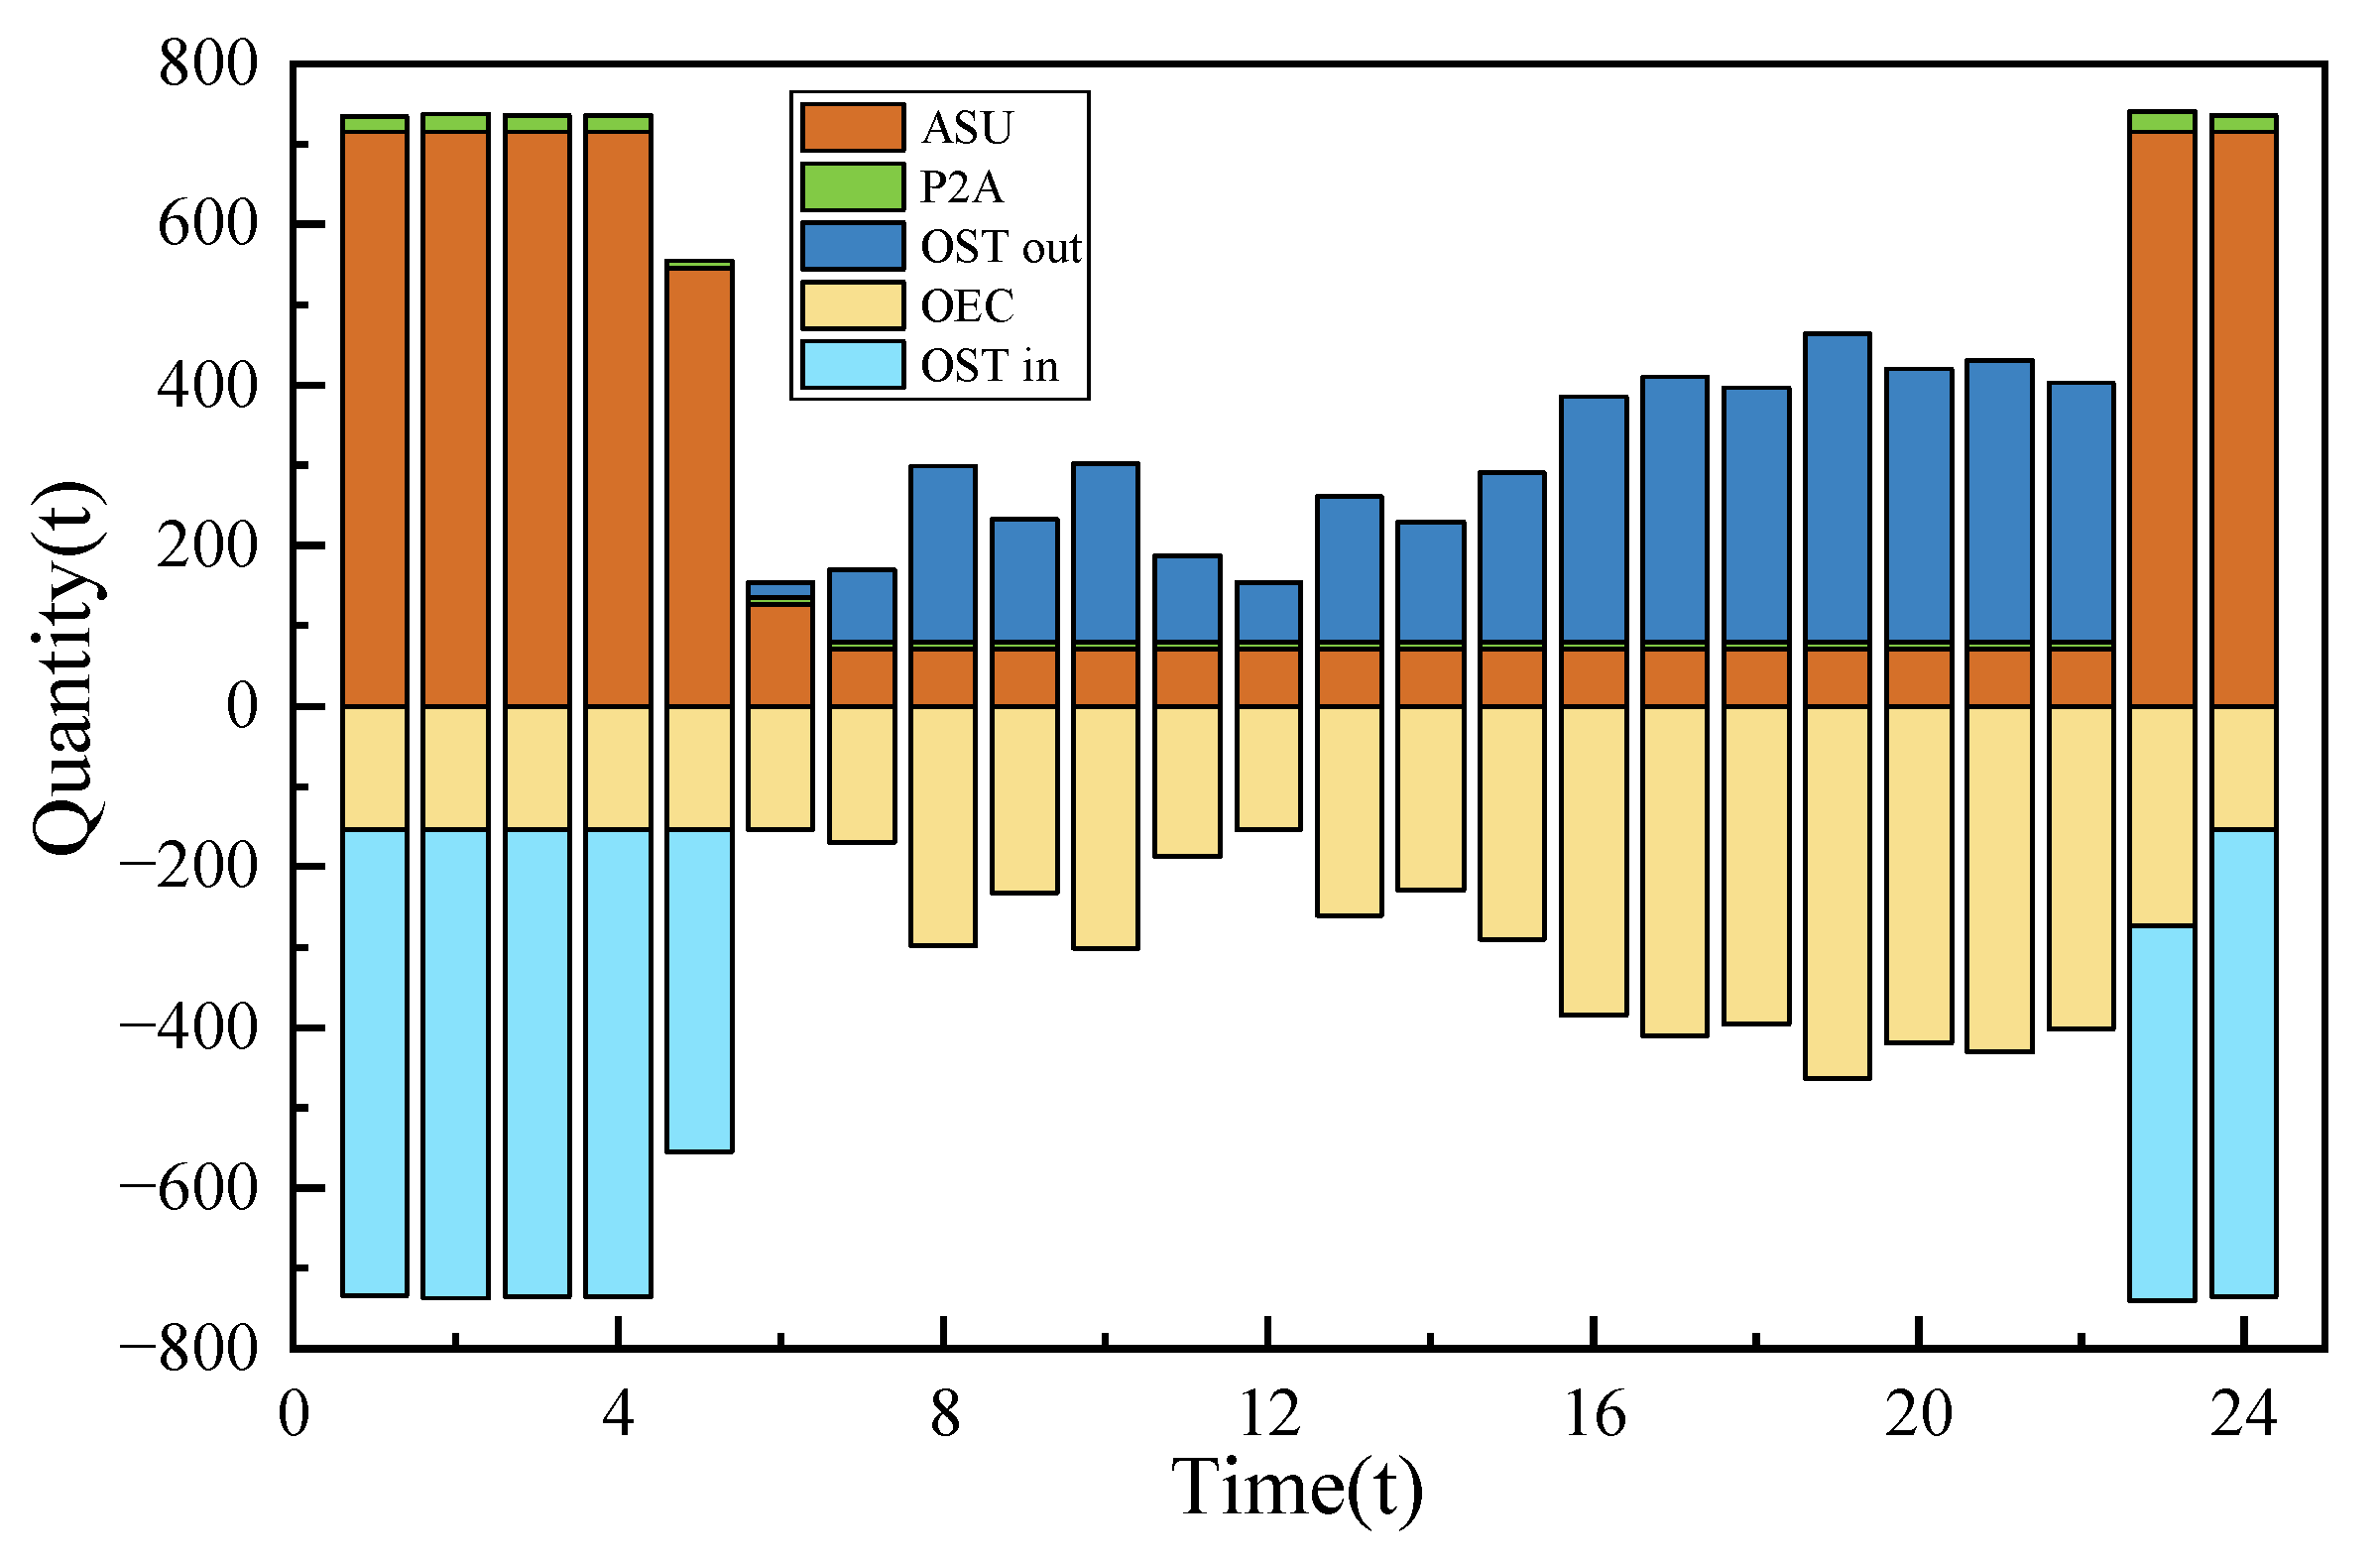
4.2.5. Oxygen Balance and Storage Analysis
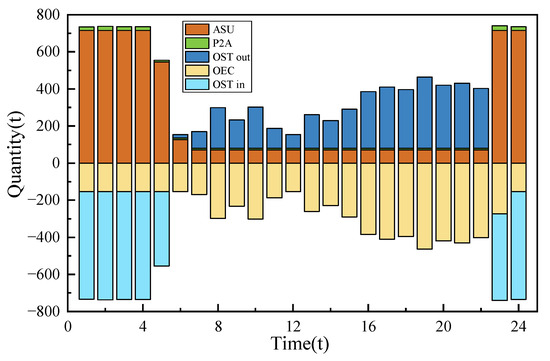
Figure 9.
Oxygen balance.

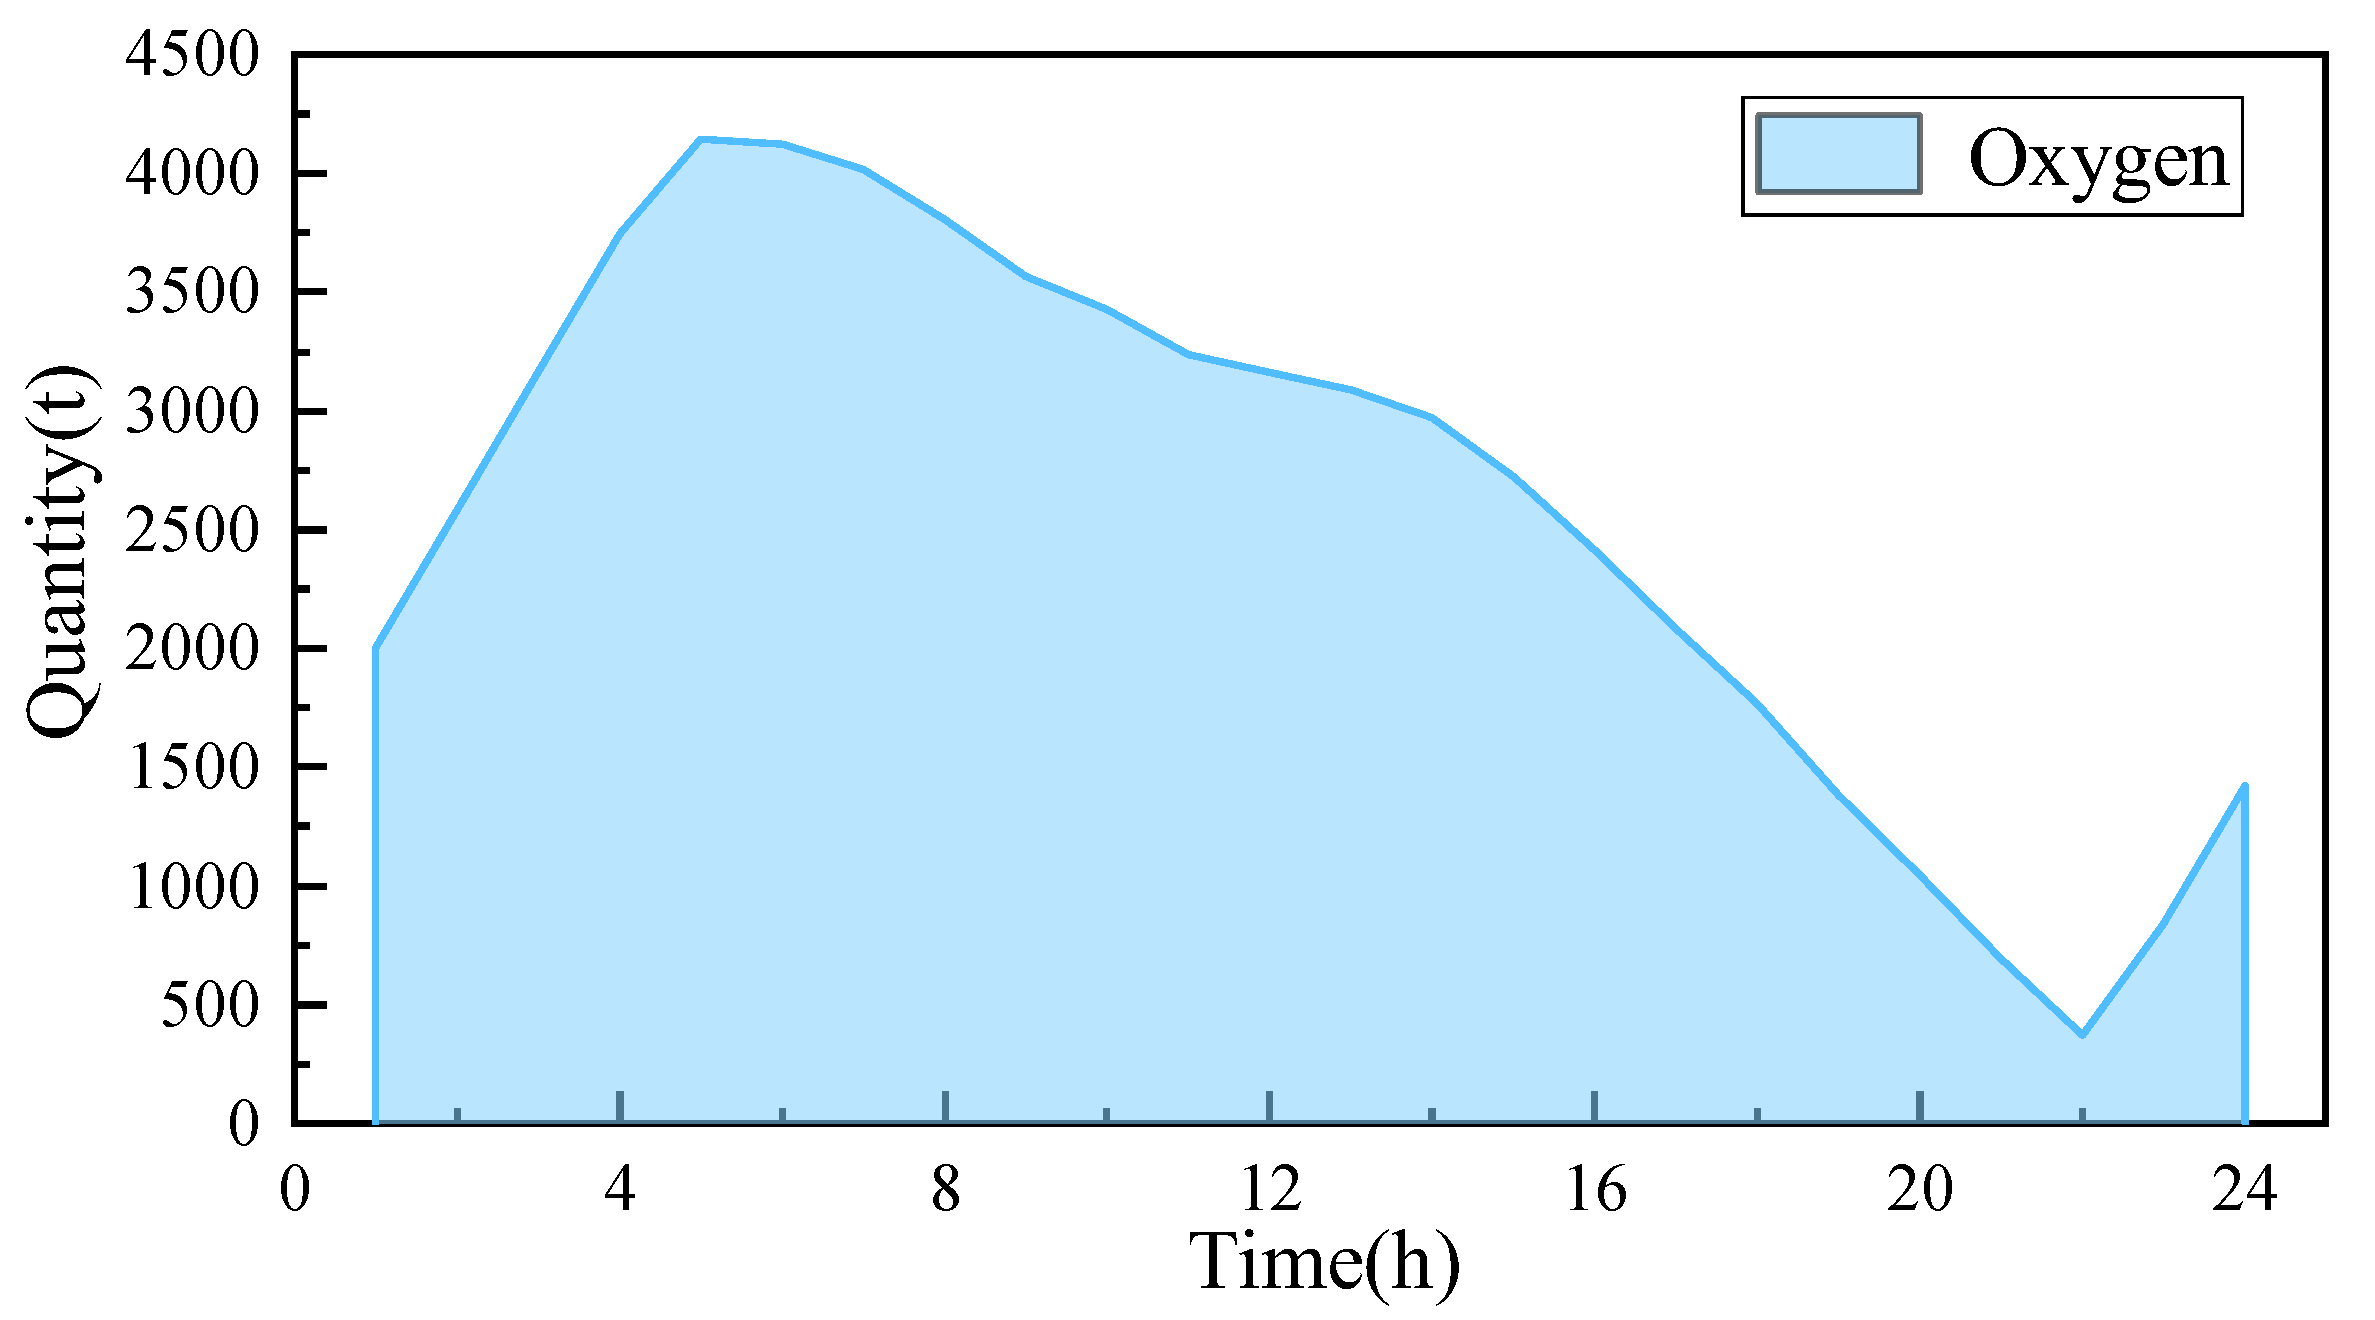
Figure 10.
Oxygen storage quantity.
From Figure 9 and Figure 10, it can be seen that at 23:00–5:00, the renewable energy was more abundant, the demands were lower, the ASU generated a large amount of oxygen to consume the renewable energy and, at this time, the oxygen-enriched combustion power plant had a lower output, the oxygen consumption was maintained at a lower level, the OEC could not consume all the oxygen, and a large amount of oxygen was deposited in the oxygen storage tank (OST). At 6:00–22:00, the system demands started to rise; the oxy-fuel plant needed to increase the net output to supply the system demands, and, at this time, the ASU operated at the lowest power, and a large amount of oxygen consumed by the system came from the OST. The quantity of oxygen flowing into and out of the OST was the same in each dispatch cycle so as to maintain the balance of the storage capacity.
The by-product of oxygen in the ammonia synthesis process was provided to the oxygen-enriched combustion plant as feedstock to improve energy utilization and reduce operating costs. At 23:00–5:00, the ammonia plant synthesized more ammonia and produced relatively more oxygen. During the whole scheduling process, the ammonia plant provided a total of 285 tons of oxygen.
In summary, the advantage of the oxygen-enriched combustion power plant when participating in the scheduling is reflected in its shifting demand characteristics, which utilizes the ASU to produce oxygen during the demands valley or renewable energy so as to fill in the valley of the demands or consume the abandoned wind and solar energy; it utilizes the OST to discharge the oxygen during the peak demand period or when the renewable energy is small, and the ASU operates in the range of the lowest energy consumption, which does not affect the net output of the OEC power plant.
4.2.6. Ammonia Balance and Storage Analysis
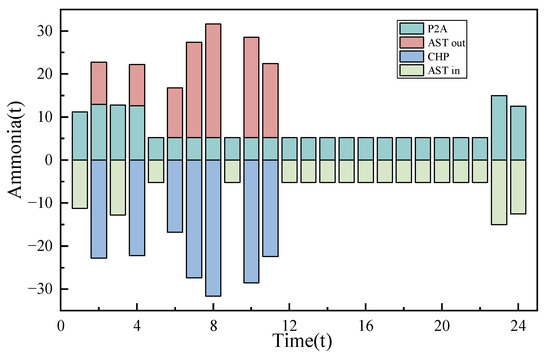
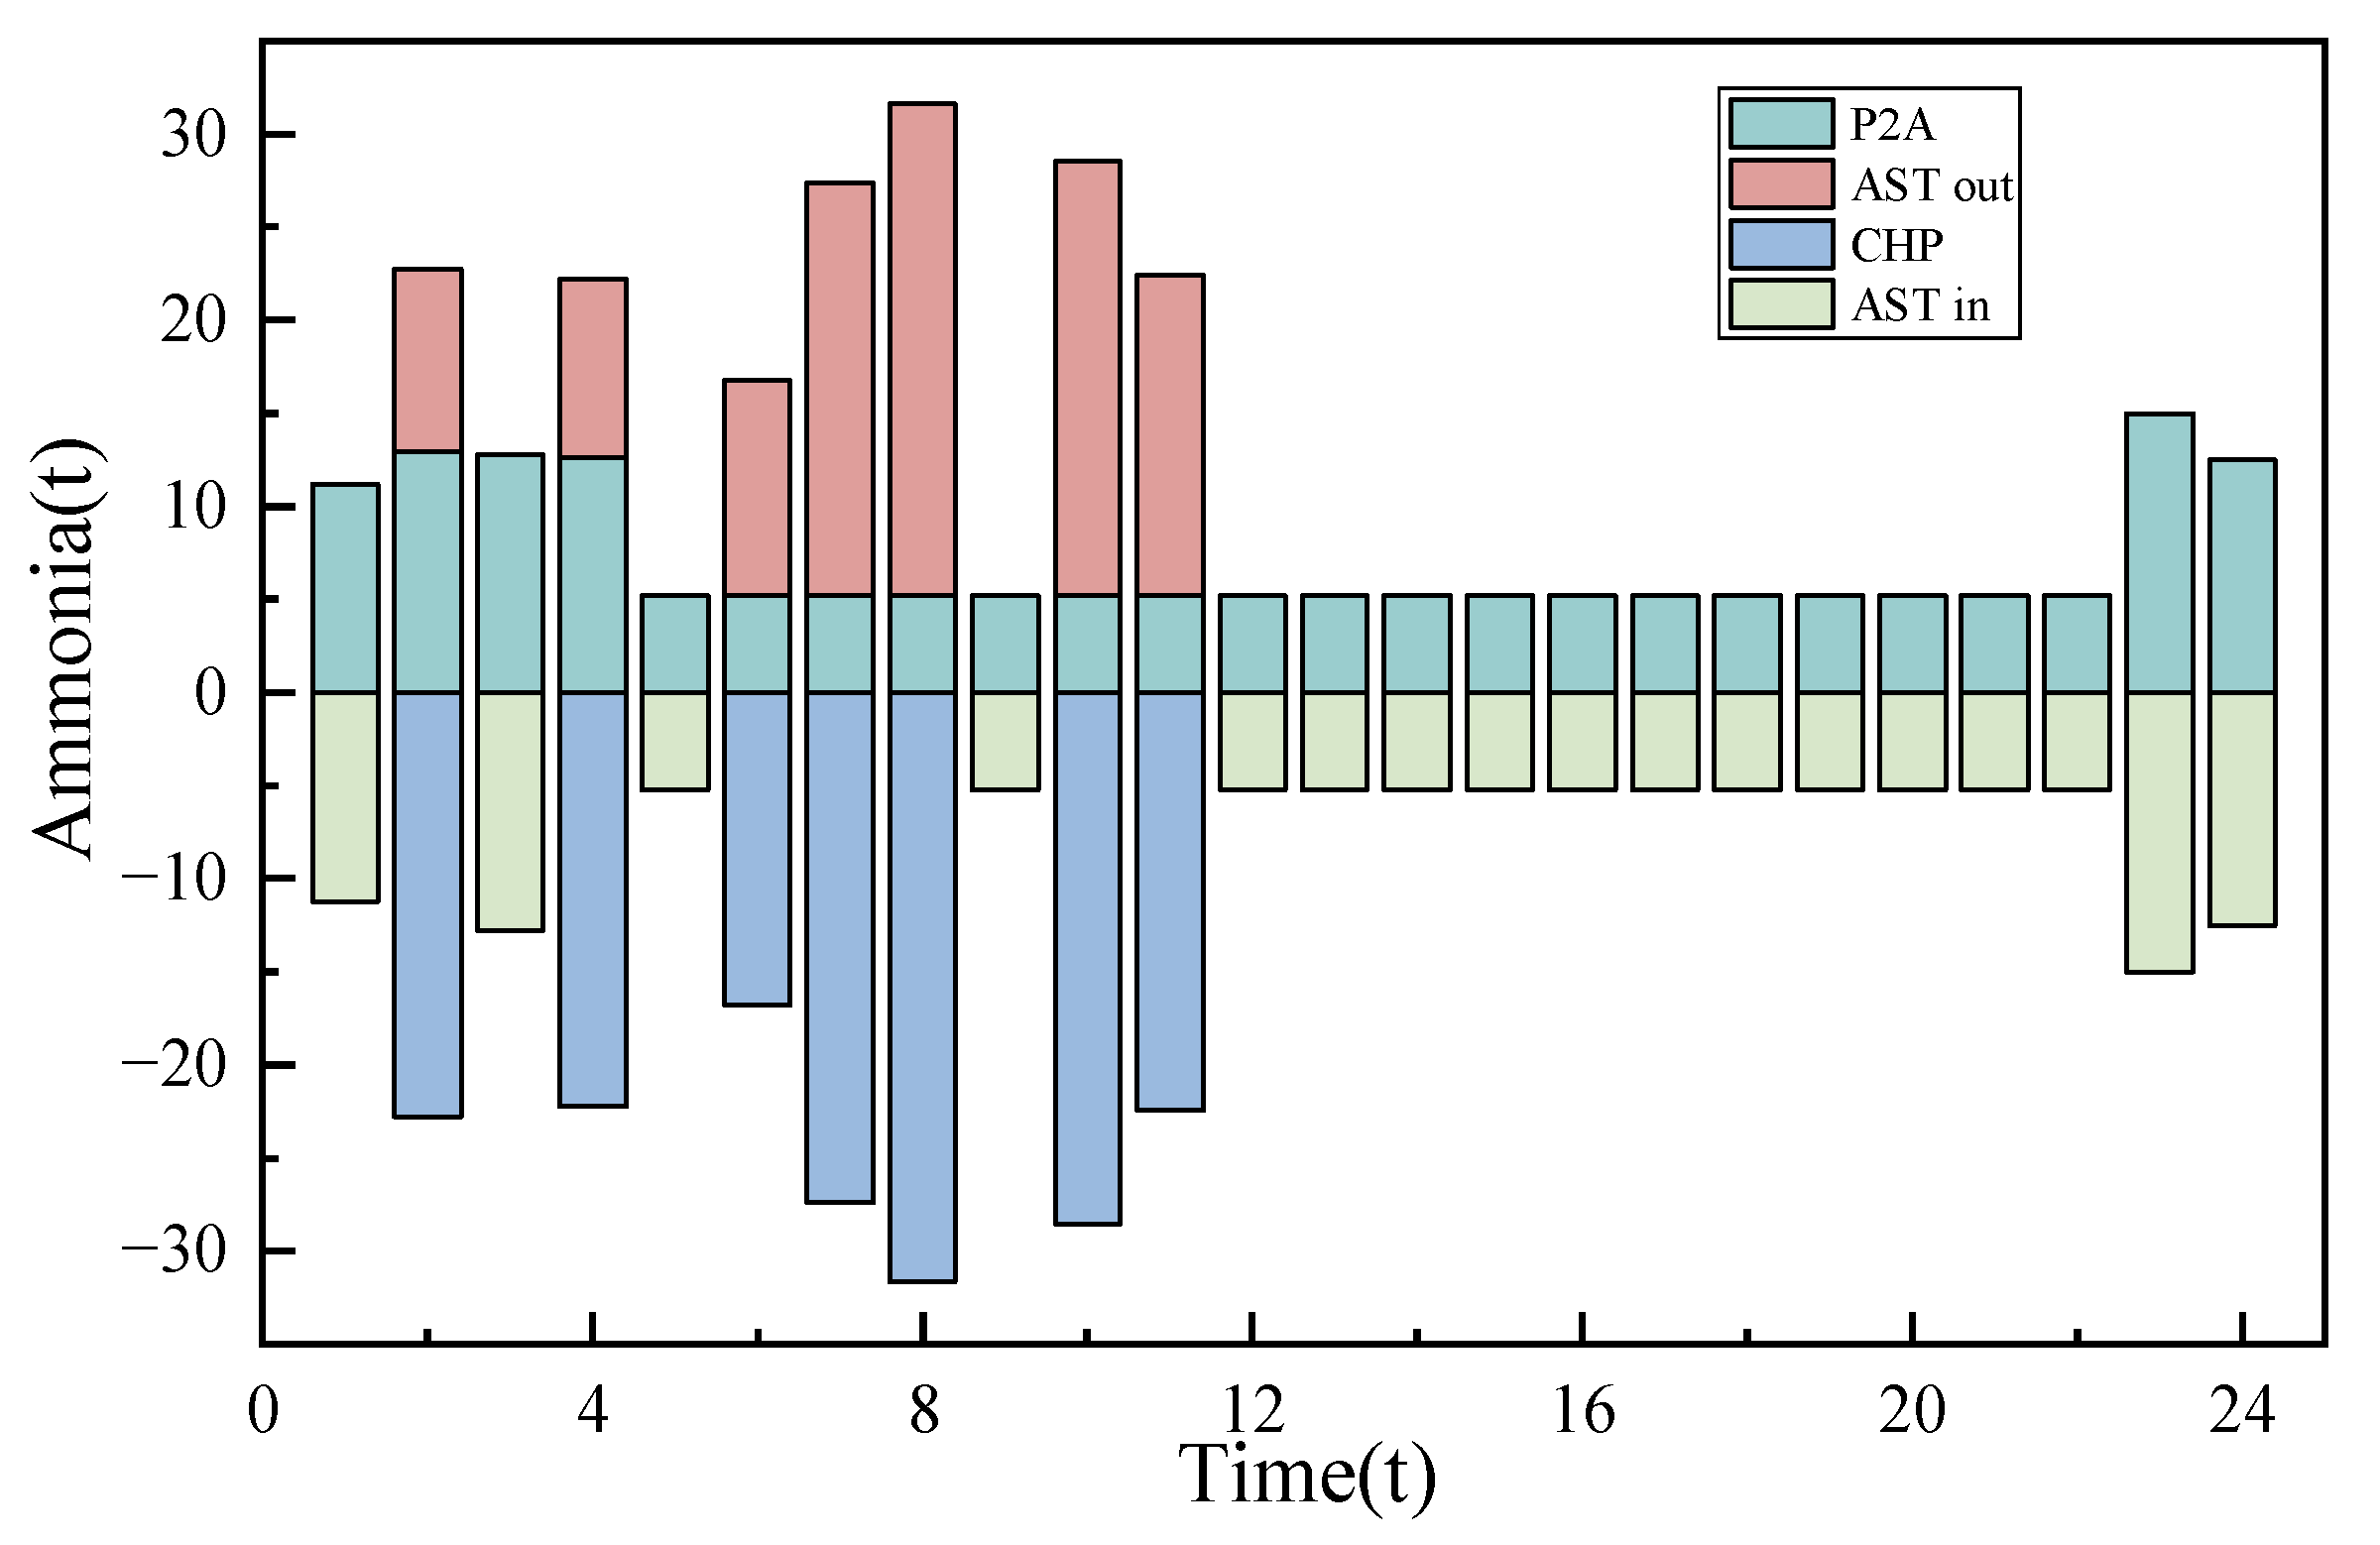
Figure 11.
Ammonia balance.
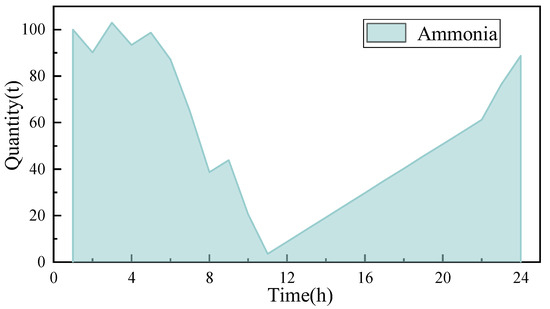
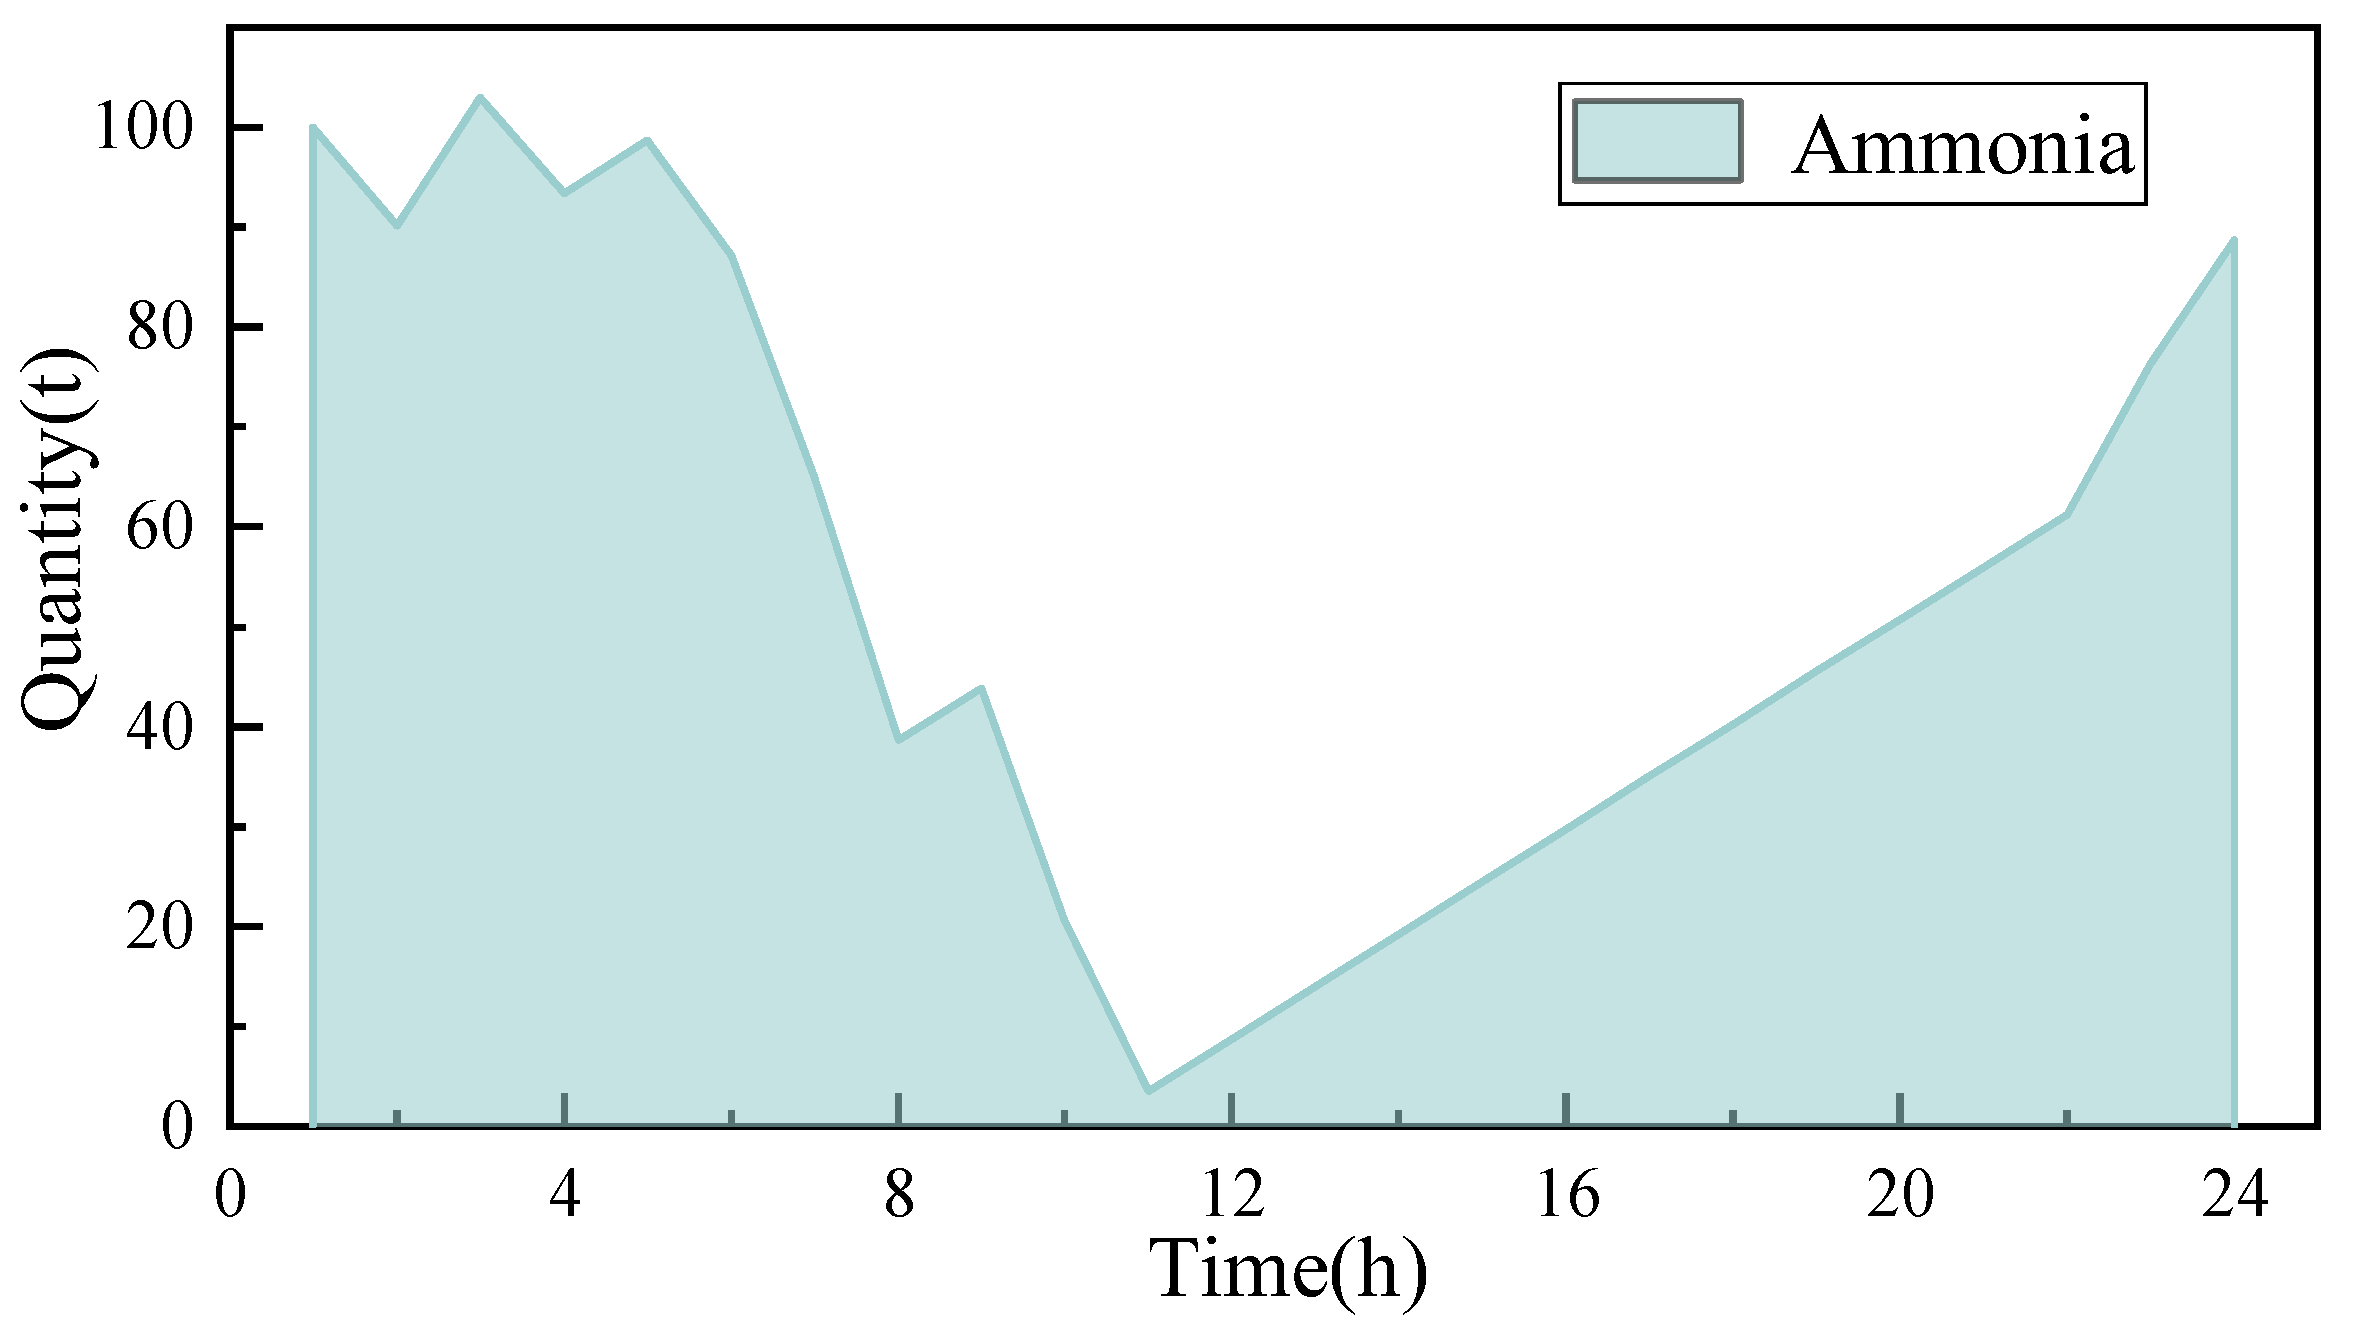
Figure 12.
Ammonia storage quantity.
As shown in Figure 11 and Figure 12, renewable energy was more abundant from 23:00 to 4:00, when the ammonia plant synthesized ammonia in large quantities and consumed surplus renewable energy. From 5:00 to 22:00, the production of ammonia was maintained at a low level to allow the system to use more power to supply other demands. At 2:00–11:00, large amounts of ammonia were mixed into the CHP instead of coal, and the ammonia storage tank (AST) provided ammonia when there was a shortage of ammonia produced. At 12:00–1:00, CHP did not consume ammonia, and the ammonia in the AST gradually increased. The mass of ammonia flowing into the AST and out of the AST was the same at each dispatching cycle, keeping the storage capacity in balance. Throughout the dispatching process, the ammonia plant produced 172 tons of ammonia, which was equivalent to a reduction of 359 tons of carbon emissions.
4.2.7. Renewable Energy Utilization Analysis
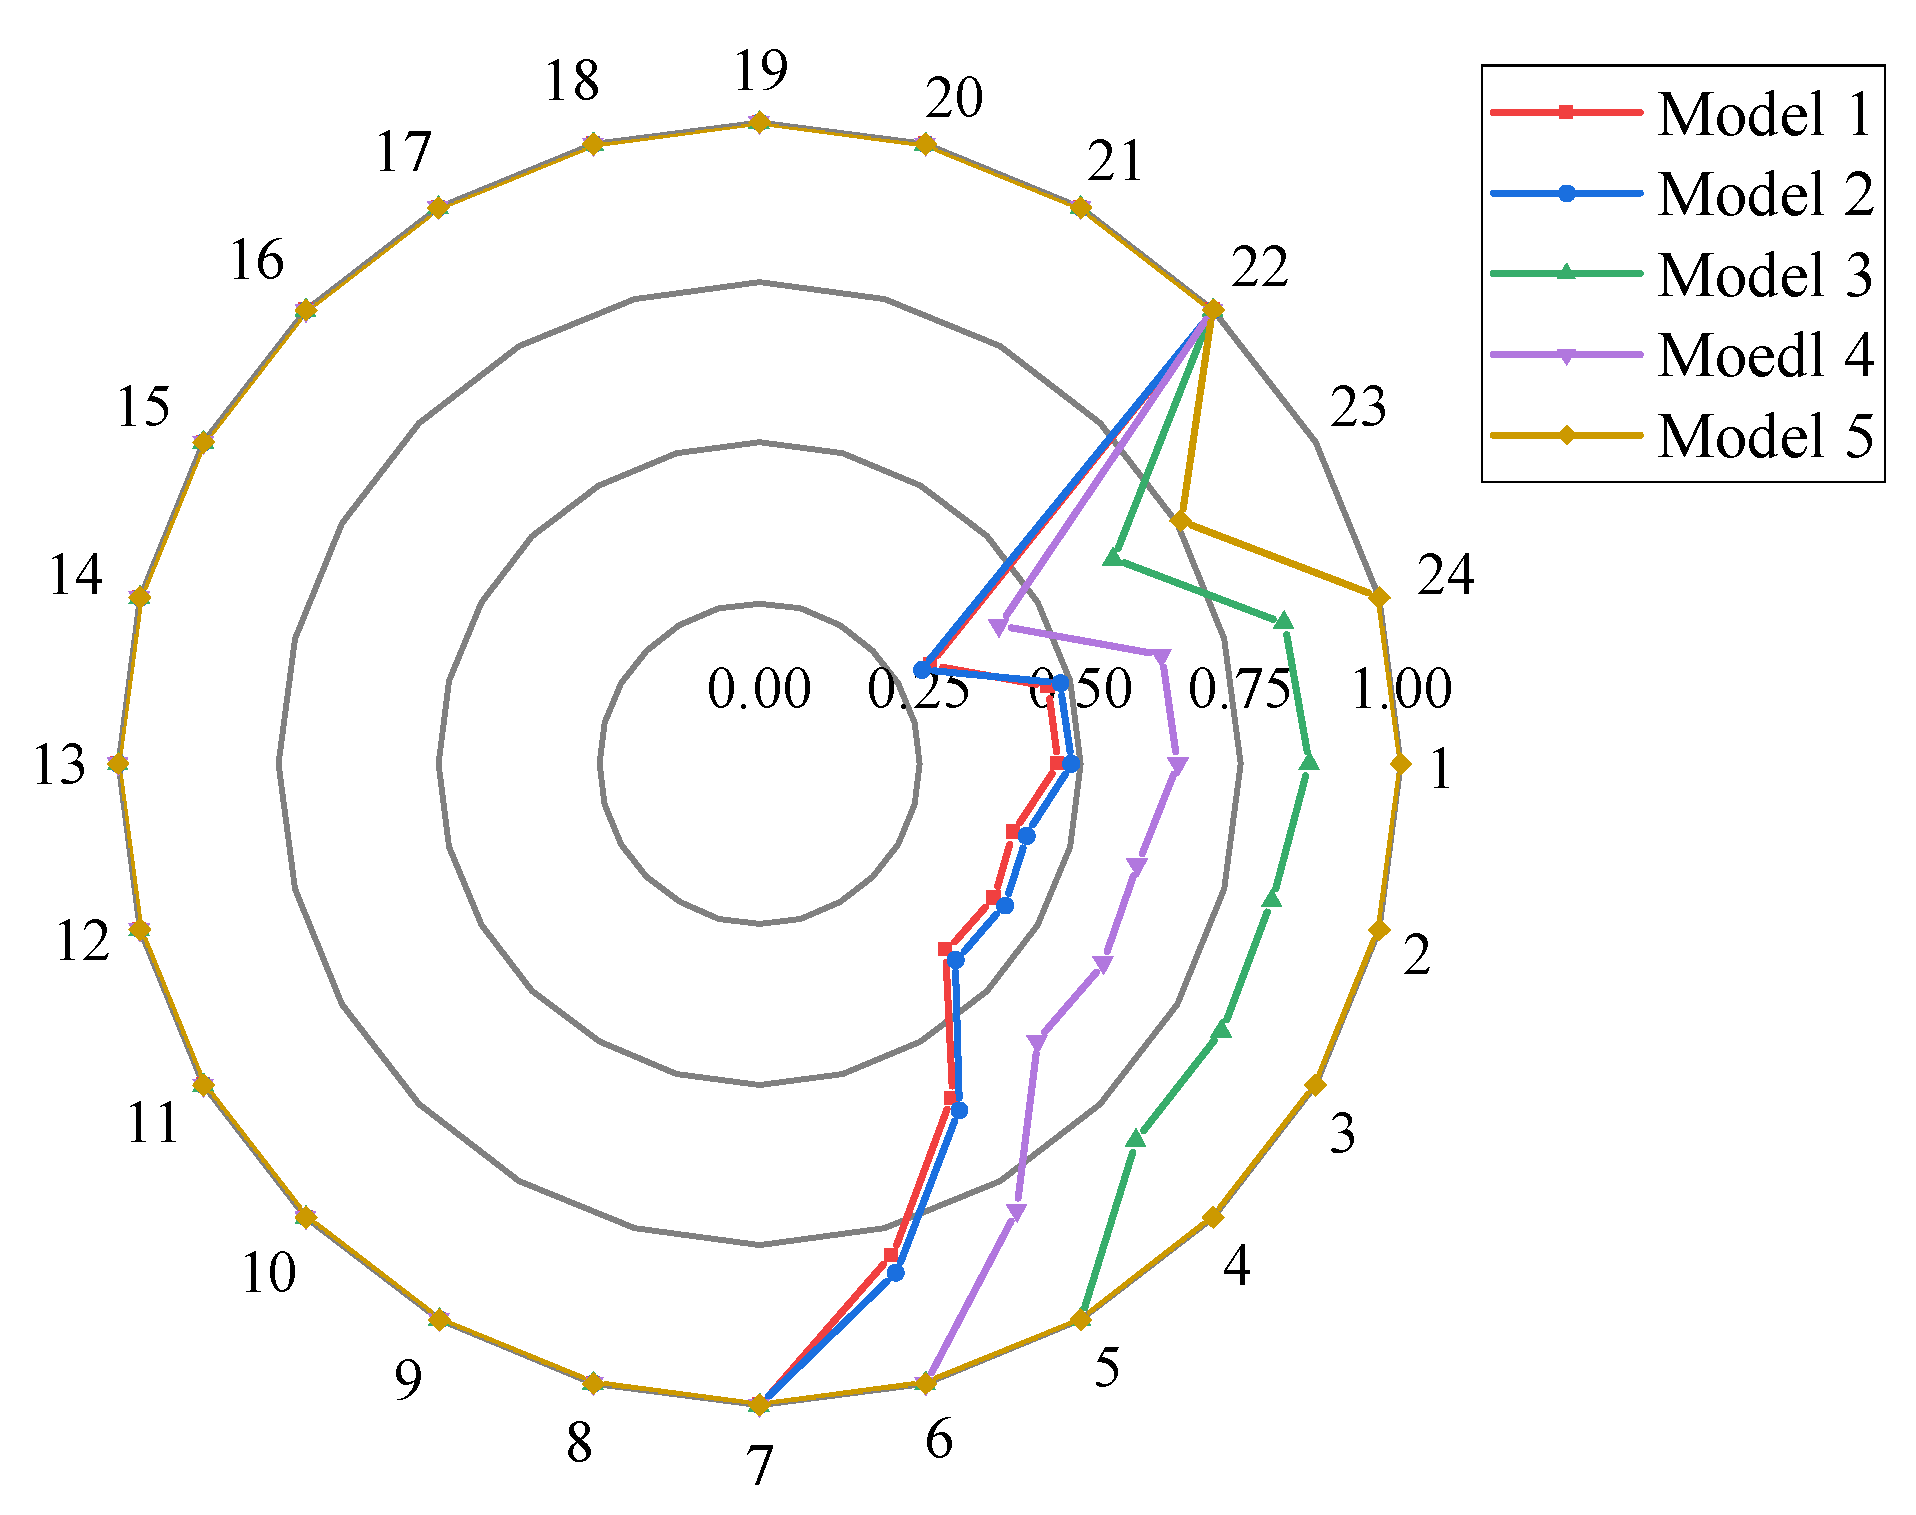
The renewable energy utilization rates of each model are shown in Figure 13.
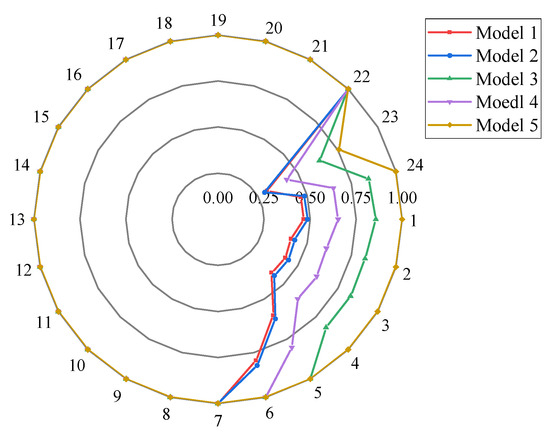
Figure 13.
Renewable energy utilization rate.
As shown in Figure 13, at 7:00–22:00, all the renewable energy in each model was consumed due to the high demands of the system. CCS was added in Model 2, which operated with relatively small power and consumed limited renewable energy. OEC and P2A were introduced in Model 5, which had the strongest renewable energy consumption capacity among the five models, and the renewable energy utilization reached 100% at 24:00–22:00, and the renewable energy utilization reached 98.75% during the whole dispatch process.
4.2.8. Carbon Emissions Analysis
The carbon emissions of Models 1, 2 and 5 are shown in Figure 14.
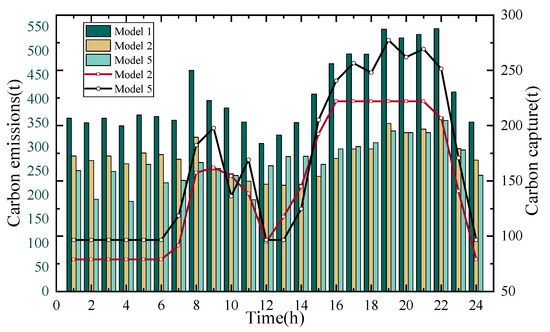
Figure 14.
Carbon emissions of Models 1, 2 and 5.
As shown in Figure 14, Model 1 without the CCS device had significantly higher carbon emissions than Model 2 and Model 5. Due to the fact that oxygen-enriched combustion technology can improve carbon capture efficiency and reduce the energy consumption of carbon capture, the carbon capture capacity of Model 5 is stronger than that of Model 2, which is captured by using common post-combustion capture. At 16:00–22:00, the power generation power of the CFPP was higher, the carbon emissions were larger, and the CCS operation power was also higher. During the whole dispatch process, the carbon capture device of Model 5 captured a total of 3981 tons of carbon dioxide.
5. Conclusions
This paper studies the low-carbon economic dispatch of a virtual power plant based on OEC and P2A. First, the OEC model and P2A model were established to consume the system’s renewable energy abandonment and reduce carbon emissions. Then, the model variables and constraints were described in detail. Finally, through the comparison and analysis of the five models, the following conclusions can be drawn:
- The combined operation strategy of OEC and P2A can effectively improve the economy and low carbon performance of the system and increase the utilization rate of renewable energy. Its total operating cost, carbon emission, and renewable energy utilization rate are better than the models without or with OEC or P2A alone. In the typical day scenario of this paper, its total cost and carbon emissions decreased by 10.95% and 34.79%, respectively, and renewable energy utilization increased by 19.4%;
- Compared with ordinary post-combustion capture technology, oxygen-enriched combustion has stronger carbon capture efficiency and a larger net output range, which enhances the flexibility of the system operation and can effectively consume abandoned renewable energy. Compared with Model 2, Model 5 reduces carbon emissions by 4.24% and increases the utilization rate of renewable energy by 18.74%;
- P2A can effectively consume renewable energy and ammonia as a zero-carbon fuel instead of coal combustion and can reduce system carbon emissions. The waste heat generated in the ammonia synthesis process can supply the system heat demands, and the oxygen generated can be provided to the oxygen-enriched combustion power plant, providing energy utilization and reflecting the complementary nature of P2A and OEC. During the whole dispatch process, the P2A provided a total of 275.44 MWh of heat energy and 285 tons of oxygen.
In summary, the conclusions drawn in this paper can provide a basis for a low-carbon economic dispatch scheme for virtual power plants based on the combined operation of OEC and P2A. This paper only investigates the dispatching strategy of the virtual power plant under specific conditions, and the investment cost and operation cost of each module in the system need to be further improved in future studies. This paper only investigates the dispatch within a single typical day as the cycle, and the dispatch in inter-seasonal energy storage under electricity–hydrogen–ammonia coupling needs to be considered in future studies to investigate the advantages of ammonia in long-term energy storage. The operational status of thermal units was not considered in this study, and the role of OEC and P2A in improving the deep-peaking performance of thermal units will be investigated in future studies.
Author Contributions
Conceptualization, J.H. and Z.M.; methodology, Z.M.; software, Z.M., B.Z., and J.X.; validation, Z.M. and J.X.; formal analysis, Z.M.; investigation, Z.M.; resources, Z.M.; data curation, Z.M. and Z.Z.; writing—original draft preparation, Z.M.; writing—review and editing, J.H. and W.H.; visualization, Z.M. and X.L.; supervision, J.H.; project administration, J.H.; funding acquisition, J.H and W.H. All authors have read and agreed to the published version of the manuscript.
Funding
This research received no external funding.
Institutional Review Board Statement
Not applicable.
Informed Consent Statement
Not applicable.
Data Availability Statement
The data presented in this study are available on request from the corresponding author.
Conflicts of Interest
The authors declare no conflicts of interest.
References
- Zhou, X.; Zhao, Q.; Zhang, Y.; Sun, L. Integrated energy production unit: An innovative concept and design for energy transition toward low-carbon development. CSEE J. Power Energy Syst. 2021, 7, 1133–1139. [Google Scholar]
- Nosratabadi, S.M.; Hooshmand, R.A.; Gholipour, E. A comprehensive review on microgrid and virtual power plant concepts employed for distributed energy resources scheduling in power systems. Renew. Sustain. Energy Rev. 2017, 67, 341–363. [Google Scholar]
- Asmus, P. Microgrids, virtual power plants and our distributed energy future. Electr. J. 2010, 23, 72–82. [Google Scholar] [CrossRef]
- Pedrasa, M.A.A.; Spooner, T.D.; MacGill, I.F. A novel energy service model and optimal scheduling algorithm for residential distributed energy resources. Electr. Power Syst. Res. 2011, 81, 2155–2163. [Google Scholar] [CrossRef]
- Kuiper, G. What Is the State of Virtual Power Plants in Australia? From Thin Margins to a Future of VPP-Tailers. 2022. Available online: https://ieefa.org/wp-content/uploads/2022/03/What-Is-the-State-of-Virtual-Power-Plants-in-Australia_March-2022_2.pdf (accessed on 26 January 2024).
- Sarmiento-Vintimilla, J.C.; Torres, E.; Larruskain, D.M.; Pérez-Molina, M.J. Applications, Operational Architectures and Development of Virtual Power Plants as a Strategy to Facilitate the Integration of Distributed Energy Resources. Energies 2022, 15, 775. [Google Scholar] [CrossRef]
- Paavilainen, E. Aggregated Demand Response in a Virtual Power Plant: A Finnish Case Study; Aalto University: Espoo, Finland, 2020. [Google Scholar]
- Virtual Power Plant Reaches 1000 MW in Poland—Modern Power Systems. Available online: https://www.modernpowersystems.com/news/newsvirtual-power-plant-reaches-1000-mw-in-poland-9097170 (accessed on 13 October 2021).
- Zhang, Z.; Du, J.; Li, M.; Guo, J.; Xu, Z.; Li, W. Bi-level optimization dispatch of integrated-energy systems with P2G and carbon capture. Front. Energy Res. 2022, 9, 784703. [Google Scholar] [CrossRef]
- Yadav, S.; Mondal, S.S. A review on the progress and prospects of oxy-fuel carbon capture and sequestration (CCS) technology. Fuel 2022, 308, 122057. [Google Scholar] [CrossRef]
- Feng, C.; Lin, T.; Zhu, R.; Wei, G.; Dong, K. Key technologies for CO2 capture and recycling after combustion: CO2 enrichment in oxygen enriched combustion of converter gas. J. Clean. Prod. 2022, 380, 135128. [Google Scholar] [CrossRef]
- Daming, G.; Hongwei, C.; Junjie, G. Flue gas dynamic characteristics and operation economic analysis of oxy-fuel combustion circulating fluidized bed boiler. Proc. CSEE 2014, 34, 112–121. [Google Scholar]
- Favre, E.; Bounaceur, R.; Roizard, D. A hybrid process combining oxygen enriched air combustion and membrane separation for post-combustion carbon dioxide capture. Sep. Purif. Technol. 2009, 68, 30–36. [Google Scholar] [CrossRef]
- Yang, C.U.; Peng, Z.E.; Wuzhi, Z.H.; Zheng, W.A.; Peng, Z.H.; Yuting, Z.H. Low-carbon economic dispatch of electro-gas-thermal integrated energy system based on oxy-combustion technology. Proc. CSEE 2021, 41, 592–608. [Google Scholar]
- Yun, Y.; Zhang, D.; Yang, S.; Li, Y.; Yan, J. Low-carbon optimal dispatch of integrated energy system considering the operation of oxy-fuel combustion coupled with power-to-gas and hydrogen-doped gas equipment. Energy 2023, 283, 129127. [Google Scholar] [CrossRef]
- Li, J.; Chen, S.; Wu, Y.; Wang, Q.; Liu, X.; Qi, L.; Lu, X.; Gao, L. How to make better use of intermittent and variable energy? A review of wind and photovoltaic power consumption in China. Renew. Sustain. Energy Rev. 2021, 137, 110626. [Google Scholar] [CrossRef]
- Akram, U.; Nadarajah, M.; Shah, R.; Milano, F. A review on rapid responsive energy storage technologies for frequency regulation in modern power systems. Renew. Sustain. Energy Rev. 2020, 120, 109626. [Google Scholar] [CrossRef]
- Yi, Z.; Chen, Z.; Yin, K.; Wang, L.; Wang, K. Sensing as the key to the safety and sustainability of new energy storage devices. Prot. Control Mod. Power Syst. 2023, 8, 1–22. [Google Scholar] [CrossRef]
- Ge, L.; Zhang, B.; Huang, W.; Li, Y.; Hou, L.; Xiao, J.; Mao, Z.; Li, X. A review of hydrogen generation, storage, and applications in power system. J. Energy Storage 2024, 75, 109307. [Google Scholar] [CrossRef]
- Ozawa, A.; Kudoh, Y.; Kitagawa, N.; Muramatsu, R. Life cycle CO2 emissions from power generation using hydrogen energy carriers. Int. J. Hydrogen Energy 2019, 44, 11219–11232. [Google Scholar] [CrossRef]
- Xu, Y.; Wang, H.; Liu, X.; Zhu, J.; Xu, J.; Xu, M. Mitigating CO2 emission in pulverized coal-fired power plant via co-firing ammonia: A simulation study of flue gas streams and exergy efficiency. Energy Convers. Manag. 2022, 256, 115328. [Google Scholar] [CrossRef]
- Siddiqui, O.; Dincer, I. A new solar energy system for ammonia production and utilization in fuel cells. Energy Convers. Manag. 2020, 208, 112590. [Google Scholar] [CrossRef]
- Zhao, F.; Li, Y.; Zhou, X.; Wang, D.; Wei, Y.; Li, F. Co-optimization of decarbonized operation of coal-fired power plants and seasonal storage based on green ammonia co-firing. Appl. Energy 2023, 341, 121140. [Google Scholar] [CrossRef]
- Zhou, B.; Zhu, W.; Zhu, J.; Qiu, Y.; Cang, T.; He, G.; Chen, G. Multi-stage Dispatchable Region Analysis of Wind and Solar Power-based Hydrogen Production and Ammonia Synthesis System. Proc. CSEE 2024, 44, 160–173. [Google Scholar]
- Yuan, W.; Chen, L.; Wang, C.; Wang, Z. Bi-level Optimal Scheduling of Power-to-ammonia Coupling Wind-photovoltaic-thermal Integrated Energy System Based on Ammonia Energy Storage Technology. Proc. CSEE 2023, 43, 6992–7002. [Google Scholar]
- Xiong, K.; Hu, W.; Cao, D.; Li, S.; Zhang, G.; Liu, W.; Huang, Q.; Chen, Z. Coordinated energy management strategy for multi-energy hub with thermo-electrochemical effect based power-to-ammonia: A multi-agent deep reinforcement learning enabled approach. Renew. Energy 2023, 214, 216–232. [Google Scholar] [CrossRef]
- Sun, Y.; Li, Z.; Wang, Q.; Zhang, J.; Kong, H. Low carbon pathway and life cycle assessment of ammonia co-firing in coal power plants under the context of carbon neutrality. Energy Convers. Manag. 2023, 296, 117648. [Google Scholar] [CrossRef]
- Wen, Y.; Da, Z.; Xiao, W.; Ping, N.; Jing, H. Optimization of low-carbon operation of an integrated electric heat and gas energy system considering a photovoltaic power plant and oxygen-enriched combustion capture technology. Trans. China Electrotech. Soc. 2023, 38, 6709–6726. [Google Scholar]
- Peng, C.; Bian, X.; Jin, H.; Lin, S.; Xu, B.; Zhao, J. Two-Stage Optimal Dispatch for Integrated Energy System with Oxy-combustion Based on Multi-Energy Flexibility Constraints. J. Shanghai Jiaotong Univ. 2023, 1–24. [Google Scholar] [CrossRef]
- Guo, Z.; Wei, W.; Chen, L.; Shahidehpour, M.; Mei, S. Distribution system operation with renewables and energy storage: A linear programming based multistage robust feasibility approach. IEEE Trans. Power Syst. 2021, 37, 738–749. [Google Scholar] [CrossRef]
- Palys, M.J.; Kuznetsov, A.; Tallaksen, J.; Reese, M.; Daoutidis, P. A novel system for ammonia-based sustainable energy and agriculture: Concept and design optimization. Chem. Eng. Process. Process Intensif. 2019, 140, 11–21. [Google Scholar] [CrossRef]
- Ishaq, H.; Dincer, I. Dynamic modelling of a solar hydrogen system for power and ammonia production. Int. J. Hydrogen Energy 2021, 46, 13985–14004. [Google Scholar] [CrossRef]
- Ito, T.; Zhang, J.; Ishihara, S.; Ishii, H.; Suda, T.; Fujimori, T. Development of the coal co-firing technology with ammonia and numerical evaluation of the boiler performance. J. Combust. Soc. Jpn. 2019, 61, 304–308. [Google Scholar]
- Zhang, G.; Wang, W.; Chen, Z.; Li, R.; Niu, Y. Modeling and optimal dispatch of a carbon-cycle integrated energy system for low-carbon and economic operation. Energy 2022, 240, 122795. [Google Scholar] [CrossRef]
- Tan, Q.; Ding, Y.; Zheng, J.; Dai, M.; Zhang, Y. The effects of carbon emissions trading and renewable portfolio standards on the integrated wind–photovoltaic–thermal power-dispatching system: Real case studies in China. Energy 2021, 222, 119927. [Google Scholar] [CrossRef]


Disclaimer/Publisher’s Note: The statements, opinions and data contained in all publications are solely those of the individual author(s) and contributor(s) and not of MDPI and/or the editor(s). MDPI and/or the editor(s) disclaim responsibility for any injury to people or property resulting from any ideas, methods, instructions or products referred to in the content. |
© 2024 by the authors. Licensee MDPI, Basel, Switzerland. This article is an open access article distributed under the terms and conditions of the Creative Commons Attribution (CC BY) license (https://creativecommons.org/licenses/by/4.0/).