Article

Multi-Scale Analysis of Spatial and Temporal Evolution of Carbon Emissions in Yangtze River Economic Belt and Study of Decoupling Effects

College of Water Conservancy & Architectural Engineering, Shihezi University, Shihezi 832000, China
*
Author to whom correspondence should be addressed.
Sustainability 2024, 16(10), 4222; https://doi.org/10.3390/su16104222
Submission received: 26 April 2024 / Revised: 13 May 2024 / Accepted: 13 May 2024 / Published: 17 May 2024

Abstract

:
An in-depth, longitudinal examination of carbon emissions and decoupling within the Yangtze River Economic Belt, supplemented by a dynamic assessment of its evolutional trajectory, provides a scientifically grounded framework and pragmatic value for the drafting of regional carbon emission mitigation strategies. Using the Yangtze River Economic Belt as a context, this study formulates a carbon emission model spanning provincial, city, and county levels. The model serves to uncover the spatiotemporal characteristics of carbon emissions within the Yangtze River Economic Belt from a multi-scalar vantage point. The Tapio decoupling model is then invoked to examine the extent and nature of decoupling between economic advancement and carbon emissions across these disparate scales. The outcomes divulge the following: (1) At the provincial echelon, the progression of carbon emissions born from energy consumption within the Yangtze River Economic Zone presents an escalating then stabilizing trend line. The carbon emissions growth rate transitions from a swift ascension of 8.44 percent initially, subsequently tapering to a moderate increment of 0.42 percent at the period’s culmination. The trajectory of carbon decoupling at the provincial scale tends to be generally propitious. (2) At the municipal scale, the overall carbon emission level shows a gradual upward trend, and then gradually forms a pattern of centripetal aggregation and peripheral diffusion. The decoupling status during the study period is mainly weak and strong decoupling, with the number of weak decoupling showing a fluctuating change in increasing and then decreasing, while the strong decoupling shows a slow and orderly growth trend, and is mainly distributed in most of the municipalities in Jiangsu, Zhejiang, and Shanghai. (3) At the county scale, centripetal aggregation and peripheral diffusion were already present at the beginning of the study period, followed by the gradual expansion and formation of several carbon emission centers of different sizes. The temporal evolution of county-level decoupling is more significant, with weak and strong decoupling dominating the county-scale decoupling during the study period, especially in the upper and middle reaches of the Yangtze River Economic Belt, but the overall trend shows signs of gradual decoupling.

1. Introduction

The conundrum of global warming creates profound repercussions for the sustainability of human societies [1], thus foregrounding low-carbon development as a pivotal strategic response to climate change. This incorporates considerable attention from both social and scientific spheres [2,3,4]. With China’s expedited industrialization and urbanization processes coupled with a reliance on fossil fuels for economic growth, a significant quantity of carbon emissions has ensued [5]. Consequently, its share of global carbon emissions has proliferated from 10.9% in 1990 to 28.87% in 2022 [6]. Therefore, the elemental development model, predominantly adopted in China’s energy-consuming regions [7], confronts formidable challenges necessitating region-specific emission reduction strategies. The Yangtze River Economic Belt (YREB)—recognized as a principal hub of economic and social development in China [8]—has aspirated into the most significant source of carbon emissions, largely propelled by urbanization and industrialization processes, and contributing approximately 37.5% of the country’s total carbon emissions [9]. As China prioritizes high-quality development and ecological preservation as key national strategies, the YREB shoulders an inescapable obligation and tremendous pressure to curtail emissions [10]. The individual provinces within the YREB display diverse developmental traits and exhibit considerable energy consumption and resource allocation disparities [11]. Therefore, undertaking differentiated carbon emission reduction policies [12], optimizing the utilization of specific advantageous resources, accentuating green development, reconfiguring industrial structures, and fostering economic sustainability are imperatives for the YREB’s attainment of high-quality development [13].
A collection of academic investigations dedicate their focus to analyzing the spatiotemporal evolution of carbon emissions across various scales or elucidating the interplay between economic growth and carbon emissions singularly, from a specified scale [14,15,16]. Concerning the spatiotemporal developments of carbon emissions, research undertaken at the urban agglomeration scale has reached substantial maturity. Meng et al. [17], focusing on the Yangtze River Delta, Beijing–Tianjin–Hebei, and the Pearl River Delta, constructed panel data for 75 cities within these three major Chinese urban agglomerations to analyze the spatial and temporal evolution of carbon emissions from 2005 to 2020. The analysis reveals a consistent increase in carbon emissions and a notable shift in the spatial distribution of these agglomerations, which exhibit significant spatial correlations. Simultaneously, Wang et al. [18] calculate the spatial structure index of six urban agglomerations in China based on population and economy using the rank-size rule. The Geographically and Temporally Weighted Regression model is then applied to scrutinize the spatial and temporal disparities in the impact of spatial structure on carbon emissions across various urban agglomerations. The findings unveil the carbon emissions of the Yangtze River Delta. Regarding municipal-scale studies, Wang et al. [19] assess the carbon emission efficiency of 61 cities in the Yellow River Basin from 2004 to 2018 using the super-efficient Slack-Based Measure model and examine the spatial and temporal heterogeneity and spillover effects of the new carbon emission efficiency values using empirical orthogonal functions and spatial autoregressive models. The study finds that Gross Domestic Product (GDP) per capita and government involvement positively correlate with carbon emission efficiency, while GDP per capita squared, energy intensity, and industrial structure show a negative correlation with carbon emission efficiency [20]. At the county level, Liu et al. [21] investigated the spatiotemporal dynamic evolution of carbon emission intensity (CEI) across 41 counties in Qinghai Province using nonparametric kernel density estimation, spatial Markov chain, and spatial variational function models. They also assessed the effectiveness of CEI reduction strategies by applying correction coefficients. The analysis revealed that while the CEI of most counties exhibited a declining trend, a few counties experienced an unstable increase in CEI during the study period. Regarding the relationship between economic development and carbon emission decoupling status, existing studies primarily concentrate on national [22,23,24,25], provincial [26,27], and municipal scales [28,29,30,31], with less attention being paid to an integrated exploration across multiple, district, and county scales [32]. In general, research on the spatiotemporal characteristics of carbon emissions and the decoupling relation between economic growth and carbon emissions at individual scales has achieved a certain degree of maturity; however, a relative dearth persists for the multi-scalar exploration [33,34].
Consequently, this study intends to investigate the spatiotemporal evolution characteristics of carbon emissions at various scales within the Yangtze River Economic Belt, spanning provincial, urban, and county levels. It aims to dissect differences in the spatial structure of carbon emissions across these scales and simultaneously apply the Tapio decoupling model to delineate the decoupling status between economic growth and carbon emissions, viewed from a multi-scalar perspective. This approach generates scale-specific policy recommendations for the Yangtze River Economic Belt. Additionally, the usage of the Tapio decoupling model to analyze the decoupling phenomena between economic growth and carbon emissions from a multi-scale standpoint aims to formulate appropriate policy recommendations that pertain to diverse scales within the Yangtze River Economic Zone. This initiative possesses substantial relevance to ensuring high-quality development for the Yangtze River Economic Zone alongside fostering an ecological civilization.

2. Data Sources and Research Methodology

2.1. Study Area

The Yangtze River Economic Belt (YREB) extends over the eastern, central, and western sectors of China, incorporating a vast majority of cities and municipalities within the Yangtze River Basin. Bearing in mind the available data, this study chose a selection of areas within the YREB: Chongqing, Yunnan, Sichuan, and Guizhou from its upper reaches; Jiangxi, Hunan, and Hubei from the middle stretches; and Shanghai, Jiangsu, Zhejiang, and Anhui from the lower reaches (as depicted in Figure 1). The comprehensive sample includes an aggregate of 11 provinces and autonomous regions, 130 municipally governed cities, and 1071 county-level administrative divisions.

2.2. Sources of Data

(1) The DMSP-OLS (Defense Meteorological Satellite Program Operational Line Scanner) and NPP-VIIRS (National Polar-orbiting Partnership—Visible Infrared Imaging Radiometer Suite) night-time lighting impact data from 2004 to 2020 were obtained from the night-time lighting dataset from 1992 to 2021 published in IEEE Transaction on Geoscience and Remote Sensing, a journal in the field of remote sensing, by Wu et al. [35]. This night-time lighting dataset is well fitted and has great potential for evaluating and analyzing socio-economic development and carbon emissions, and can be used in the study of this paper.
(2) The data on provincial energy consumption and carbon emission factors of the Yangtze River Economic Belt are from China Energy Statistics Yearbook (the first figure in Section 3.1, data sources); the standard coal conversion factor is from China Energy Statistics Yearbook 2020 (Table 1 data sources); and because of the relative lack of carbon emission data at the municipal and district level in China, this paper adopts the 1997–2017 Chinese county carbon emission data published by Chen et al. [36] in Scientific Data (Second figure of Section 3.1 and figures of Section 3.2 and Section 3.3, data sources).
(3) Data on the GDP of provinces, cities, and counties in the Yangtze River Economic Belt were obtained from the China Regional Economic Statistics Yearbook and China County Statistics Yearbook and relevant government statistical bulletins, and were converted to the constant price level of 2004; due to the wide scope of the statistical region, the interpolation method was used to supplement individual missing economic data (the three figures in Section 4, data sources).
(4) Vector data for provincial, municipal, and county boundaries are derived from the national 1:1 million basic geographic databases published by the National Information Resource System (www.webmap.cn), and the spatial coordinate system is National Geodetic Coordinate System 2000 (China Geodetic Coordinate System 2000).

2.3. Research Methods

(1) The calculation of provincial carbon emissions: Carbon emissions from the Yangtze River Economic Belt from 2004 to 2020 were measured based on the energy consumption method, and the calculation formula is as follows:
A = 44 12 i = 1 12 K i E i
where A is the carbon emission (10,000 tons); Ki is the CO2 emission factor for energy source i (10,000 tonnes of carbon/10,000 tonnes of standard coal); and Ei is the consumption of energy i, in terms of standard coal (10,000 tons). The presence of 44/12 indicates the ratio of CO2 to carbon molecular weight. Referring to the method of calculating carbon emissions by Li Chen et al. [37], the CO2 emission coefficients of 16 energy sources were selected as shown in Table 1.
Table 1. IPCC carbon emission factors.
Energy TypeCarbon Emission CoefficientEnergy TypeCarbon Emission Coefficient
raw coal0.7559crude oil0.5857
refined coal0.7559petrol0.5538
coke0.8550diesel0.5714
coke oven gas0.3548diesel oil0.5921
other gas0.3548fuel oil0.6185
other coking products0.6449liquefied petroleum gas0.5042
refinery dry gas0.4602other petroleum products0.5857
petroleum0.4483electrical power0.2720
(2) Municipal- and county-level carbon emission estimation model: Because the research period of this paper is 2004–2020, the specific operation of the missing municipal- and county-level carbon emission data for 2018, 2019, and 2020 is as follows: firstly, the municipal carbon emission data for 1997–2017 are obtained by summing up the county-level carbon emission data, and then the municipal night lights are fitted to the carbon emission data obtained by summing up, and the carbon emission fitting equations are obtained for each municipal level; predicated on the congruency between city-centered and county-centered scales—as well as the image metric scale—a substitute of the night-time lighting luminance values at the city and county ranks into the fitted equations renders the determination of carbon emission values for 2018–2020 for each respective city and county. Taking into account data accuracy, in the estimation model of night-time lighting and carbon emissions for each city, the equation representing the highest fit is adopted as the definitive fitting equation for that city. Consider, for instance, Jiangsu Province, as outlined in Table 2. The fitted equations for the average energy consumption and carbon emissions in each prefecture-level city within Jiangsu Province yield an average R2 value of 0.945, while the corresponding average R2 value within the entire study area is 0.894—both values satisfying the stipulated accuracy criteria—making them suitable for estimating energy consumption and carbon emissions at the county scale. The results of carbon emission estimation were connected with vector data, and the natural breakpoint method was used to classify carbon emissions into five levels from small to large: lower, low, medium, high, and higher. (In Table 2, x represents the city’s night-time light brightness value, while y represents the city’s carbon emissions value).
(3) Global spatial autocorrelation: An optimal characterization of the spatial distribution of carbon emissions is performed via global spatial autocorrelation, where Moran’s I index serves as a metric to quantify whether the values of a certain variable express spatial correlation amongst themselves. A Moran’s I index nearing 1 signifies a positive spatial correlation amongst observations, illustrating a tendency for similar values to be situated in proximity to each other. Conversely, a Moran’s I index approximating −1 indicates a negative spatial correlation among observations. The formula is constructed as follows:
I = n i = 1 n j = 1 n W i j ( x i x ¯ ) ( x j x ¯ ) i = 1 n j = 1 n W i j i = 1 n ( x i x ¯ ) 2
where n denotes the number of an administrative unit; xi and xj denote the carbon emissions of an administrative unit i and j, respectively; x denotes the average value of the carbon emissions of a unit; and Wij denotes the spatial weighting matrix of neighboring administrative units i and j.
(4) Local spatial autocorrelation: The objective of applying a local spatial autocorrelation analysis is to identify specific local regions within the dataset demonstrating significant spatial coalescence or dispersion. The underlying formula is constructed as follows:
I i = n ( x i x ¯ ) j = 1 n W i j ( x j x ¯ ) i = 1 n ( x i x ¯ ) 2
where, when Ii > 0, it indicates that a positive spatial correlation exists between the observations and their respective neighboring regions. In other words, regions sharing similar values show a high tendency to cluster together. Conversely, when Ii < 0, it suggests that a negative spatial correlation is present between the observations and their adjacent regions. This implies that areas carrying similar values showcase a further propensity towards dispersion from each other.
(5) Tapio decoupling model: In 2005, Tapio [38] first introduced the concept of “decoupling” to describe the relationship between transport scale growth and carbon emissions in the EU, which has since been widely used by scholars to describe the idealized process of the relationship between carbon emissions and economic growth diminishing until it disappears. According to related research, the decoupling model is generally understood as economic growth at the cost of consuming only a small amount of carbon emissions or no longer consuming carbon emissions. The expression for total carbon emissions and economic growth is constructed as follows:
T ( t ,   t - 1 ) = Δ C ( t ,   t - 1 ) Δ G ( t ,   t - 1 ) = ( C t - C t - 1 ) / C t - 1 ( G t - G t - 1 ) / G t - 1
where T(t, t−1) denotes the decoupling elasticity index of economic growth and carbon emissions; ∆C(t, t−1) and ∆G(t, t−1) denote the number of changes in carbon emissions and the economy in the year t relative to the year t − 1, respectively; and t and t − 1 denote the end period and the base period, respectively. According to the further research of related scholars on the decoupling relationship between carbon emissions and economic growth, the decoupling states are classified into the following eight types, as shown in Table 3.

3. Characteristics of the Spatial and Temporal Evolution of Carbon Emissions at Different Scales

3.1. Provincial Scale

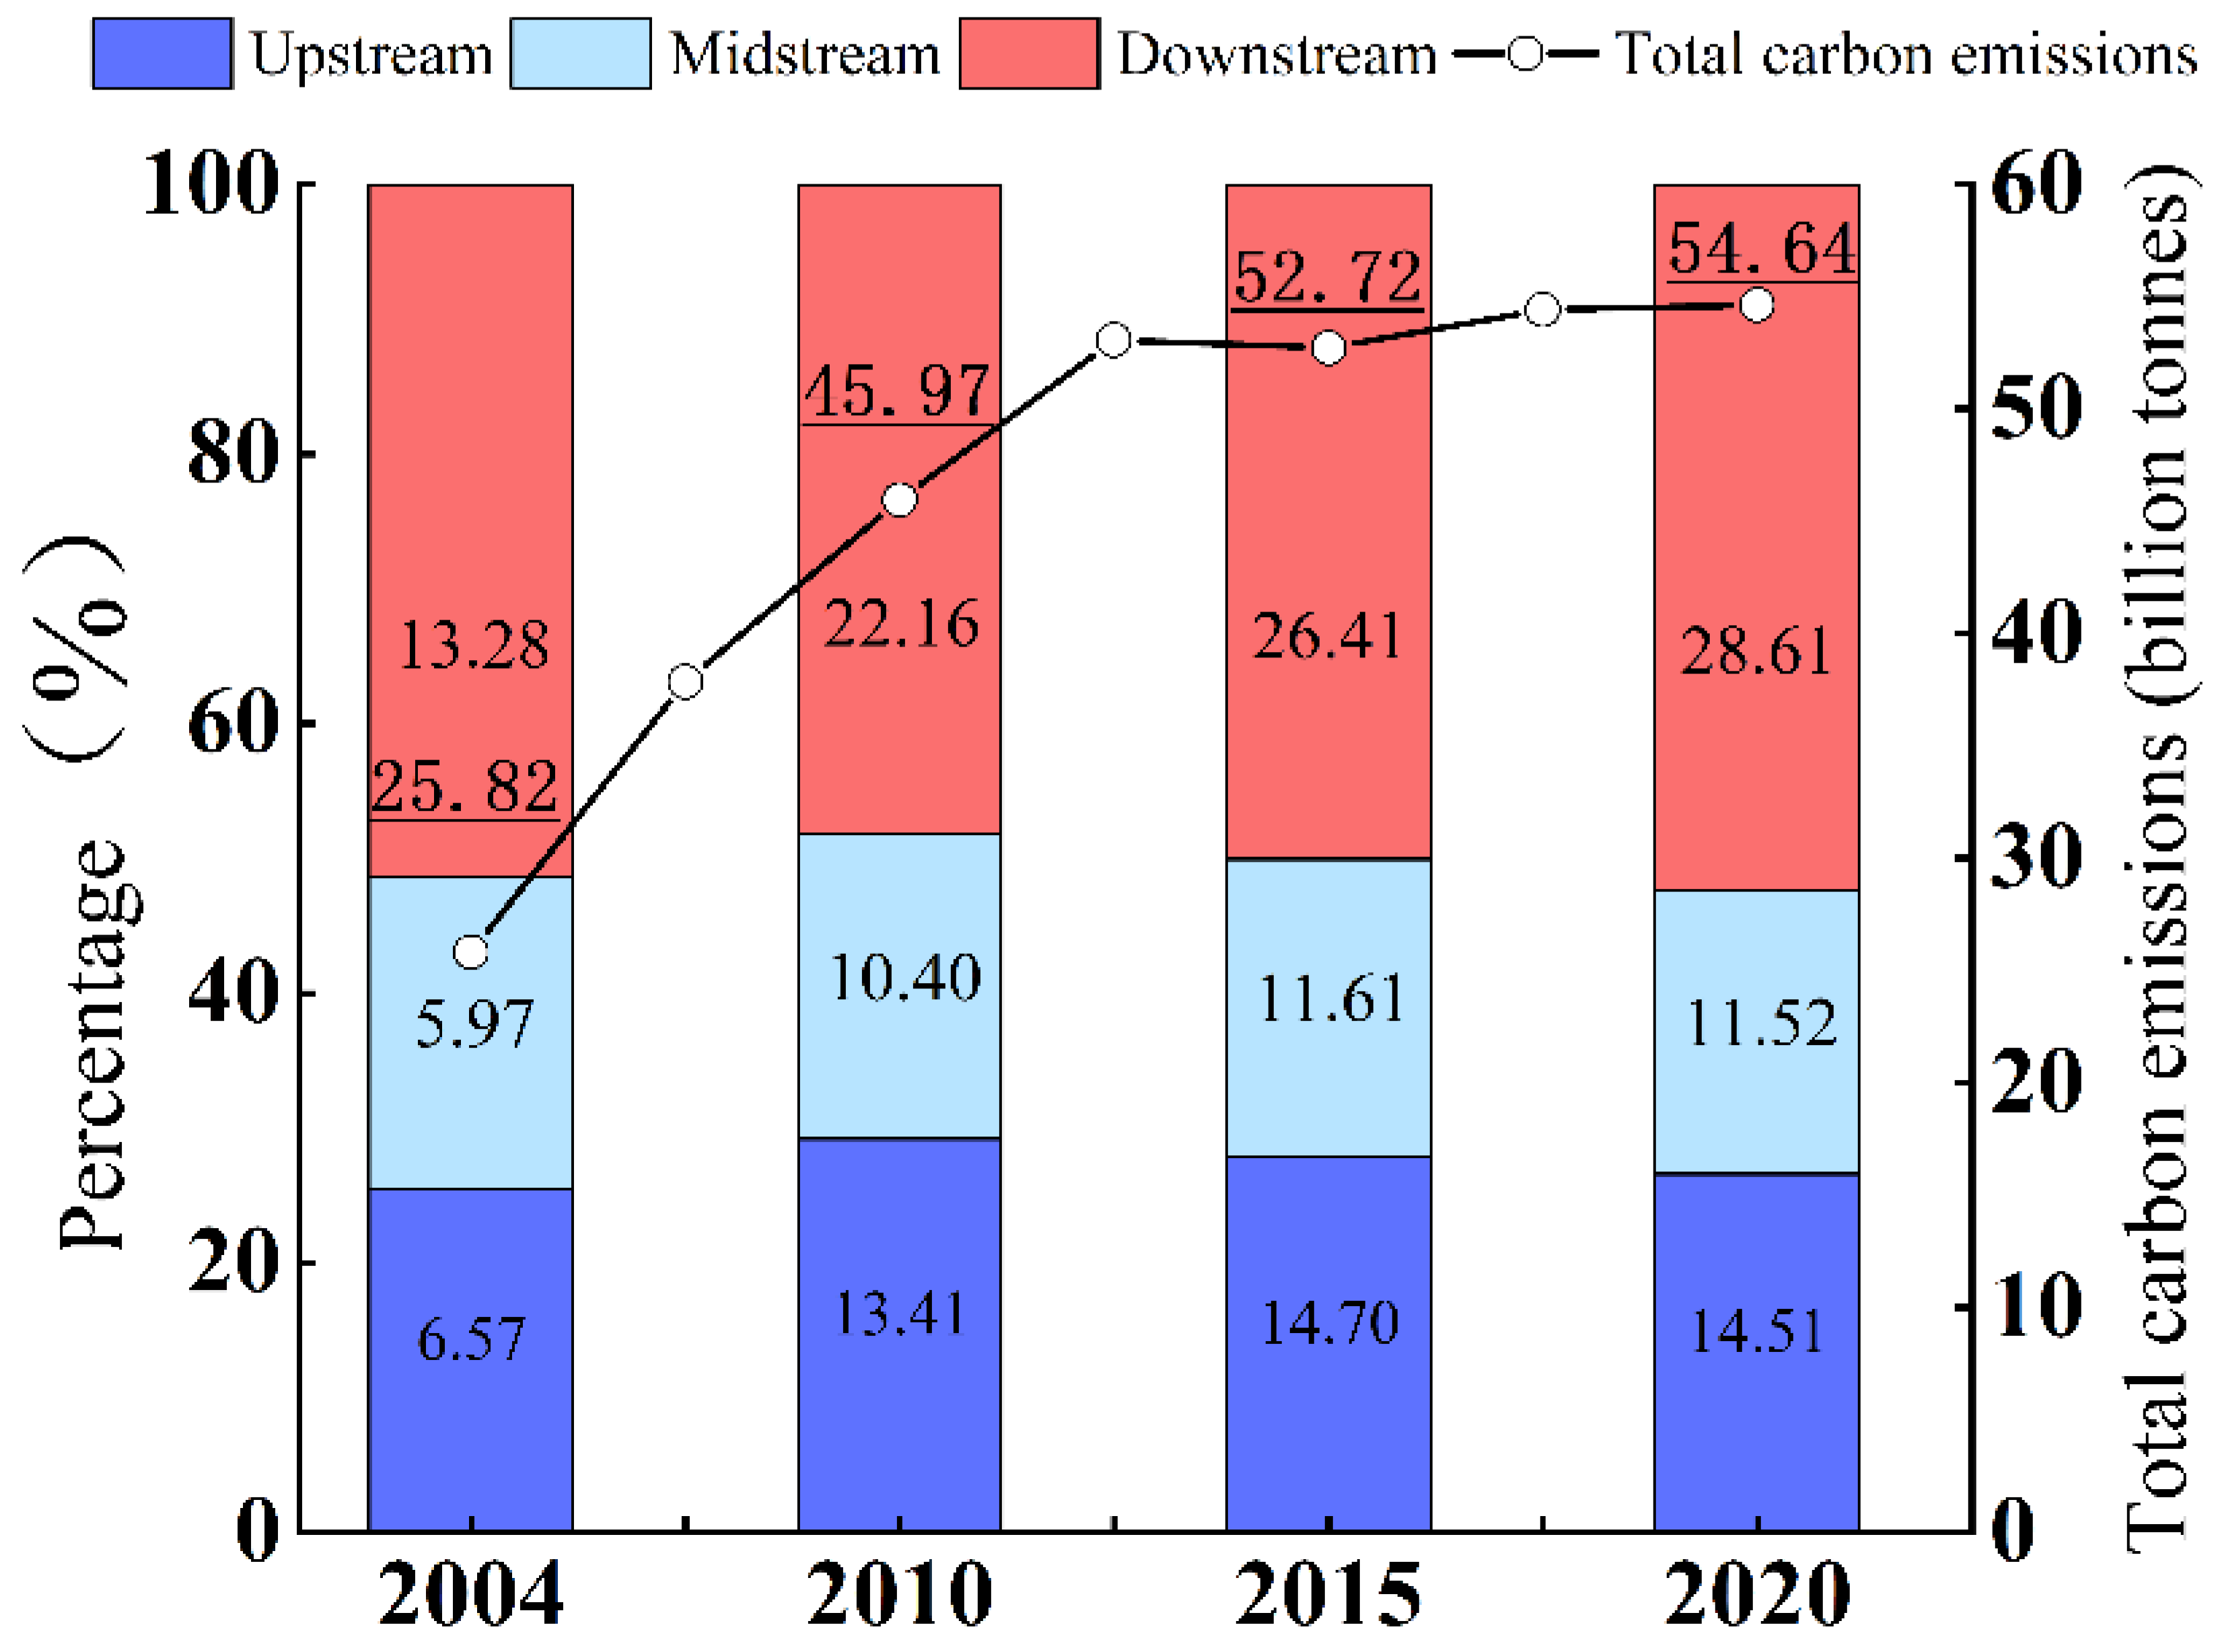
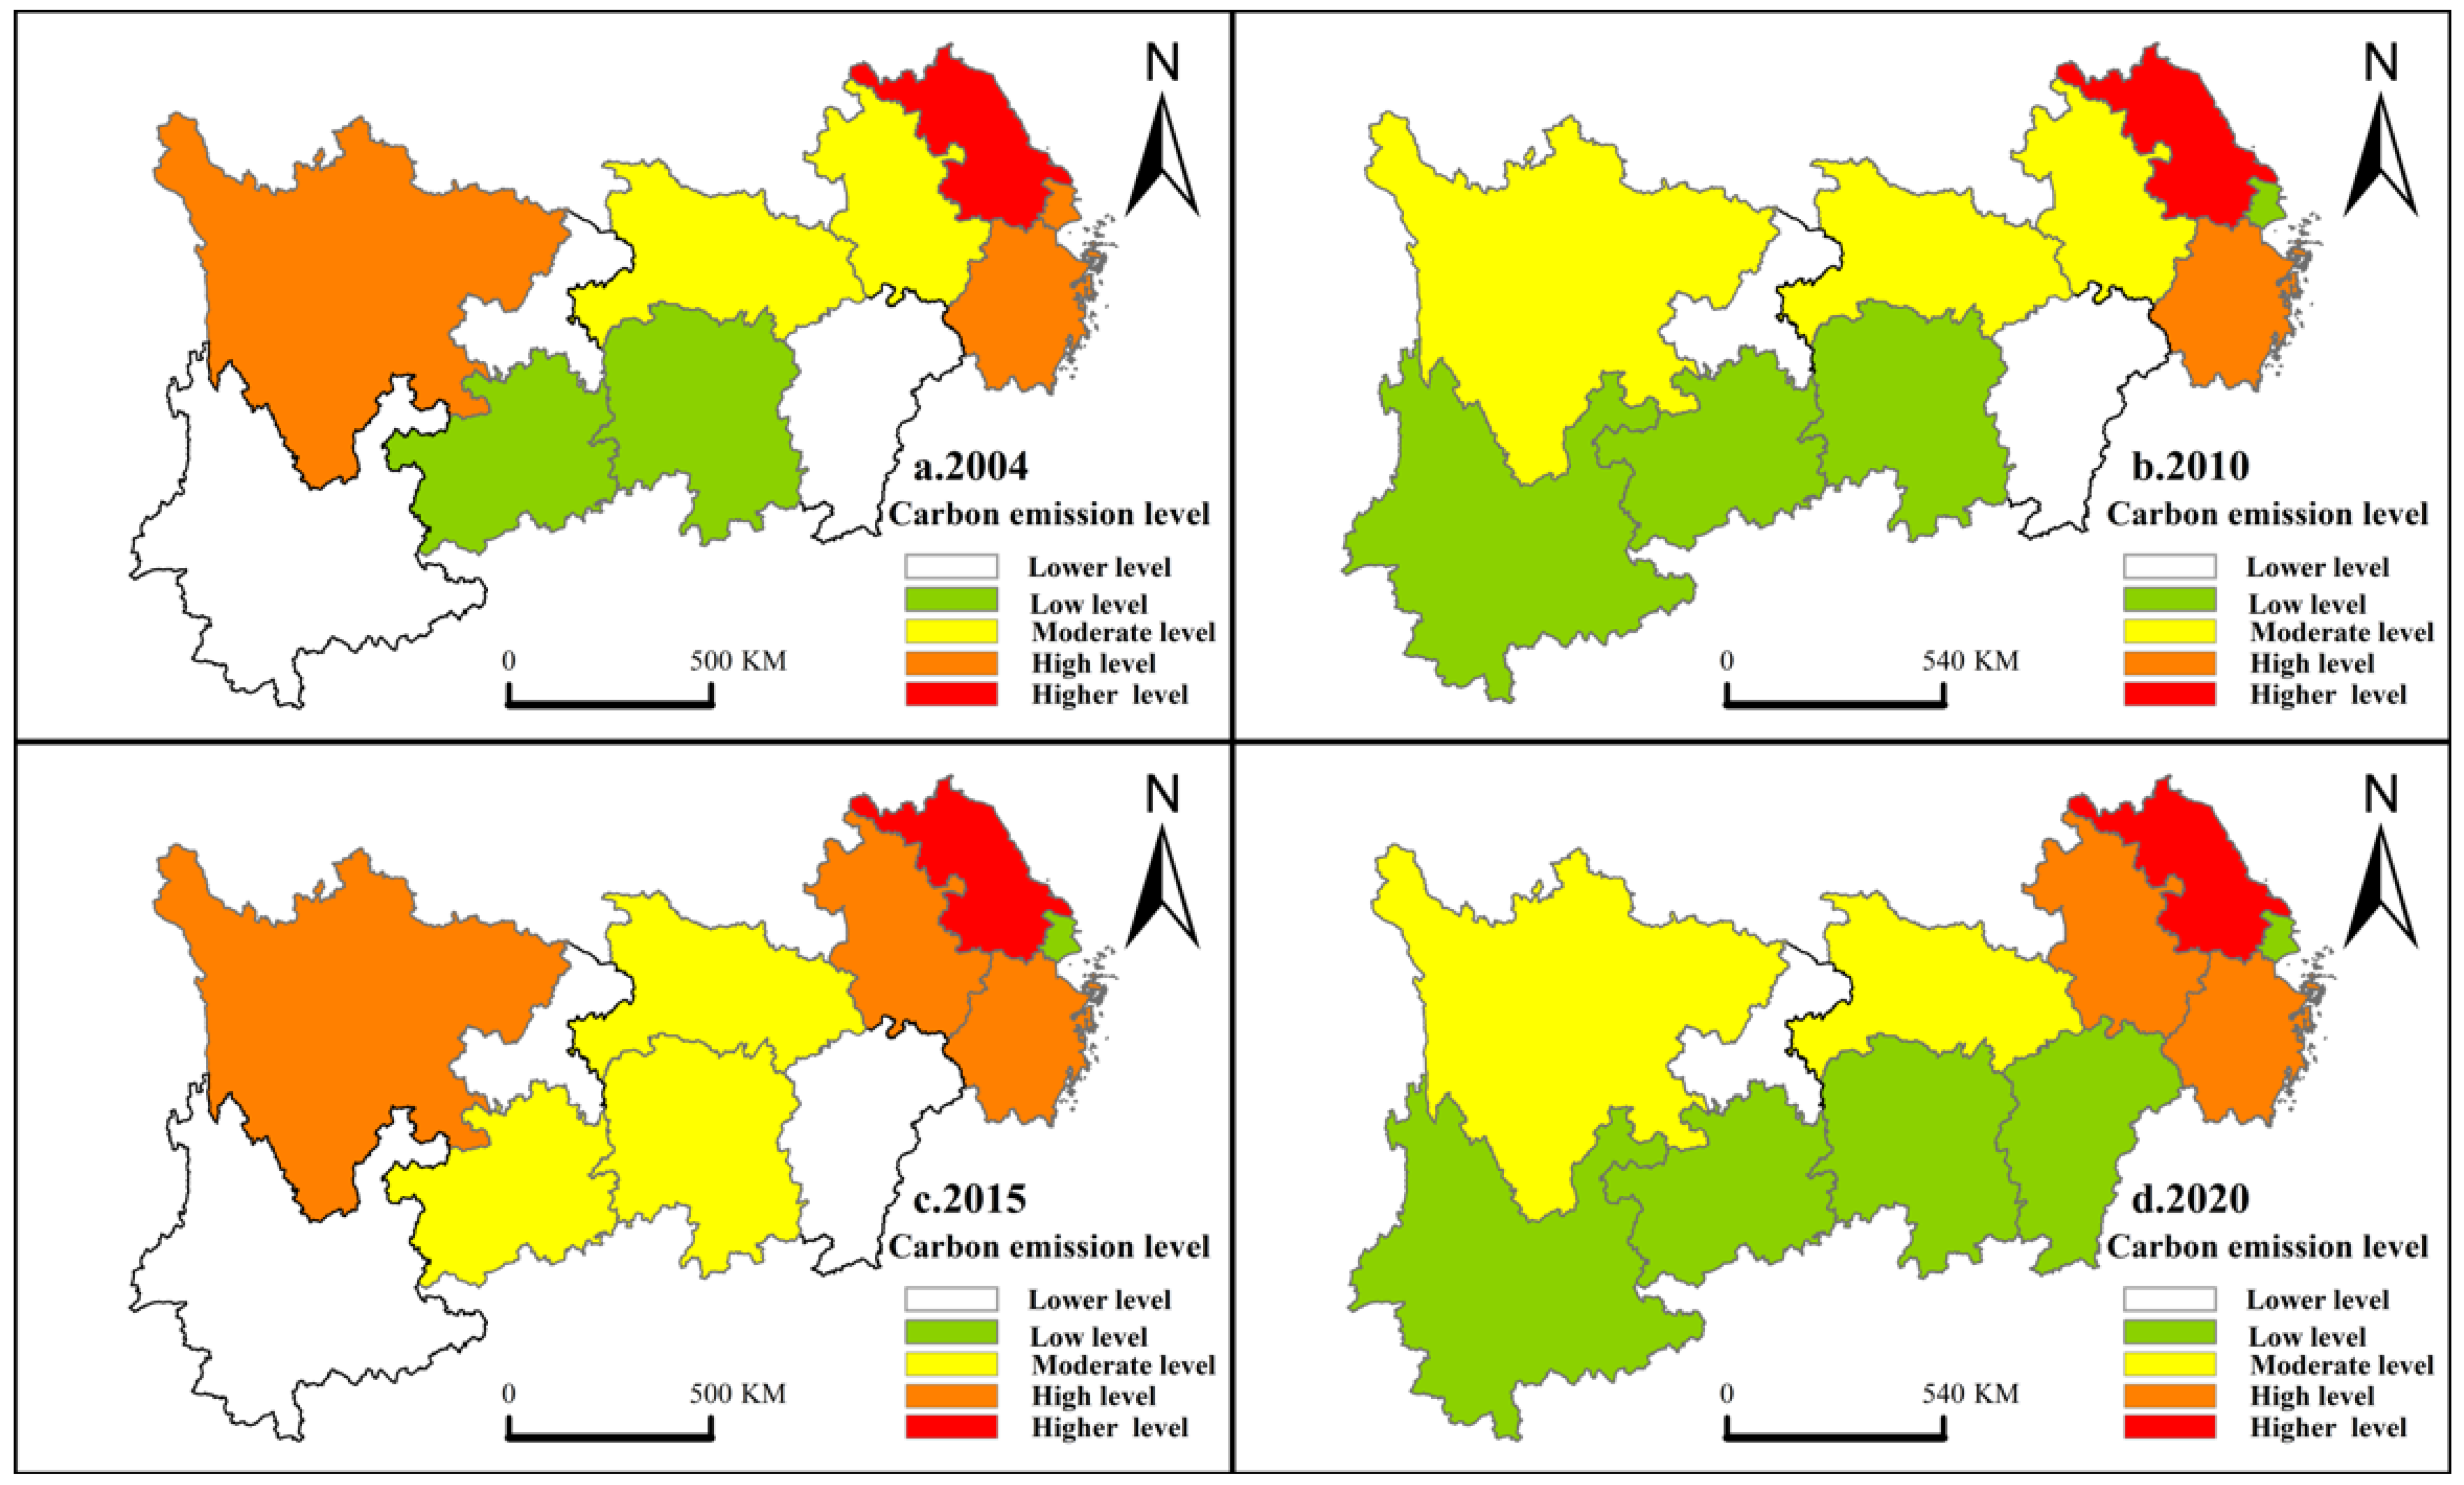
As delineated in Figure 2, from 2004 to 2013, total carbon emissions from energy utilization within the Yangtze River Economic Zone experienced a continual ascension, albeit accompanied by a diminishing rate of growth. In the period from 2014 to 2020, total emissions exhibited a tendency towards stabilization, evidenced by only minor fluctuations. This development infers that the carbon emissions peak has been reached in the Yangtze River Economic Zone. Commencing at 2.582 billion tonnes in 2004, total emissions progressed to 4.597 billion tonnes in 2010 and expanded to 5.464 billion tonnes in 2020. Significantly, the annual growth rate in carbon emissions experienced a sharp decrease from 8.44% during 2004–2013 shrinking to 0.42% for 2014–2020. This suggests a considerable influence of the emission reduction objectives and obligations, which were stipulated by China during the Copenhagen Conference in 2009 and the Paris Climate Conference in 2015, on the emissions reduction trajectory of the Yangtze River Economic Belt. From within the basin, the total carbon emissions show a geographic differentiation of downstream > upstream > midstream. The upstream, midstream, and downstream of the Yangtze River Economic Belt all account for a relatively stable share of the basin from 2004 to 2020, with the upstream accounting for an average of 28.1 percent, the midstream accounting for an average of 22.2 percent, and the downstream accounting for an average of 49.7 percent. From 2004 to 2012, the upstream and midstream regions were in the nascent stages of economic development, frequently attaining economic expansion at the expense of heightened energy consumption. The interval of 2013 to 2020 marked an oscillating phase in carbon emission growth for the upstream and midstream areas, attributed to the enforcement of energy conservation and emissions reduction policies, which significantly curtailed their carbon emissions growth trajectory. Conversely, the downstream region sustained a rapid phase of economic development, without witnessing a clear negative carbon emission growth phase. From the perspective of the provinces within the Yangtze River Economic Belt (Figure 3), in 2004, the provinces with higher and higher carbon emissions were Jiangsu, Zhejiang, Shanghai, and Sichuan; the provinces with medium carbon emissions were Anhui and Hubei; and the regions with lower and lower carbon emissions were Yunnan, Chongqing, Jiangxi, Guizhou, and Hunan. The year 2010 saw a decrease in the carbon emission levels of Shanghai and Sichuan, and an increase in the carbon emission level of Yunnan. In 2010, Shanghai and Sichuan experienced a decrease in carbon emission levels, while Yunnan experienced an increase in carbon emission levels. Between 2010 and 2020, the Yangtze River Economic Belt experienced a large-scale change in carbon emission levels, first in 2015, and then returned to the spatial and temporal distribution characteristics shown in 2010. The provinces in the Yangtze River Economic Belt with higher total carbon emissions from 2004 to 2020 are Jiangsu and Zhejiang, and the provinces with lower total carbon emissions are Jiangxi, Yunnan, and Chongqing. Overall, the development characteristics of the Yangtze River Economic Belt have experienced a shift from the pursuit of rapid economic development in the early years to a greater focus on the quality and efficiency of economic development today.

3.2. Municipal Scale

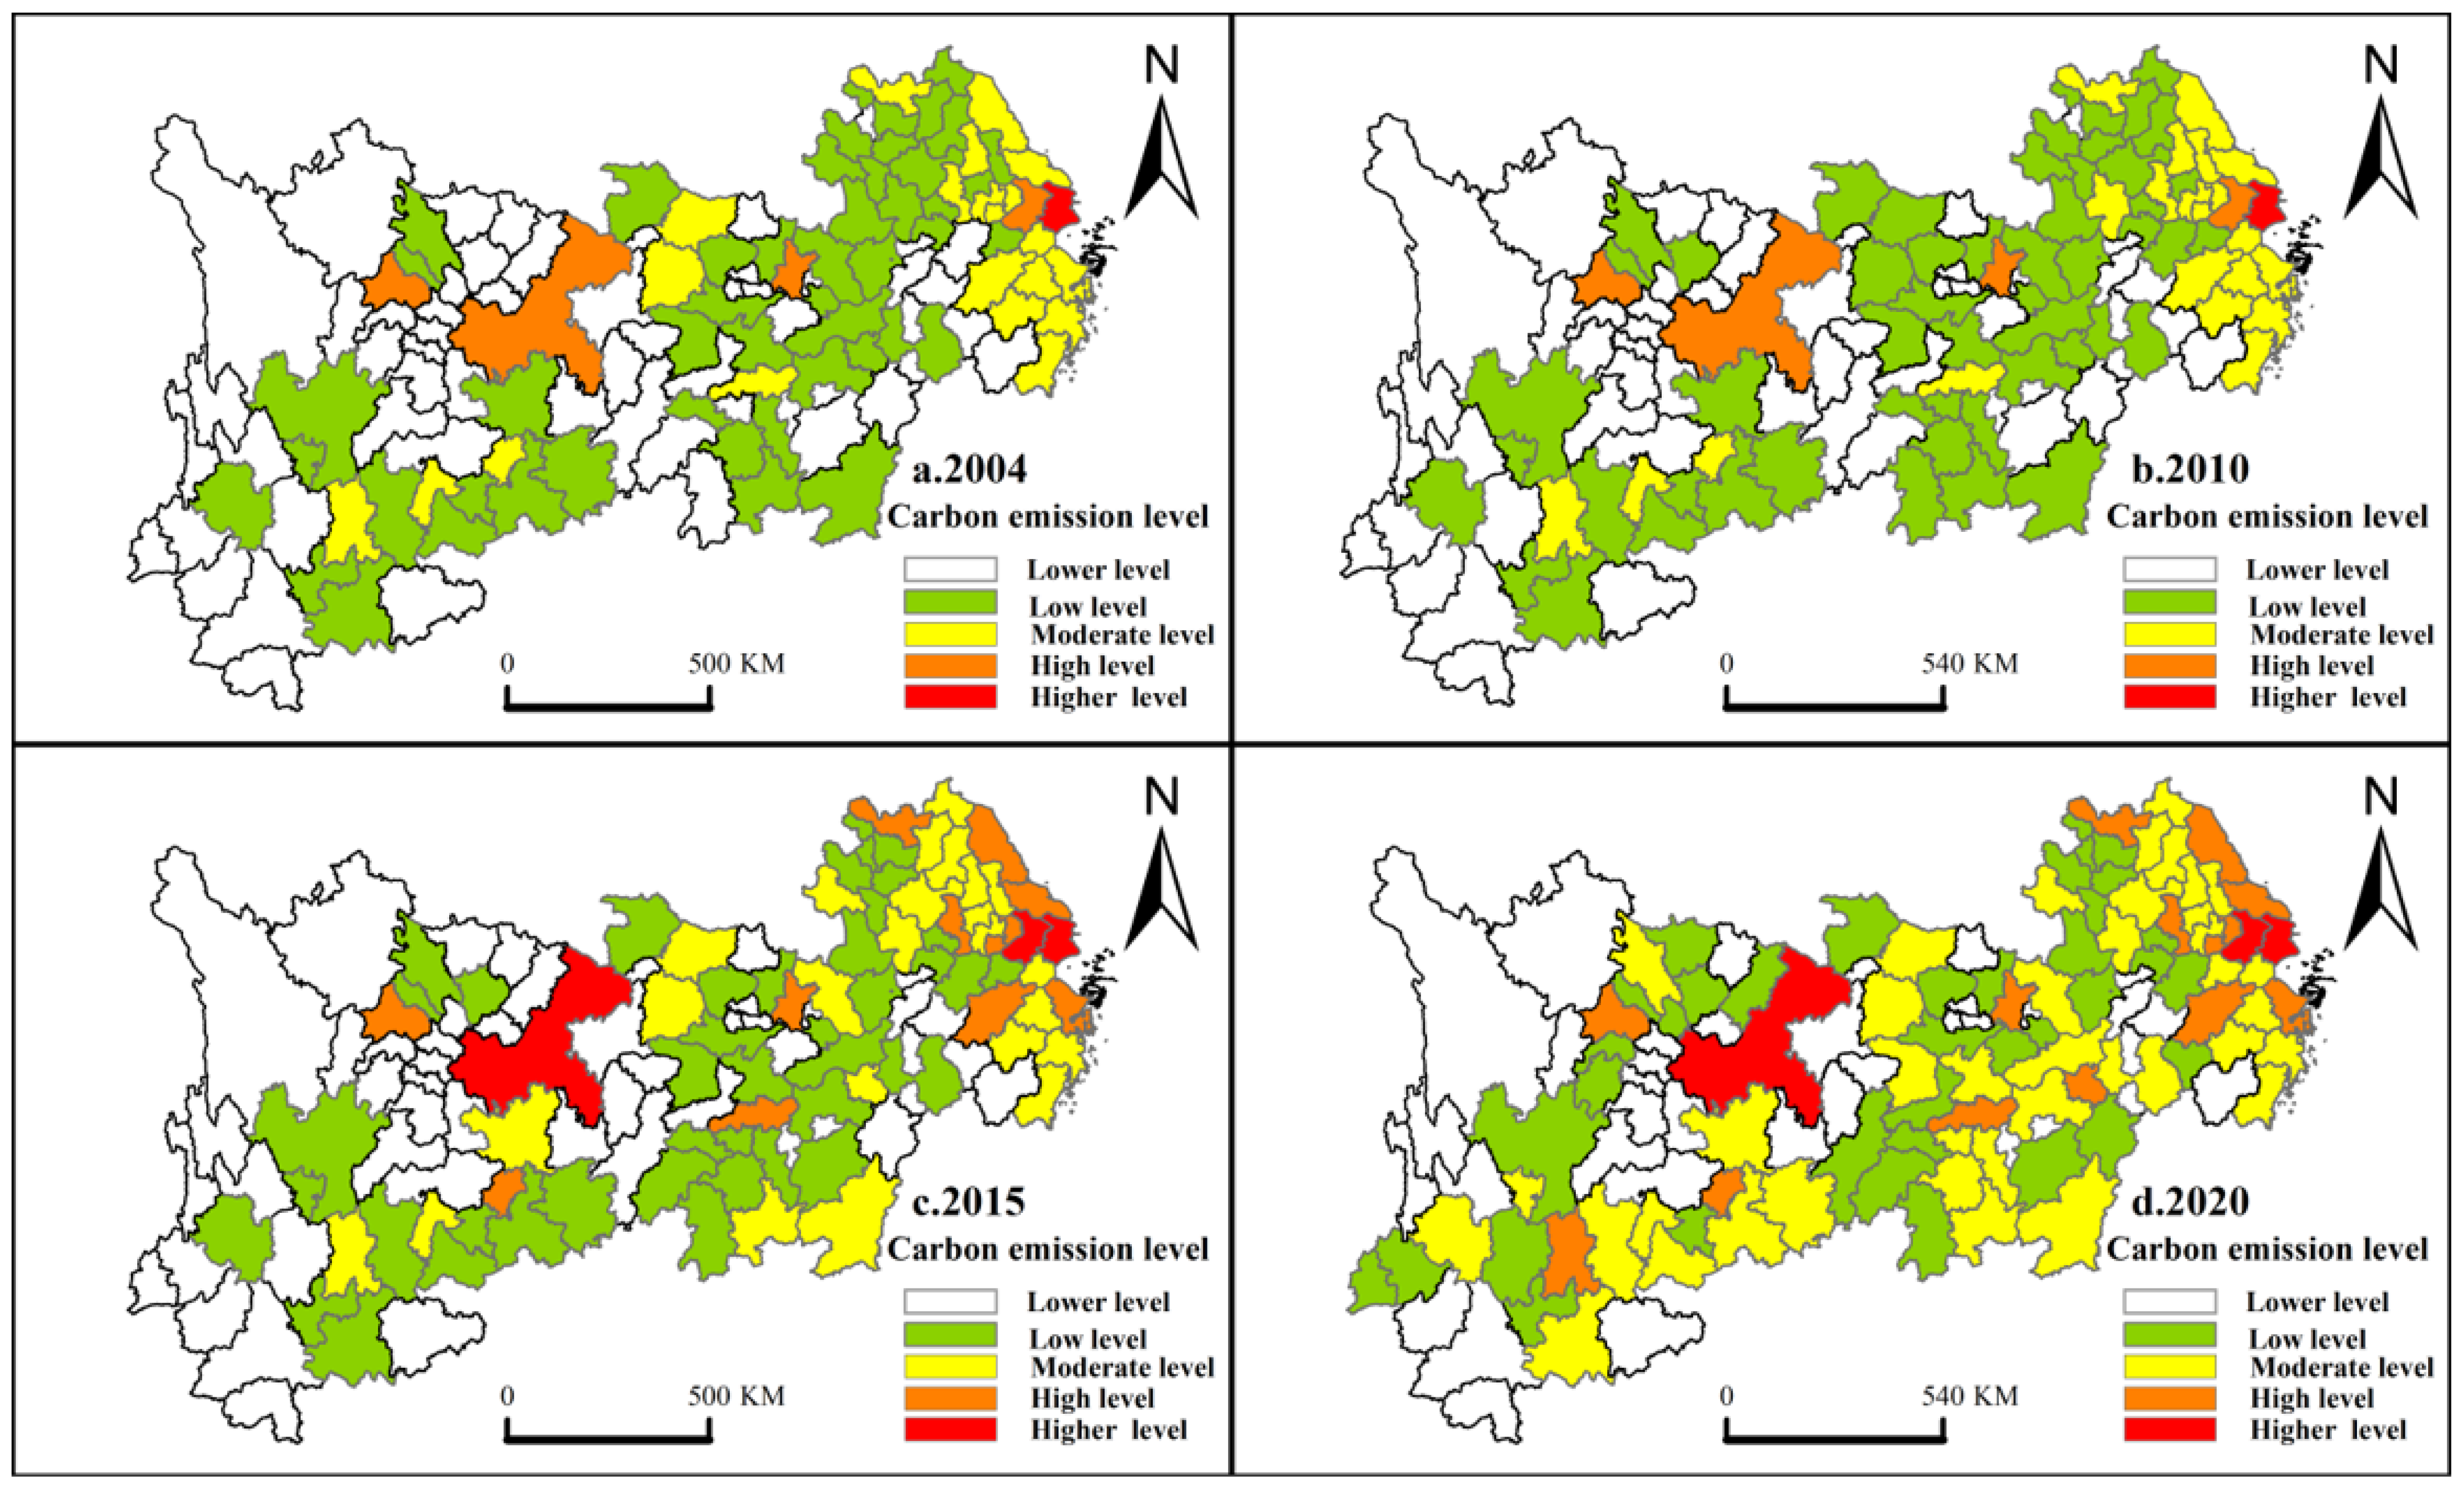
Specifically (Figure 4), in 2004, the overall carbon emissions of the Yangtze River Economic Belt were at a relatively low level, with only Chengdu, Chongqing, Wuhan, Suzhou, and Shanghai as high-carbon-emission areas; the upper reaches of the Yangtze River were dominated by relatively low-carbon-emission zones, the middle reaches were dominated by lower-carbon-emission areas, and the lower reaches showed a significant increase in the carbon emission level, with the emergence of small-scale medium-carbon-emission areas, which south–central Jiangsu, Zhejiang, and Shanghai dominated. In 2010, the overall carbon emission level was in a relatively stable state, with only a small amount of change. In 2010, the overall carbon emission level was in a relatively stable state, with only a small amount of changes. The year 2015 saw an increase in carbon emission levels, with the most significant changes in the middle and lower reaches, with a large number of lower-carbon-emission areas turning into medium-carbon-emission areas, and a gradual trend of centripetal aggregation and peripheral spreading based on the major cities of Chongqing, Guiyang, Wuhan, Changsha, Nanjing, and so on. In 2020, the diffusion effect accelerates, and the carbon emission level of the Yangtze River Economic Zone rises again, at which time most of the lower-carbon-emission regions in the upper and middle reaches turn into medium-carbon-emission regions, and the carbon emission regions are distributed in scale, and based on the previous study period, a pattern of centripetal aggregation and peripheral diffusion is formed, with the emergence of several carbon emission centers of varying sizes and scales. The characteristics of carbon emissions at the municipal scale reflect that the pursuit of economic growth in the middle and lower reaches of the Yangtze River has been accompanied by an increase in the environmental pressure caused by carbon emissions. In addition, the spatial diffusion effect of carbon emissions at the municipal scale indicates that, with the improvement in transport, information, and other infrastructures and the advancement in regional integration, the growth of carbon emissions is no longer confined to a specific region, but spreads to the surrounding areas, forming a wider range of carbon emission centers. Compared with the provincial scale, the distribution of high-carbon cities at the municipal scale is consistent with that at the provincial scale but also shows some intra-provincial distribution differences due to the differences in the energy consumption characteristics of different cities.

3.3. County Scale

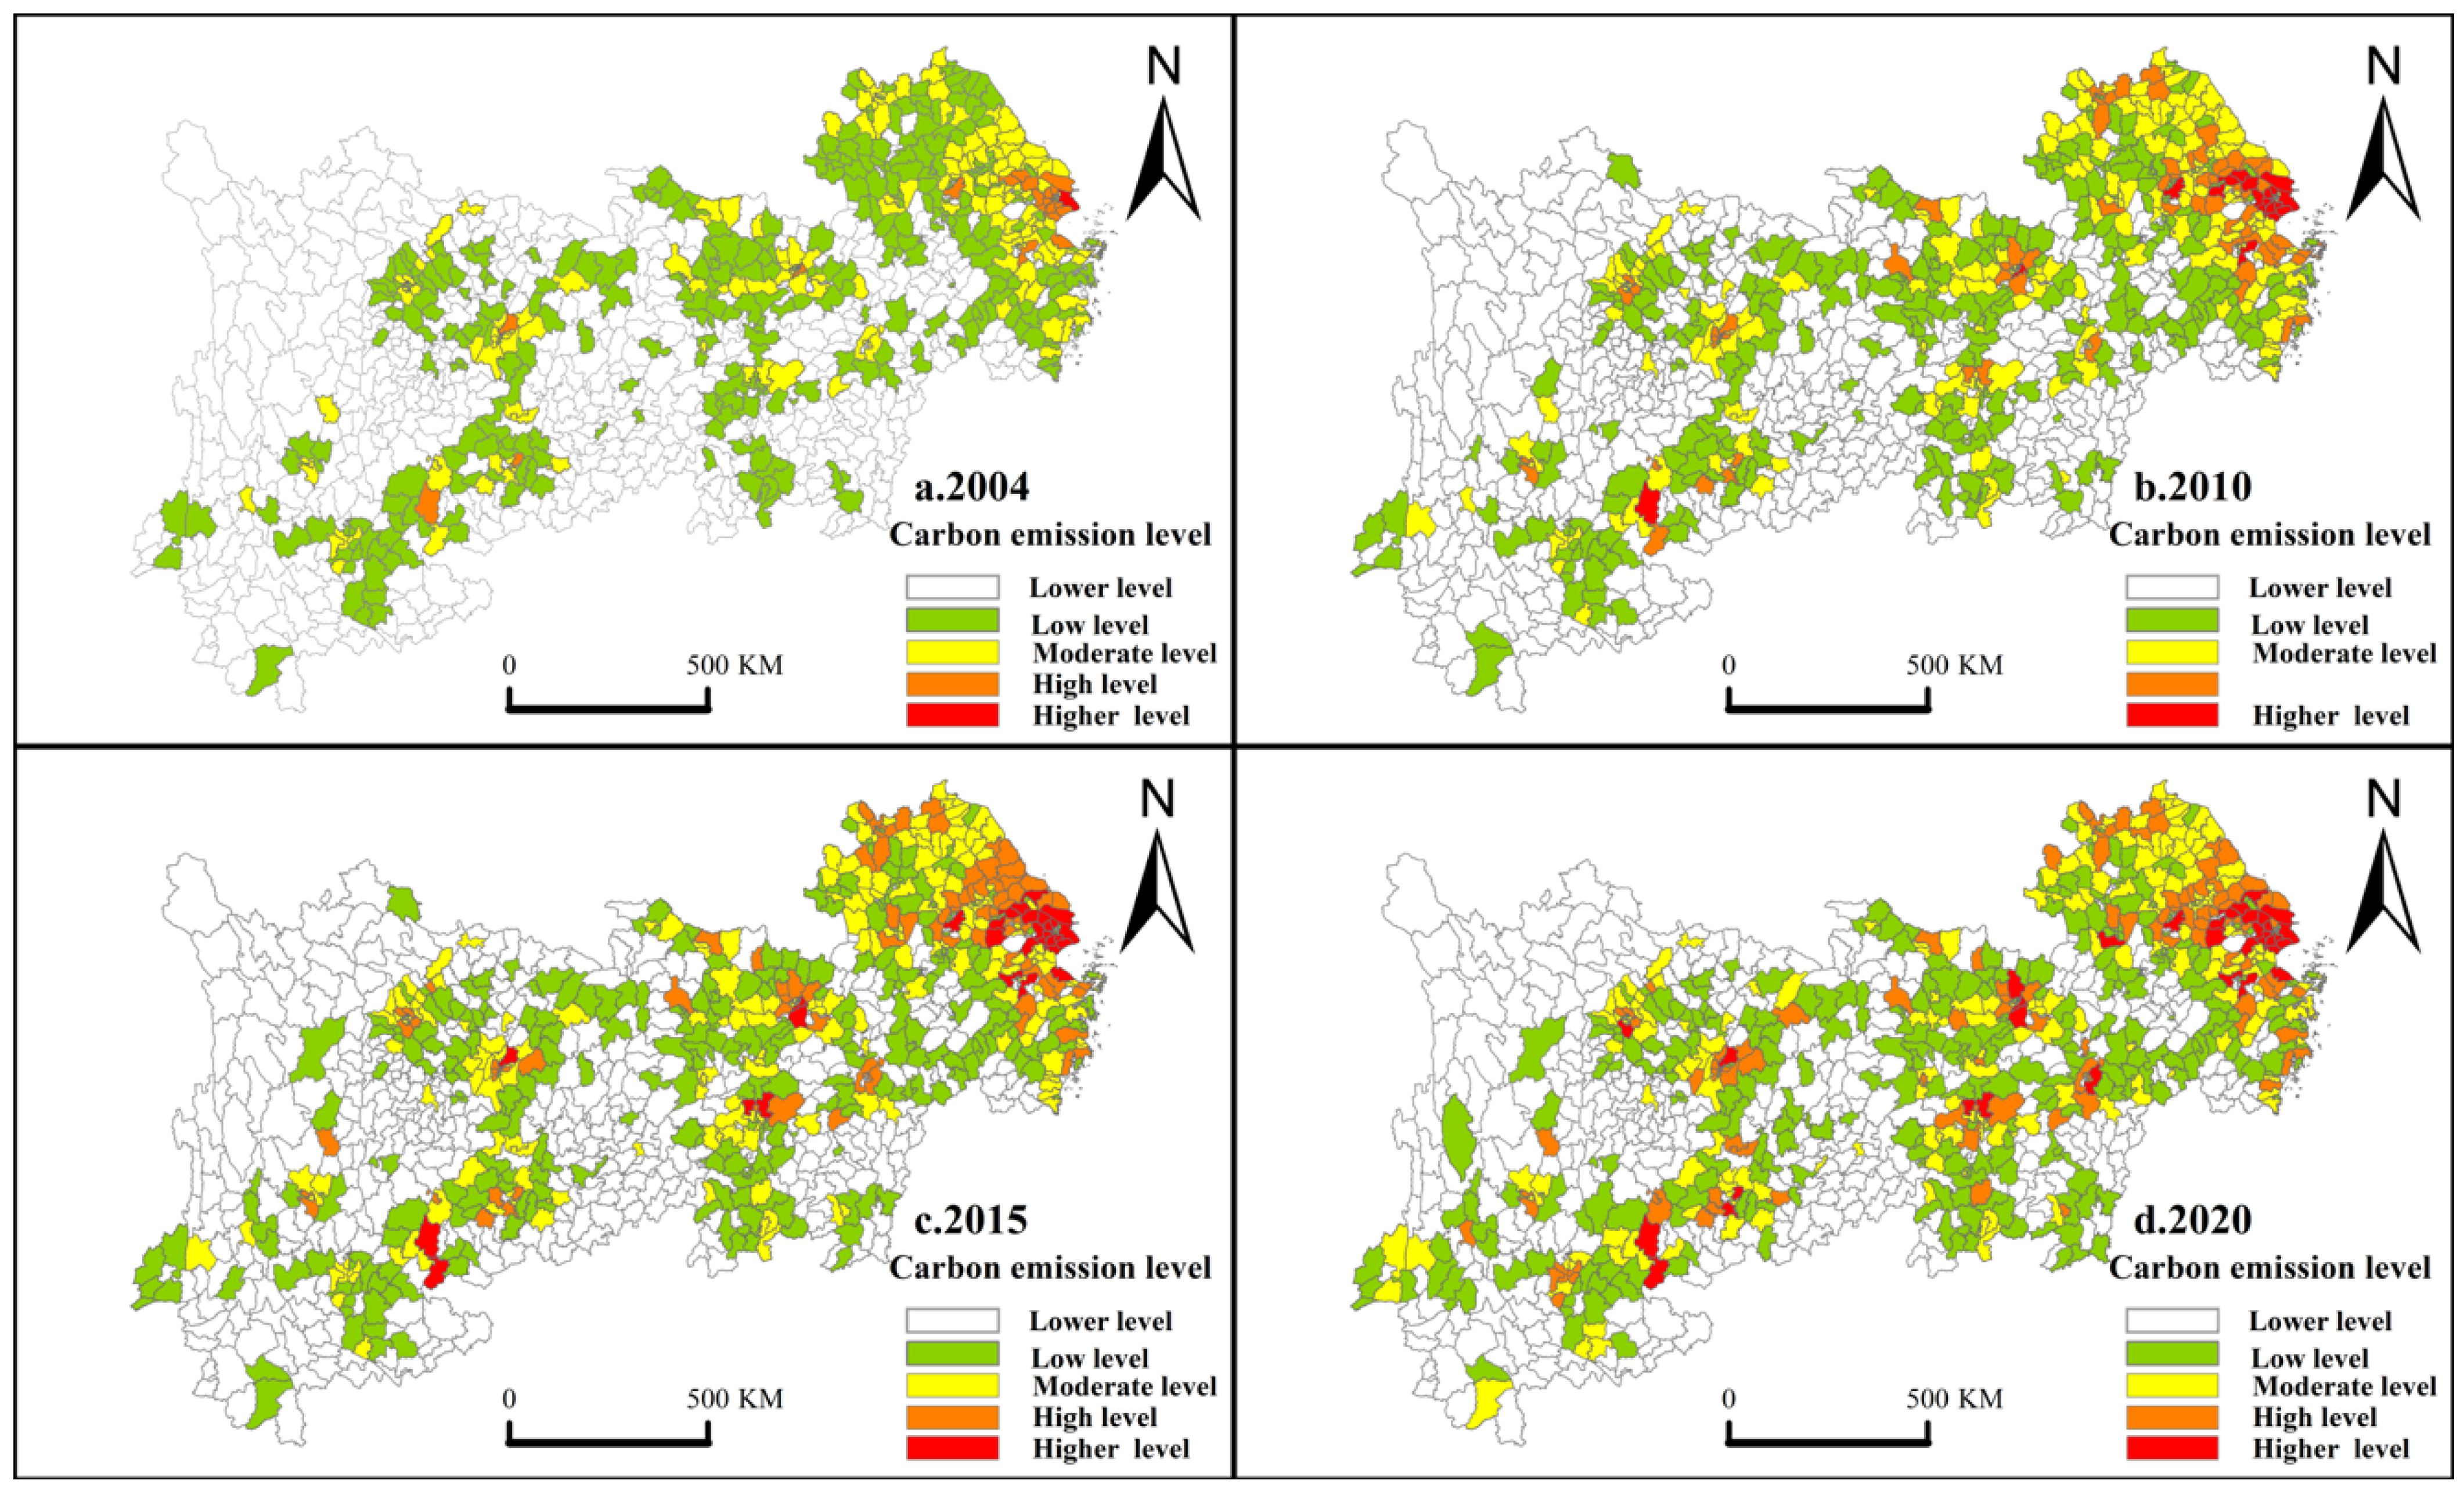
At the county scale (Figure 5), in 2004, carbon emissions had already started manifesting a trend of central agglomeration and peripheral diffusion. The singular high-carbon county was Pudong New Area in Shanghai, with the areas exhibiting higher carbon emissions being primarily centralized urban areas in Shanghai, Chongqing, Nanjing, and Suzhou in Jiangsu; Hangzhou and Ningbo in Zhejiang; Guiyang and Liupanshui in Guizhou; and Wuhan in Hubei, among others. By 2010, the diffusion effect had accelerated, leading to a considerable surge in the carbon emission level within the Yangtze River Economic Belt, with the most prominent changes being observable in the midstream and downstream sections of the belt. Additional high-carbon counties emerged in Shanghai, Nanjing, Wuxi, Suzhou, and Changzhou in Jiangsu Province; Wuhan in Hubei Province; and Panzhou and Liupanshui in Guizhou Province. By 2015, the aforementioned regions expanded further and birthed a series of carbon emission centers of various scales, ultimately giving rise to a more cohesive multi-carbon emission center configuration. There was an expansion in high-carbon counties, including additions in the urban central districts of Chongqing, Changsha in Hunan, Ningbo in Zhejiang, Nantong in Jiangsu, and Xingyi Municipality of Qianxinan Buyi and Miao Autonomous Prefecture in Guizhou. In 2020, the diffusion continued unabated, culminating in the formation of differently sized carbon emission centers, primarily situated within the municipal central districts of the capitals of provinces and developed regions. At that point, central agglomeration and peripheral diffusion were mutually existent, with a heightened degree of conspicuity. The analysis of carbon emissions at the county scale uncovers intricate dynamics and a layered spatial structure within the Yangtze River Economic Belt. Such transformations in this structure mirror asymmetric regional advancement, spatial alterations in commercial and industrial activities, and swift urbanization. To realize sustainable development and precision-based emission reduction within the Yangtze River Economic Belt, it is incumbent to deeply comprehend these spatial dynamics and evolving trends, thus enabling more efficacious environmental policies and emission reduction tactics. When contrasted with other scales, it becomes evident that high-carbon counties display internal variability predicated on macro-positioning at the provincial scale, and likewise at the municipal scale. However, the spatial dynamics at the county scale prove to be more pronounced than those at both provincial and municipal scales.

3.4. Spatial Autocorrelation of Carbon Emissions

3.4.1. Global Spatial Autocorrelation

We calculated the global Moran’s I index of carbon emissions at the provincial, city, and county scales in the Yangtze River Economic Belt, and the correlation results are shown in Table 4.
From 2004 to 2020, the global Moran’s I indices of carbon emissions at all three scales in the Yangtze River Economic Zone are all greater than 0. The provincial scales show positive spatial correlations but fail the significance test, and the spatial correlations of carbon emissions at the provincial scales continue to weaken in the period from 2004 to 2015 and then show signs of rebound and enhancement in the period from 2015 to 2020. This is different from the evolutionary characteristics of the spatial correlation of carbon emissions in the Yangtze River Economic Belt at the city and county scales, which also indicates that the spatial heterogeneity of carbon emissions at the provincial scale and the city and county scales presents different spatial patterns; except for the provincial scale, the global Moran’s I at the city and county scales is greater than 0 from 2004 to 2020, and all of them are significant at the 5% level, which indicates that carbon emissions in the Yangtze River Economic Belt present a spatial positive correlation but do not pass the significance test. The economic zone shows a significant positive correlation and spatial agglomeration of carbon emissions. In terms of the global Moran’s I index during the study period, there is an upward trend from 2004 to 2010 and a downward trend from 2010 to 2020, but the fluctuation amplitude is small. The overall city- and county-level Moran’s I indices remain relatively stable, indicating that the spatial agglomeration trend of similar regions in the Yangtze River Economic Belt has little interannual variation.

3.4.2. Local Spatial Autocorrelation

To investigate the clustering relationship of carbon emissions among cities at different scales in the Yangtze River Economic Belt, local autocorrelation analyses were performed on the carbon emissions at the municipal and county scales in the Yangtze River Economic Belt in 2004, 2010, 2015, and 2020, respectively, and the LISA values were calculated.
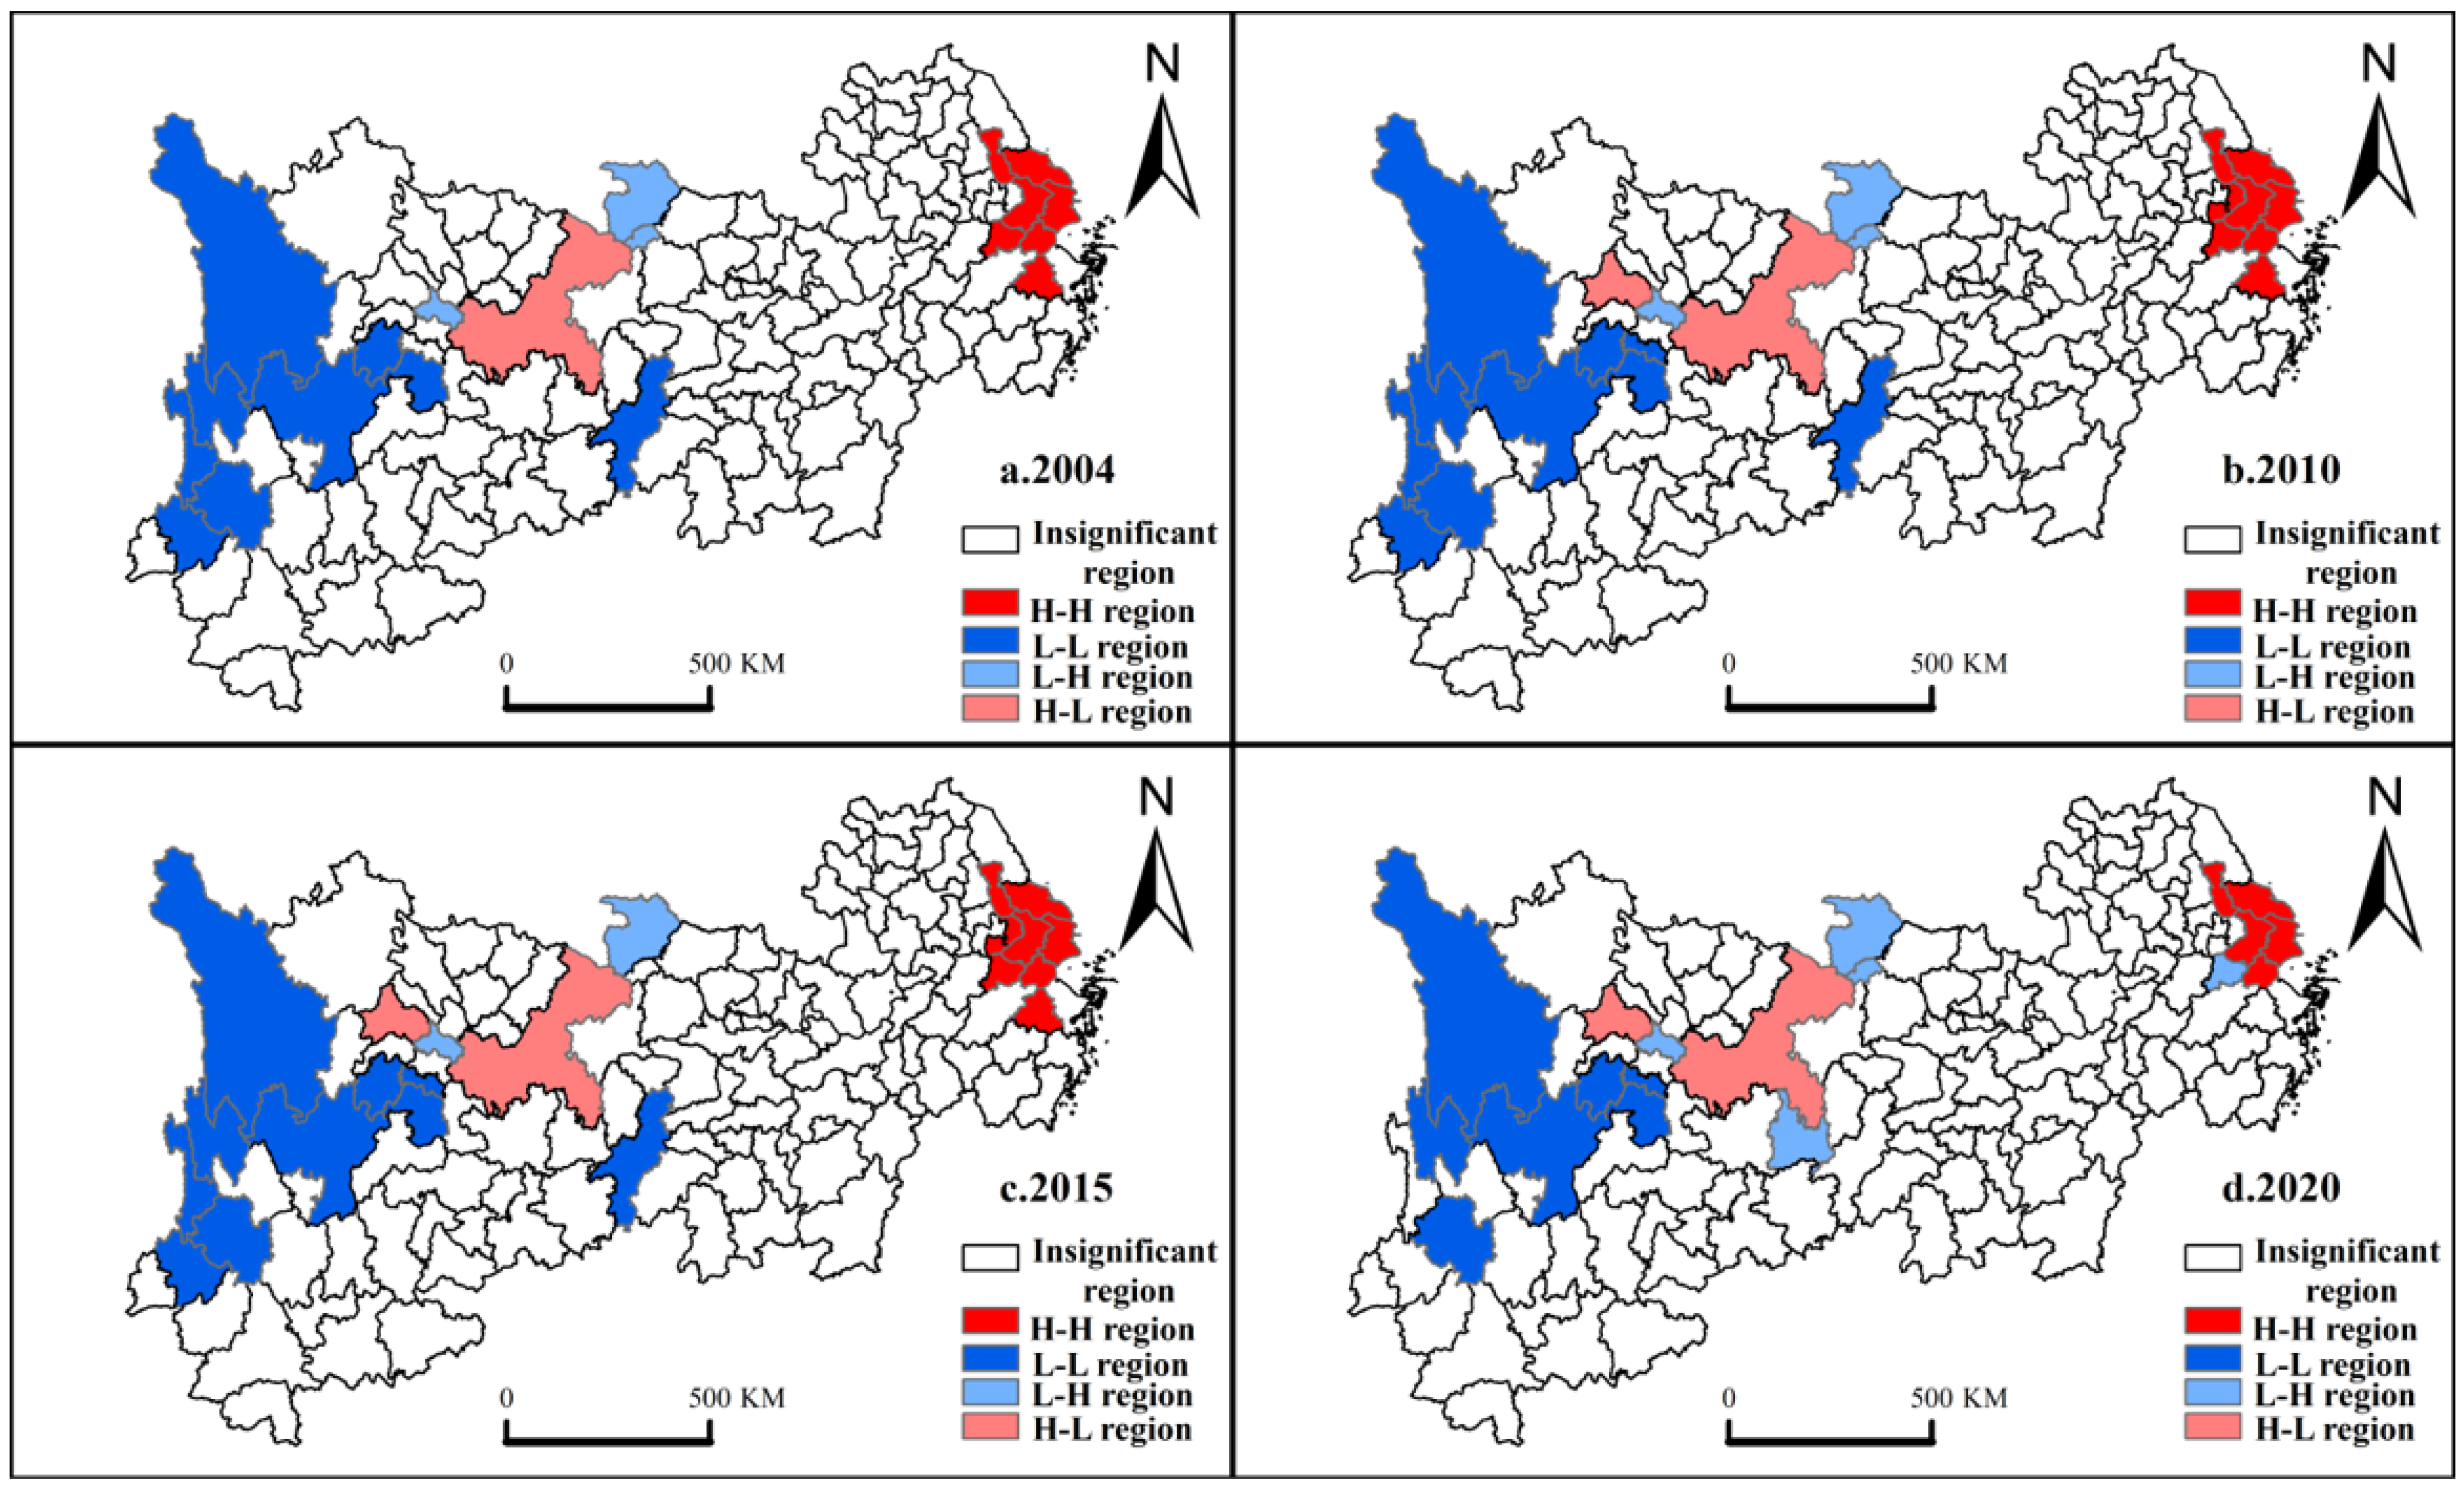
At the municipal scale (refer to Figure 6), the distribution of municipalities demonstrating robust spatial autocorrelation remains somewhat consistent across the four time periods. The dynamics of significance in the Yangtze River Economic Belt exhibit minimal alteration from 2004 to 2020. For instance, in 2004, approximately 14.72% of the municipalities indicated significant agglomeration dynamics. Of these, seven and eight cities were identified as HH and LL types, respectively, constituting 78.9% of the overall salient types, while three and one cities were classified as HL and LH types, respectively, composing 21.1% of the total salient types. The HH type was predominantly clustered within the lower reaches of the Yangtze River while the LL type was primarily concentrated within the midstream and upstream regions. By 2010, Wuxi had been added to the HH-type group, and Chengdu was introduced to the HL-type group. Subsequently, in 2015, the Shennongjia Forest Area transitioned from the LH type to an insignificant area. In 2020, Shaoxing changed from the HH type to an insignificant area, Huzhou switched from the HH type to the LH type, and Huaihua transitioned from the LL type to an insignificant area. At the municipal scale, carbon emissions show a clear positive spatial correlation. The aggregation dynamics of the Yangtze River Economic Belt are mainly composed of a high-carbon agglomeration consisting of Shanghai in the downstream; Taizhou, Nantong, Wuxi, and Suzhou in Jiangsu; and Jiaxing, Shaoxing, and Huzhou in Zhejiang, and a low-carbon agglomeration consisting of Leshan, Zigong, Yibin, Ganzi Tibetan Autonomous Prefecture, Diqing Tibetan Autonomous Prefecture, and Liangshan Yi Autonomous Prefecture in Sichuan, and Baoshan, Dali Bai Autonomous Prefecture, and Nujiang Lisu Autonomous Prefecture in Yunnan. It is worth noting that Chongqing and Chengdu, which have higher carbon emissions themselves, are located around the low-carbon agglomeration area and therefore have positive spillover effects, while Huzhou and Zhejiang, which have lower carbon emissions, are located around the high-carbon agglomeration area and are affected by the spillover effects of the downstream high-carbon cities. Overall, the high-carbon agglomeration city clusters of Jiangsu, Shanghai, and Zhejiang can be identified as precise emission reduction areas.
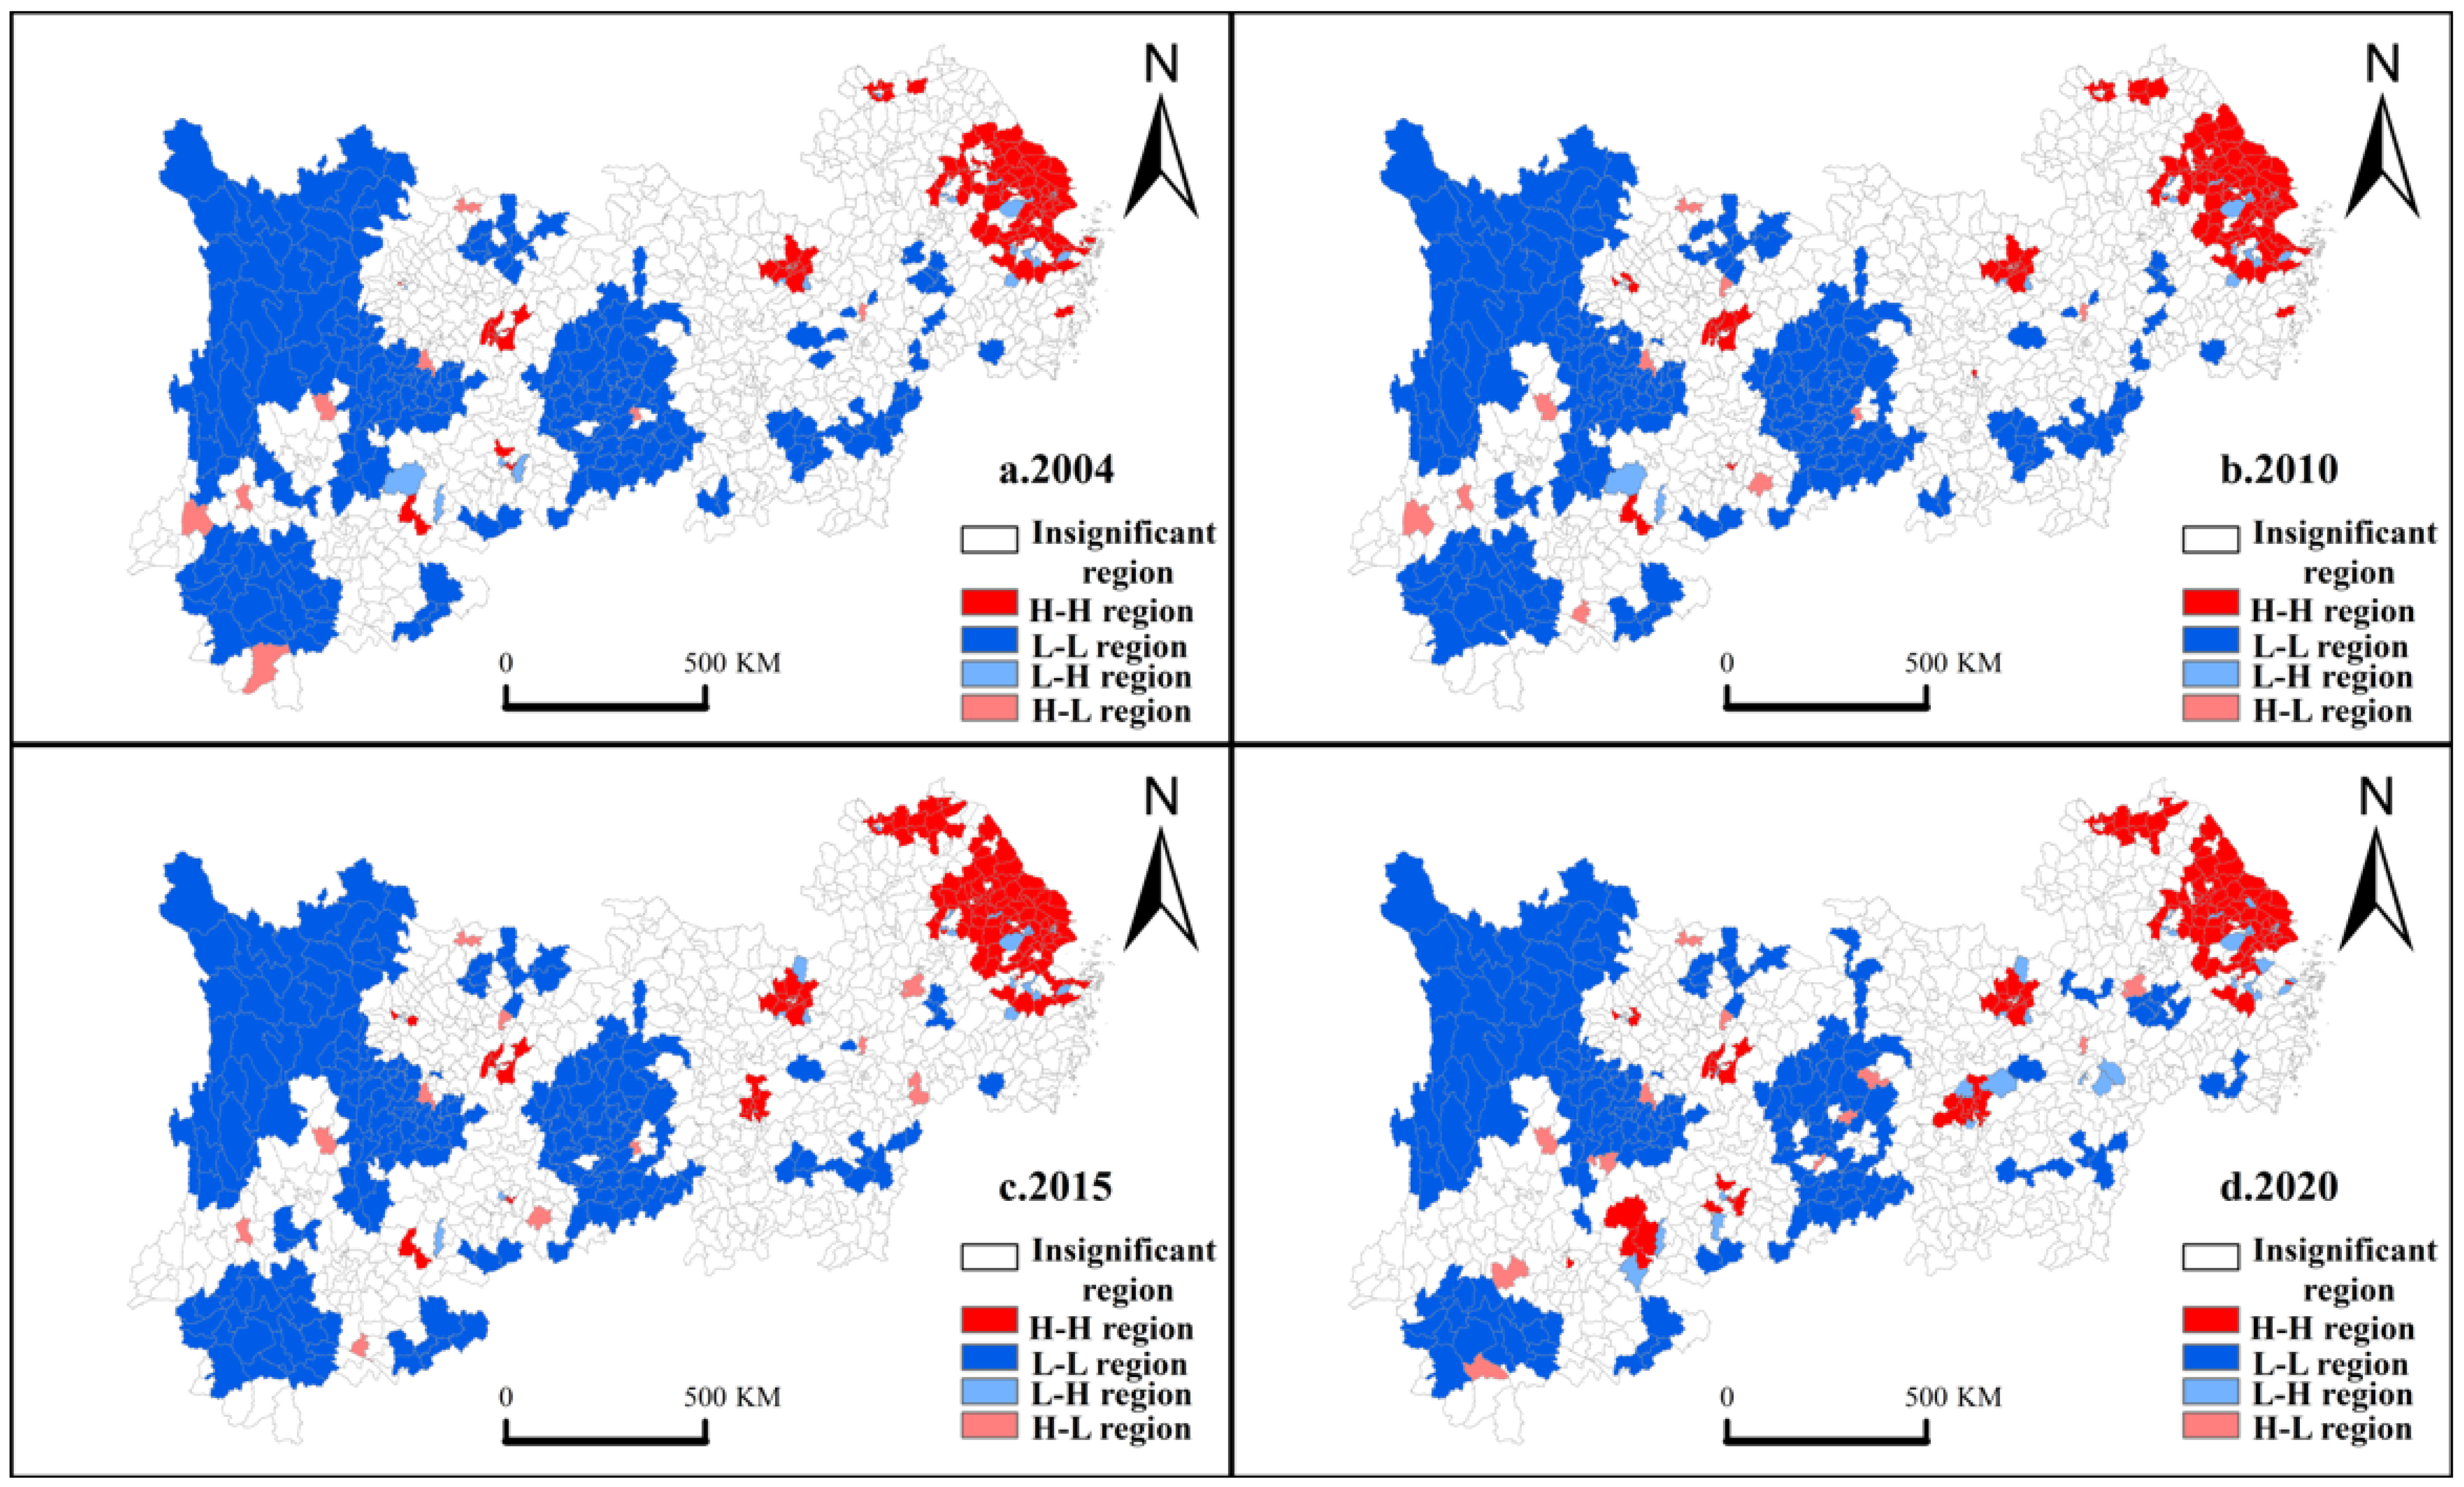
At the county scale (Figure 7), the percentage of clustering was roughly the same for all four periods. In 2004, for example, a total of 34.61% of the counties showed significant clustering. A total of 105 and 227 counties belonged to HH and LL types, respectively, accounting for 91.2% of the total number of significant types, while 8 and 24 counties belonged to HL and LH types, respectively, accounting for 8.8% of the total number of significant types. The HH type showed a clustering trend and was mainly distributed in most counties in south–central Jiangsu, Shanghai, and northern Zhejiang, and the surrounding counties in Changsha, Hubei, Chongqing, and Sichuan, with only sporadic counties of the HH type in other regions, and the LL type was mainly distributed in most counties in Sichuan, Yunnan, Guizhou, Hunan, and Jiangxi. The overall significance was almost unchanged in 2010. In 2015, the HH type was found in the counties around northern Jiangsu Xuzhou and Suqian counties, as well as sporadic new HH-type areas in Changsha, Hunan Province. In 2020, HH types showed good centripetal aggregation, while LL types showed weaker centripetal aggregation, but the overall lumpy distribution status remained unchanged. In general, county-scale carbon emissions show a strong positive spatial correlation, and the county scale and municipal scale are consistent from a macro-perspective, but the regional agglomeration characteristics are different and have stronger spatial heterogeneity and regional aggregation characteristics than the municipal scale, and it is possible to determine that high-carbon aggregation counties of Jiangsu, Zhejiang, and Shanghai in the lower reaches of the Yangtze River, which belong to the HH accumulation, can be used as a precise emission reduction area.

4. Decoupling of Carbon Emissions from Economic Development at Different Scales

To optimally scrutinize the status of decoupling between economic development and carbon emissions across varying scales within the Yangtze River Economic Belt, it is important to note that the decoupling effect generally manifests over a time scale of 5 to 10 years. In this context, the year 2004 is set as the foundational period for this study. Subsequently, two temporal nodes at 2010 and 2015 are incorporated, thereby establishing three distinct periods: 2004–2010, 2010–2015, and 2015–2020. The decoupling status between economic evolution and carbon emissions is analyzed for each of these intervals, thereby providing a comprehensive overview of the decoupling stance at each phase across different scales.

4.1. Provincial Scale

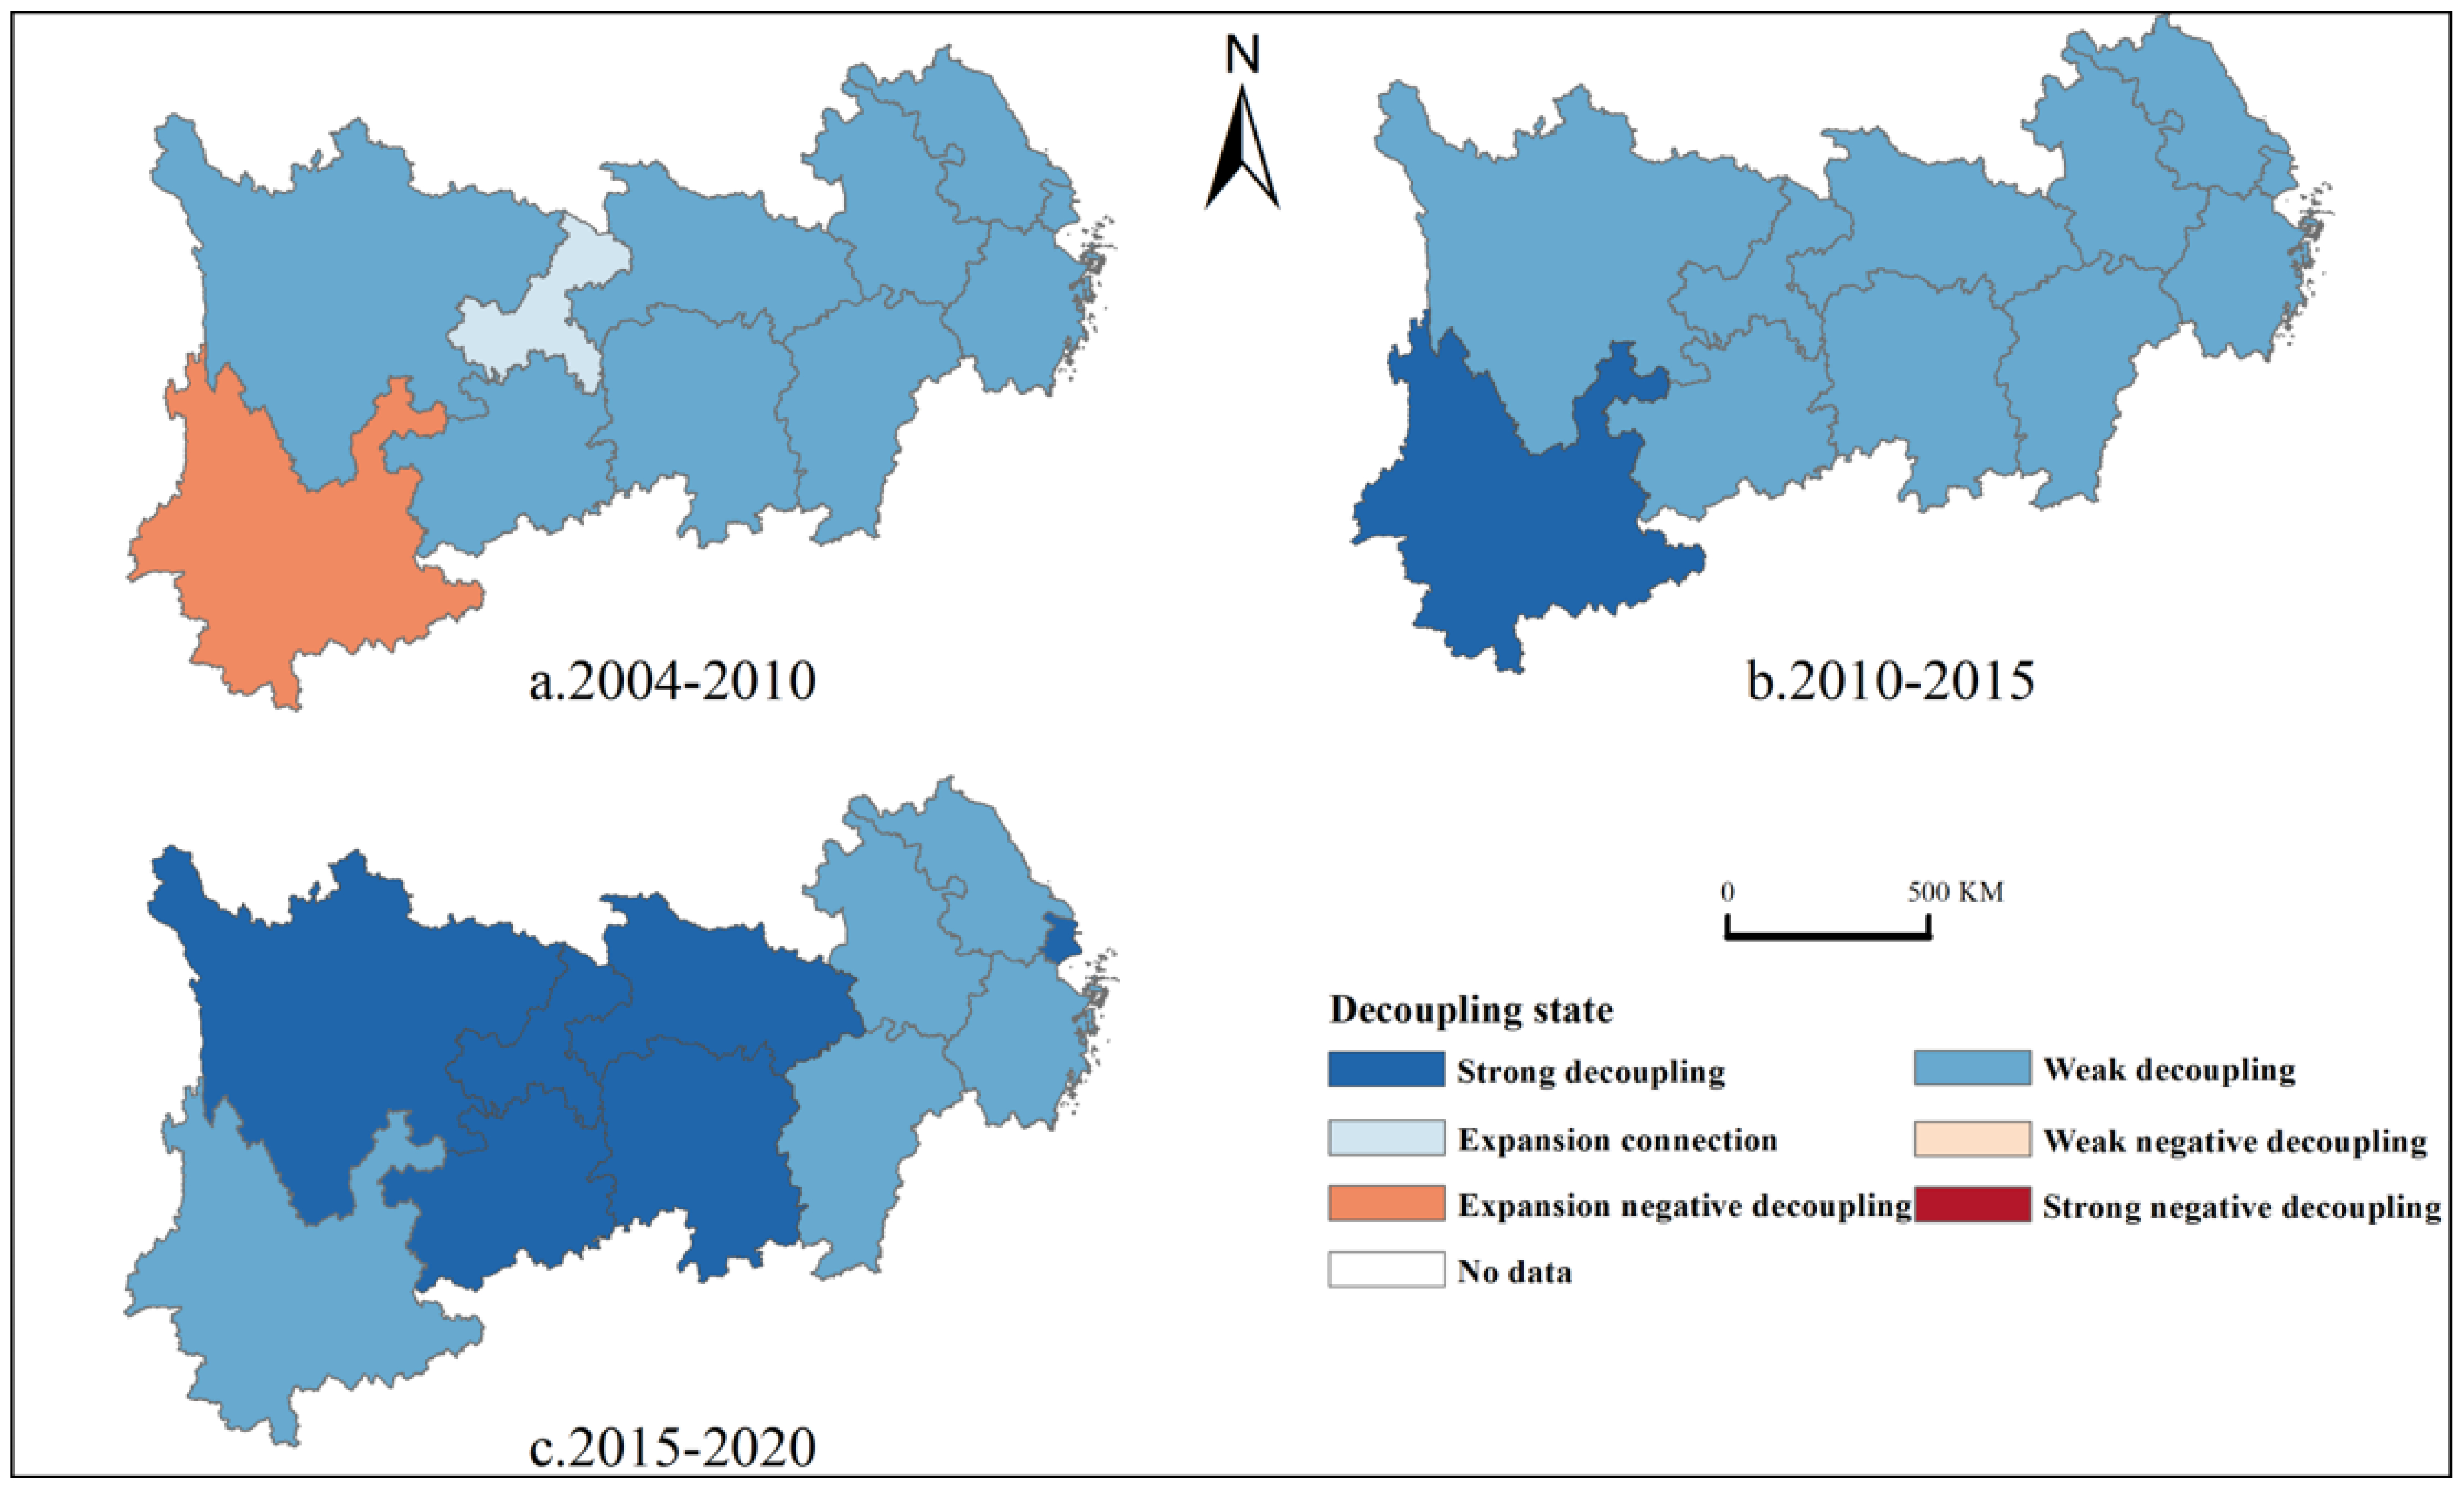
Examining the scenario from a provincial perspective (as depicted in Figure 8), the process of disassociating economic growth from carbon emissions in the Yangtze River Economic Belt, during the period from 2004 to 2020, typically presents an advantageous bearing. Predominantly, weak decoupling occurs, indicating a scenario where the pace of economic development supersedes the growth rate of carbon emissions. Between 2004 and 2010, only Chongqing and Yunnan within the Yangtze River Economic Belt exhibited states of expansionary connectivity and negative decoupling growth, respectively, while the majority were in a state of weak decoupling. Progressing to the period from 2010 to 2015, Chongqing transitioned from an expansionary linkage to a weak decoupling, while Yunnan shifted from a negative growth decoupling to a strong decoupling; the predominant state, however, was still weak decoupling that was gradually inclining towards a strong decoupling. From 2015 to 2020, the decoupling process of the Yangtze River Economic Belt conspicuously moved from weak decoupling to strong decoupling, signifying a period where the level of economic development continues to escalate while the carbon emissions shrink, thereby achieving the optimal stage of decoupling. This significant achievement can be attributed largely to the environmental plans and policies instituted at the national level about the Yangtze River Economic Zone, and the inception of the Comprehensive Plan for the Yangtze River Basin in 2010. These initiatives facilitated the ushering in of a new developmental phase markedly concentrated on the environmental and ecological conservation in the Yangtze River Basin while providing strategic guidance for the harmonized growth of the Yangtze River Economic Zone in achieving a balance between economic development and environmental preservation.

4.2. Municipal Scale

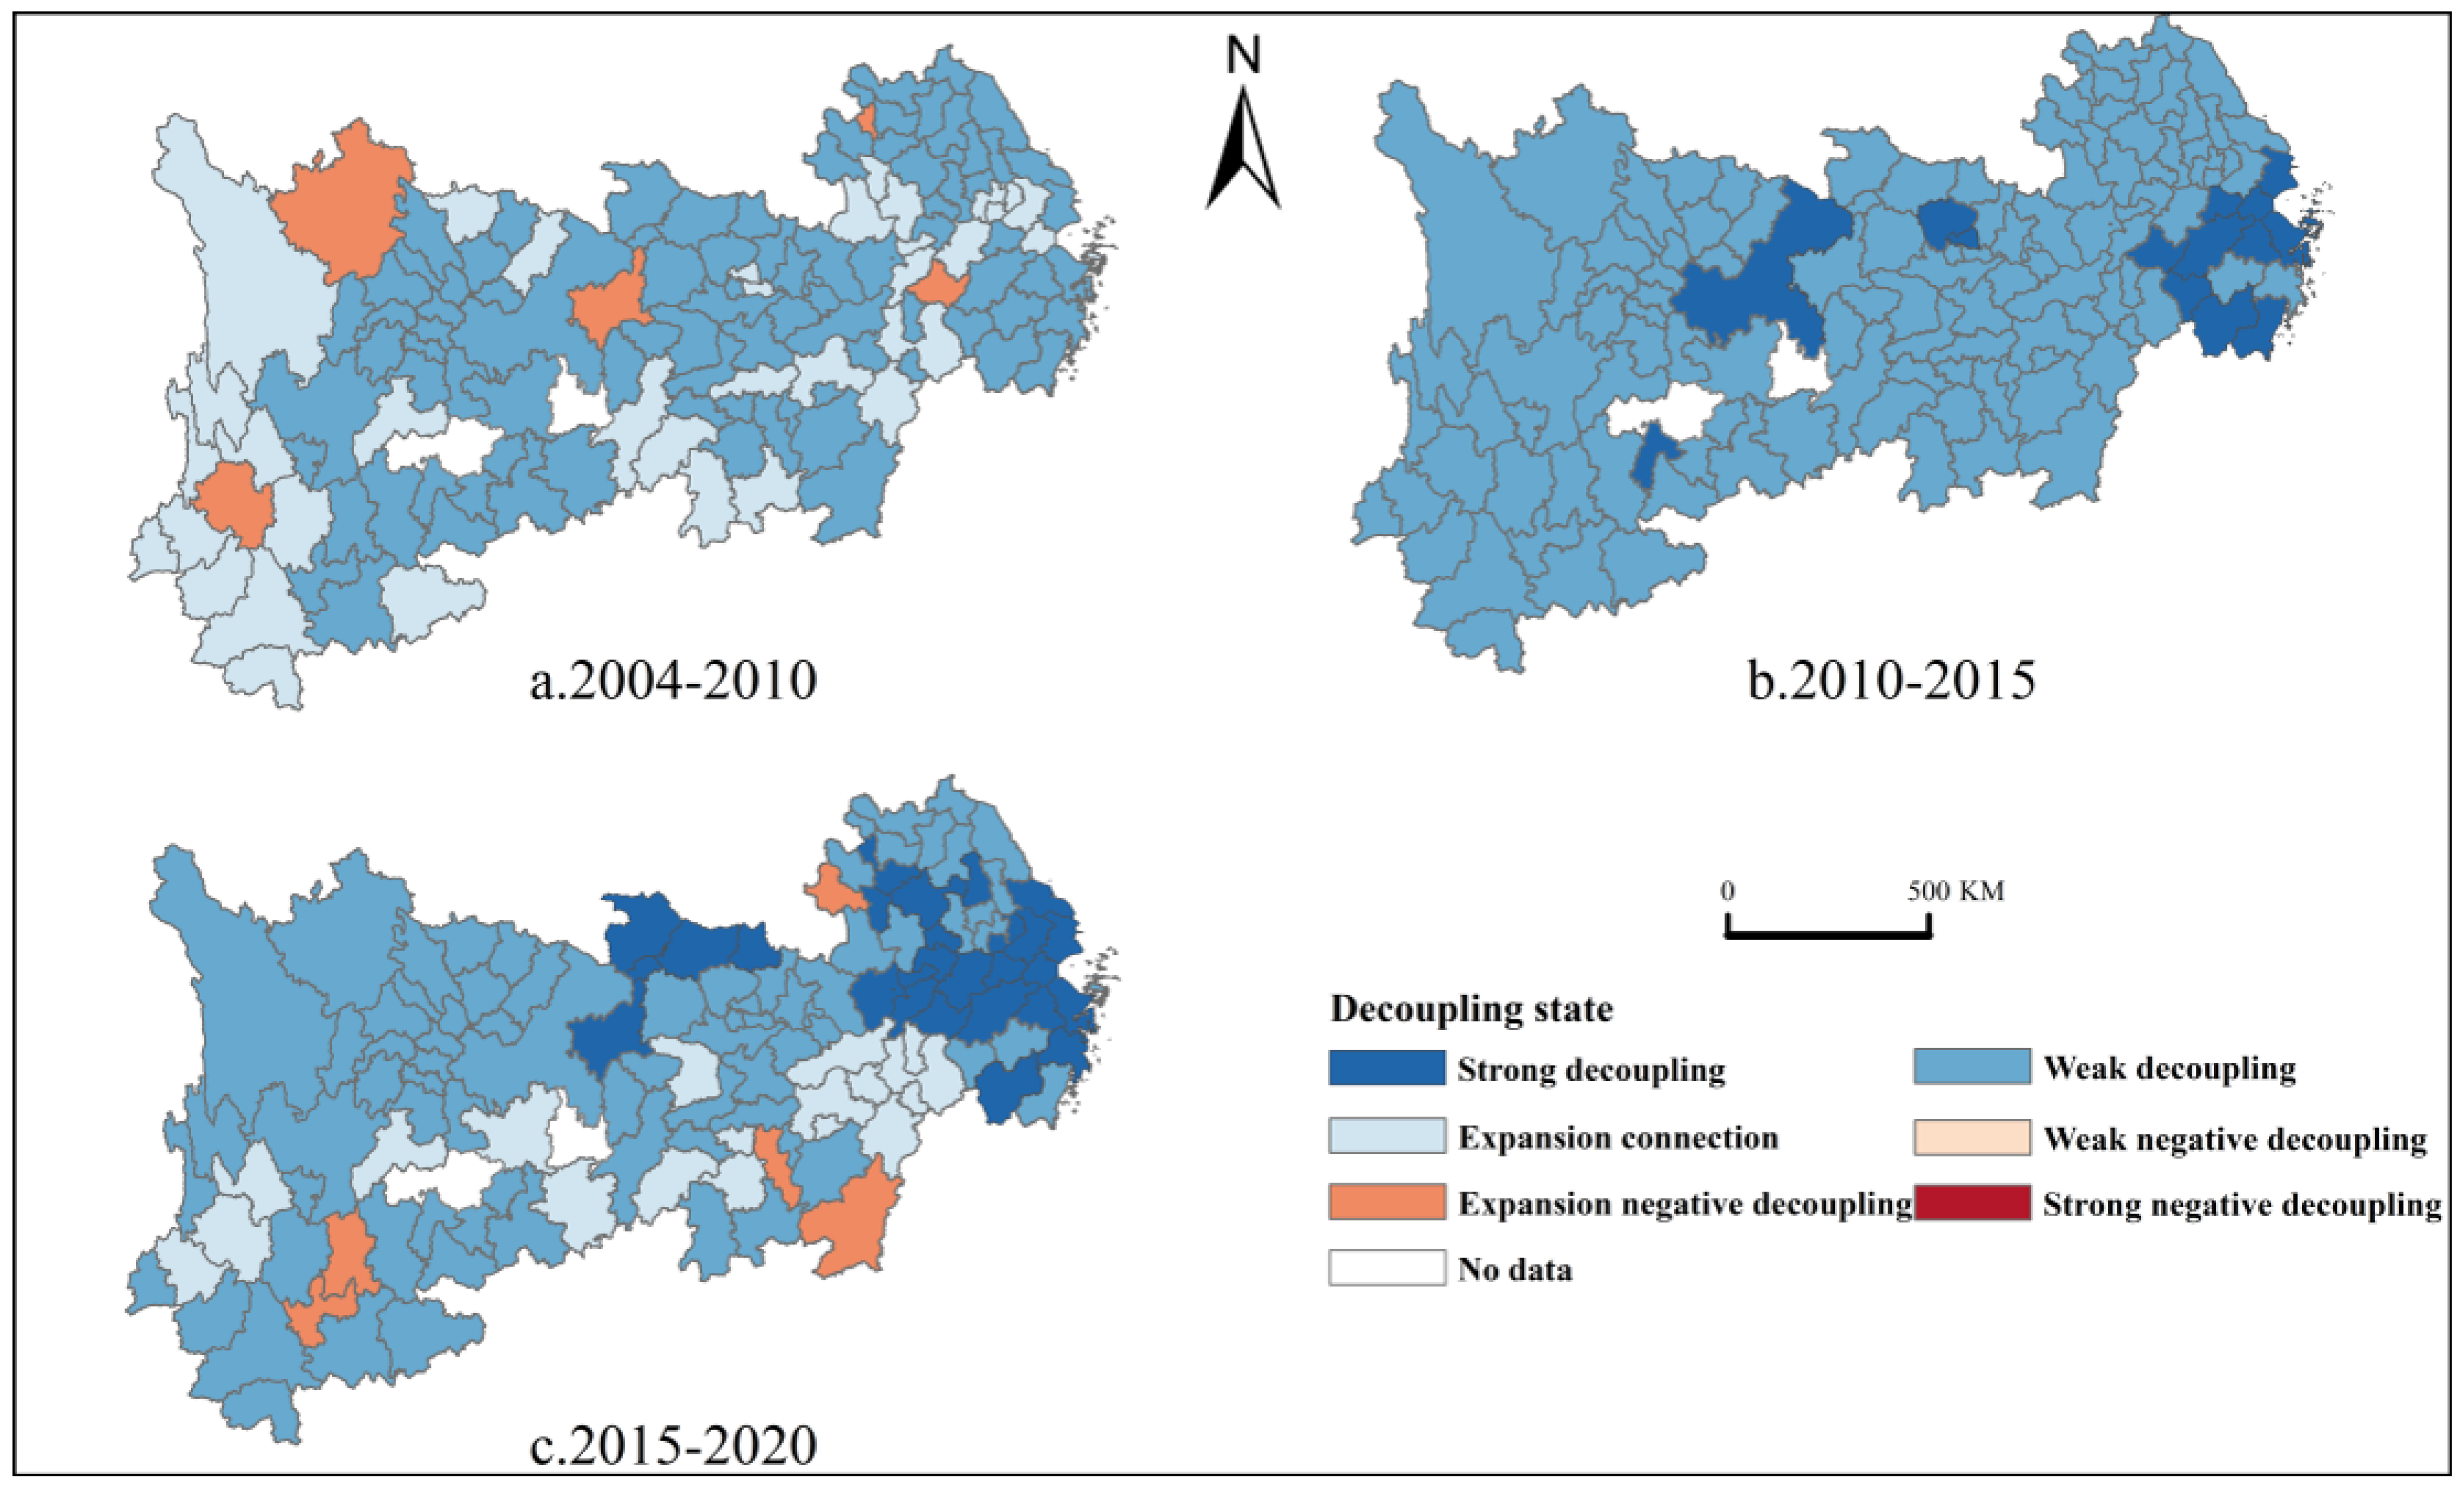
From a municipal perspective (Figure 9), the Yangtze River Economic Belt has maintained a relatively good decoupling between economic development and carbon emission changes over the three periods, but the number of municipalities in different states is relatively homogeneous (Table 5). Regarding 2004–2010, the Yangtze River Economic Belt was dominated by weak decoupling, with a small number of municipalities in the category of expansionary connectivity, mainly located in the western part of Sichuan, the western part of Yunnan, the southern part of Hunan, the northern part of Anhui, and the northern part of Jiangxi. From 2010 to 2015, almost all of the above areas with expanding connections turned into weak decoupling, while Chongqing, Liupanshui, Jingmen, Tianmen, Huangshan, Shanghai, and most of the municipalities in Zhejiang turned into strong decoupling with ideal decoupling, and the decoupling state in this period is tending to evolve towards the ideal state. Regarding 2015–2020, the weak decoupling in the lower part of the Yangtze River Economic Belt remains unchanged or advances to a strong decoupling state, with Suizhou, Shiyan, Xiangyang, Shennongjia Forestry Region, and Enshi Tujia–Miao Autonomous Region moving from a weak decoupling state to a strong decoupling state, but the decoupling trend is slightly declining and a large-scale regression is occurring in Chongqing, northern Hubei, southern Hunan, eastern Guizhou, and northwestern Yunnan and Jiangxi. Overall, the decoupling patterns exhibited over the three periods were dominated by weak and strong decoupling. The number of weakly decoupled municipalities shows a fluctuating increase and then a decrease, while the number of strongly decoupled municipalities shows a slow and orderly increase. The lower reaches of the Yangtze River Economic Belt show a more desirable state, mainly because in the wave of reform and opening up in the past century, the lower reaches were the first to develop due to the geographical advantage of being close to the sea, and the level of economic development was higher, and in the process of economic development, the results of energy and industry were adjusted continuously to make them more rational, and industrial development was not mainly driven by energy consumption, so the economic development and carbon emission of the lower reaches showed a more desirable decoupling state. Therefore, the decoupling of economic development and carbon emissions in downstream areas shows a more ideal state. Compared with the provincial scale, the decoupling status and spatial distribution of carbon emissions are somewhat different due to the differences in energy consumption characteristics and economic growth among different cities.

4.3. County Scale

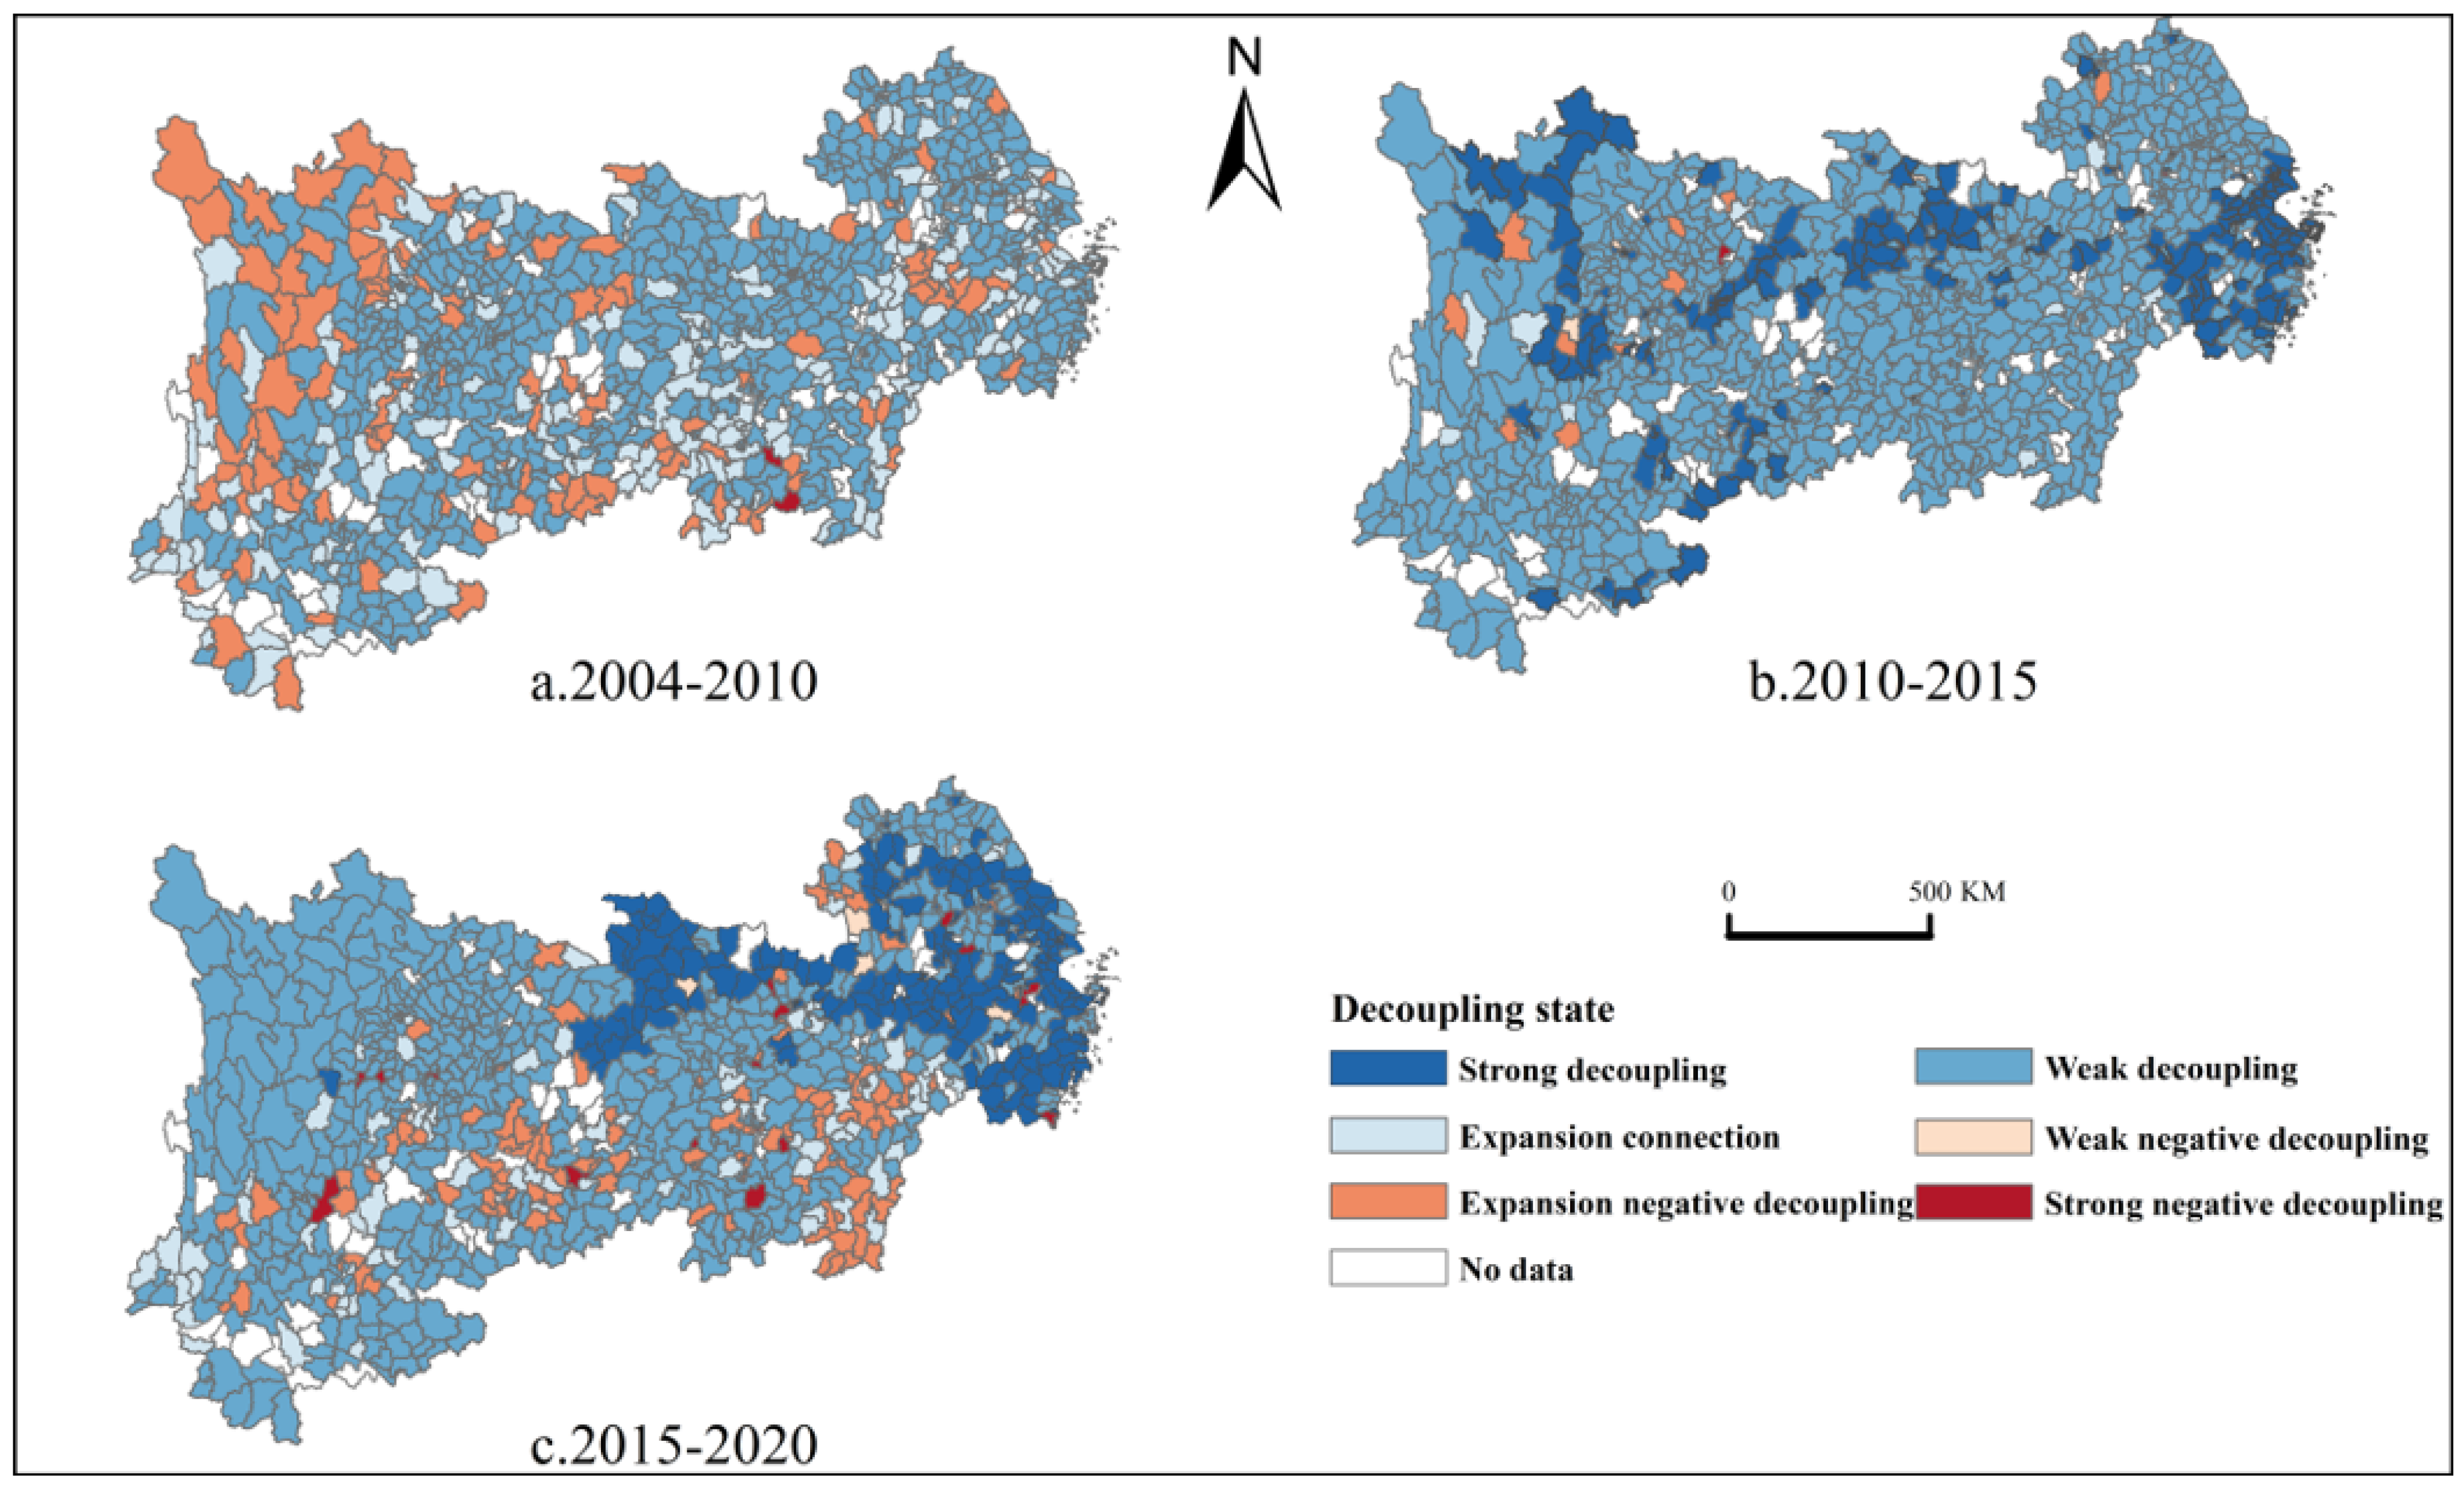
At the district and county level (Figure 10), the decoupling status of economic development and carbon emissions at the county level has evolved more dramatically over time, and the number and distribution of counties with different statuses has become more diverse. Regarding 2004–2010, the Yangtze River Economic Belt was dominated by weakly decoupled statuses, but a mix of clusters of negatively decoupled growth, weakly decoupled growth, and expansionary connectedness appeared in Sichuan, Yunnan, Hunan, and Anhui. Regarding 2010–2015, the number of negative growth decoupling and expansionary connectivity states declines sharply in this period, almost all of which turn into weak decoupling states, and strong decoupling states begin to appear in small-scale clusters, concentrated in Shanghai, Zhejiang, northwestern and central Hubei, northern and central Sichuan, Chongqing, etc. In 2015–2020, downstream Jiangsu, Zhejiang, Shanghai, Anhui, and midstream Hubei steadily advanced to strong decoupling states, which gradually evolved into a large area of a strongly decoupled agglomeration state. However, significant stagnation or regression occurs in northern and southern Jiangxi, northern Guizhou, western and eastern Yunnan, northern and central Sichuan, and Chongqing, showing significant decoupling regression. In general, the overall trend shows signs of a gradual decoupling of economic development and carbon emissions. However, some regions are still experiencing stagnation or even regression. The county scale is consistent with the municipal scale in the trend and distribution of the amount of strong and weak decoupling. The demarcation between the three periods primarily exhibits weak and strong decoupling, with weak decoupling depicting fluctuating transitions characterized initially by growth and subsequently by a decrease, and strong decoupling displaying a gradual increment. This is congruent with the studies conducted by Zhang He, among other scholars, focused on the county level, and some degree of similarity is also apparent in terms of the quantitative relationship manifested in the decoupling status [23]. The negative decoupling and expansionary conjunction prevailing in the middle and upper reaches of the Yangtze River Economic Belt can be primarily ascribed to the fragile economic foundation. A majority of the counties are in the incipient stages of economic development due to geographical limitations, and the swift propagation and expansion of industrialization have exerted significant stress on carbon emission mitigation in these counties. Despite mitigation in the later stages culminating in a transition in the decoupling state towards weak decoupling, the achievement of an ideal equilibrium between economic development and carbon emissions proves to be challenging. Conversely, the downstream counties demonstrate a more optimal decoupling status, which aligns with the observations made at the municipal scale.

4.4. Spatial Autocorrelation of Carbon Decoupling Indices

We calculated the global Moran’s I index and the corresponding Z-value and p-value for the multi-scale decoupling state of the Yangtze River Economic Zone, and the relevant results are shown in Table 5.
Considering that the p-values associated with the provincial scales are overly large, rendering them incapable of passing the significance test, the analysis of Moran’s I index at the provincial scales is omitted from this discussion. Moran’s I indices about the decoupling status of carbon at the city and county scales all exceed 0, with all successfully clearing the significance test, signifying a noteworthy positive correlation in carbon decoupling at these scales. An examination of Moran’s I index from a city-level standpoint reveals a trajectory of the index change, which initially inclines before subsequently declining, albeit with a minimal ratio of decline. This suggests that the degree of spatial aggregation of municipal carbon decoupling tends to stabilize over time. In terms of the Moran’s I index at the county scale, despite all the Moran’s I indices exceeding 0, the mean value is merely 0.038, signifying a feeble positive spatial correlation, and indicating a substantial disparity with that of the municipal carbon decoupling. Nevertheless, the directional pattern of Moran’s I index at the county level is in harmony with that at the municipal level.
Table 5. Results of global correlation analysis of carbon decoupling.
2004–20102010–20152015–2020
Moran’s I−0.0642−0.06030.0239
Provincialz0.54780.2360.222
p0.3520.3540.7258
Moran’s I0.17320.41340.4679
Municipalz3.30597.55008.6374
p0.0010.0010.001
Moran’s I0.01720.08270.0163
Countyz2.06606.63541.2088
p0.0000.0000.000

5. Conclusions and Discussion

5.1. Conclusions

(1) Characteristics of the spatial and temporal evolution of carbon emissions: At the provincial level, carbon emissions from energy consumption in the Yangtze River Economic Zone show a rising and then stable trend, with the total amount increasing from 2581 million tonnes in 2004 to 5463 million tonnes in 2020, and the growth rate of carbon emissions going from a rapid increase of 8.44 percent in the period 2004–2013 to a slow increase of 0.42 percent in the period 2014–2020. The provinces with higher total carbon emissions are Jiangsu and Zhejiang, and the provinces with lower total carbon emissions are Jiangxi and Chongqing. The total carbon emissions within the basin show the geographical differentiation of downstream > downstream > midstream. At the municipal scale, between 2004 and 2020, the carbon emission level of the Yangtze River Economic Belt gradually climbed from low to high and formed a trend of centripetal aggregation and peripheral diffusion. Initially, high carbon emissions were mainly in the cities of Chengdu, Chongqing, Wuhan, Suzhou, and Shanghai. With the economic development of south–central Jiangsu, Zhejiang, Shanghai, and the cities of Chongqing, Guiyang, Wuhan, and Changsha, the level of carbon emissions gradually shifted from low to intermediate and a stable center was formed. By 2020, the diffusion effect of carbon emissions accelerates, and the overall carbon emission level of the Yangtze River Economic Belt is once again on the rise. At the county level, in 2004, carbon emissions already showed a centripetal aggregation and peripheral diffusion pattern. Over time, the initial high-carbon counties gradually expanded and formed several carbon emission centers of different sizes.
(2) In terms of decoupling economic growth and carbon emissions, at the provincial level, the decoupling status of the Yangtze River Economic Belt is generally favorable, with weak decoupling dominating, and at the end of the study period, the weak decoupling status of Sichuan, Chongqing, Guizhou, Hunan, Hubei, and Shanghai turned into the most desirable strong decoupling status among the decoupling statuses. At the municipal scale, the Yangtze River Economic Belt has maintained a good decoupling between economic development and carbon emission changes over the three periods, with weak and strong decoupling during the study period, in which the number of weakly decoupled municipalities show a fluctuating change of increasing and then decreasing, while the number of strongly decoupled municipalities show a slow and orderly growth phenomenon, and they are mainly distributed in the downstream municipalities in most of the cities of Jiangsu, Zhejiang, and Shanghai. At the county scale, county decoupling states have evolved more significantly over time, and the number and distribution of counties in different states have become more diverse. During the study period, weakly decoupled and strongly decoupled states dominated the decoupling dynamics at the county scale, especially in the upper and middle reaches of the Yangtze River Economic Belt. Even though some regions are facing pressure on carbon emissions against the backdrop of a weak economic base and rapid industrialization, the overall trend shows signs of a gradual decoupling of economic development and carbon emissions. However, there are still some regions that have stagnated or even regressed, indicating that the desired state of affairs to be achieved still faces challenges.
(3) Spatial correlation of carbon emissions: The spatial distribution of carbon emissions in the Yangtze River Economic Zone from 2004 to 2020 shows a significant positive correlation and spatial agglomeration, especially at the city and county scales. Although the correlation at the provincial scale also shows a positive trend, it fails the significance test. In terms of the overall trend, the global Moran’s I index shows an upward trend from 2004 to 2010 and a downward trend from 2010 to 2020, with relatively small fluctuations. The Moran’s I indices at the city and county scales are relatively stable, suggesting that the spatial agglomeration trend in the Yangtze River Economic Belt has less interannual variation. In terms of the spatial correlation of decoupling, the decoupling status of economic growth and carbon emissions at both the city and county scales shows a significant positive correlation. The Moran’s I index at the municipal scale shows an upward and then downward trend, but with smaller fluctuations, indicating that the spatial aggregation of carbon decoupling at the municipal scale is gradually stabilized. Although the Moran’s I index at the county scale is also greater than 0, the average value is lower, indicating that the degree of spatial positive correlation is weaker, and there is a big difference with the municipal carbon decoupling.

5.2. Discussion

In this paper, we have analyzed the characteristics of the spatial and temporal evolution of carbon emissions and the decoupling effect at different scales in the Yangtze River Economic Belt, and by comparing the results with those of other studies, we can gain a deeper understanding of the unique contributions and limitations of this study.
(1) Characteristics of spatial and temporal evolution of carbon emissions
This study depicts in detail the dynamics of carbon emissions in the Yangtze River Economic Belt from the provincial level to the county level, showing clear geographic differentiation and temporal changes. This echoes other studies such as the work of Lv [39] et al. who similarly observed a slowdown in the growth of carbon emissions in some parts of China. However, the uniqueness of this study is that it provides a more detailed scaling analysis that reveals the differences and evolutionary trends of carbon emissions between different administrative levels, which can help to locate more precisely the priority regions for policy interventions.
(2) Decoupling analysis of economic growth and carbon emissions
In terms of the decoupling analysis of economics and carbon emissions, this study finds that some regions of the Yangtze River Economic Belt show a shift from weak to strong decoupling at different time periods and on different scales. This is in line with the study by Zhao [40] et al. who pointed out that carbon emissions in some regions have been reduced under the impetus of economic growth. This study further refines this by demonstrating the specific evolution of the decoupling status and regional differences through detailed analyses at the municipal and county levels, providing richer data support for understanding the balance between economic development and environmental protection.
(3) Spatial correlation of carbon emissions
By using the Moran’s I index, this study analyzed the spatial correlation and agglomeration of carbon emissions in the Yangtze River Economic Belt and found a significant positive correlation and spatial agglomeration of carbon emissions at the city and county levels. This is consistent with the findings of He [41] et al. who reported the spatial clustering characteristics of carbon emissions in major urban agglomerations in China. The novelty of this study is that it also explores the spatial correlation of the decoupling status, revealing the spatial distribution characteristics of different regions in terms of decoupling economic growth and carbon emissions, which is an important guide for local governments in formulating regional low-carbon development strategies.

6. Policy Recommendations

(1) It is incumbent on governmental authorities across all strata within the Yangtze River Economic Belt to devise a multi-scale carbon emission estimation model. This model should transcend a granular data analysis, encompassing both macro-national and micro-township levels, and champion the enhancement in inter-regional information exchange and collaborative efforts. The advent of a collaboration platform that transcends sectors and regions is capable of achieving a comprehensive amalgamation of data and optimal resource allotments. Such an approach can serve as an effective pedestal to facilitate informed decision making about the pursuit of low-carbon development trajectories within the Yangtze River Economic Belt. Simultaneously, it can stimulate the advancement in environmental conservation measures and the realization of sustainable development objectives.
(2) Acknowledging the heterogeneous development across provinces within the Yangtze River Economic Belt, there is a pressing need to design region-specific carbon emission reduction policies, sculpted to align with local circumstances. The eastern coastal provinces of China, Jiangsu and Zhejiang, have consistently reported elevated carbon emissions. Noteworthy high-tech industrial hubs such as Suzhou, Wuxi, and Changzhou fall within the category of medium-to-high-carbon cities, while Ningbo stands as a crucial manufacturing base in China. The policy formulations targeting carbon emission reduction in these areas should prioritize the restructuring of the industrial configuration. The Yangtze River Economic Belt, by and large, exhibits underdeveloped mineral and energy resources with coal forming the primal energy source being largely dominant. Guizhou, Sichuan, and Chongqing are principal energy resource provinces within the longitudinal expanse of the Yangtze River Economic Belt; however, these upstream provinces battle the infrastructural challenges of transport inconvenience, fragile industrial bases, and underdeveloped economies. The potential of their energy and mineral sectors remains largely untapped. Hence, the carbon emission reduction strategies for these upstream cities should concentrate on augmenting energy utilization efficiency and transfiguring the energy structure. The low-carbon regions should strive to adopt the advantageous industries prevalent upstream whilst upholding their low-carbon leverage.
(3) Considering the distinctive geographical concentration attributes of carbon decoupling across various scales, strategic policy formulation aimed at restraining carbon emissions must commence from diverse scales and firmly dictate targeted carbon control objectives. At the provincial scale, upstream regions, such as Yunnan, and downstream provinces, including Jiangsu, Zhejiang, Anhui, and Jiangxi, necessitate their respective adjustments of the energy composition and industrial outcomes. At the municipal level, given the significant spatial agglomeration effect of decoupling, cities exhibiting decoupling and aggregation within the upstream and middle reaches ought to focus on regional coordination, synergy, and simultaneous modifications to the industrial structure and regional energy efficiency. At the county level, where a complex blend of decoupling states exists, the strategy to control carbon emissions must lend appropriate attention to the radiation and catalytic impact of ideally decoupled counties within their respective regions and establish precise, targeted goals for carbon control. Promoting the synergistic advantages and equitable allotments of carbon emission reductions in the neighboring regions is a pertinent strategy in an environment where various decoupling states are intrinsically linked at the county level.

Author Contributions

Conceptualization, H.H.; Methodology, H.H.; Software, M.Y.; Writing—original draft, H.H.; Writing—review & editing, H.H.; Project administration, L.W.; Funding acquisition, L.W. All authors have read and agreed to the published version of the manuscript.

Funding

This research was funded by the Xinjiang Uygur Autonomous Region Postgraduate Education Teaching Reform Research Project: XJ2022GY14; the Research Initiation Program for High-level Talents at Shihezi University: RCZK2018C21.

Data Availability Statement

All data is included in the article.

Conflicts of Interest

The authors declare no conflict of interest.

References

  1. Thomas, C.D.; Cameron, A.; Green, R.E.; Bakkenes, M.; Beaumont, L.J.; Collingham, Y.C.; Erasmus, B.F.N.; de Siqueira, M.F.; Grainger, A.; Hannah, L.; et al. Extinction risk from climate change. Nature 2004, 427, 145–148. [Google Scholar] [CrossRef]
  2. Chen, J.G.; Crooks, R.M.; Seefeldt, L.C.; Bren, K.L.; Bullock, R.M.; Darensbourg, M.Y.; Holland, P.L.; Hoffman, B.; Janik, M.J.; Jones, A.K.; et al. Beyond fossil fuel–driven nitrogen transformations. Science 2018, 360, eaar6611. [Google Scholar] [CrossRef] [PubMed]
  3. Wise, M.; Calvin, K.; Thomson, A.; Clarke, L.; Bond-Lamberty, B.; Sands, R.; Smith, S.J.; Janetos, A.; Edmonds, J. Implications of Limiting CO2 Concentrations for Land Use and Energy. Science 2009, 324, 1183–1186. [Google Scholar] [CrossRef] [PubMed]
  4. Rehman, A.; Rauf, A.; Ahmad, M.; Chandio, A.A.; Deyuan, Z. The effect of carbon dioxide emission and the consumption of electrical energy, fossil fuel energy, and renewable energy, on economic performance: Evidence from Pakistan. Environ. Sci. Pollut. Res. 2019, 26, 21760–21773. [Google Scholar] [CrossRef] [PubMed]
  5. Liu, K.; Xue, M.; Peng, M.; Wang, C. Impact of spatial structure of urban agglomeration on carbon emissions: An analysis of the Shandong Peninsula, China. Technol. Forecast. Soc. Chang. 2020, 161, 120313. [Google Scholar] [CrossRef]
  6. Cui, S.; Wang, Y.; Xu, P.; Shi, Y.; Liu, C. Spatial-temporal multi-factor decomposition and two-dimensional decoupling analysis of China’s carbon emissions: From the perspective of whole process governance. Environ. Impact Assess. Rev. 2023, 103, 107291. [Google Scholar] [CrossRef]
  7. Wei, X.; Ma, Q.; Su, H. Spatiotemporal effect and influencing factors of the total factor energy efficiency: Evidence from the urban agglomerations in China. Ecol. Indic. 2024, 161, 111984. [Google Scholar] [CrossRef]
  8. Zhang, Z.; Luo, X.; Hu, H.; Du, J.; Xu, B. Market integration and urban air quality: Evidence from the Yangtze River Economic Belt of China. Econ. Anal. Policy 2023, 80, 910–928. [Google Scholar] [CrossRef]
  9. Wu, W.; Zhang, T.; Xie, X.; Huang, Z. Regional low carbon development pathways for the Yangtze River Delta region in China. Energy Policy 2021, 151, 112172. [Google Scholar] [CrossRef]
  10. Han, H.; Li, H.; Zhang, K. Spatial-Temporal Coupling Analysis of the Coordination between Urbanization and Water Ecosystem in the Yangtze River Economic Belt. Int. J. Environ. Res. Public Health 2019, 16, 3757. [Google Scholar] [CrossRef] [PubMed]
  11. Feng, Y.; Ning, M.; Lei, Y.; Sun, Y.; Liu, W.; Wang, J. Defending blue sky in China: Effectiveness of the “Air Pollution Prevention and Control Action Plan” on air quality improvements from 2013 to 2017. J. Environ. Manag. 2019, 252, 109603. [Google Scholar] [CrossRef] [PubMed]
  12. Yang, L.; Yang, Y.; Zhang, X.; Tang, K. Whether China’s industrial sectors make efforts to reduce CO2 emissions from production?A decomposed decoupling analysis. Energy 2018, 160, 796–809. [Google Scholar] [CrossRef]
  13. Jia, K.; Yuan, R. The impact of basin horizontal ecological compensation policies on carbon emissions: A case study of the Yangtze river economic Belt. Heliyon 2024, 10, e28858. [Google Scholar] [CrossRef] [PubMed]
  14. Liu, X.-J.; Jin, X.-B.; Luo, X.-L.; Zhou, Y.-K. Multi-scale variations and impact factors of carbon emission intensity in China. Sci. Total Environ. 2023, 857, 159403. [Google Scholar] [CrossRef] [PubMed]
  15. Luo, H.; Wang, C.; Li, C.; Meng, X.; Yang, X.; Tan, Q. Multi-scale carbon emission characterization and prediction based on land use and interpretable machine learning model: A case study of the Yangtze River Delta Region, China. Appl. Energy 2024, 360, 122819. [Google Scholar] [CrossRef]
  16. Zhou, K.; Yang, J.; Yin, H.; Ding, T. Multi-scenario reduction pathways and decoupling analysis of China’s sectoral carbon emissions. iScience 2023, 26, 108404. [Google Scholar] [CrossRef] [PubMed]
  17. Wei, M.; Cai, Z.; Song, Y.; Xu, J.; Lu, M. Spatiotemporal evolutionary characteristics and driving forces of carbon emissions in three Chinese urban agglomerations. Sustain. Cities Soc. 2024, 104, 105320. [Google Scholar] [CrossRef]
  18. Wang, Y.; Niu, Y.; Li, M.; Yu, Q.; Chen, W. Spatial structure and carbon emission of urban agglomerations: Spatiotemporal characteristics and driving forces. Sustain. Cities Soc. 2022, 78, 103600. [Google Scholar] [CrossRef]
  19. Wang, J.; Dong, X.; Dong, K. How does ICT agglomeration affect carbon emissions? The case of Yangtze River Delta urban agglomeration in China. Energy Econ. 2022, 111, 106107. [Google Scholar] [CrossRef]
  20. Wang, X.; Shen, Y.; Su, C. Spatial—Temporal evolution and driving factors of carbon emission efficiency of cities in the Yellow River Basin. Energy Rep. 2023, 9, 1065–1070. [Google Scholar] [CrossRef]
  21. Liu, Q.; Song, J.; Dai, T.; Shi, A.; Xu, J.; Wang, E. Spatio-temporal dynamic evolution of carbon emission intensity and the effectiveness of carbon emission reduction at county level based on nighttime light data. J. Clean. Prod. 2022, 362, 132301. [Google Scholar] [CrossRef]
  22. Wu, Y.; Zhu, Q.; Zhu, B. Decoupling analysis of world economic growth and CO2 emissions: A study comparing developed and developing countries. J. Clean. Prod. 2018, 190, 94–103. [Google Scholar] [CrossRef]
  23. Shuai, C.; Chen, X.; Wu, Y.; Zhang, Y.; Tan, Y. A three-step strategy for decoupling economic growth from carbon emission: Empirical evidences from 133 countries. Sci. Total Environ. 2019, 646, 524–543. [Google Scholar] [CrossRef]
  24. Zhang, J.; Fan, Z.; Chen, Y.; Gao, J.; Liu, W. Decomposition and decoupling analysis of carbon dioxide emissions from economic growth in the context of China and the ASEAN countries. Sci. Total Environ. 2020, 714, 136649. [Google Scholar] [CrossRef] [PubMed]
  25. Loo, B.P.Y.; Banister, D. Decoupling transport from economic growth: Extending the debate to include environmental and social externalities. J. Transp. Geogr. 2016, 57, 134–144. [Google Scholar] [CrossRef]
  26. Zheng, X.; Wang, R.; He, Q. A city-scale decomposition and decoupling analysis of carbon dioxide emissions: A case study of China. J. Clean. Prod. 2019, 238, 117824. [Google Scholar] [CrossRef]
  27. Gao, C.; Ge, H.; Lu, Y.; Wang, W.; Zhang, Y. Decoupling of provincial energy-related CO2 emissions from economic growth in China and its convergence from 1995 to 2017. J. Clean. Prod. 2021, 297, 126627. [Google Scholar] [CrossRef]
  28. Zhang, Z.; Sharifi, A. Analysis of decoupling between CO2 emissions and economic growth in China’s provincial capital cities: A Tapio model approach. Urban Clim. 2024, 55, 101885. [Google Scholar] [CrossRef]
  29. Li, K.; Zhou, Y.; Xiao, H.; Li, Z.; Shan, Y. Decoupling of economic growth from CO2 emissions in Yangtze River Economic Belt cities. Sci. Total Environ. 2021, 775, 145927. [Google Scholar] [CrossRef]
  30. Shan, Y.; Fang, S.; Cai, B.; Zhou, Y.; Li, D.; Feng, K.; Hubacek, K. Chinese cities exhibit varying degrees of decoupling of economic growth and CO2 emissions between 2005 and 2015. One Earth 2021, 4, 124–134. [Google Scholar] [CrossRef]
  31. Yang, X.; Jin, K.; Duan, Z.; Gao, Y.; Sun, Y.; Gao, C. Spatial-temporal differentiation and influencing factors of carbon emission trajectory in Chinese cities—A case study of 247 prefecture-level cities. Sci. Total Environ. 2024, 928, 172325. [Google Scholar] [CrossRef] [PubMed]
  32. Zhang, J.; Lu, H.; Peng, W.; Zhang, L. Analyzing carbon emissions and influencing factors in Chengdu-Chongqing urban agglomeration counties. J. Environ. Sci. 2024, 151, 640–651. [Google Scholar] [CrossRef]
  33. Wang, G.; Peng, W.; Xiang, J.; Ning, L.; Yu, Y. Modelling spatiotemporal carbon dioxide emission at the urban scale based on DMSP-OLS and NPP-VIIRS data: A case study in China. Urban Clim. 2022, 46, 101326. [Google Scholar] [CrossRef]
  34. Cai, A.-Z.; Guo, R.; Zhang, Y.-H.; Wu, J. Status and trends of carbon emissions research at the county level in China. Adv. Clim. Chang. Res. 2024. [Google Scholar] [CrossRef]
  35. Wu, Y.; Shi, K.; Chen, Z.; Liu, S.; Chang, Z. Developing Improved Time-Series DMSP-OLS-Like Data (1992–2019) in China by Integrating DMSP-OLS and SNPP-VIIRS. IEEE Trans. Geosci. Remote Sens. 2022, 60, 1–14. [Google Scholar] [CrossRef]
  36. Chen, J.; Gao, M.; Cheng, S.; Hou, W.; Song, M.; Liu, X.; Liu, Y.; Shan, Y. County-level CO2 emissions and sequestration in China during 1997–2017. Sci. Data 2020, 7, 391. [Google Scholar] [CrossRef] [PubMed]
  37. Chen, J.; Gao, M.; Cheng, S.; Liu, X.; Hou, W.; Song, M.; Li, D.; Fan, W. China’s city-level carbon emissions during 1992–2017 based on the inter-calibration of nighttime light data. Sci. Rep. 2021, 11, 3323. [Google Scholar] [CrossRef] [PubMed]
  38. Tapio, P. Towards a theory of decoupling: Degrees of decoupling in the EU and the case of road traffic in Finland between 1970 and 2001. Transp. Policy 2005, 12, 137–151. [Google Scholar] [CrossRef]
  39. Lv, Q.; Liu, H.; Wang, J.; Liu, H.; Shang, Y. Multiscale analysis on spatiotemporal dynamics of energy consumption CO2 emissions in China: Utilizing the integrated of DMSP-OLS and NPP-VIIRS nighttime light datasets. Sci. Total Environ. 2020, 703, 134394. [Google Scholar] [CrossRef] [PubMed]
  40. Zhao, X.; Jiang, M.; Zhang, W. Decoupling between Economic Development and Carbon Emissions and Its Driving Factors: Evidence from China. Int. J. Environ. Res. Public Health 2022, 19, 2893. [Google Scholar] [CrossRef]
  41. He, X.; Guan, D.; Yang, X.; Zhou, L.; Gao, W. Quantifying the trends and affecting factors of CO2 emissions under different urban development patterns: An econometric study on the Yangtze river economic belt in China. Sustain. Cities Soc. 2024, 107, 105443. [Google Scholar] [CrossRef]
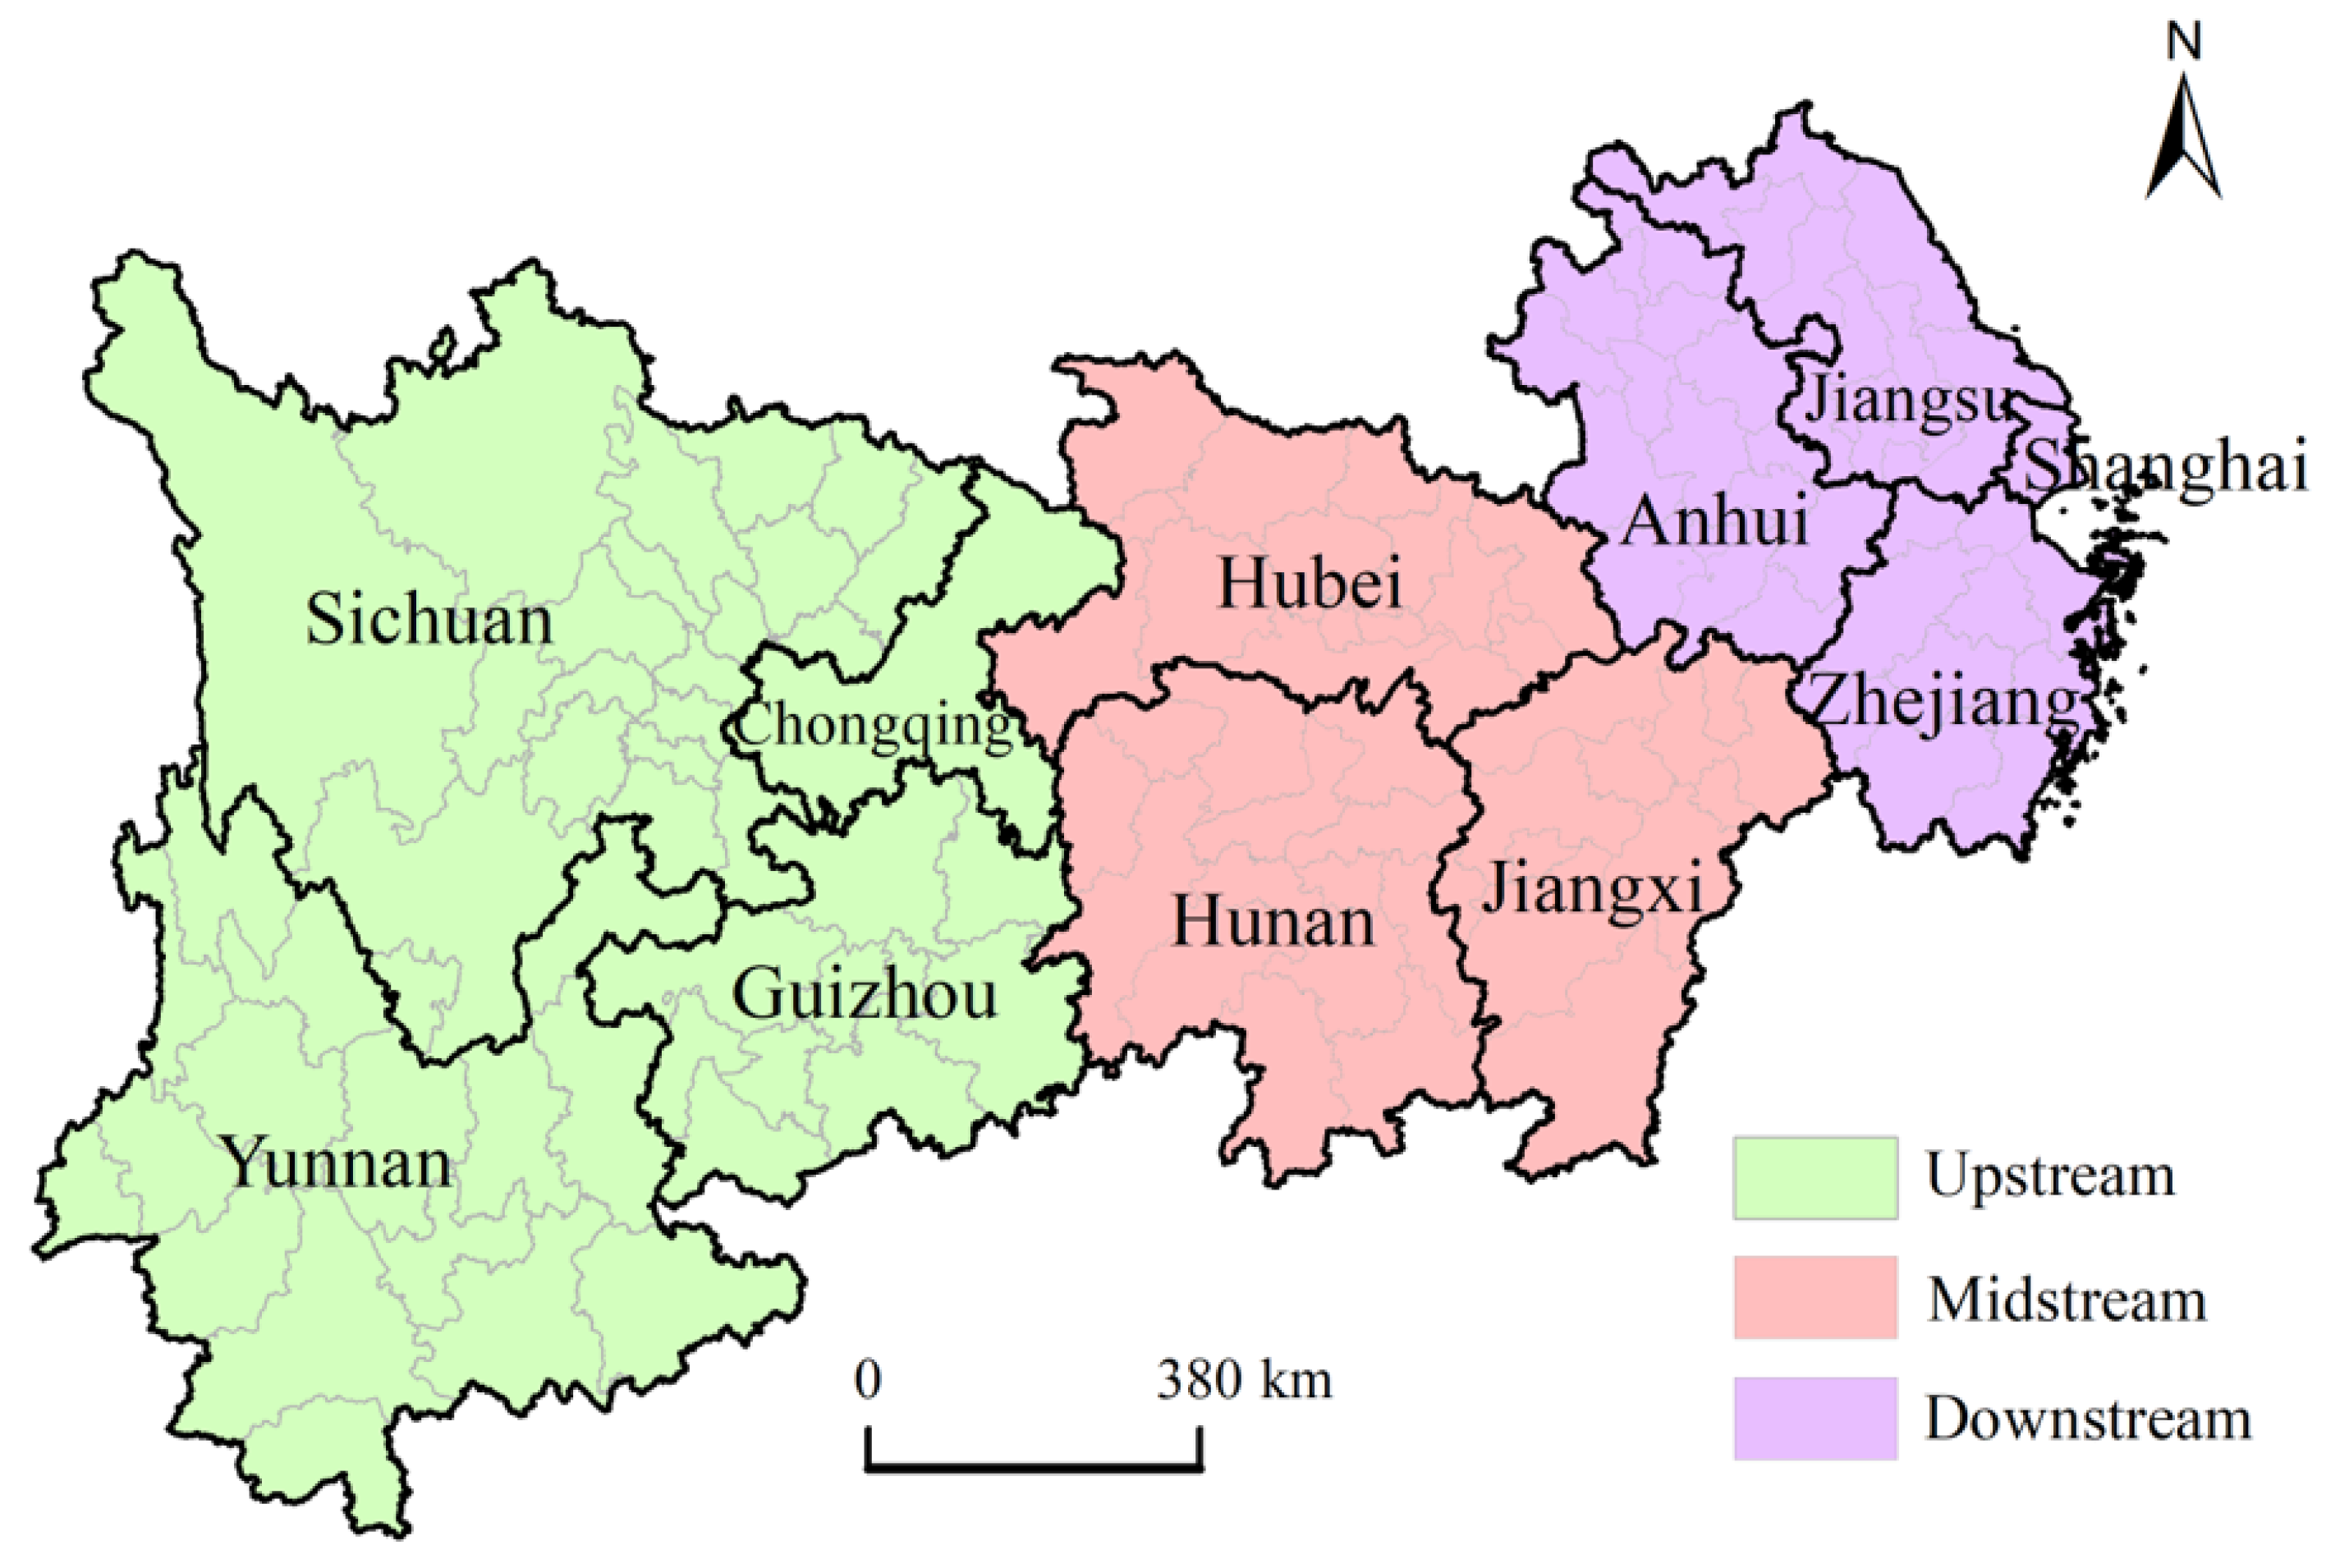
Figure 1. Administrative divisions of the Yangtze River Economic Belt.
Sustainability 16 04222 g001
Figure 2. Trends in carbon emissions in the Yangtze River Economic Belt, 2004–2020.
Sustainability 16 04222 g002
Figure 3. Characteristics of the evolution of carbon emissions at the provincial level.
Sustainability 16 04222 g003
Figure 4. Characteristics of the evolution of carbon emissions at the municipal scale.
Sustainability 16 04222 g004
Figure 5. Characteristics of the evolution of carbon emissions at the county scale.
Sustainability 16 04222 g005
Figure 6. The local spatial correlation of carbon emissions at the municipal scale.
Sustainability 16 04222 g006
Figure 7. The local spatial correlation of carbon emissions at the county scale.
Sustainability 16 04222 g007
Figure 8. Spatial pattern of decoupling effect of carbon emissions at provincial scale in Yangtze River Economic Belt, 2004–2020.
Sustainability 16 04222 g008
Figure 9. Spatial pattern of decoupling effect of carbon emissions at the municipal scale in Yangtze River Economic Belt, 2004–2020.
Sustainability 16 04222 g009
Figure 10. Spatial pattern of decoupling effect of carbon emissions at provincial scale in Yangtze River Economic Belt, 2004–2020.
Sustainability 16 04222 g010
Table 2. Fitted equations of carbon emissions from energy consumption in prefecture-level cities in Jiangsu Province.
CitiesFormulasR2CitiesFormulasR2
Nanjing y = 0.364 x 2 + 13.311 x 49.687 0.901Nantong y = 0.003 x 3 0.397 x 2 + 12.391 x 48.074 0.971
Suzhou y = 2.004 x 1.181 0.944Changzhou y = 0.053 x 3 + 1.065 x 2 1.785 x + 5.301 0.944
Wuxi y = 2.267 x 1.189 0.929Taizhou y = 0.405 x 2 + 10.517 x 25.634 0.956
Xuzhou y = 0.002 x 3 3.58 x 2 + 12.238 x 39.126 0.982Yancheng y = 2.042 x 1.265 0.902
Suqian y = 2.568 x 1.262 0.939Huai’an y = 0.762 x 2 + 13.992 x 28.427 0.961
Lianyungang y = 0.559 x 2 + 12.171 x 28.556 0.967
Table 3. Measures of decoupling status.
Decoupling StateC(t,t−1)G(t,t−1)T(t,t−1)Characteristics of Decoupling Types
Connectionrecession connection<0<00.8 < T < 1.2C and G are decreasing at a comparable rate
expansion connection>0>00.8 < T < 1.2C and G are growing at comparable rates
Decouplingrecession decoupling<0<0T > 1.2C is dropping faster than G
strong decoupling<0>0T < 0C down, G up
weak decoupling>0>00 < T < 0.8C is growing faster than G
Negative decouplingweak negative decoupling<0<00 < T < 0.8C is falling slower than G
strong negative decoupling>0<0T < 0C up, G down
expansion negative decoupling>0>0T > 1.2C is growing faster than G
Table 4. Results of global correlation analysis of carbon emissions.
2004201020152020
Moran’s I0.17090.02170.00300.1189
Provincialz1.53730.76570.70711.3680
p0.07300.22200.22800.1110
Moran’s I0.15150.21740.21430.1163
Municipalz3.50954.46924.29322.3751
p0.0030.0020.0020.002
Moran’s I0.48870.49550.48670.4264
Countyz27.748627.597726.484123.3188
p0.00000.00000.00000.0000
Disclaimer/Publisher’s Note: The statements, opinions and data contained in all publications are solely those of the individual author(s) and contributor(s) and not of MDPI and/or the editor(s). MDPI and/or the editor(s) disclaim responsibility for any injury to people or property resulting from any ideas, methods, instructions or products referred to in the content.