Article

Deformation Risk Assessment of the Lar Dam: Monitoring Its Stability Condition

by
Mehrnoosh Ghadimi
1,2,* and
Mohammadali Kiani
1,*
1
Faculty of Geography, University of Tehran, Tehran 1417853933, Iran
2
Institute of Seismology, Department of Geosciences and Geography, University of Helsinki, FI-00014 Helsinki, Finland
*
Authors to whom correspondence should be addressed.
Sustainability 2024, 16(11), 4335; https://doi.org/10.3390/su16114335
Submission received: 25 March 2024 / Revised: 29 April 2024 / Accepted: 14 May 2024 / Published: 21 May 2024
(This article belongs to the Section Hazards and Sustainability)

Abstract

:
Dam stability is one of the most essential geotechnical engineering challenges. Studying the structural behavior of dams during their useful life is an essential component of their safety. Terrestrial surveying network approaches are typically expensive and time-consuming. Over the last decade, the interferometric synthetic aperture radar (InSAR) method has been widely used to monitor millimeter displacements in dam crests. This research investigates the structural monitoring of the Lar Dam in Iran, using InSAR and the terrestrial surveying network technique to identify the possible failure risk of the dam. Sentinel-1A images taken from 5 February 2015 to 30 September 2019 and TerraSAR-X (09.05.2018 to 16.08.2018) images were analyzed to investigate the dam’s behavior. The InSAR results were compared with those of the terrestrial surveying network for the period of 1992 to 2019. The Sentinel-1 results implied that the dam on the left side moved over 8 mm/yr. However, the pillars to the left abutment indicated an uplift, which is consistent with the TerraSAR-X results. Also, the TerraSAR-X data indicated an 8 mm displacement over a three-month period. The terrestrial surveying showed that the largest uplift was 19.68 mm at the TB4 point on the left side and upstream of the body, while this amount was 10 mm in the interferometry analysis for the period of 2015–2020. The subsidence rate increased from the middle part toward the left abutment. The geological observations made during the ninth stage of the terrestrial surveying network indicate that there was horizontal and vertical movement over time, from 1992 to 2019. However, the results of the InSAR processing in the crown were similar to those of the terrestrial surveying network. Although different comparisons were used for the measurements, the difference in the displacement rates was reasonable, but all three methods showed the same trend in terms of uplift and displacement.

1. Introduction

Embankment dams are the most typical form of dams in the world, accounting for 78% of all dams [1]. Embankment dams are responsible for 80% of dam failures worldwide, indicating their predominance. A dam failure happens when a section of the dam or its foundation moves or subsides, causing the dam to leak water. In many cases, dam failure results in the escape of large amounts of water, which can represent a serious threat to humans and/or assets sitting downstream [2]. A tailings pond failure can be attributed to a number of factors, including seepage, overtopping, earthquakes, and other geological events. The consequences of such an incident are significant, with numerous casualties and property losses, as well as environmental damage. The tailings—which contain a substantial quantity of heavy metal elements—can cause soil pollution and the destruction of vegetation [3]. Dams need to be adjusted to changing conditions in order to supply water and energy. Given that dams are a vital infrastructure, the effects of their collapse can be severe in terms of both economic and societal consequences [4,5]. The analysis of risk factors and the assessment of the risk of failure of tailings dams represent the initial steps in the management of the risk of failure of such dams. Only by having a clear understanding of the risk of failure of tailings dams can we obtain accurate information on the risk and provide a basis for the prevention and control of disasters. Consequently, it is essential to conduct relevant research on the causes of failure of tailings dams [6].
Monitoring displacements in dams is vital to detect possible problems in the structures, helping in making an objective decision regarding possible restoration or, in the worst case, the destruction of the dam if it represents a serious risk to society [7].
Remote sensing is a technique for collecting information about the Earth’s surface (including land and water) [8,9]. Also, remote sensing is an effective approach for investigating change detection, which is the process of identifying and measuring changes in an extensive variety of surface phenomena over time [10,11]. Interferometry synthetic aperture radar (InSAR) technologies, which have been tested in multiple studies, improve dam safety by providing timely settlement assessments at a high spatial resolution [12,13,14,15,16]. By processing long periods of SAR images, InSAR techniques can be improved to millimeter accuracy and used to efficiently monitor ground movements and small displacements of structures such as dams, buildings, and bridges [17].
In addition, InSAR has been shown to be a promising alternative to high-precision leveling. The small-baseline subsets (SBASs) method was the first to use distributed scatterers (DSs) to reduce the influence of decorrelation by limiting the geometric and temporal baselines [18].
One of the dam monitoring techniques is geodetic analysis, which measures the displacements of the dam crest depending on the reservoir level, with reference to measurements of angles and distances [19,20]. Even so, the traditional geodetic techniques are extremely difficult and time-consuming, requiring professional individuals to carry out measurements for days in each measurement period [17,21]. Furthermore, high-precision leveling has been employed to measure vertical displacements in various studies; however, this technique is limited by costly human resources and materials, as well as the high expenses of implementing long-term leveling campaigns on the dam’s crest [22].
Therefore, establishing dam structural safety is required to quantify the risk associated with a dam reservoir system. In other words, for the system’s initial state and various failure modes, it is important to evaluate the risk of loading events as well as the system reaction for a given load condition [23].
The Lar Dam lake was initially impounded in May 1980. After water level lowering, it appears that water escape is occurring. However, water escaping from the dam’s embankment may cause internal material degradation. Water leakage at the Lar Dam is mainly caused by the existence of caves and tunnels in the underlying limestone strata [24,25].
The total flow rate from all springs indicated that leakage from the reservoir was about 16 m3/s [26]. As a result, the lake’s water connects to the region’s underground, which is more than a hundred meters below the riverbed [24].
The main purpose of the current study was to determine the displacement rate using a terrestrial surveying network and InSAR to prevent catastrophic events (such as the St. Francis dam catastrophe in the United States in March 1928) and to develop safety management plans for hydraulic infrastructures.

2. Case Study

The Lar Dam is located in the western part of the Central Alborz Mountain Chain (CAMC), southwest of the Damavand volcano. The dam was constructed across the Lar Valley [27]. The dam location can be seen in Figure 1. The average annual precipitation in the study area is ~600 mm, with snow accounting for over 60% of that total [28]. The Lar Dam is located 75 Km from Tehran and 100 Km from Amol. Detailed information on the Lar Dam is presented in Table 1 [29].
The Lar Dam is a 1300 m long and 105 m high embankment dam built between 1974 and 1982. The dam contains an almost central core of silt and sandy silt, and filter and transition zones on the upstream and downstream core sides. The dam’s shoulders of sandy gravel with slope inclinations range from 1:2.5 to 1:3.5. The cut-off is made up of a 32 m deep diaphragm wall in the alluvial foundation and a single-row grout curtain in the volcanic action and dolomite foundations. The usual functioning level is set at 2531 m above sea level [26]. The water level in the reservoir was growing slowly at the time, which was explained by the designer as the saturation of the void space in the soil formations several hundred meters thick beneath the reservoir. Also, the Lar Dam supplies 178 million m3/yr of water to the Jajrud basin, potable water to Tehran, and hydroelectric power [30]. The rock formations below the berm were further studied (Figure 2a,b). In the layout of the lava formation, it can be seen that the boundary of the lava flow is approximately at the crack location. The downward seepage occurs mainly through the lower lake deposits, assuming that the lava is comparable in impermeability. Hence, concentrated downward seepage occurs in the deposits and also at the boundary between the deposits and the lava, which becomes visible at the surface as an eroded line [29].
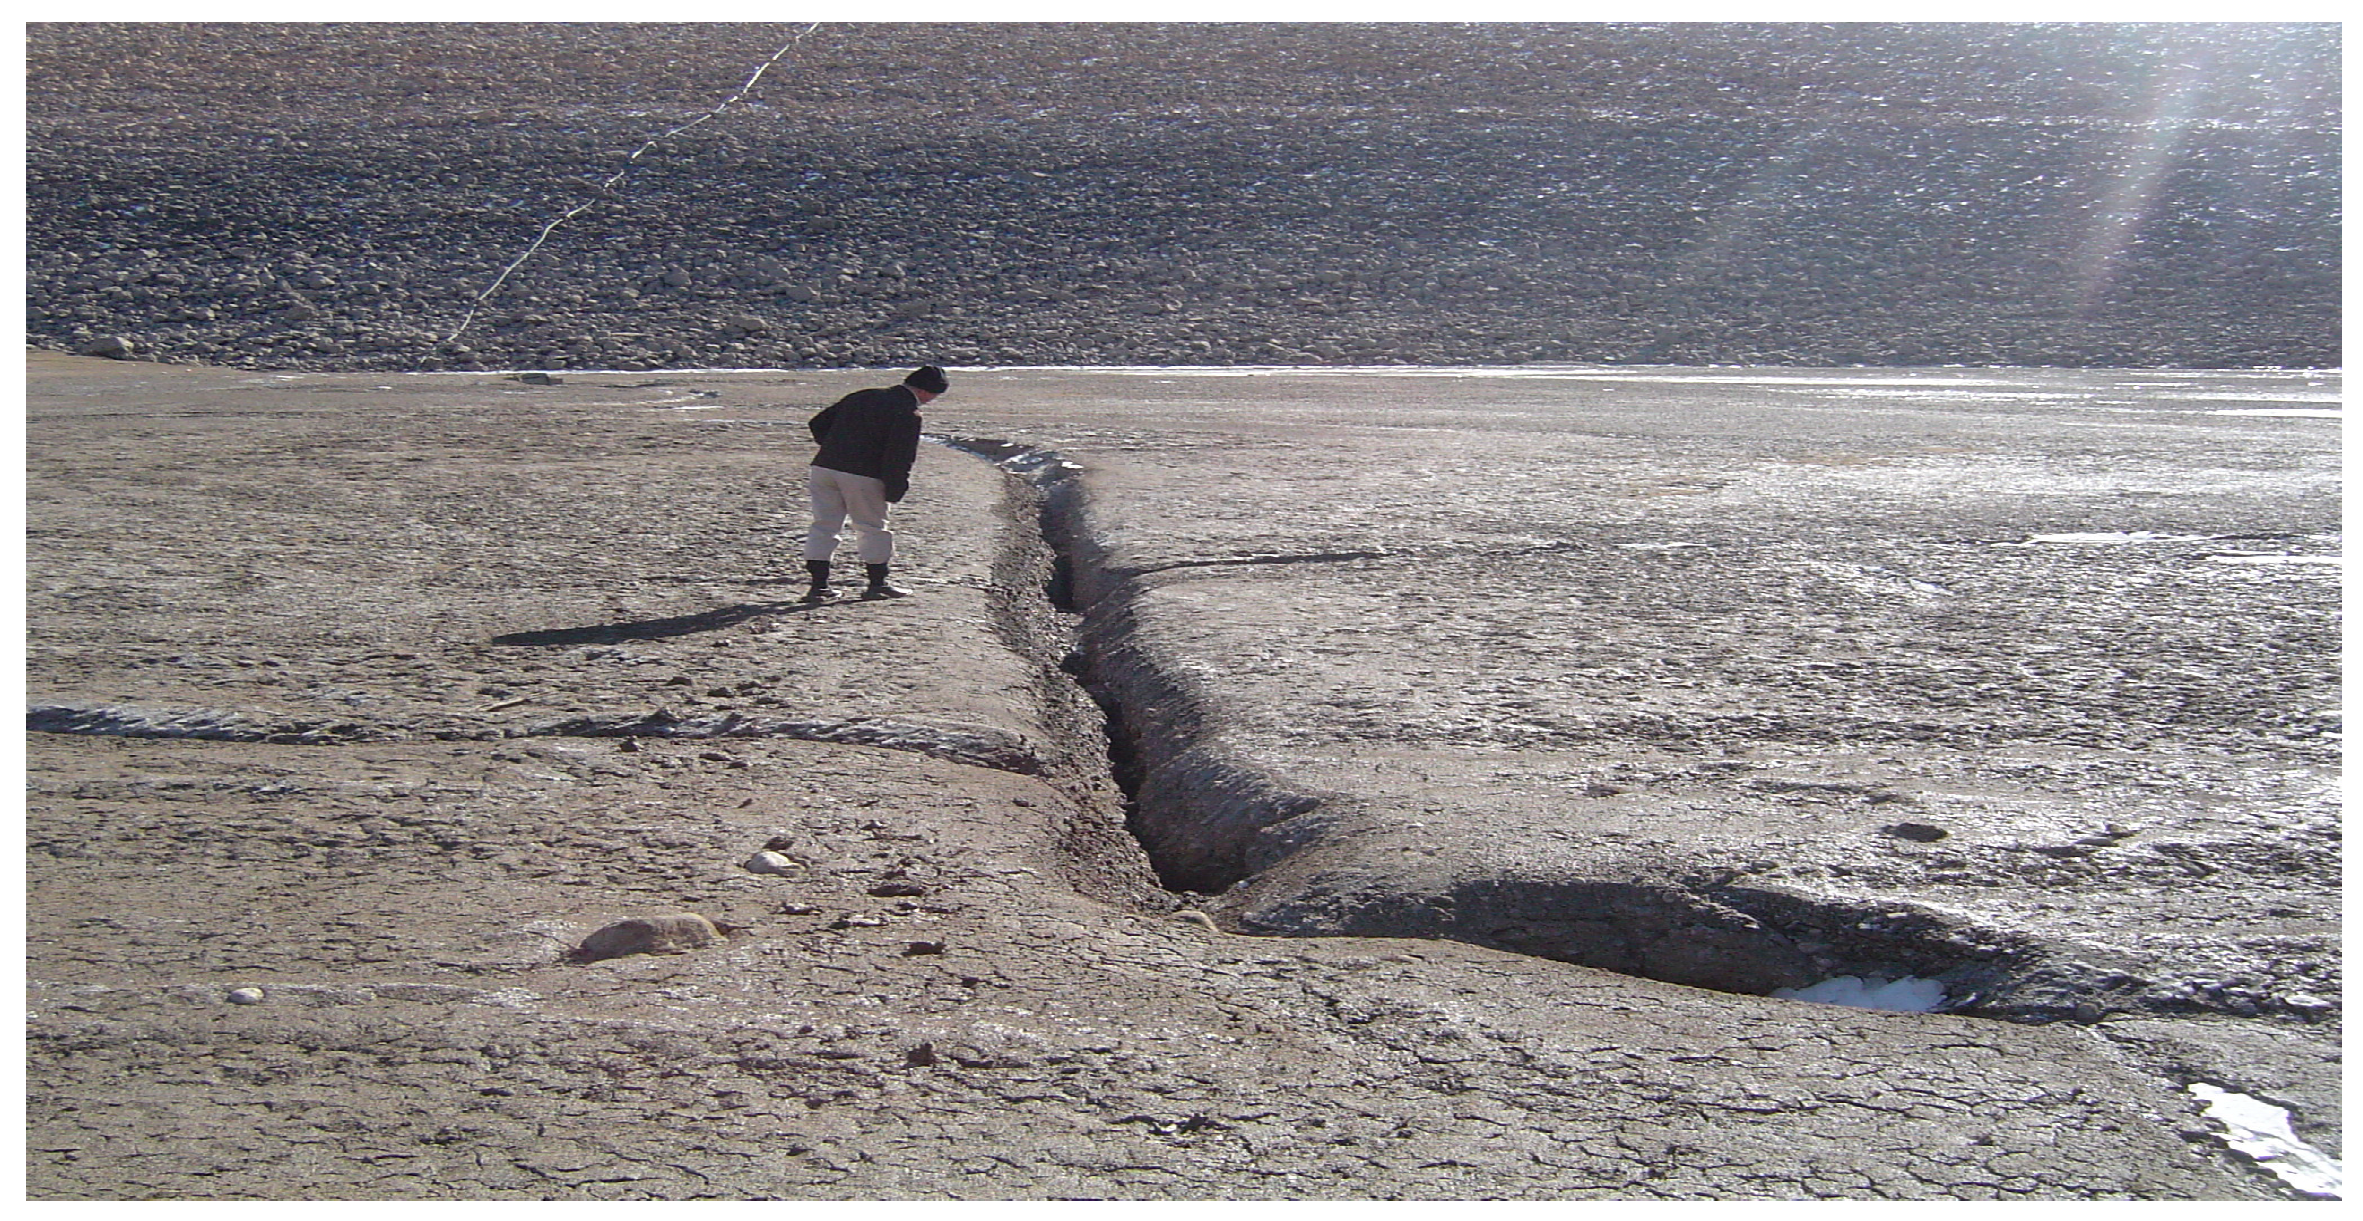
The internal erosion of the materials caused by this gradient results in berm, sinkholes, fissures, and rock collapse (Figure 3).
According to Figure 3, it can be concluded that downward flow and erosion toward more permeable zones (gravel pads or rock fractures) occur. It can be noted that the berm is partly founded on coarse-grained river alluvium. The downward seepage can cause the erosion of the overlying finer-grained soils into the coarse alluviums, which are free-draining to the underlying limestone [28].
At the beginning of the water extraction, the water leakage ranged between 3 and 13 (m3/s). The dam’s right and left abutments were built on a limestone formation and alluvial deposits (generated from a lava layer originating from the Damavand volcano), respectively. Reduction in the lake water level has been caused by karst channels in the limestone structure [30]. Two different water escape locations are depicted in Figure 4.
High leakage was found in the range of 7.7 to 10.8 m3/s, and the discharge volume from springs downstream of the Lar Dam (Haraz and Galugah) increased [24].
According to the SETEC Compony results [29], a section of the reservoir has the potential for leakage of water of over 1 million m2. The direction of groundwater flows and geological features were detected by hydrological investigations based on piezometric analysis (Figure 2). Water escaped from the Galugah and Haraz springs when the secondary reservoir was created beneath the reservoir’s bed elevation (Figure 4).
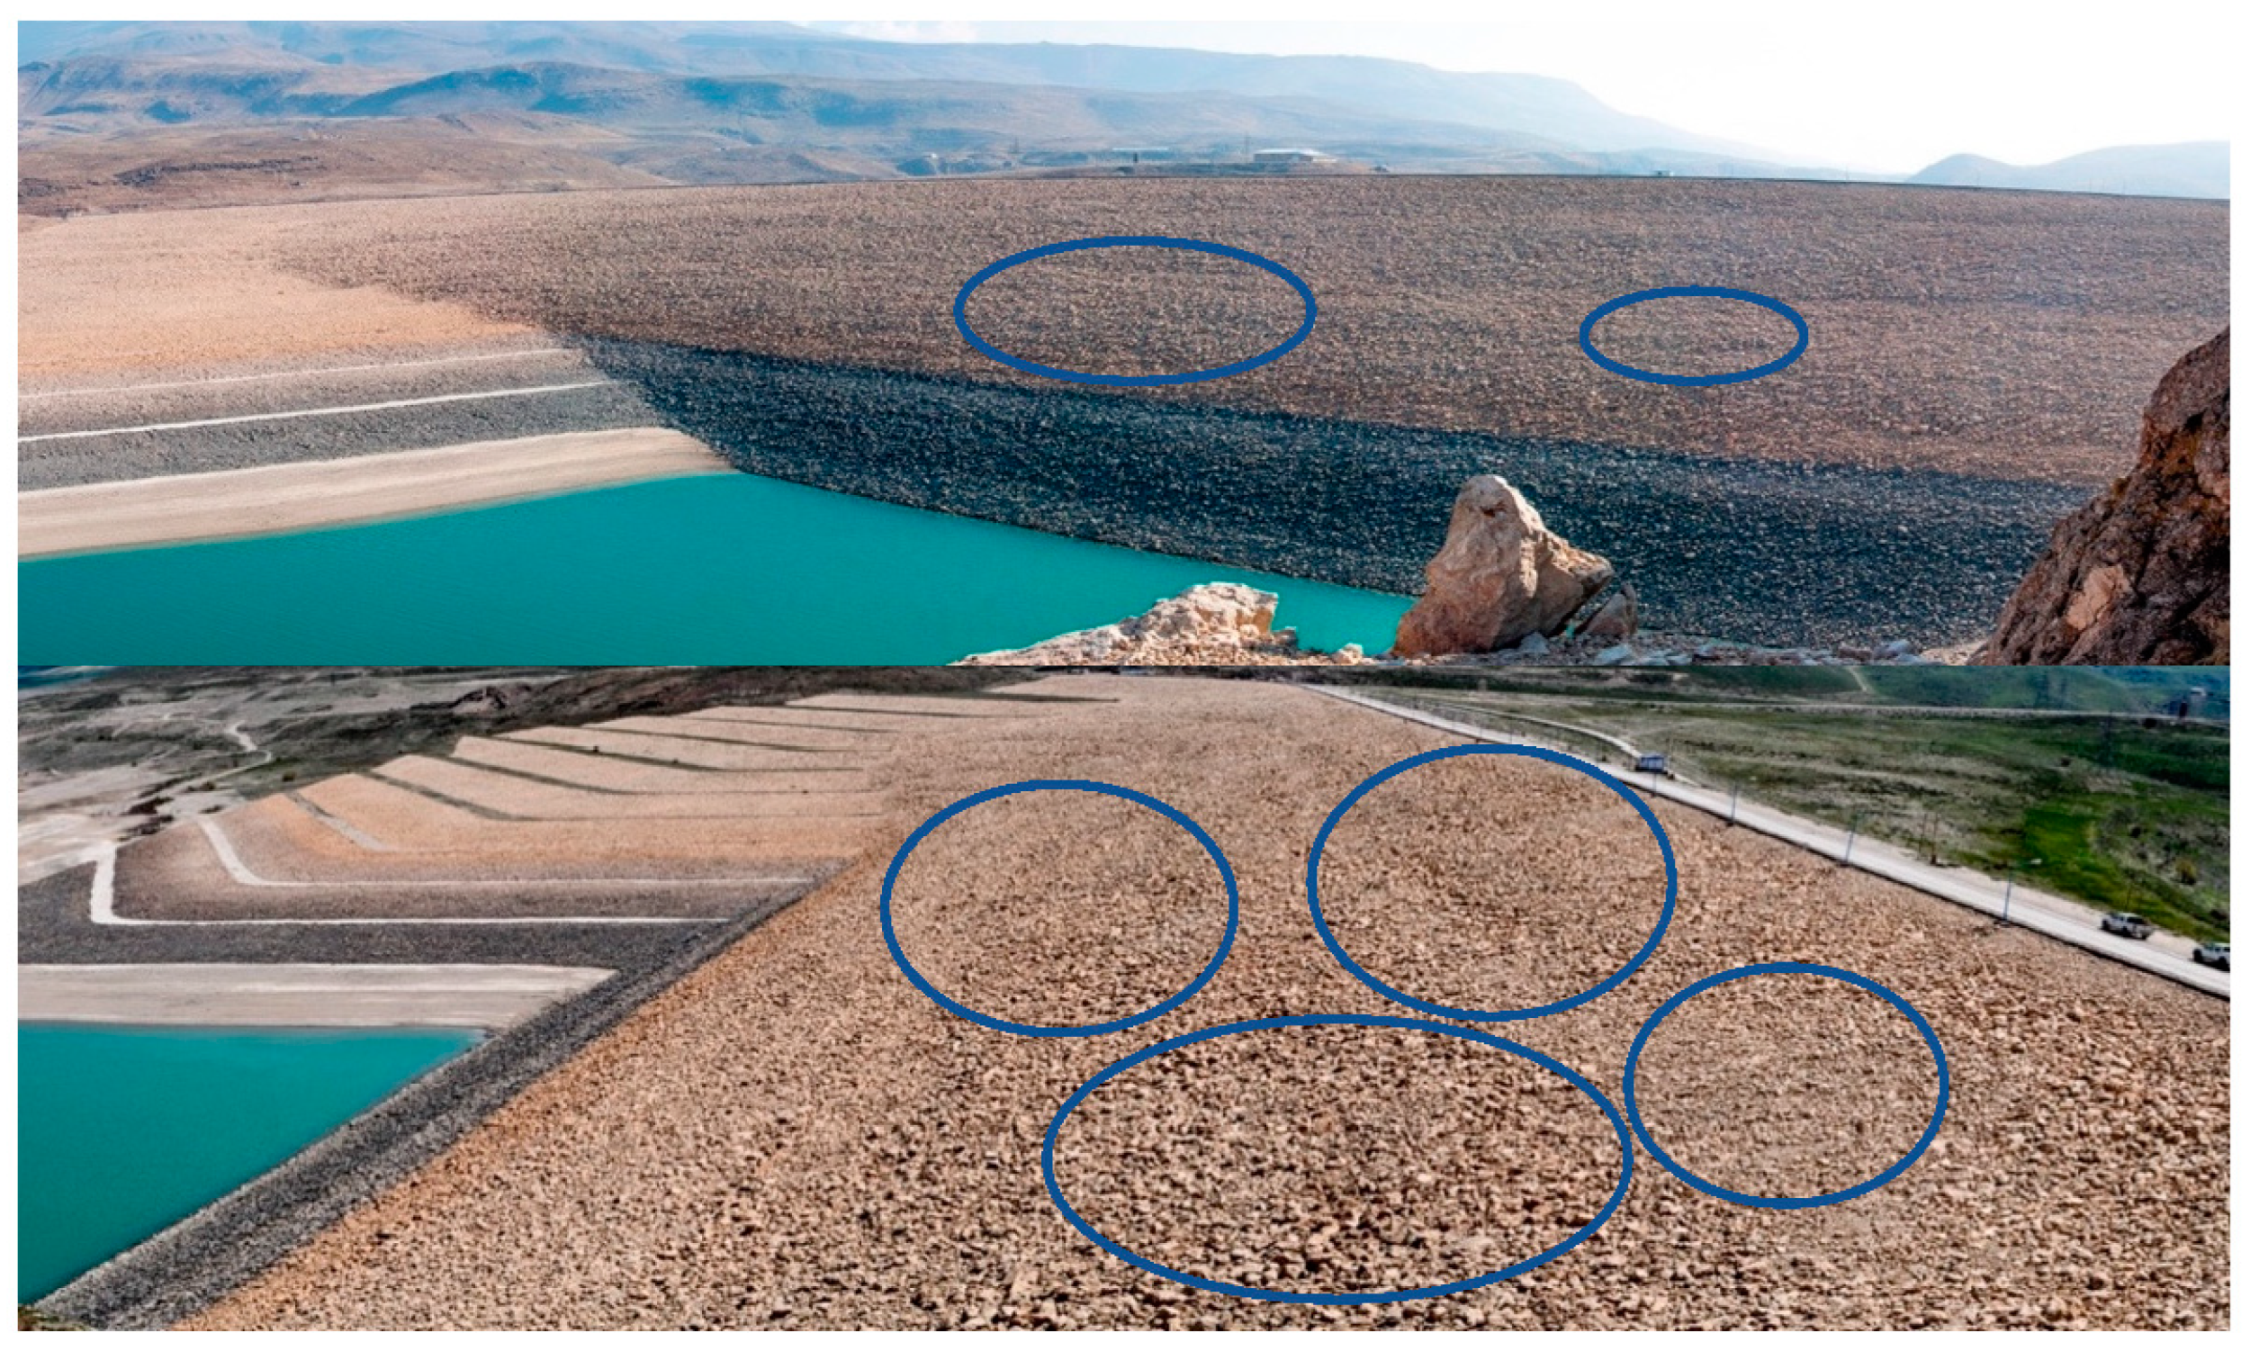
Obvious evidence of deformation can be seen on the riprap layers of the Lar Dam in Figure 5 and Figure 6.

3. Materials and Methods

3.1. InSAR Processing

In this research, we studied two stacks of TerraSAR-X (TSX) images (10 ascending, with an incidence angle of 34.3°, and 8 descending, with an incidence angle of 32.8°). Spotlight data in the X-band spectrum were obtained from May to August 2018 (Table 2) and images and Sentinel-1A images from 5 February 2014 to 30 September 2019 (134 images) in the C-band, with an incidence angle of 32.3° (Table 3). We processed the TerraSAR-X and Sentinel-1 data using two different approaches (StaMPS and GMTSAR), respectively.
InSAR techniques are commonly employed to monitor small and local deformation data in engineering structures [31]. It is important to note that the small baseline method analysis used in StaMPS classifies single-look coherent pixels based on single-look images [32].

3.1.1. TerraSAR-X Processing

We analyzed the TSX spotlight data using the SBAS technique provided in the StaMPS 3.3b1 time-series software [7] and improved the spotlight data by [33,34].
We ordered the TSX images during the summer months (obtaining noise-free images). The TSX data used in this research included 18 images taken by the German TerraSAR-X mission in Spotlight mode. The TSX images were processed using the StaMPS software.
The differential interferometric phase results were obtained from the contributions of five phase components: topography, displacement, atmosphere, orbital error, and noise. The topographic phase can be mainly removed using a known digital elevation model (DEM), and the other phase components (orbit error, noise, and atmosphere) can be approximated and removed using appropriate image stack processing, leaving only the displacement phase component. The differential phase components can be represented by Equation (1) [35]:
t ( x , r ) = d i s p ( x , r ) + t o p ( x , r ) + a t m ( x , r ) + o r b ( x , r ) + n ( x , r )
The standard SBAS approach was analyzed with time-series data using multi-looked interferograms [31].
For small baseline processing, 10 ascending and 8 descending interferograms were generated using tershold-snaphu 0.3 and threshold-geo-code 0.1 on cropped SAR data. The interferograms were unwrapped using a 3D phase-unwrapping method [32], and the displacement time series was obtained using a least-squares inversion [7]. The atmospheric factor of the phase was eliminated using a linear connection between the topography and interferogram phases.

3.1.2. Sentinel-1 Processing

We processed an analysis of the Lar Dam using 134 ascending Sentinel-1, C-band (5.6 cm wavelength) images and single-look complex (SLC) images produced from the interferometric wide (IW) swath mode with vertical polarization. The spatial resolution (pixel size) was approximately 5 m × 20 m in the range and azimuth directions. The data were processed with the 5.8 version of the “Generic Mapping Tools Synthetic Aperture Radar” GMTSAR software [36] with additional post-processing by GMT [37].
We subtracted the topographic phase using the (~90 m) Shuttle Radar Topography Model (SRTM) digital elevation model [37]. GMTSAR first extracts the orbital information in the pre-processing step of raw data and then estimates the Doppler centroid. Following image focusing, all images were aligned with a predetermined primary image. As a co-registration accuracy of better than 0.01 pixels was required in the long-track direction, GMTSAR employed the exact orbits (aux_porb) for the initial co-registration and the enhanced spectral diversity (ESD) method to remove the co-registration error at bursts and achieve the desired precision [38].
Following this step, 860 interferograms were created in GMTSAR and corrected for the topography and orbital errors to produce flattened results. The flattened interferograms were then passed through a low-pass filter before SNAPHU was used to unwrap the phase. Finally, the unwrapped interferograms were geocoded. We additionally estimated and eliminated the phase ramps from all images that could be present due to residual orbital errors and long-wavelength atmospheric signals, as well as minimizing atmospheric signals by assuming a linear relationship with the topography. We used the SBAS approach in StaMPS to calculate the LOS displacement rates and cumulative displacement. SBAS makes use of differential interferograms collected at satellite sites separated by a short time interval.

3.2. Geodetic Data

The terrestrial surveying network over the Lar Dam was set up on and in proximity to the dam, and three measurements were made in 1992, 2013, and 2019. It should be noted that using an extensive terrestrial surveying network increases the measurement accuracy [30]. The geodetic points’ locations (on the dam network) are shown in Figure 7.

4. Results

4.1. TerraSAR-X Results

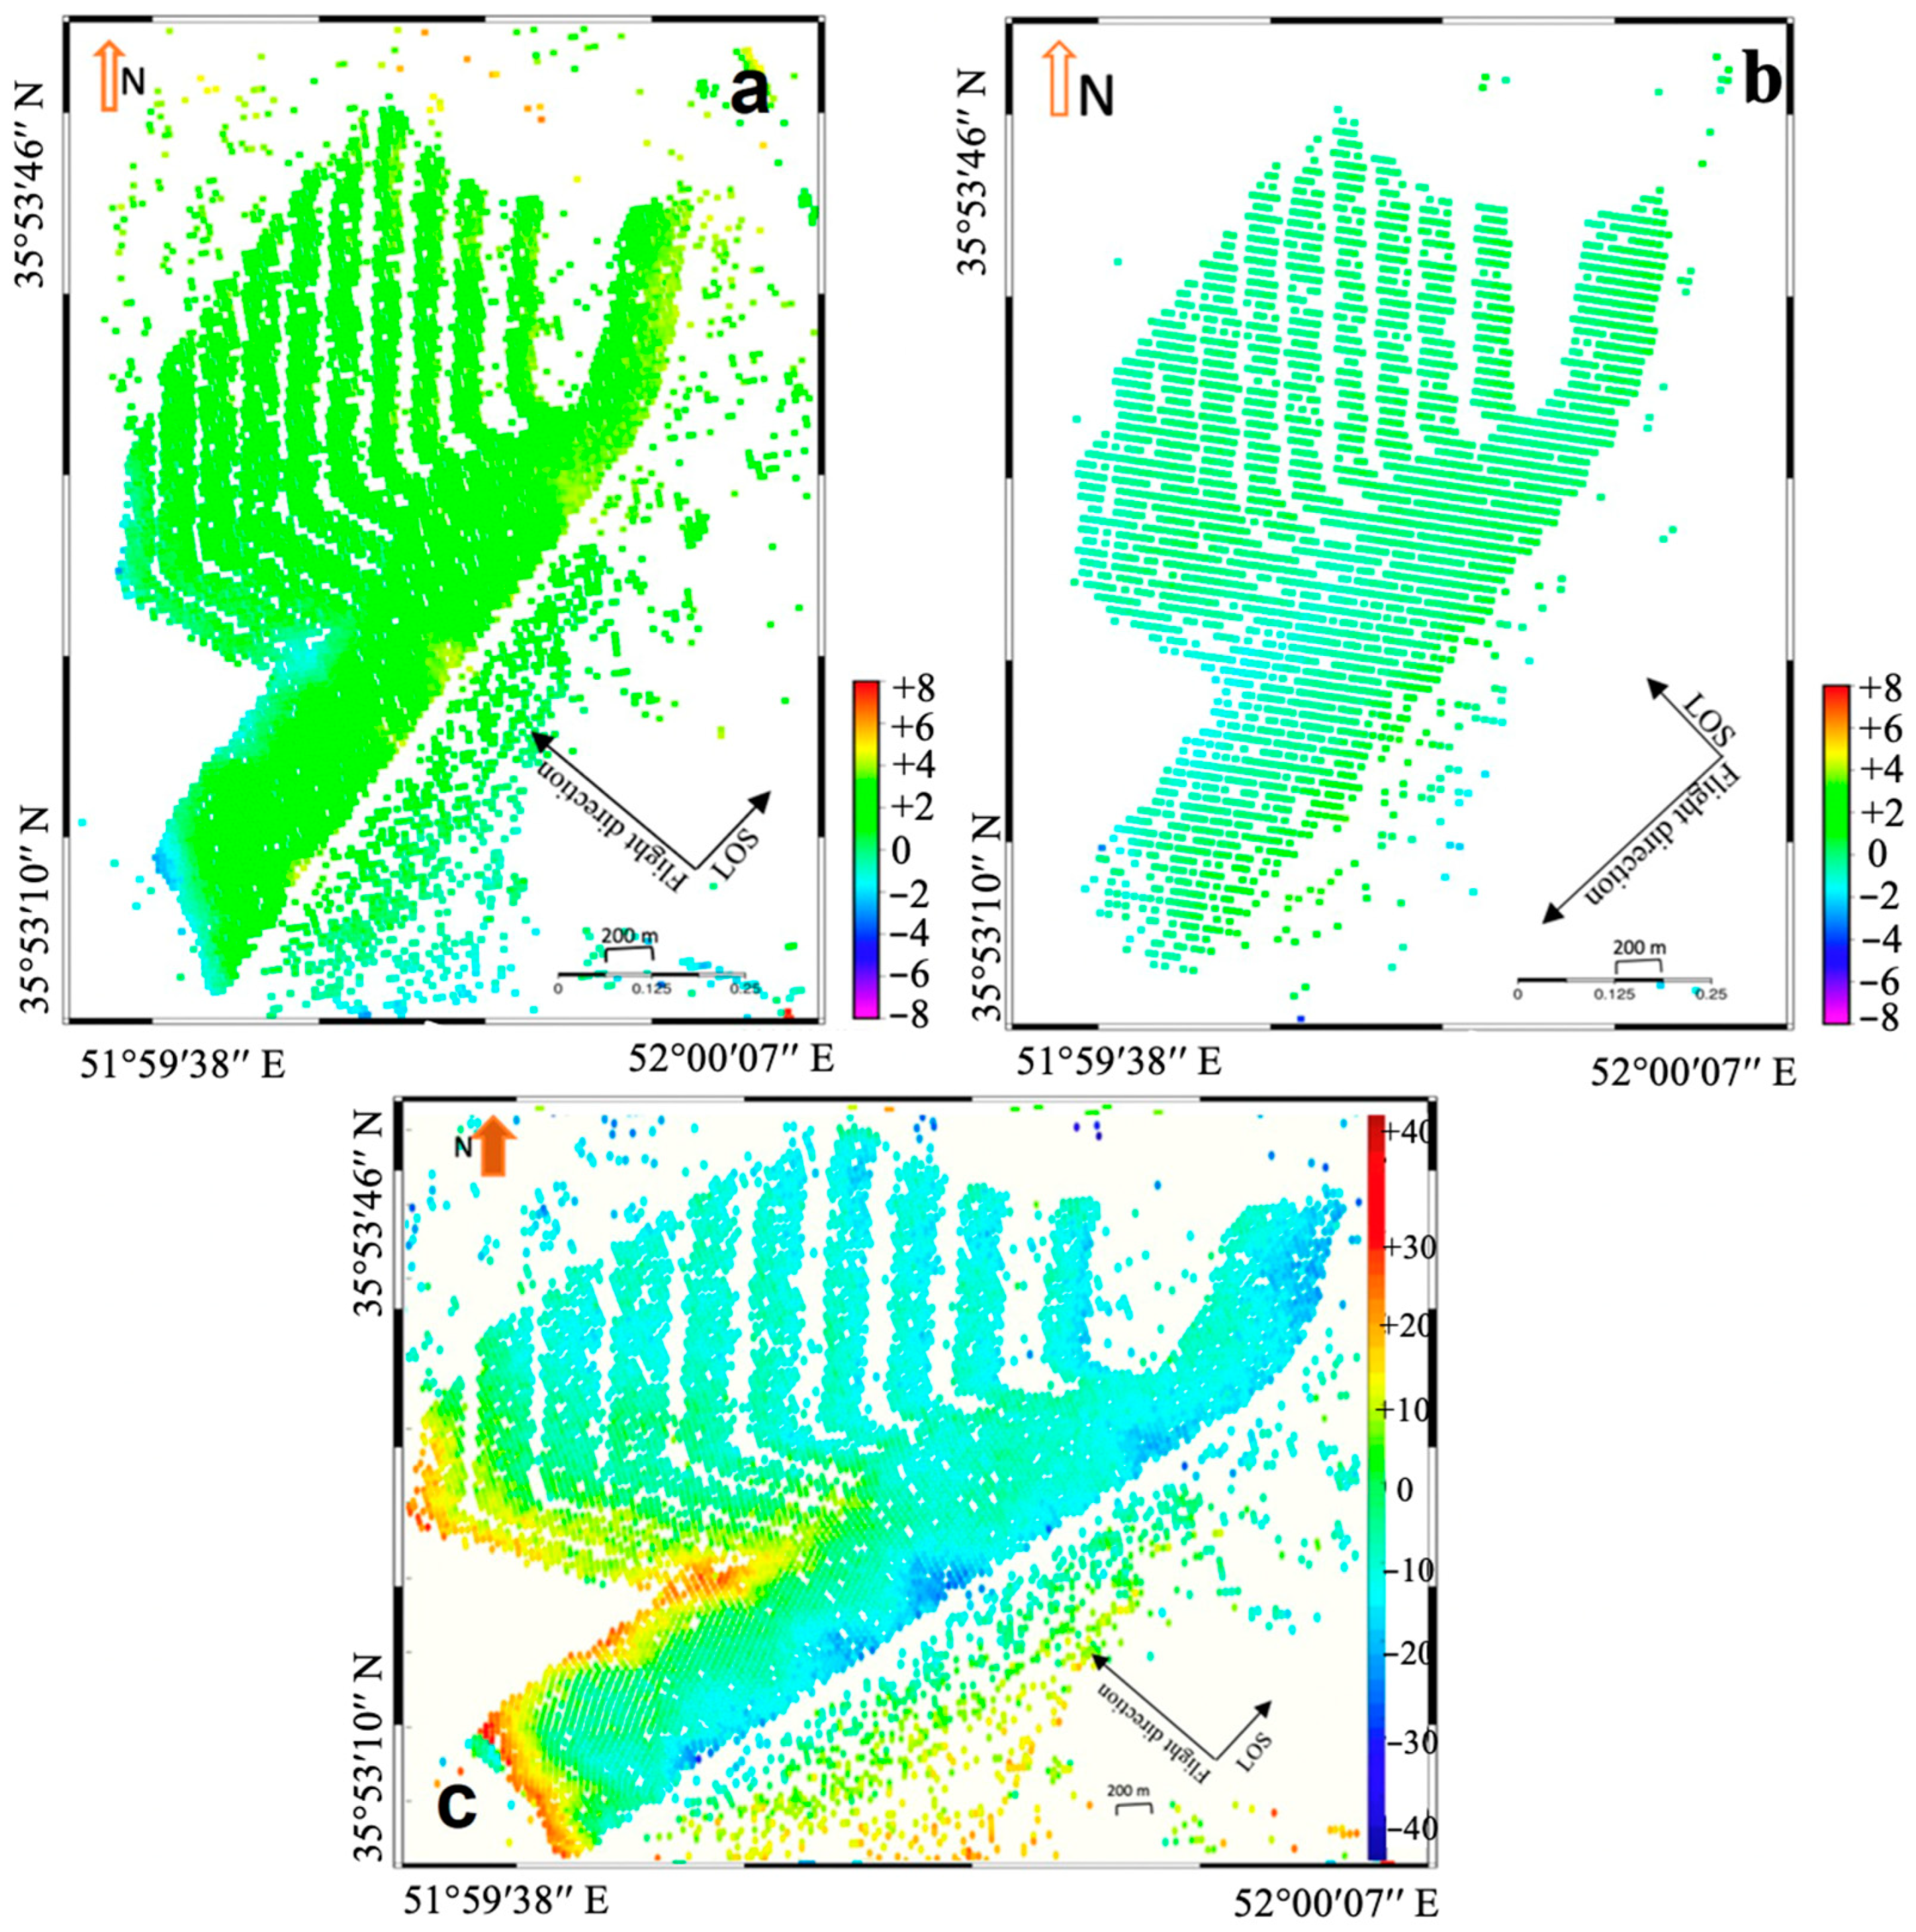
The mean velocity data in the LOS direction were derived from TerraSAR-X. The ascending orbit findings indicate subsidence in the downstream part of the berm and on the dam’s right side between 10.5.2018 and 4.7.2018. Figure 8a,b show the mean velocity in the LOS direction derived from the TerraSAR-X spotlight data in the ascending and descending orbits, respectively. Moreover, the output indicates that the rate of subsidence is ~6 mm/year. High-resolution images acquired by the TerraSAR-X with Sentinel-1 enabled us to obtain better and more reliable results and cross-validate the results. In ascending orbit, we could achieve more coherency and pixels.

4.2. Sentinel-1A Results

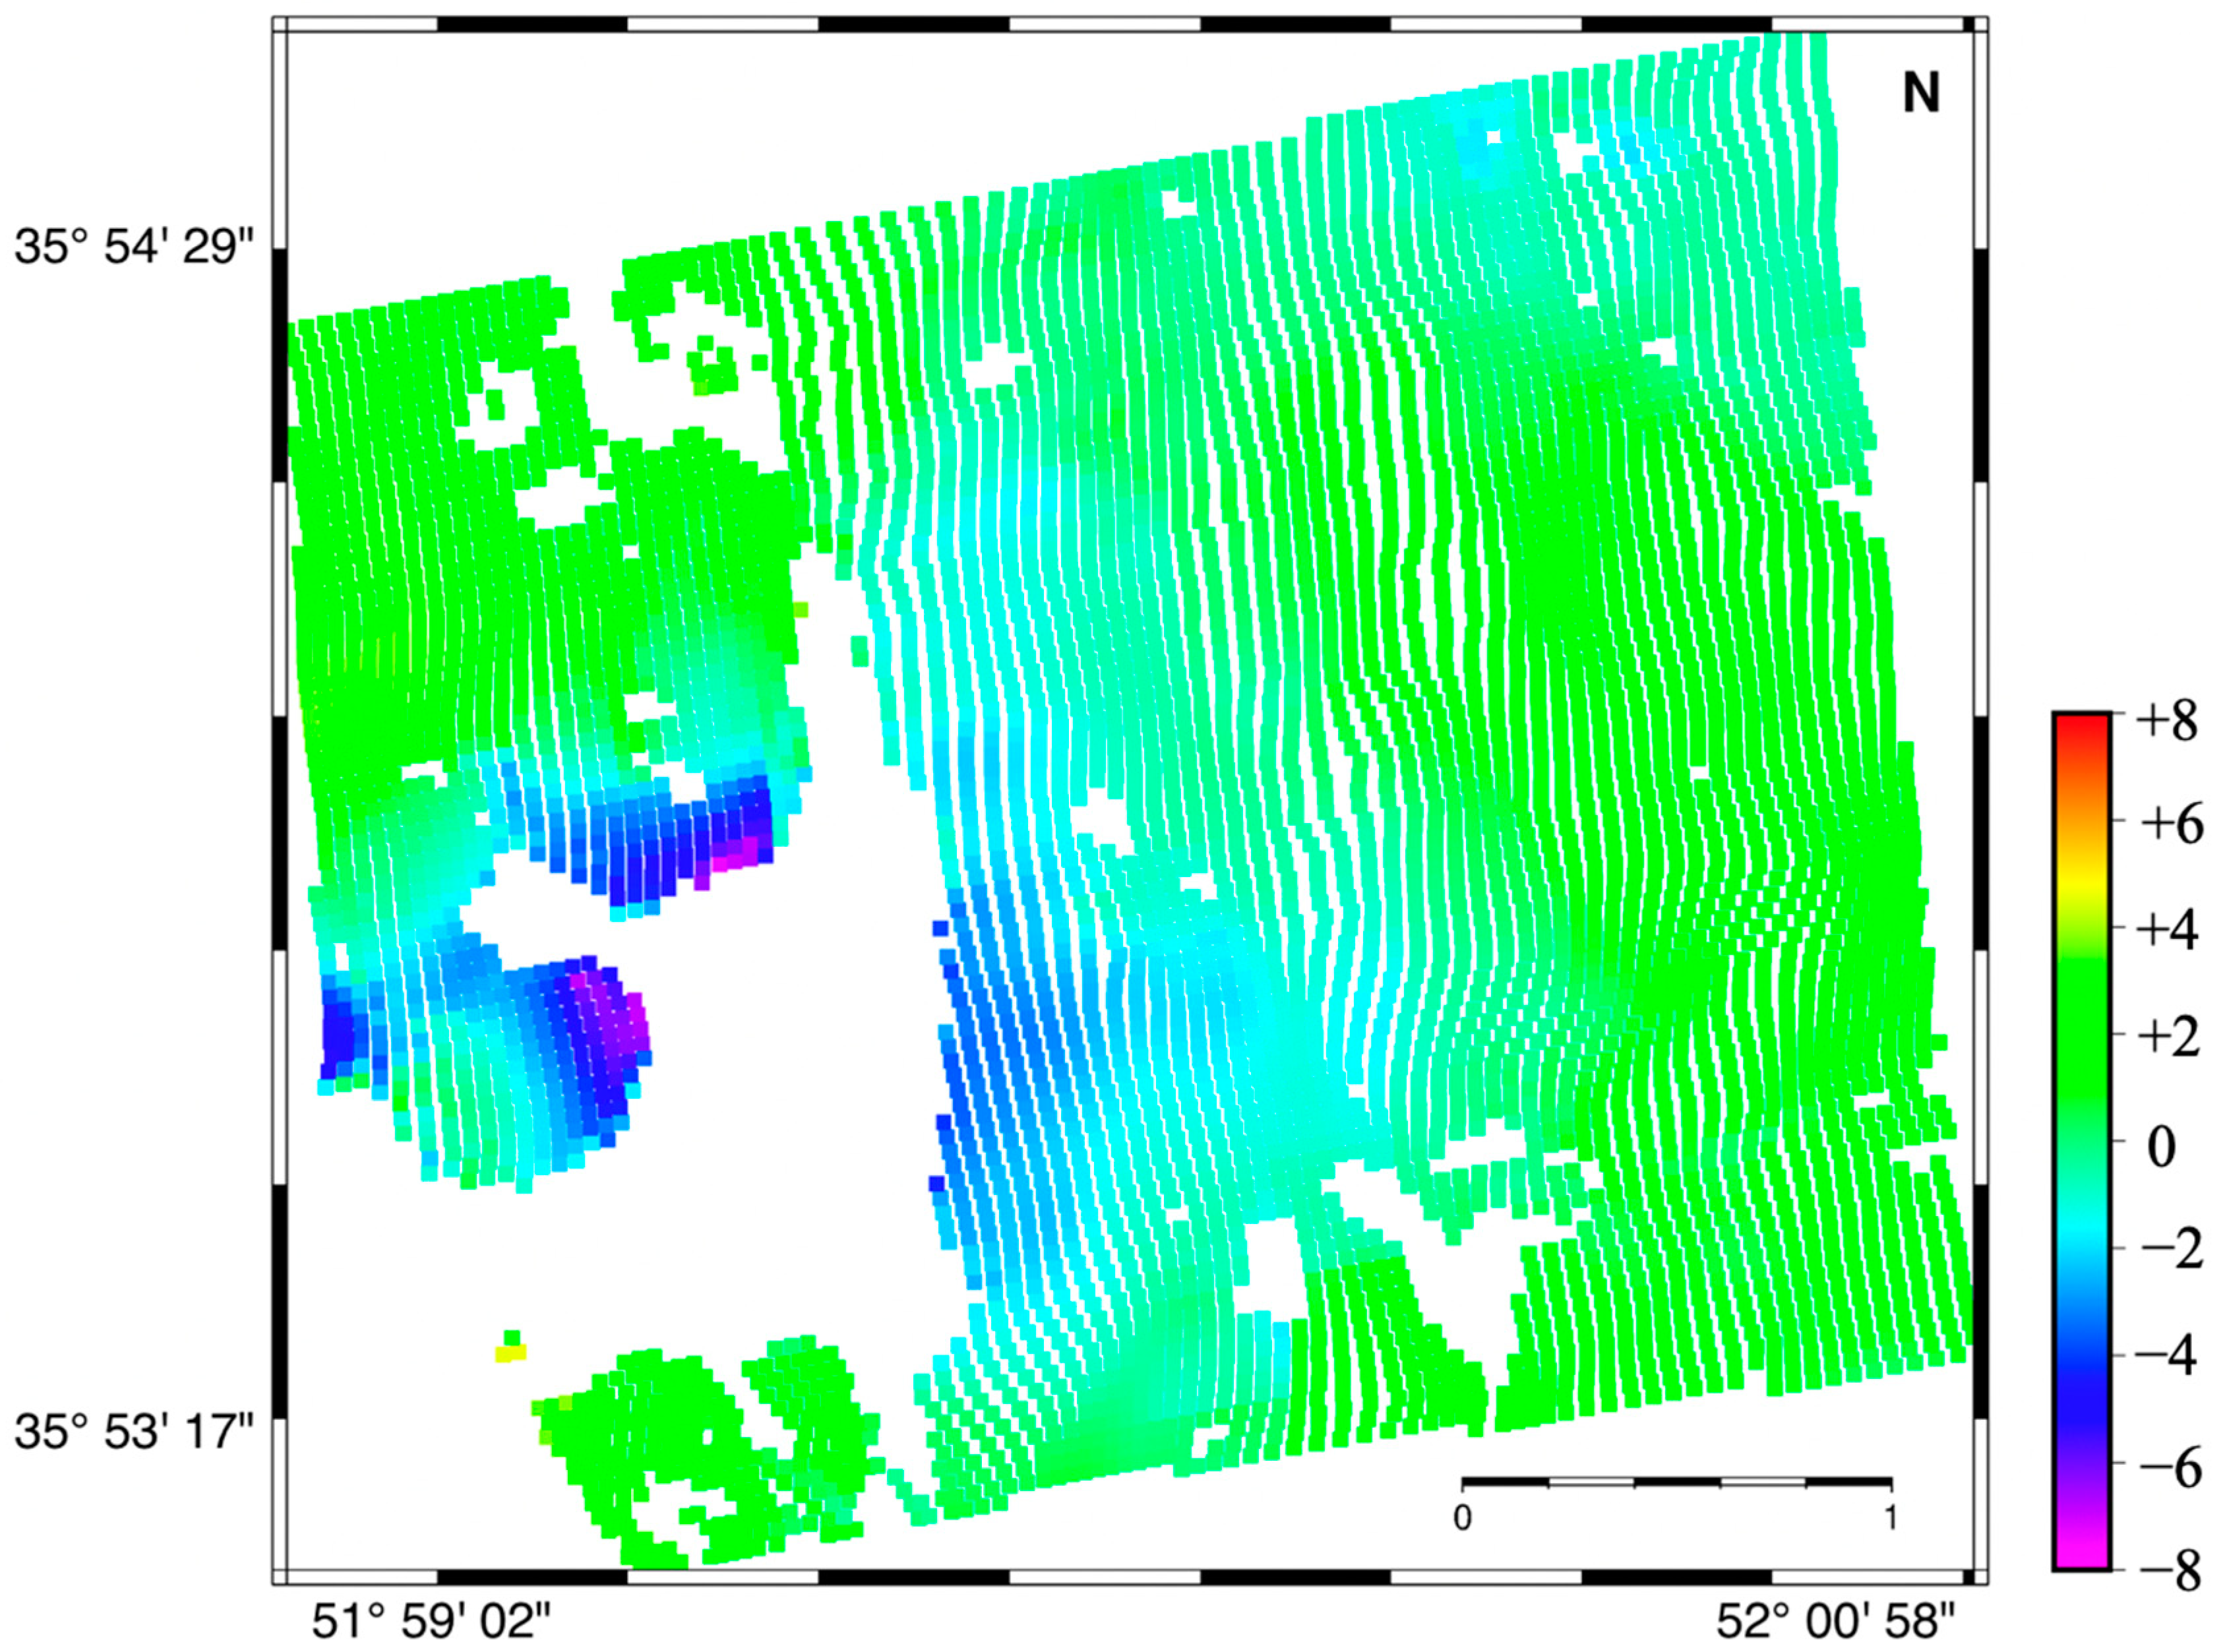
The SBAS time series was created to analyze the Lar Dam’s behavior. The LOS displacements were calculated using Sentinel-1A’s ascending orbits. The Sentinel-1 analysis from 5 February 2015 to 30 September 2019 shows a maximum mean LOS velocity of 8 mm/y away from the satellite in the LOS direction, on the left side of the dam (Figure 9).
The coordinates of the observation pillars as well as the elliptical diameters of the error points at a 95% confidence level and flat displacement vector are depicted in Table 4.
This table shows that all of the pillars (1992–2019) had a horizontal displacement, including the M3 pillar, having the greatest displacement of 9.22 mm on the right abutment and upstream of the dam’s body. Also, the results of the 2013–2019 period indicate the maximum displacement of 6.04 mm for the M1 pillar on the dam’s left abutment. Several pillar locations in terrestrial surveying showed a vertical displacement between 1992 and 2019 (Table 5).
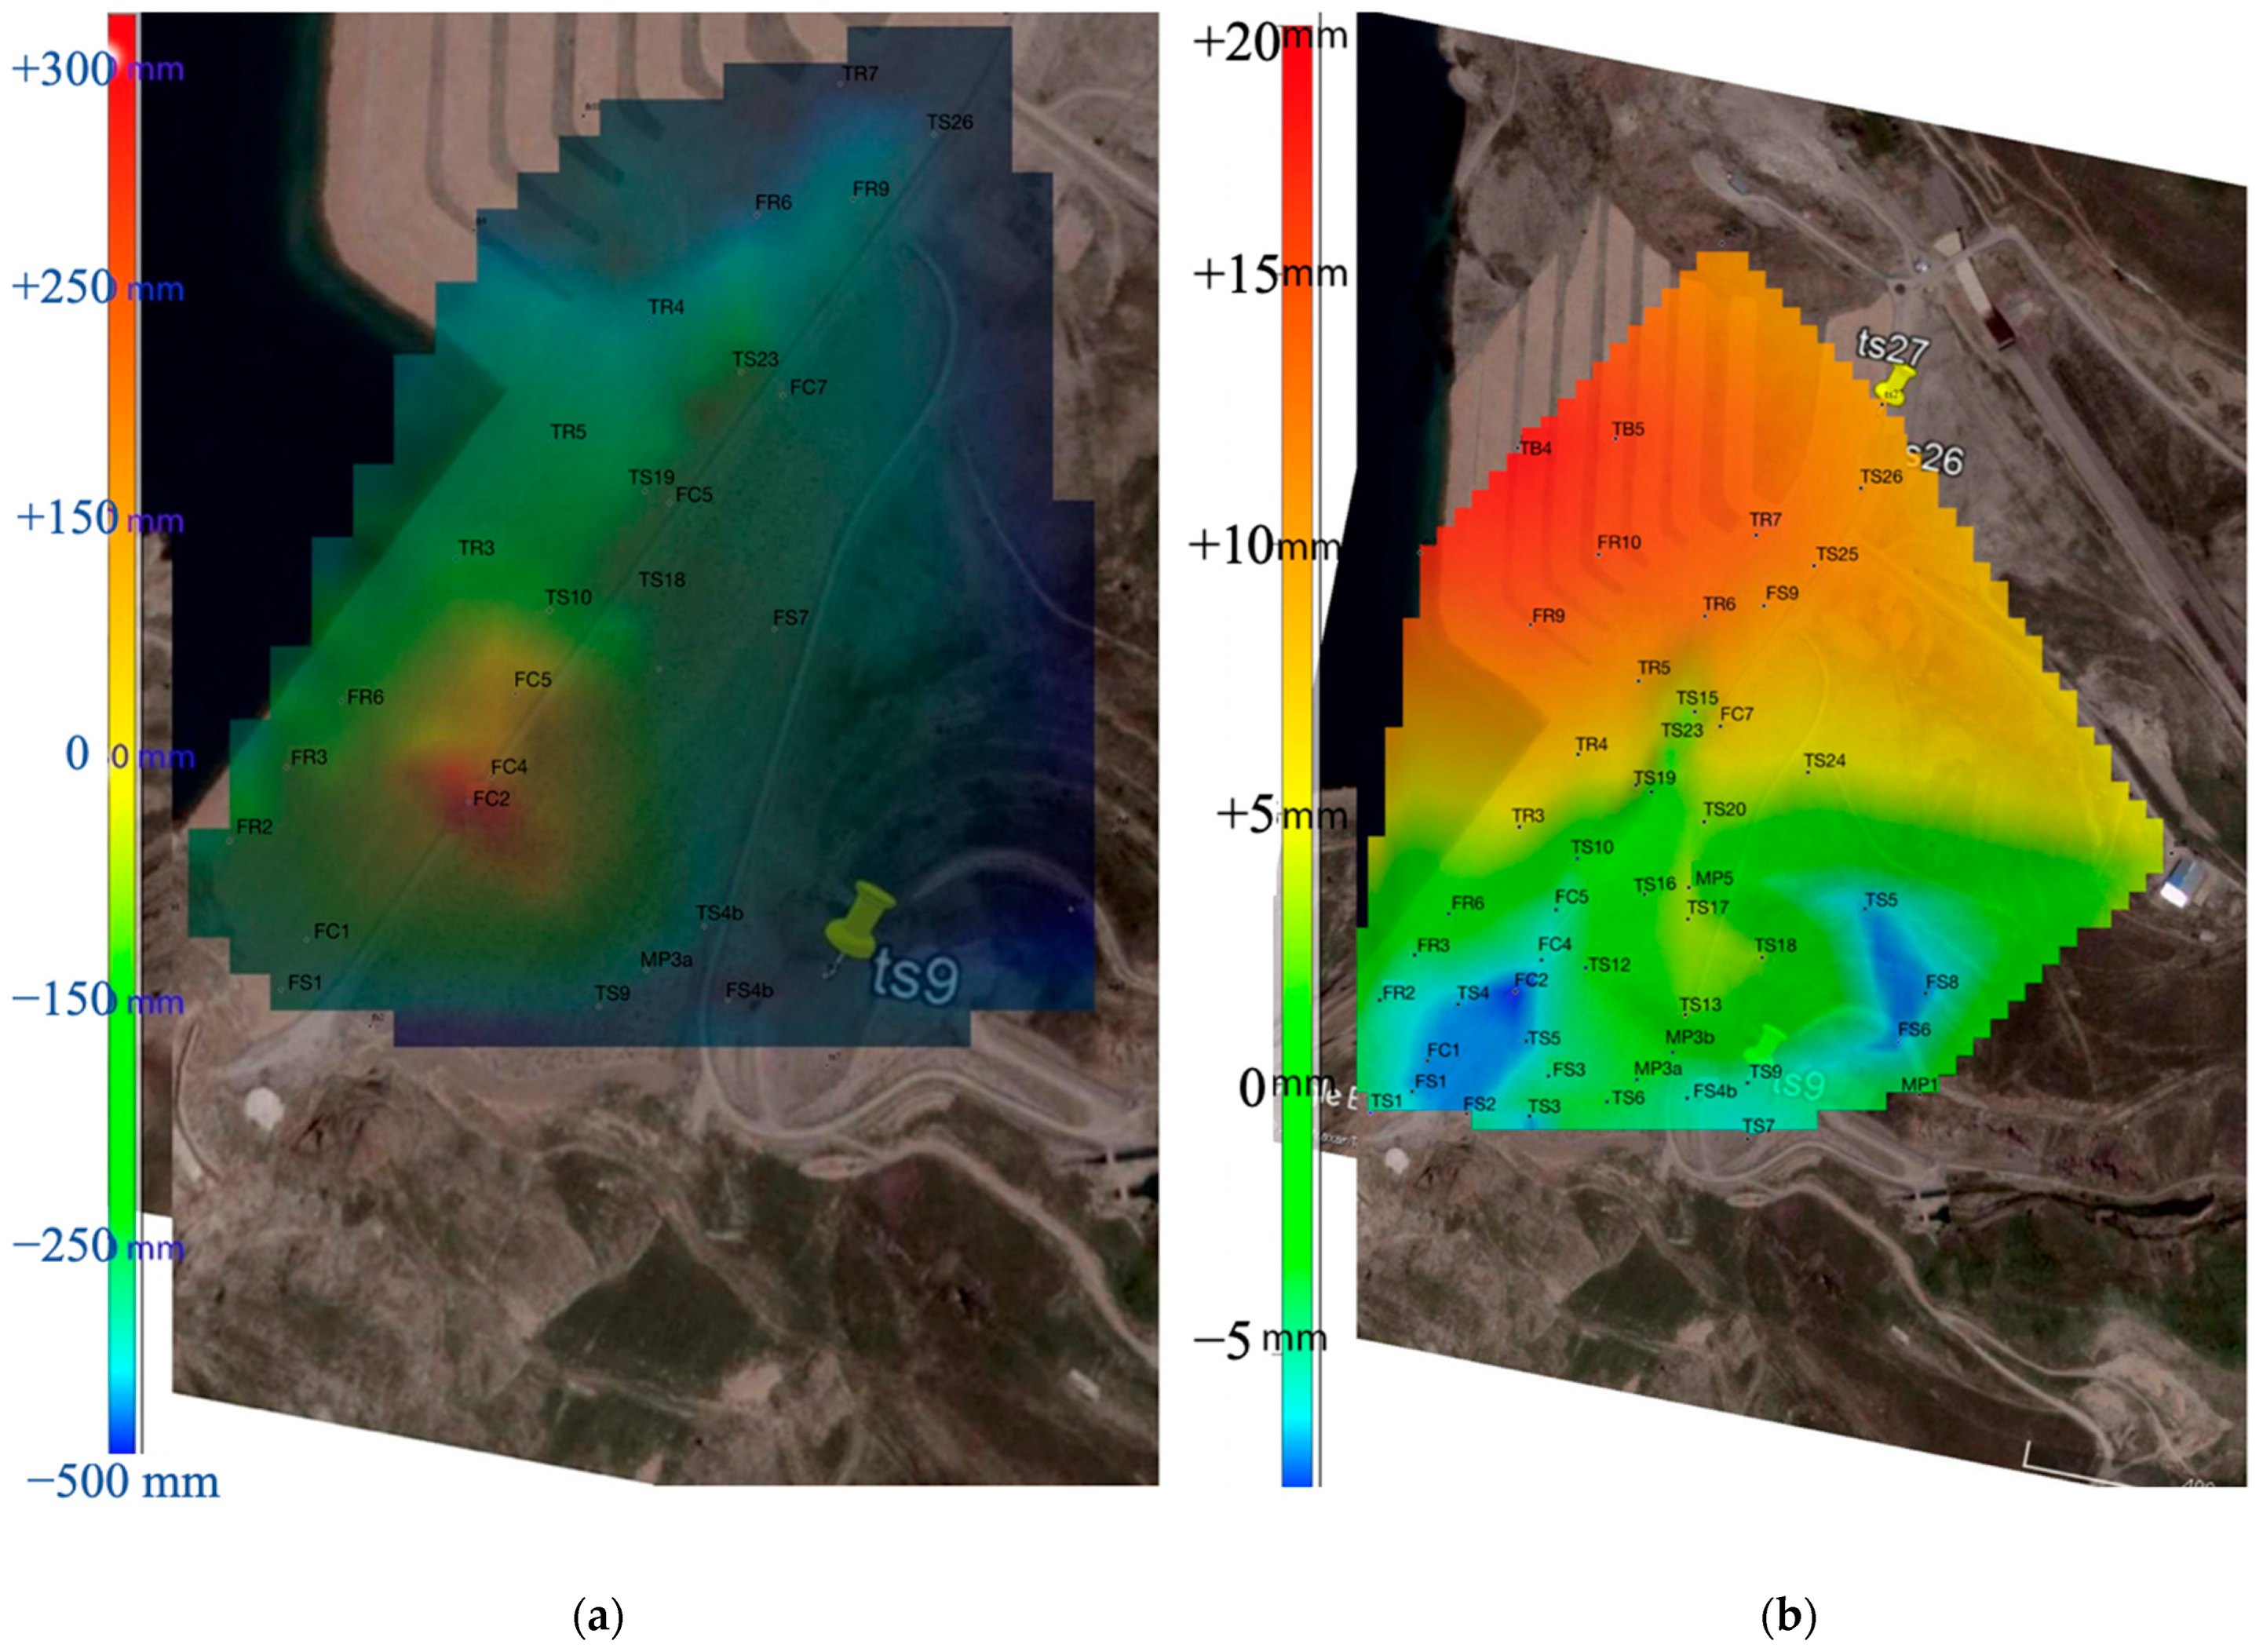
According to Table 4, some pillars had not moved. The vertical displacement on the left and right sides was mainly uplift and subsidence, respectively. The greatest uplift and subsidence occurred at point TB4 on the dam’s left side (19.68 mm) and FC2b on the dam’s right side (8.25 mm), respectively. Pillars M2 and M6 were located outside the dam, with 10.15 and 4.4 mm uplifts, respectively, and pillar M3 had not moved. The results of the terrestrial surveying network reveal that horizontal and vertical displacements occurred on the dam’s body between 1992 and 2013 (Figure 10).
It should be noted that the vertical displacement of the pillar points on the left abutment of the Lar Dam was mostly uplift, whereas on the right abutment, it was subsidence. The greatest elevation, 19.68 mm, relates to point TB4 on the left side and upstream of the dam body, and the highest subsidence, 25.8 mm, is linked to point FC2b on the right side and downstream of the dam crest. The geodetic observations in the ninth stage of micro-geodesy and the behavior measurement of the Lar Dam indicate that horizontal and vertical movements occurred on the dam body over the time period of 1992–2019.
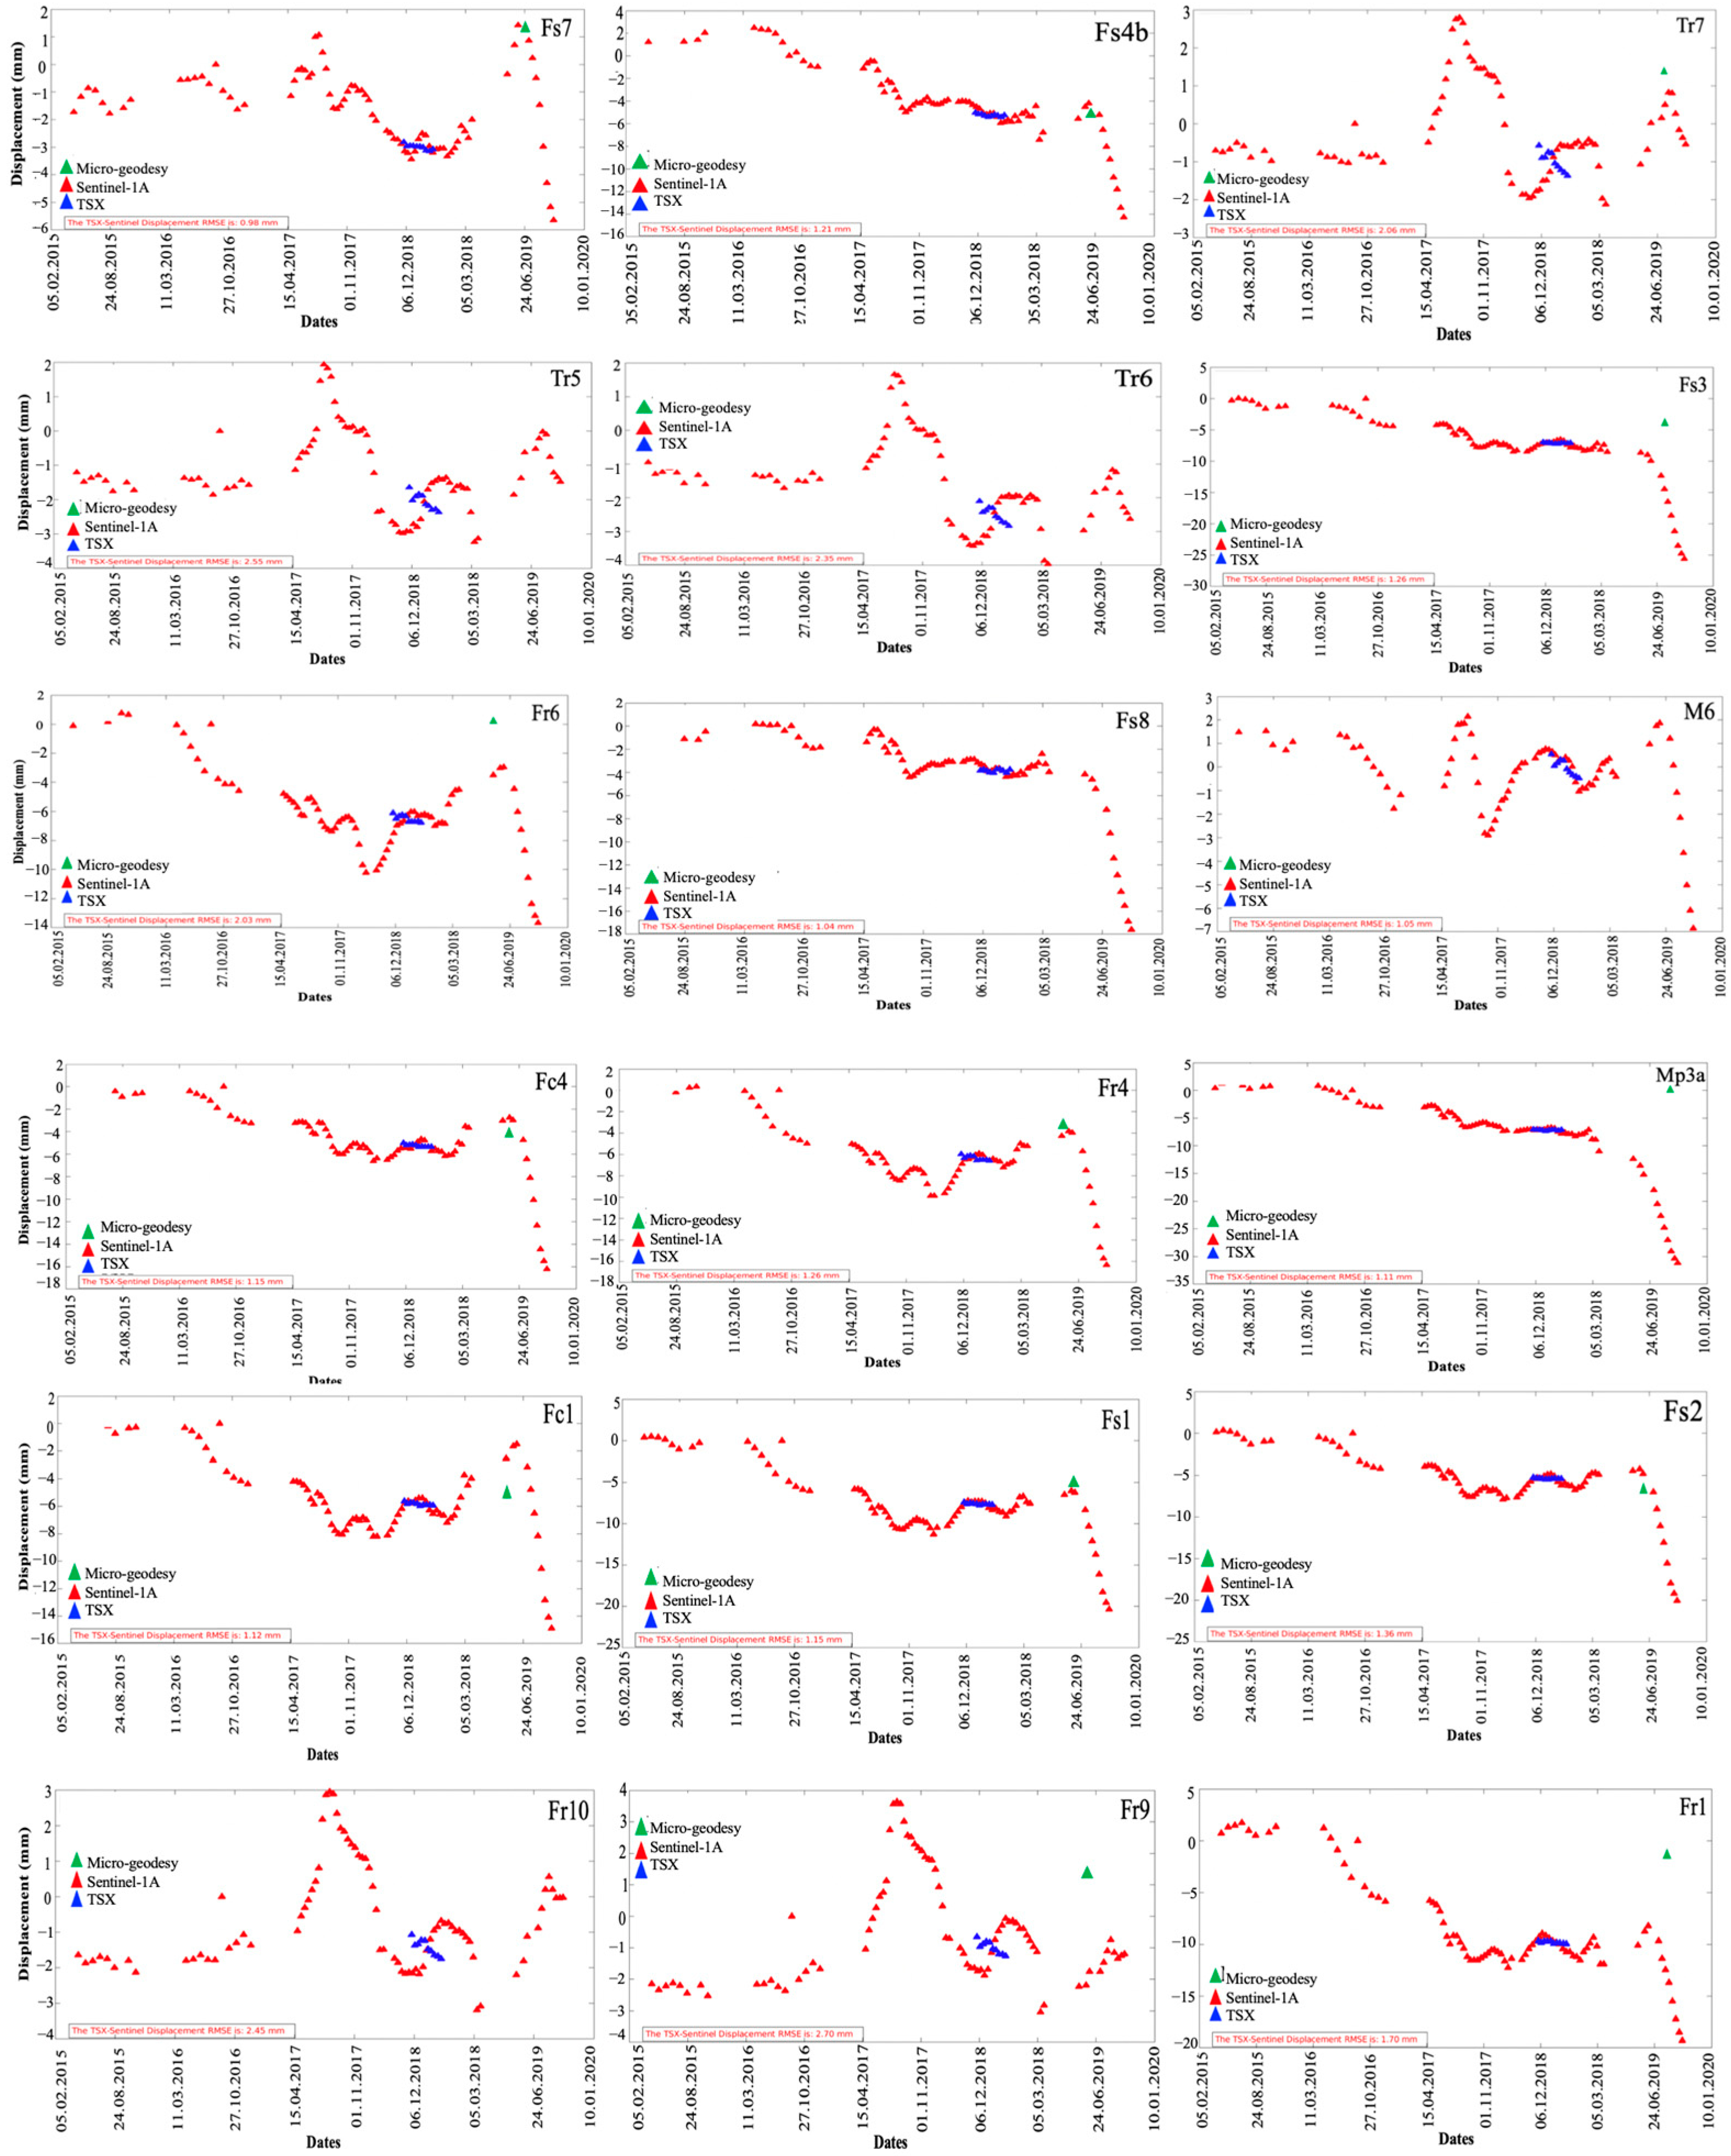
In addition, the vertical displacement between the Sentinel-1 and TerraSAR-X images was consistent. As shown in Figure 11, the minimum and highest RMSE values between the TerraSAR-X and Sentiel-1 images were 0.87 in TS13 and 2.70 in FR9, respectively.
In the stage of 1992–2013 in the terrestrial surveying network, the process of vertical deformation was compatible with the natural behavior of the Lar Dam in the central part (the deepest section). In the clay core, the most settlement was observed, while it was reduced on the dam’s abutment [30]. In a recent terrestrial surveying network measurement, the left side of the dam was seen to be uplifting. In addition, Figure 10b depicts the pillars along the left abutment uplift between 2015 and 2020. As a result, both the terrestrial surveying network and InSAR technique verified an uplift on the left abutment of the dam’s body.

5. Discussion

For comprehensive research on dam displacement monitoring, various measurement techniques should be used [23].
In this research, we studied the risk assessment in the Lar Dam. The InSAR technique was used to study the structures with slow and long-term movements, such as dams. The high-resolution TerraSAR-X data revealed the dam deformation. In general, TerraSAR-X images have a spatial resolution of up to 1 m, which can improve the deformation monitoring capabilities. X-band data have already been shown to be appropriate for the high-resolution deformation monitoring of small areas [36]. The density of the pixels provides a better understanding and accurate description of deformation issues, providing more comprehensive deformation information [36,38,39]. For the processing, 10 ascending and 8 descending TerraSAR-X images from May to August 2018 were used. Obviously, having access to TSX images for a longer period of time could provide more results, but the acceptable results (Figure 11) and RMSE indicate the validity.
Due to the lack of data availability in the TerraSAR-X images, 134 Sentinel-1 images in ascending orbit were employed to compare with the terrestrial surveying network.
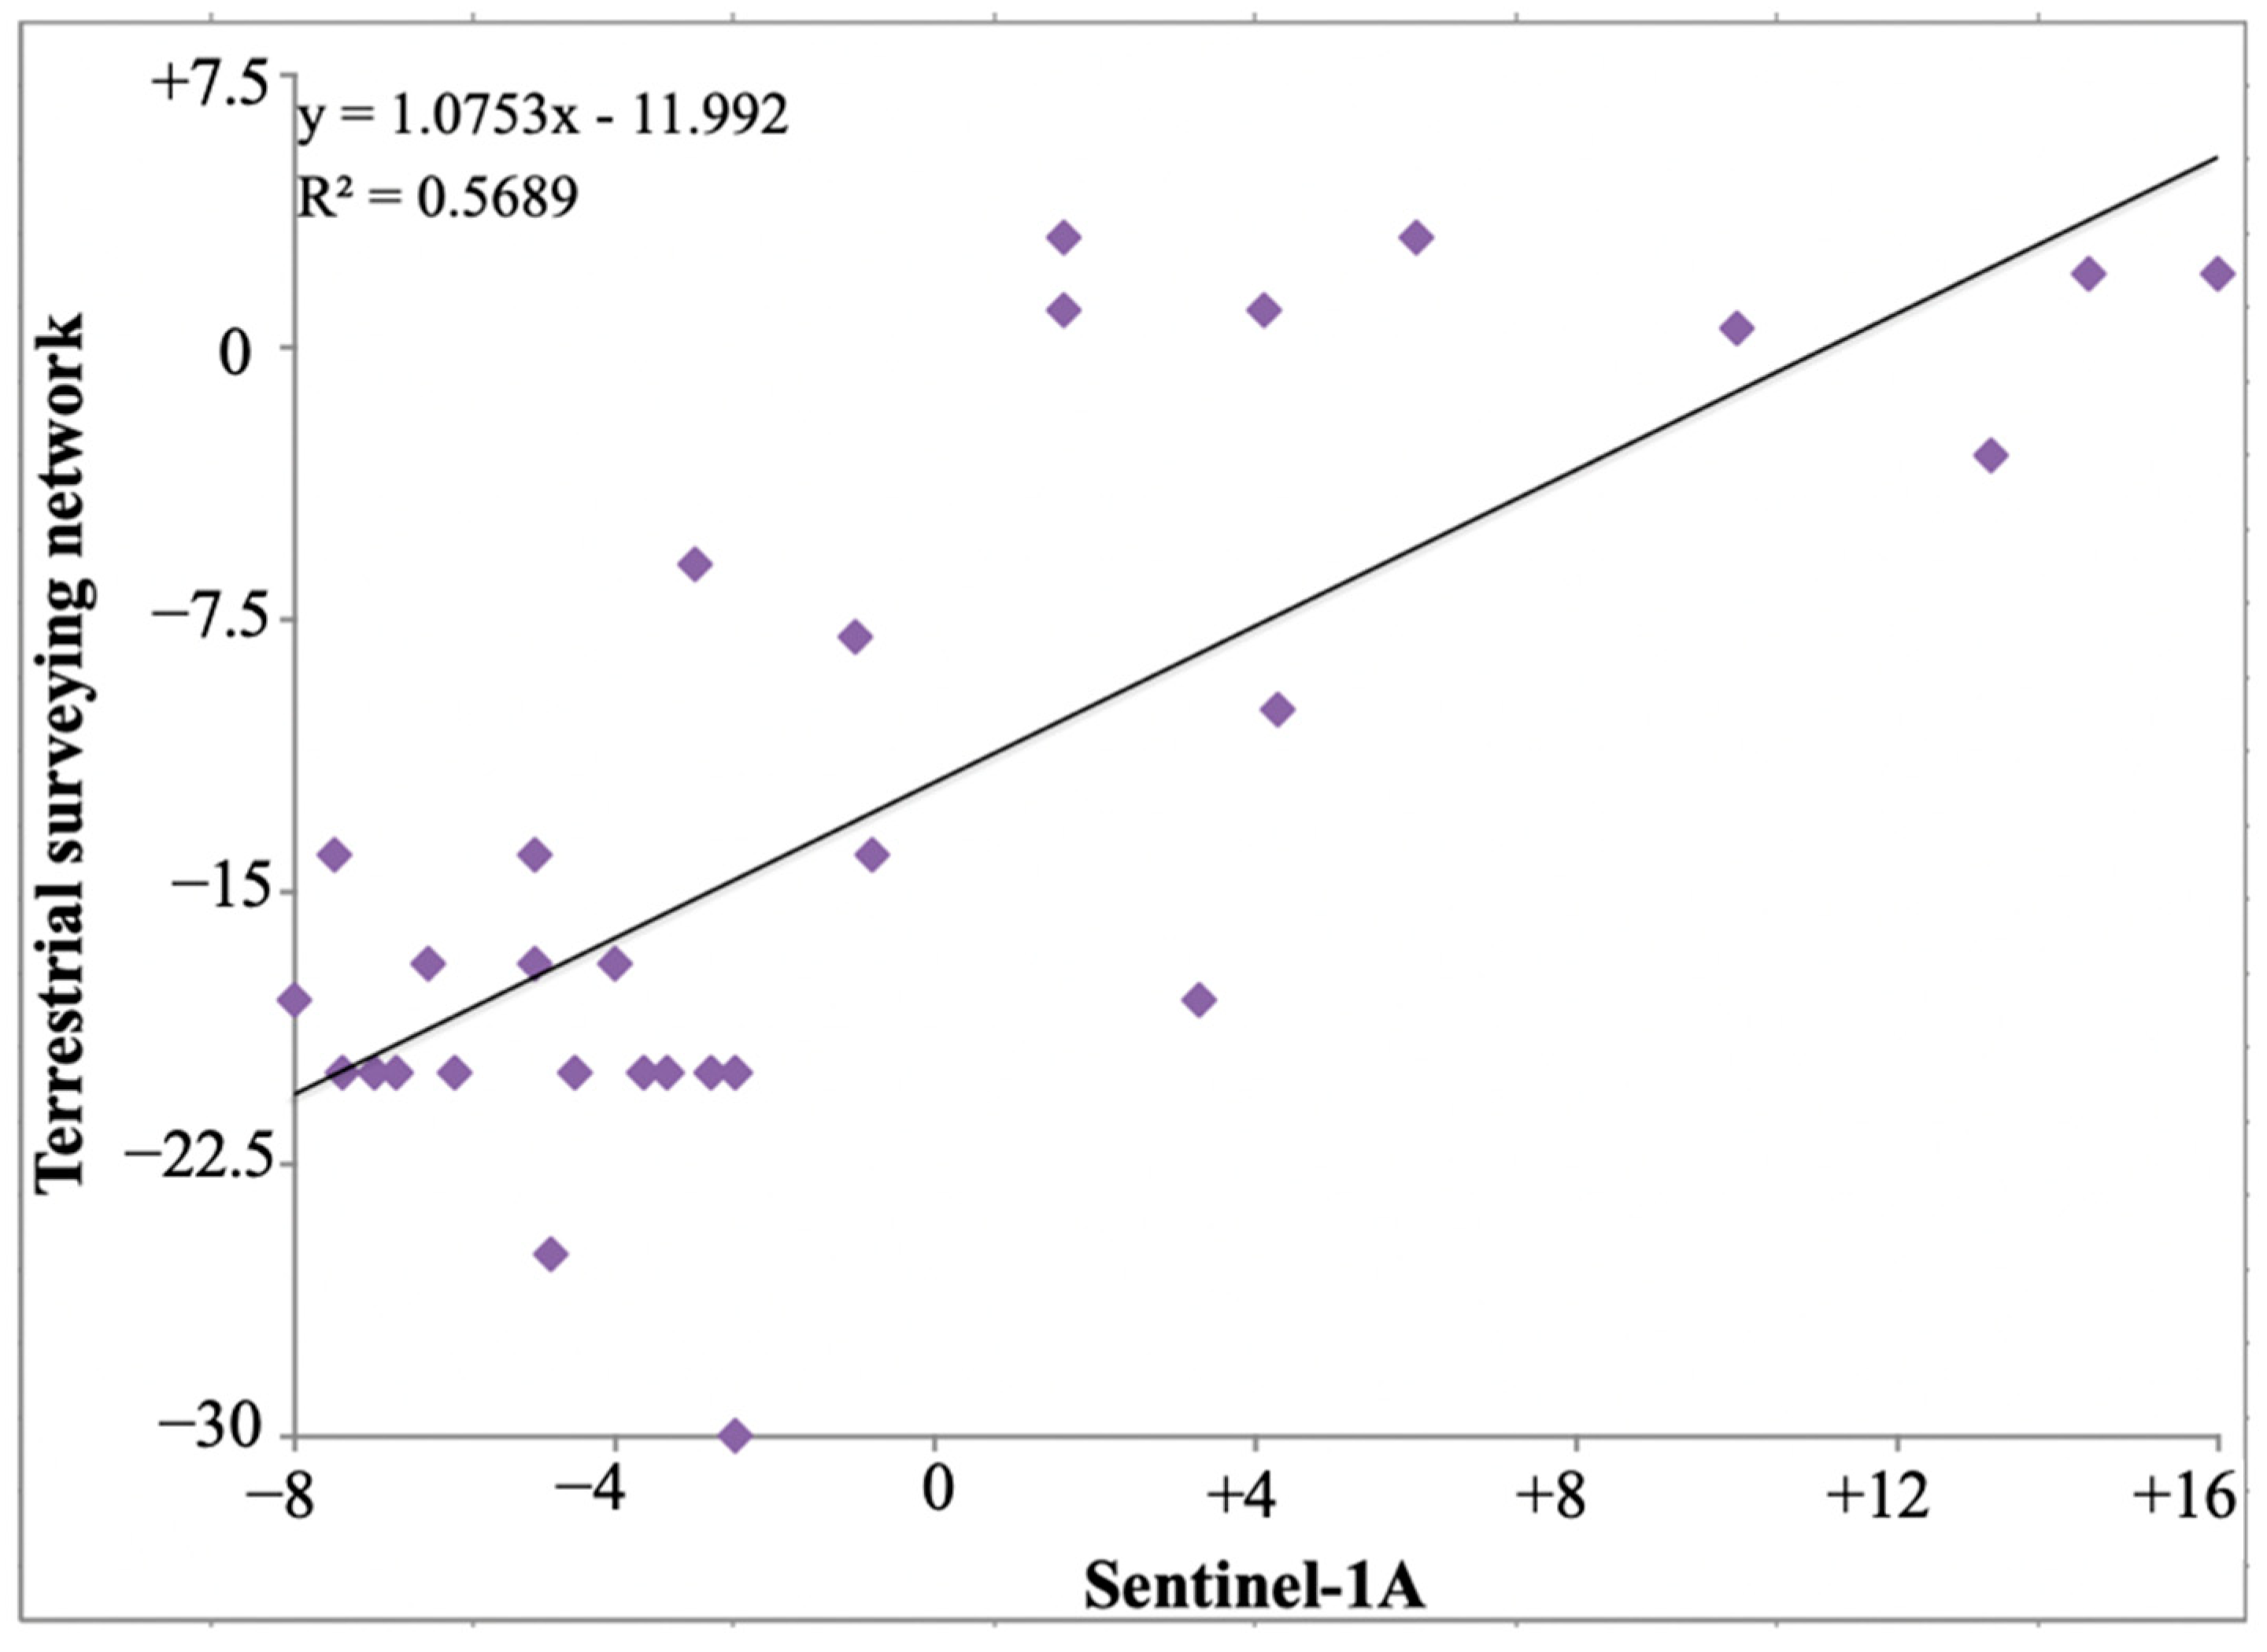
One of the most crucial techniques is the use of a terrestrial surveying network, which provides more precise information about the dam structure. To ensure precise monitoring with InSAR, it is necessary to validate the results with a terrestrial surveying network. In a recent terrestrial surveying measurement, the left side of the dam was seen to be uplifting. In addition, Figure 10 depicts the pillars along the left abutment uplift between 2015 and 2020. Also, the micro-geodesy points with the largest displacements and changes were compared with the results of the InSAR processing (Sentinel-1). As a result, both the terrestrial surveying network and the InSAR technique verified an uplift on the left abutment of the dam’s body. As shown in Table 6, the displacement rate differed at various locations, but the terrestrial surveying points and InSAR results have a linear relation. Also, the linear regression between the terrestrial surveying network and Sentinel-1 was 0.75 (Figure 12). It should be noted that the results were consistent. The RMSE between the terrestrial surveying network and Sentinel-1A was 2.19.
According to the terrestrial surveying network, the maximum uplift of 19.68 mm was detected at point TB4 on the dam’s left abutment; however, this was decreased to 10 mm by the InSAR method. The Sentinel-1 results show subsidence (Figure 9) on the dam’s left side from 2015 to 2019, with inverse behavior in 2018 leading to an uplift. Based on the InSAR results (Figure 9), the deformation range can be classified into three categories: the right abutment showed subsidence with 20 mm/y, and in the middle part of the dam to the left abutment (green color), it changed from subsidence to uplift during the last five years.
According to the reports of the Water Regional Organization [30], water escaping from limestone and karst passages in the reservoir and beneath the dam’s body causes these deformations. As the water pressure increases, pore water from alluvial deposits infiltrates the limestone, and some of the limestone layers become filled with alluvial deposits, reducing the soil shear strength. Also, the hydraulic flow of the water forces the materials to function, and, over time, the alluvium beneath the dam’s body and foundation erodes away, resulting in internal erosion [24]. The permeability of the foundation is vital for the stability of the dam structure. Poorly permeable materials raise the pore pressure and shear stress on the foundation [40,41].
As mentioned before by [41], the hydrology and geology of the dam’s environment should be considered when choosing a dam foundation. As a result, there is the possibility of further subsidence, the unexpected collapse of the body, and the construction of a massive sinkhole.
In general, the precision achieved with InSAR was similar to that of the terrestrial survey network, with a 0.75 correlation.
Additionally, this article includes a risk evaluation. Due to the karst region of the Lar Dam, it is obvious that there will be some risk of ground surface collapse, affecting all components.
In conclusion, the InSAR analysis (TerraSAR-X and Sentinel-1) and terrestrial surveying network revealed a significant displacement rate at the Lar Dam. The water leakage and field observations justify the variations. As a result, we can assume that the instability process continues to impact the Lar Dam. Further study should focus on the use of continuous InSAR processing and a ground surveying network to improve dam safety and reduce the associated hazards.

6. Conclusions

It is crucial to conduct a dam stability monitoring assessment. For instance, employing a terrestrial surveying network is a challenging, time-consuming, and costly process. As the data-monitoring instrumentation installed in the embankment dam has gradually lost its efficiency, and the information is not always reliable, it is necessary to consider alternative methods of monitoring. Satellite radar interferometry represents a valuable approach for the purpose of continuous monitoring, offering the advantage of scanning a large area in comparison with terrestrial surveying networks. In this research, it was demonstrated that the interpretation of InSAR results must be carried out with great scientifically based caution in order to prevent any misinterpretation of the superficial movement of the covering materials. The amount of displacement varies in specific places. Also, the terrestrial surveying network on the left abutment indicated an uplift, which was consistent with the TerraSAR-X results.
The Sentinel-1A images, captured between 5 February 2015 and 30 September 2019, and the TerraSAR-X images (9 May 2018 to 16 August 2018) were analyzed to investigate the dam’s behavior. The InSAR results were compared with those of the terrestrial surveying network for the period between 1992 and 2019. The results of the Sentinel-1 images indicated that the dam on the left side had moved by more than 8 mm per year. Furthermore, the TerraSAR-X data indicated that the dam underwent 8 mm of displacement over a three-month period. The results of the terrestrial surveying indicated that the maximum uplift was 19.68 mm at the TB4 point on the left side and upstream of the body. In contrast, the interferometry analysis for the period of 2015–2020 revealed a maximum uplift of 10 mm. The high-resolution TerraSAR-X images offered precise displacement measurements, although the high cost of the TerraSAR-X images limited the period for which these images could be obtained. The geodetic observations in the ninth stage of micro-geodesy and the behavior measurements of the Lar Dam indicated that horizontal and vertical movements occurred on the dam body over the time period of 1992–2019.

Author Contributions

Conceptualization, M.G.; methodology, M.G.; software, M.G.; validation, M.G.; resources, M.K.; writing—original draft preparation, M.G.; writing—review and editing, M.G.; visualization, M.G.; supervision, M.G.; project administration, M.G. and M.K.; funding acquisition, M.G. All authors have read and agreed to the published version of the manuscript.

Funding

This research was supported by the project (3-87-44) between the University of Tehran and the Regional Water Company of Tehran Province.

Institutional Review Board Statement

Not applicable.

Informed Consent Statement

Not applicable.

Data Availability Statement

The data are available upon request.

Acknowledgments

The original TerraSAR-X data were kindly provided by the German Aerospace Agency (DLR) under the proposal ghadimi_GEO. The Sentinel-1 datasets were freely provided by the European Space Agency (ESA) through the Sentinels Scientific Data Hub. The authors would like to thank Ali Derakhshan for his assistance.

Conflicts of Interest

The authors declare no conflicts of interest.

References

  1. ICOLD World Register of Dams—General Synthesis. 2020. Available online: https://www.icold-cigb.org/ (accessed on 24 March 2024).
  2. Icold. Dam Failures Statistical Analysis; Int Com Large Dams 99 Bulletin: Tehran, Iran, 1995. [Google Scholar]
  3. Punia, A. Role of temperature, wind, and precipitation in heavy metal contamination at copper mines: A review. Environ. Sci. Pollut. Res. 2021, 28, 4056–4072. [Google Scholar] [CrossRef] [PubMed]
  4. Bowles, D.; Brown, A.; Hughes, A.; Morris, M.; Sayers, P.; Topple, A.; Wallis, M.; Gardiner, K. Guide to Risk Assessment for Reservoir Safety Management, Volume 2: Methodology and Supporting Information; Environment Agency: Bristol, UK, 2013; p. 329. [Google Scholar]
  5. USACE. Guidance for Incorporating Climate Change Impacts to Inland Hydrology in Civil Works Studies, Designs, and Projects 2016; USACE: Washington, DC, USA, 2016.
  6. Wu, M.; Ye, Y.; Hu, N.; Wang, Q.; Tan, W. Scientometric analysis on the review research evolution of tailings dam failure disasters. Environ. Sci. Pollut. Res. 2023, 30, 13945–13959. [Google Scholar] [CrossRef] [PubMed]
  7. Berardino, P.; Fornaro, G.; Lanari, R.; Sansosti, E. A new algorithm for surface deformation monitoring based on small baseline differential SAR interferograms. IEEE Trans. Geosci. Remote Sens. 2002, 40, 2375–2383. [Google Scholar] [CrossRef]
  8. Navalgund, R.R.; Jayaraman, V.; Roy, P.S. Remote sensing applications: An overview. Curr. Sci. 2007, 1747–1766. [Google Scholar]
  9. Wang, Y.; Bai, Z.; Zhang, Y.; Qin, Y.; Lin, Y.; Li, Y.; Shen, W. Using TerraSAR X-band and sentinel-1 C-band SAR interferometry for deformation along Beijing-Tianjin intercity railway analysis. IEEE J. Sel. Top. Appl. Earth Obs. Remote Sens. 2021, 14, 4832–4841. [Google Scholar] [CrossRef]
  10. Bouali, E.H.; Oommen, T.; Escobar-Wolf, R. Mapping of slow landslides on the Palos Verdes Peninsula using the California landslide inventory and persistent scatterer interferometry. Landslides 2018, 15, 439–452. [Google Scholar] [CrossRef]
  11. Mouat, D.A.; Mahin, G.G.; Lancaster, J. Remote sensing techniques in the analysis of change detection. Geocarto Int. 1993, 8, 39–50. [Google Scholar] [CrossRef]
  12. Bayrak, T. Verifying pressure of water on dams, a case study. Sensors 2008, 8, 5376–5385. [Google Scholar] [CrossRef] [PubMed]
  13. Di Pasquale, A.; Nico, G.; Pitullo, A.; Prezioso, G. Monitoring strategies of earth dams by ground-based radar interferometry: How to extract useful information for seismic risk assessment. Sensors 2018, 18, 244. [Google Scholar] [CrossRef]
  14. Mishra, S.; Shrivastava, P.; Dhurvey, P. Change detection techniques in remote sensing: A review. Int. J. Wirel. Mob. Commun. Ind. Syst. 2017, 4, 1–8. [Google Scholar] [CrossRef]
  15. Tarchi, D.; Rudolf, H.; Luzi, G.; Chiarantini, L.; Coppo, P.; Sieber, A.J. SAR interferometry for structural changes detection: A demonstration test on a dam. In Proceedings of the IEEE 1999 International Geoscience and Remote Sensing Symposium. IGARSS’99 (Cat. No.99CH36293), Hamburg, Germany, 28 June–2 July 1999; Volume 3, pp. 1522–1524. [Google Scholar]
  16. Ullo, S.L.; Addabbo, P.; Di Martire, D.; Sica, S.; Fiscante, N.; Cicala, L.; Angelino, C.V. Application of DInSAR technique to high coherence Sentinel-1 images for dam monitoring and result validation through in situ measurements. IEEE J. Sel. Top. Appl. Earth Obs. Remote Sens. 2019, 12, 875–890. [Google Scholar] [CrossRef]
  17. Ghadimi, M. Investigation of riprap stability of a dam: Risk assessment by InSAR method and rock mechanical test. Geomat. Nat. Hazards Risk 2022, 13, 1441–1456. [Google Scholar] [CrossRef]
  18. Perissin, D. Interferometric SAR multitemporal processing: Techniques and applications. In Multitemporal Remote Sensing; Springer: Berlin/Heidelberg, Germany, 2016; pp. 145–176. [Google Scholar]
  19. Barzaghi, R.; Cazzaniga, N.E.; De Gaetani, C.I.; Pinto, L.; Tornatore, V. Estimating and Comparing Dam Deformation Using Classical and GNSS Techniques. Sensors 2018, 18, 756. [Google Scholar] [CrossRef]
  20. Casaca, J.; Braz, N.; Conde, V. Combined adjustment of angle and distance measurements in a dam monitoring network. Surv. Rev. 2015, 47, 181–184. [Google Scholar] [CrossRef]
  21. Scaioni, M.; Marsella, M.; Crosetto, M.; Tornatore, V.; Wang, J. Geodetic and Remote-Sensing Sensors for Dam Deformation Monitoring. Sensors 2018, 18, 3682. [Google Scholar] [CrossRef]
  22. de Lacy, M.C.; Ramos, M.I.; Gil, A.J.; Franco, Ó.D.; Herrera, A.M.; Avilés, M.; Domínguez, A.; Chica, J.C. Monitoring of vertical deformations by means high-precision geodetic levelling. Test case: The Arenoso dam (South of Spain). J. Appl. Geod. 2017, 11, 31–41. [Google Scholar] [CrossRef]
  23. Vázquez-Ontiveros, J.R.; Ruiz-Armenteros, A.M.; de Lacy, M.C.; Gaxiola-Camacho, J.R.; Anaya-Díaz, M.; Vázquez-Becerra, G.E. Risk Evaluation of the Sanalona Earthfill Dam Located in Mexico Using Satellite Geodesy Monitoring and Numerical Modeling. Remote Sens. 2023, 15, 819. [Google Scholar] [CrossRef]
  24. Uromeihy, A. The Lar Dam; an example of infrastructural development in a geologically active karstic region. J. Asian Earth Sci. 2000, 18, 25–31. [Google Scholar] [CrossRef]
  25. Mozafari, M.; Raeisi, E. Leakage paths at the Lar Dam site, northern Iran. Q. J. Eng. Geol. Hydrogeol. 2017, 50, 444–453. [Google Scholar]
  26. Djalaly, H. Remedial and watertightening works of Lar Dam. In Seizieme Congres das Grandes Barages; Geological Society: San Francisco, CA, USA, 1988; Volume 50, pp. 444–453. [Google Scholar] [CrossRef]
  27. Feghhi, K.; Berga, L.; Buil, J.M. Contribution of the Lar Dam—Polur lineament in the Lar Dam leakage. In Dams and Reservoirs, Society and Environment in the 21st Century; Taylor & Francis London: Abingdon, UK, 2006; pp. 699–706. [Google Scholar]
  28. Partners, G. Setec Report. Report. 1980. Available online: https://inter.setec.fr/en/about-us/the-setec-group/ (accessed on 24 March 2024).
  29. Gibbs, A.; Gaborone, P. Dam Raising. Report. 1980. Available online: https://nora.nerc.ac.uk/id/eprint/14632/ (accessed on 24 March 2024).
  30. Reginal Water Company of Iran Behavior report of the Lar Dam; Bulletin: Tehran, Iran, 2012.
  31. Ferretti, A.; Prati, C.; Rocca, F. Permanent scatterers in SAR interferometry. IEEE Trans. Geosci. Remote Sens. 2001, 39, 8–20. [Google Scholar] [CrossRef]
  32. Hooper, A.; Zebker, H.A. Phase unwrapping in three dimensions with application to InSAR time series. JOSA A 2007, 24, 2737–2747. [Google Scholar] [CrossRef] [PubMed]
  33. Hooper, A. A Statistical-Cost Approach to Unwrapping the Phase of InSAR Time Series. In Proceedings of the International Workshop on ERS SAR Interferometry; Frascati, Italy, 2010. Available online: https://www.researchgate.net/profile/AndyHooper2/publication/228898559_A_Statistical-Cost_Approach_to_Unwrapping_the_Phase_of_InSAR_Time_Series/links/00b7d52f823caae461000000/A-Statistical-Cost-Approach-to-Unwrapping-the-Phase-of-InSAR-Time-Series.pdf (accessed on 24 March 2024).
  34. Hooper, A. A multi-temporal InSAR method incorporating both persistent scatterer and small baseline approaches. Geophys. Res. Lett. 2008, 35, 16. [Google Scholar] [CrossRef]
  35. Hanssen, R.F. Radar Interferometry: Data Interpretation and Error Analysis; Springer Science & Business Media: Berlin/Heidelberg, Germany, 2001; Volume 2. [Google Scholar]
  36. Sandwell, D.; Mellors, R.; Tong, X.; Wei, M.; Wessel, P. Open Radar Interferometry Software for Mapping Surface Deformation; Wiley Online Library: Hoboken, NJ, USA, 2011. [Google Scholar]
  37. Wessel, P.; Smith, W.H.F.; Scharroo, R.; Luis, J.; Wobbe, F. Generic mapping tools: Improved version released. Eos, Trans. Am. Geophys. Union 2013, 94, 409–410. [Google Scholar] [CrossRef]
  38. Prats-Iraola, P.; Scheiber, R.; Marotti, L.; Wollstadt, S.; Reigber, A. TOPS interferometry with TerraSAR-X. IEEE Trans. Geosci. Remote Sens. 2012, 50, 3179–3188. [Google Scholar] [CrossRef]
  39. Gao, M.; Gong, H.; Li, X.; Chen, B.; Zhou, C.; Shi, M.; Guo, L.; Chen, Z.; Ni, Z.; Duan, G. Land subsidence and ground fissures in Beijing capital international airport (bcia): Evidence from quasi-ps insar analysis. Remote Sens. 2019, 11, 1466. [Google Scholar] [CrossRef]
  40. Fornaro, G.; Pauciullo, A.; Reale, D.; Verde, S. Multilook SAR tomography for 3-D reconstruction and monitoring of single structures applied to COSMO-SKYMED data. IEEE J. Sel. Top. Appl. Earth Obs. Remote Sens. 2014, 7, 2776–2785. [Google Scholar] [CrossRef]
  41. Wu, S.; Yang, Z.; Ding, X.; Zhang, B.; Zhang, L.; Lu, Z. Two decades of settlement of Hong Kong International Airport measured with multi-temporal InSAR. Remote Sens. Environ. 2020, 248, 111976. [Google Scholar] [CrossRef]
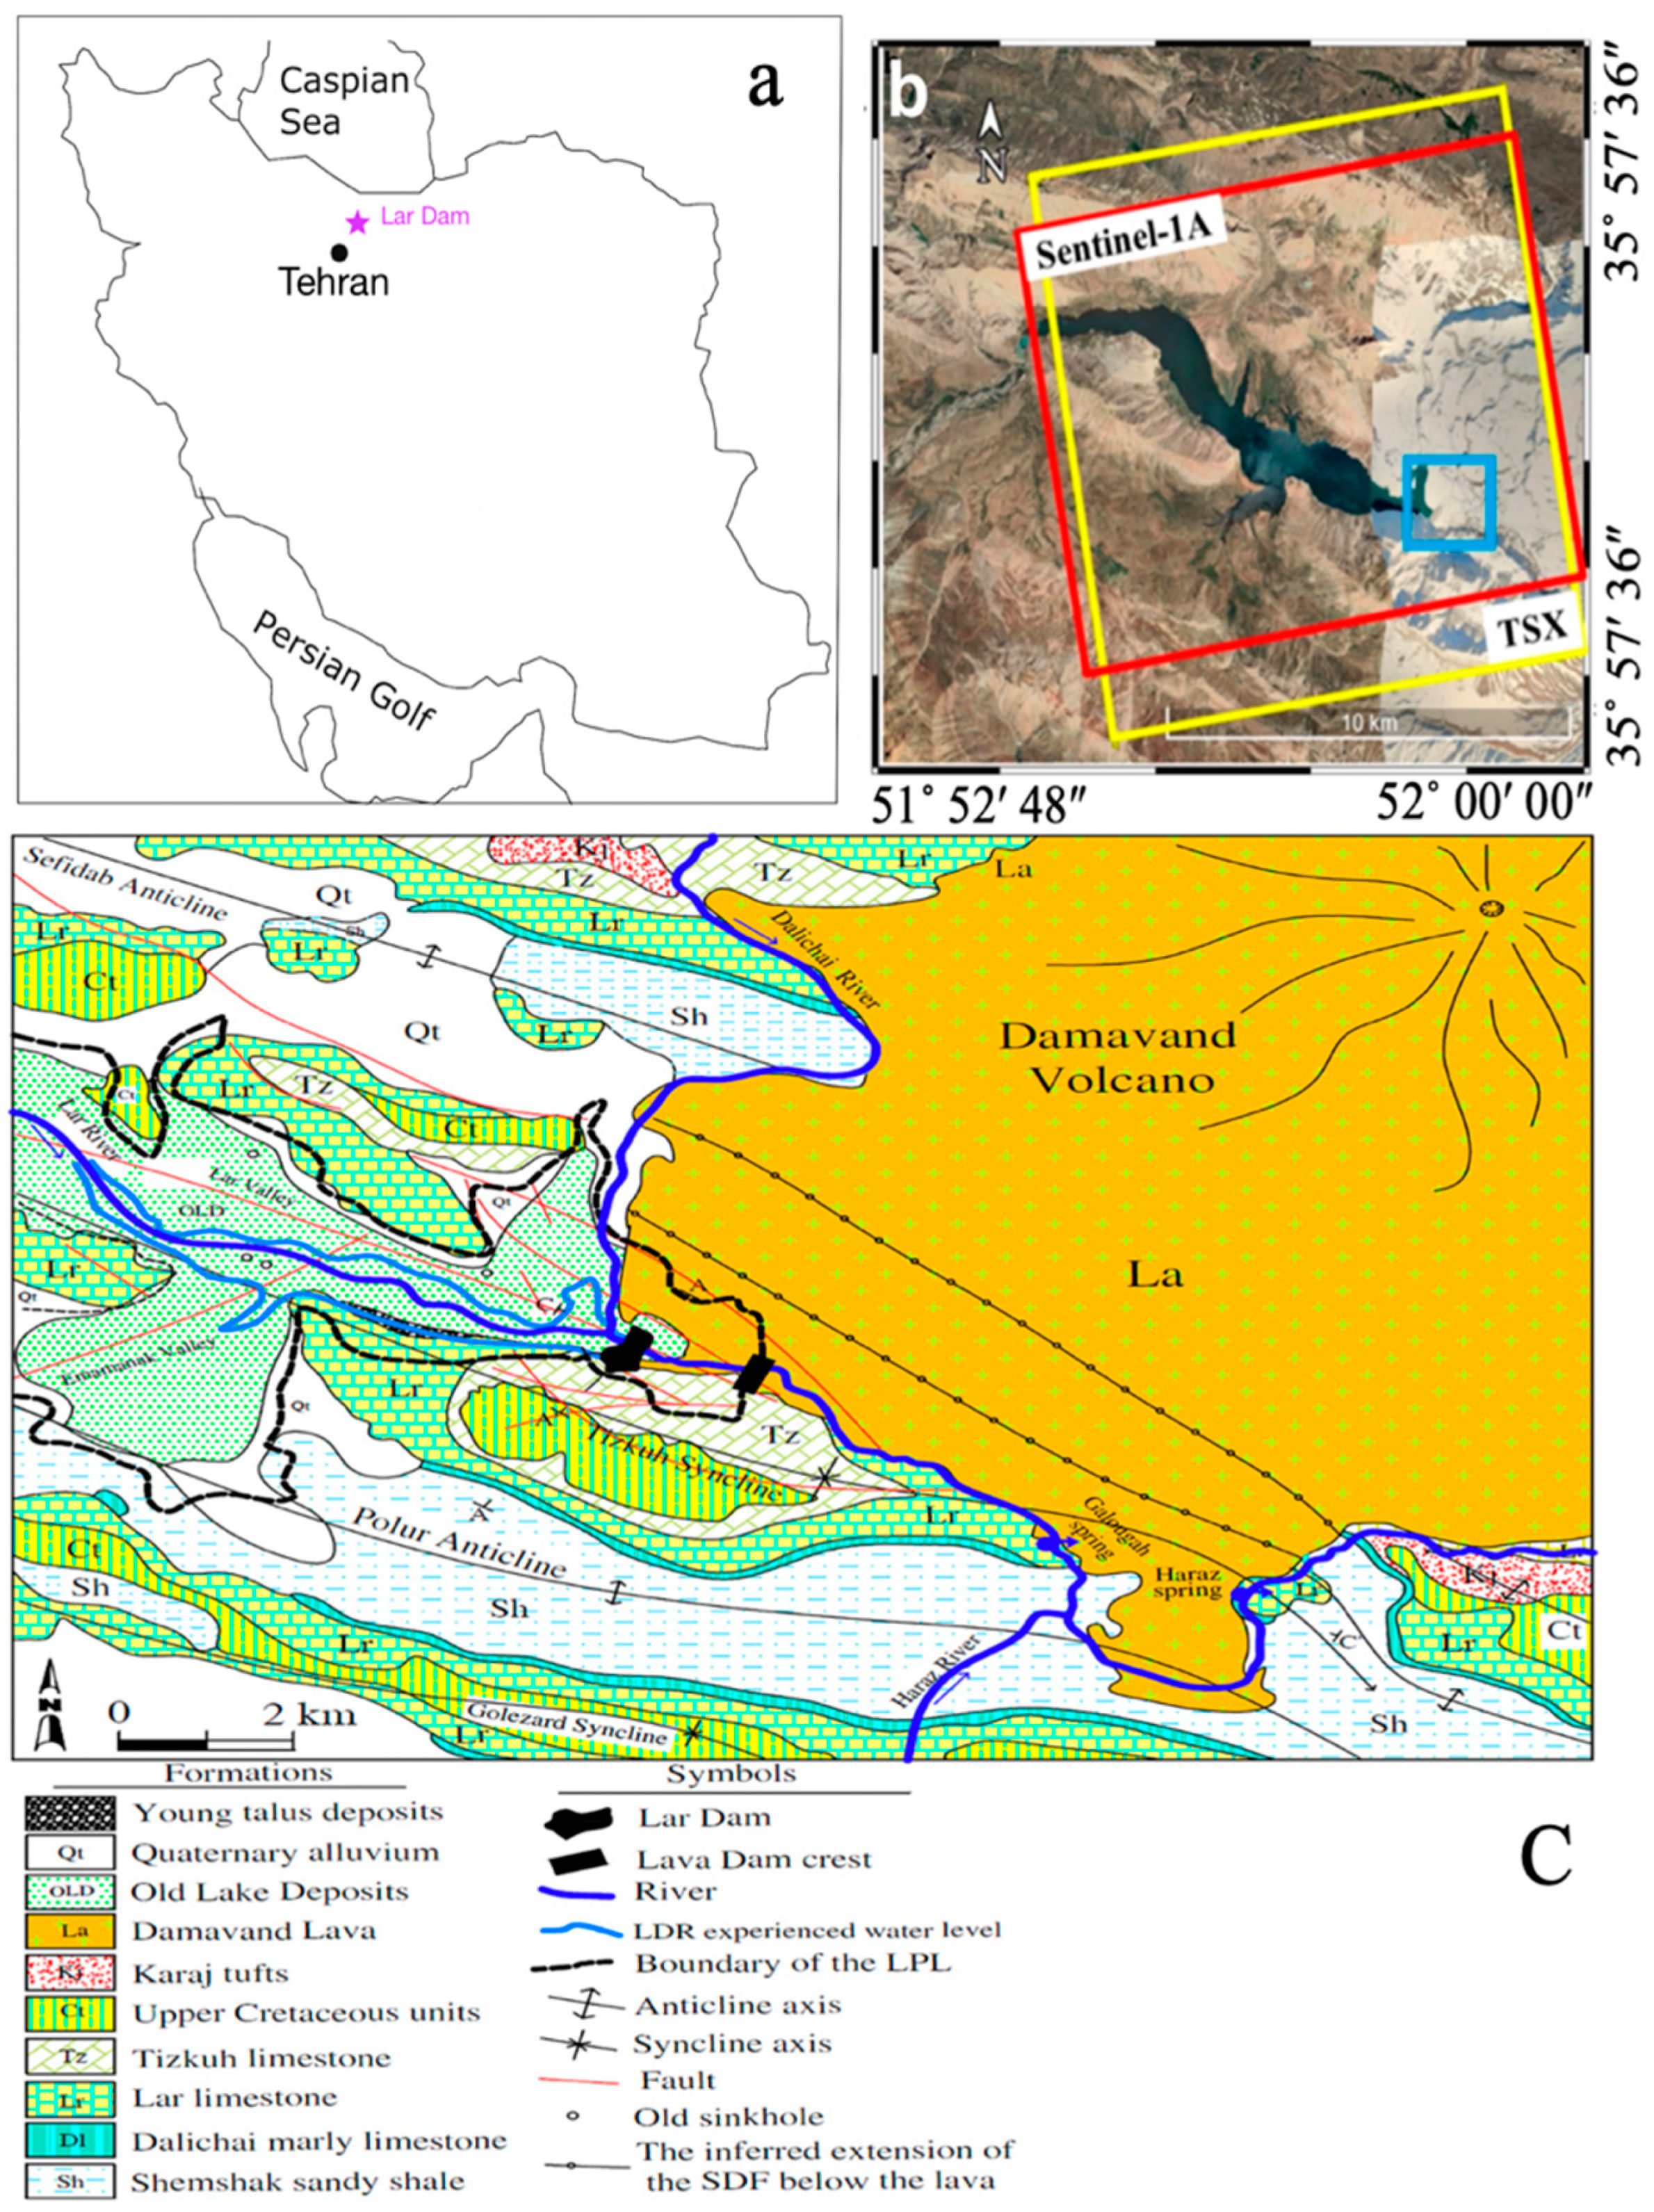
Figure 1. The Lar Dam location. (a) The red rectangle depicts the Sentinel-1A frame; (b) the yellow rectangle represents the TSX frame, while the blue rectangle represents the Lar Dam location; and (c) the Lar geological map [25].
Sustainability 16 04335 g001
Figure 2. Geological section of the dam foundation: (a) lava flow at crack location; (b) erosion caused circular-shaped holes on the berm along the right bank [28].
Sustainability 16 04335 g002
Figure 3. A longitudinal crack formed on the berm at a height of 2462 m, with water leakage into the crack.
Sustainability 16 04335 g003
Figure 4. The water escape locations near the opening pumping tunnel in the Haraz Valley (a) and (b) the Galugah Valley.
Sustainability 16 04335 g004
Figure 5. The blue circles on the riprap layer of Lar Dam represent deformations.
Sustainability 16 04335 g005
Figure 6. Vertical movement of the riprap layer in the Lar Dam.
Sustainability 16 04335 g006
Figure 7. (a) Locations of the geodetic points in the Google Earth image. (b) Locations of the geodetic points and horizontal displacements collected in 1992, 2013, and 2019 [1].
Sustainability 16 04335 g007
Figure 8. Mean LOS velocity obtained from TerraSAR-X during the period of May 2018 to August 2018, in the ascending (a) and descending orbits (b), respectively. (c) The mean linear velocity with TerraSAR-X during the period of May 2018 to August 2018 in the ascending orbit.
Sustainability 16 04335 g008
Figure 9. Mean LOS velocity for Sentinel-1 (2015–2019) processed using GMTSAR. Positive is toward the satellite.
Sustainability 16 04335 g009
Figure 10. (a) The vertical deformation of pillar points on the Lar Dam in the period of 1992–2013. (b) The vertical deformation of pillar points on the Lar Dam in the period of 2013–2019.
Sustainability 16 04335 g010
Figure 11. Comparison of vertical displacements in TerraSAR-X and Sentinel-1 images.
Sustainability 16 04335 g011aSustainability 16 04335 g011b
Figure 12. Linear regression between terrestrial surveying network and Sentinel-1.
Sustainability 16 04335 g012
Table 1. Characteristics of the Lar Dam.
Type of DamEmbankment
Year of completion1980
Dam height above foundation (m)107
Height from riverbed (m)105
Dam crest width (m)13
Dam crest length (m)1170
Total water surface area of the reservoir (Km2)33.5
Reservoir width (Km)1–6
Reservoir length (Km)18
Total reservoir volume 960
Table 2. Detailed information on the TerraSAR-X images.
Temporal CoverageOrbitModeResolution (m)SizeIncidence AngleHeading AngleBand
9.5.2018–16.8.2018DescendingSpotlight110 × 534.3350X
10.5.2018–17.8.2018AscendingSpotlight110 × 532.8190X
Table 3. Detailed information on the Sentinel-1 images.
Temporal CoverageOrbitModeResolution (m)Swath (Km)Incidence AngleHeading AngleBand
5 February 2015–30 September 2019AscendingIW20 × 525034.332.3C
Table 4. Horizontal displacements. Semi-minor and semi-major axes of the error ellipse are represented by a and b at a 95% confidence interval, respectively, and Az represents the azimuth of the major axis of the ellipse.
Point Name x
(mm)
y
(mm)
D
(mm)
Az
(deg)
a
(mm)
b
(mm)
Phi
(deg)
M5 (2013–2019)−1.34−1.682.1521810.916
M5 (1992–2019)3.42.654.31520.80.814
M6 (2013–2019)3.02−0.333.03961.20.9117
M6 (1992–2019)−2.49−4.545.1820810.9120
M1 (2013–2019)3.794.76.043910.9165
M1 (1992–2019)−4.31−6.197.542150.90.831
M4 (2013–2019)−1.88−2.252.9321910.823
M4 (1992–2019)4.555.276.96400.80.810
M2 (2013–2019)0.174.274.28210.9149
M2 (1992–2019)−4.71−5.697.392190.90.820
M3 (2013–2019)−3.76−4.716.032181.20.945
M3 (1992–2019)3.578.59.222210.842
Table 5. The vertical displacements along with the dimensions of the ellipse of the displacement error of the observational pillars at a confidence level of 99%.
Vertical Status M z
( m m )
z
( m m )
M z
( m m )
z
( m m )
Point NameVertical Status M z
( m m )
z
( m m )
z
( m m )
M z
( m m )
Point
Name
2013–20191992–20132013–20191992–2013
Moved3/9−7.415.2−43.26FC1bFixed0.00.000.00.00L39
Moved3/9−6/735.2−38.13FS1bNot Moved0.3−0.130.30.19L38
Moved3.714.395.0−9.12TR7bMoved3.510.794.7−13.49TS26b
Moved3/813/175.1−14.08TR6bMoved3.611.594.9−12.00TS25b
Moved3/910/365.1−23.09TR5bMoved4/1−4/555.0−24.04FS9b
Moved3.97.115.2−47.82TR4bMoved/not moved3.81.515.1−39.08FC7b
Moved3.94.195.2−54.71TR3bMoved3.83.595.2−53.82TS19b
Moved3.9−0.795.2−61.68FR6bMoved3.93.125.2−53.66FC6b
Moved3/9−4/075.2−68.03FR4bMoved3.90.745.2−62.00TS15b
Moved3/9−5/275.2−60.80FR2bMoved3.9−1.15.2−193.01FC5b
Moved3/9−3/215.2−28.53FR1bMoved3.9−2.955.2−66.96TS10b
Moved3/9−7/345.2−32.07FS2bMoved3.9−6.155.2−200.61FC4b
Moved/not moved3/9−3/355.2−15.00TS3bMoved3.9−7.495.2−457.81FC3b
Moved3/9−4/795.3−25.60FS3bMoved3.9−8.255.2−153.45FC2b
Moved3/9−4/655.2−32.30FS4bMoved3.9−7.175.2−72.87TS4b
Moved4/016/185.4−19.43FR10bMoved/not moved3/92/645.3−27.53MP5
Moved/not moved4/0−2/555.3−18.59MP3AMoved/not moved3/9−1/575.2−35.32FS7b
Moved4.1−2.975.5−9.48MP1Moved4/01/15.3−6.66TS13b
Moved3/9−3/735.3−18.56TS1bMoved3/9−2/475.3−18.94MP3b
Moved/not moved4/0−3.055.3−15.64TS6bMoved/not moved3/9−3/475.3−30.94MP4
Moved4/03/45.44.03FS8cMoved3/9−0/055.3−47.46TS16b
Moved3/91/675.3−35.78FS7cMoved4/1−5/555.5−16.71TS7b
Moved/not moved3/9−5/635.3−30.70FS2cMoved4/1−4/555.5−15.24TS9b
Moved4/1−4/895.5−13.11FS4BcMoved3/9−4/655.5−10.03FS4Bb
Moved/not moved3/9−6/895.3−50.29FC1cMoved4/03/295.41.54FS8b
Moved3/9−5/075.3−50.51FC4cMoved4/0−3/055.5−1.24FS6b
Moved/not moved3/94/885.2−51.70FC6cMoved/not moved3/90/335.3−40.09FC5c
Moved4/115/425.5−12.35FR9bMoved3/710/154.85.23M2
Moved/not moved4/30/965.814.5M3
Moved4/04/275.48.80M6
Table 6. Comparison of terrestrial surveying results with Sentinel-1A.
Pillar PointTerrestrial Surveying
Result (mm)
Sentinel-1A (mm)Pillar PointTerrestrial Surveying Result (mm)Sentinel-1A (mm)
Ts13+6+3Fs4b−5−14
M2+10+0.5Tr6+13.17−3
Fc3−6.33−17Fs2−6−20
Fc4−5−17Fr1−2.8−20
Fc5−1−8Tr714.39+2
Fc2−8−18Fs3−4.8−25
Ts4−7−20Ts1−3.64−20
Fr4−4−17Mp3b−2.5−20
Ts10−3−6Mp3a−2.5−30
Fc1−7.5−14Fr6−0.79−14
Fr10+16+2Ts3−3.35−20
Fs7+1.6+3Ts9−4.5−20
Tr5+4.1+1Fs8+3.29−18
Fs1−6.73−20M6+4.27−10
Fr9+1.6+1Fs6−7.4−20
Disclaimer/Publisher’s Note: The statements, opinions and data contained in all publications are solely those of the individual author(s) and contributor(s) and not of MDPI and/or the editor(s). MDPI and/or the editor(s) disclaim responsibility for any injury to people or property resulting from any ideas, methods, instructions or products referred to in the content.