Abstract
To solve the problem of urban freight demand and build an efficient, practical, intelligent, green, and sustainable new logistics system, this paper considers the application of the subway network to urban freight transportation and studies the location problem of subway transit stations in the urban freight network. According to the differences between different subway stations, the nodal degree, medial centrality, proximity centrality, and regional accessibility are proposed as the evaluation indexes, and the improved fuzzy analytic hierarchy method and entropy weight method are used to calculate the index weight. The TOPSIS evaluation method is used to evaluate the importance of each subway station, and the importance evaluation model of subway stations is constructed. Combined with the distribution location and transportation demand of urban express delivery outlets, a two-tier planning model for the location of subway transfer stations was constructed with total cost and customer satisfaction as the objective functions, and the case studies were carried out by taking Jiangning District, Lishui District, and Gaochun District of Nanjing as the research objects. The results show that Hohai University Focheng West Road, Zhengfang Middle Road, Qunli, and Gaochun can be transformed into subway transfer stations and used as transshipment centers of the urban cargo transportation network. Compared with the original ground transportation network, 52.87% of the ground transportation distance in the optimized transportation network is replaced by subway transportation, and the total cost of logistics transportation is reduced by 8.73%, which verifies the feasibility of subway for urban cargo transportation, reduces logistics transportation costs, and relieves the pressure of ground transportation, which is of great significance for the sustainable development of urban logistics.
1. Introduction
With the development of urbanization and the economic level in China, the demand for transportation and logistics continues to rise. The increasing demand for urban freight has aggravated urban traffic congestion and traffic pollution; it has become an urgent problem, and it is necessary to build an efficient and green urban freight system. In recent years, new logistics systems based on intelligent transport technologies have attracted widespread attention and have been put into practice in some developed countries, such as the underground logistics system (ULS) [1,2]. Among them, the concept of using metro, light rail, or tram to coordinate passenger and freight transport has been widely discussed and defined as the metro-based underground logistics system (M-ULS) [3]. To provide effective solutions to alleviate ground congestion and improve the efficiency of cargo transportation, this paper considers the application of metro networks to urban freight transportation and researches the location problem of metro transit stations in the urban freight network. At present, many scholars have conducted research on the feasibility of using urban subway networks for freight transportation and have conducted some research on the node selection of underground logistics networks.
In recent years, many scholars have proposed the feasibility of using urban subway networks for cargo transportation. Chen [4] analyzed the feasibility of Nanjing Metro’s cargo transportation from the perspectives of transportation time and capacity, user acceptance, and transportation market. Pan et al. [5] selected factors such as technology, economy, comprehensive transportation, environment and society, and operational organization management to construct a feasibility comprehensive evaluation system. Villa [6] evaluated the feasibility of using urban subways for express delivery and provided support. Moreover, some scholars have developed conceptual designs related to the metro-based underground logistics system. James [7] designed and evaluated the internal structure modification scheme of subway cars when using the subway for freight. Wang et al. [8] proposed the design of a subway logistics separation and combination integrated subway station. Ye et al. [9] developed a subway freight transportation plan for mixed passenger and freight transportation, providing reference for train schedules and freight distribution plans.
Certain achievements have been made in the research of node location selection in underground logistics distribution networks. Ren et al. [10] considered the construction cost and cost recovery period and used a set coverage model to determine the location of goods transfer centers. He [11] considers the uncertainty problem in logistics networks and establishes a node coverage model for logistics centers and a 0–1 mixed integer programming model for distribution centers. Yazdani [12] establishes a two-stage decision-making model based on the ground freight network and subway network to determine the optimal area for logistics centers. Zhou [13] constructed a dual-objective optimization model with the goal of minimizing total cost and maximizing customer service level to determine the location plan of underground logistics nodes. After the introduction of urban subway networks, selecting nodes for urban subway freight networks has become one of the hot topics. Zhou et al. [14] and Zheng et al. [15] constructed transportation node location models for urban distribution networks based on subway systems with the goal of minimizing costs. Zhang et al. [16] established a double-layer node localization model that considers distribution and pickup costs, solving the node localization problem considering supply and demand. Dong et al. [17] established a mixed-integer programming model that considers service capacity, freight logistics, and regional accessibility to solve the location–allocation problem of underground logistics systems based on subway capacity. Under the constraint of facility capacity, Ren et al. [18] constructed a network site allocation–routing combination optimization model aiming at a construction operation cost. Zhou et al. [14] studied the key nodes connecting the urban subway network and road network and analyzed the impact of coverage, demand, and scale effects on the decision making of transfer point location using the Chengdu subway as an example.
Complex network theory, as an effective means of studying the structural properties [19,20] and dynamics of transportation networks [21,22], has been studied by many domestic and foreign scholars. Hu et al. [23] used complex network theory to analyze the topological characteristics of traffic road networks and proposed a new graph spatiotemporal model for traffic flow prediction by combining topological features with graph neural networks. Bao et al. [24] studied the complexity and nonlinear characteristics of traffic flow evolution based on complex networks combined with cellular automata. Qiang et al. [25] compared and analyzed the complex network characteristics of the Harbin multi-mode weighted traffic network and three single-mode subnetworks and concluded that the multi-mode traffic network has typical small-world characteristics. Bontorin et al. [26] proposed that optimized networks converge to specific topological features when there is spatially heterogeneously distributed human mobility. Yuan et al. [27] used complex network theory to identify key hubs in weighted freight networks from the perspective of capacity reliability and studied the phenomenon of network cascading failure. Zhang et al. [28] established a new weighted cascading failure model for public transportation networks from the perspective of route failure and studied the impact of link prediction on the dynamic redistribution of fault loads. In the subway logistics site selection, Zhao et al. [29] evaluated the importance of subway stations by combining complex network theory, the AHP method, and the TOPSIS model, and constructed a P-median transfer center location model to determine the transfer node location.
From the above research status at home and abroad, it can be seen that both domestic and foreign studies have given theoretical support to the feasibility study of urban subways for cargo transportation and optimized the design of subways for cargo transportation. On the other hand, in the research on the location of nodes of the underground logistics distribution network, the factors considered are too simple. In considering the use of subway networks for freight transportation, most of the existing studies directly take all subway stations as alternative transfer stations, without considering that some subway stations are not suitable for cargo transit due to network morphology, geographic location, and other factors. Meanwhile, in constructing the node siting model, this study focuses on the total cost of the entire network after considering the subway station as a transit station directly from the perspective of a logistics and transportation company, ignoring the impact of the increased transportation time on customer satisfaction using the subway for cargo transportation.
Therefore, in this paper, starting from the analysis of complex network characteristics reflected in the urban subway freight network and based on the complex network theory, it is proposed to evaluate the subway stations and construct the node importance evaluation model to determine the alternative set of transshipment stations and exclude the subway stations that are not suitable for use as transshipment nodes. Then, based on the perspective of decision makers and participants in the urban subway freight network, this paper not only considers the total cost of the network but also takes into account the impact of cargo transportation time on customer satisfaction and establishes a two-layer planning model of node sitting in the urban subway freight network to determine the final subway transfer station. Finally, an empirical study is carried out in conjunction with the metro freight network in Nanjing, which provides theoretical guidance for the implementation of metro logistics and distribution.
2. Urban Metro Freight
2.1. Feasibility Analysis of Urban Metro Freight
The urban subway system has less passenger flow in off-peak periods and a larger surplus transport capacity. Using the surplus transport capacity of the established subway network can improve the utilization rate of the subway system and reduce the waste of resources. Taking the Nanjing subway network as an example, this paper analyzes the subway surplus capacity and freight time of the city that has built subway networks and evaluates the possibility and applicable conditions of using the urban subway to realize freight transportation.
Based on AFC system data, the literature [30] conducted a detailed analysis of Nanjing subway passenger flow and collected passenger transaction data for a total of 120 days from 1 March 2019, to 28 June 2019, including 83 working days and 37 non-working days. The data were preprocessed, the weekday passenger flow was divided into 15 min intervals and calculated, and the average online passenger flow distribution in the Nanjing Metro network was obtained as shown in Figure 1.
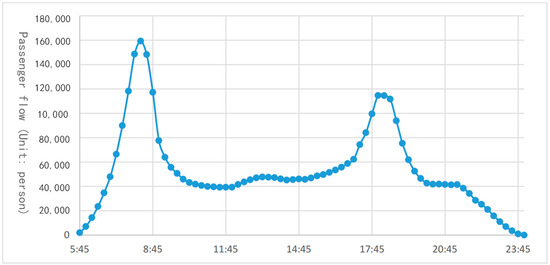
Figure 1.
Average online passenger flow distribution in the Nanjing Metro network.
As can be seen in the figure, the distribution of Nanjing subway passenger flow presents a double-peak feature, with the morning peak at 8:00 and the evening peak at 18:00. Except for these two-time nodes, the number of passengers in other periods is less than the peak value. According to the distribution, the passenger flow is less between 10:00 and 17:00. Considering the travel time of the subway line, it is determined that the subway freight time is from 10:00 to 16:00.
Each line of the Nanjing subway adopts the 6A grouping, which has a rated capacity of 310 passengers in the next carriage, and a subway can carry 1860 passengers. According to the online passenger flow distribution, assuming that the passenger flow per hour from 10:00 to 16:00 is 45,000, the online passenger flow in Nanjing Metro is calculated by one subway running every 3–8 min, and a total of 82–220 subway trains run on 11 lines per hour from 10:00 to 16:00 during the freight service period. The rated capacity is 152,520–409,200 passengers, and the remaining capacity accounts for 70.5–89.0% of the rated capacity. Therefore, using the subway to transport goods between 10:00 and 16:00 can improve the utilization rate of the subway system without affecting normal passenger transport, avoid the waste of subway system capacity, and improve subway operating income.
2.2. Urban Metro Freight Distribution Process
Similar to the express delivery process, urban logistics transportation includes two parts: logistics center to distribution center and distribution center to demand customers. Considering that customer demand points are widely distributed and exist in every corner of the city and customers’ needs are diverse, it is not appropriate to carry out advanced transformation when the subway transportation network starts. In this paper, the process from the distribution center to the customer demand point is not changed, but only the transportation section from the logistics park to the distribution center is considered.
There are two possible routes from the logistics park to the distribution center.
- (1)
- Logistics Parks—Subway Stations—Subway transit stations—Distribution Centers: The goods are sent from the logistics park in remote areas of the city, transported by truck to the nearest subway station from the logistics park, and then transported from the ground to the underground by subway using lifts and other transfer devices. After arriving at the corresponding subway station of the distribution center, the goods are transferred from the underground to the ground using lifts and other transfer devices and then transported by truck to the distribution center. The concrete process is shown in Figure 2.
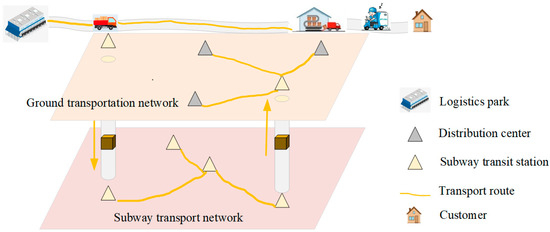 Figure 2. Urban metro freight distribution process diagram.
 - (2)
- Logistics Parks—Distribution Centers: In this case, the distribution center is close to the logistics park, and the use of the subway transportation system greatly increases the transportation time and cost, so the goods are sent directly from the logistics park and transported to the distribution center by ground.
3. Model Building
Using the subway as an urban logistics distribution transportation mode, it is necessary to select several subway stations as transit nodes. Firstly, a subway node importance evaluation model is constructed to evaluate the importance of subway stations, and subway stations occupying important positions in the network are selected as the standby collection of subway transfer centers. Then, from the perspective of managers and participants, with the goal of minimizing the total cost composed of transportation cost and transportation cost and maximizing customer satisfaction measured by transportation timeliness, the bilevel programming model for node location selection of urban subway freight network is constructed to determine the final subway transit station. The logical structure of the specific research method is shown in Figure 3.
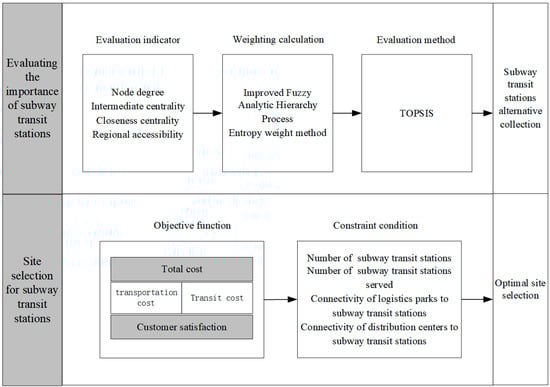
Figure 3.
Architecture diagram of the urban metro freight node siting model.
3.1. Node Importance Evaluation Model
3.1.1. Evaluating Indicator
- (1)
- Node degree
The node degree refers to the sum of all other subway stations directly connected to the subway station in the subway network, that is, the number of all subway line sections connected to the subway station. The higher the node degree, the more important the node is in the network. Whether two nodes in a network generate connections can be represented by a network adjacency matrix . The elements of the matrix can only take values of 0 or 1, and the degree of a node is defined as the sum of each row of elements in the adjacency matrix as follows:
- (2)
- Intermediate centrality
The centrality of the intermediate number represents the frequency at which the shortest path of any two subway stations in the network passes through subway stations. In the subway network, the greater the centrality of subway stations, the greater the frequency of passing through stations during subway operation. Therefore, the greater the flow and influence of subway stations. The total number of shortest paths from subway station m to subway station n is represented by , where the number of shortest paths passing through subway station i is represented by , and the centrality of the intermediate number of subway station i is represented by BCi.
- (3)
- Closeness centrality
Proximity centrality represents the reciprocal of the sum of the shortest path lengths from a subway station to all other subway stations. The greater the centrality of a node, the smaller the distance between the node and other nodes, and the more likely the node is to be at the center of the network. The shortest path between subway station i and subway station j is represented by , and the proximity centrality CCi of subway station i is represented as follows:
- (4)
- Regional accessibility
The importance of nodes is not only related to their network topology but also to the convenience of nodes in the service area, which affects the importance of nodes in the network. Regional accessibility refers to the convenience of subway stations to various distribution centers within the service area and is represented by the time road response function, where represents the transportation time from node i to node j, S is the length of the transportation path, and represents the time sensitivity factor, . Therefore, the regional accessibility expression of subway station i is as follows:
3.1.2. Determination of Indicator Weight
The above indicators have different dimensions and orders of magnitude, and their proportions and weights in the importance evaluation model of subway stations are different. In order to eliminate the dimensional differences between indicators, the improved fuzzy analytic hierarchy process and entropy weight method are used from a subjective perspective to comprehensively measure the importance of multiple indicators, and the indicators are comprehensively weighted.
- (1)
- Normalization of indicators
In order to eliminate the differences in different dimensions and orders of magnitude of the multi-dimensional indicators mentioned above, the heterogeneous indicators are measured and tempered to obtain the standard indicators as follows:
In the equation, is the normalized value, . is the initial indicator value that needs to be processed, and N is the number of nodes in the network.
- (2)
- Improved Fuzzy Analytic Hierarchy Process
Establish a priority relationship judgment matrix. Use the three-scale method to compare the above-determined evaluation indicators in pairs and obtain a complementary fuzzy judgment matrix as follows:
Establish a fuzzy consistent matrix and solving sort vector as follows:
The eigenvalue method is used to calculate the weight value. After solving the initial value of the sorting vector , in order to meet high accuracy requirements, the eigenvalue method is used for iterative accuracy calculation.
- (3)
- Entropy weight method
Establish the original evaluation matrix . The number of nodes is m, and a total of 4 evaluation indicators are selected in this article, so is an m × 4 dimensional matrix.
Calculate the proportion of the ith item’s indicator value under the jth indicator as follows:
Calculate the entropy value and indicator weight of the jth indicator as follows:
Information entropy of a set of data is , and if , then . Calculate the weights of each indicator based on information entropy , where is the complexity of information entropy.
- (4)
- Comprehensive weight of indicators
By improving the fuzzy analytic hierarchy process and entropy weight method, the subjective and objective weights of the calculated indicators were obtained. In order to reflect the weights of each indicator more comprehensively and effectively, the comprehensive weights of each indicator were calculated using the method of mathematical calculation for multi-dimensional indicators. The comprehensive weights of the i-th indicator were represented by , and the subjective and objective weight values of the i-th indicator were represented by and . The formula for calculating the comprehensive weight of each indicator is as follows:
3.1.3. Comprehensive Evaluation
The TOPSIS method evaluates the importance of targets by comparing their proximity to positive and negative ideal solutions and is a commonly used and effective method in systems engineering. Among all the objects that require decision making, if the target is closer to the positive ideal solution and further away from the negative ideal solution and the calculated evaluation index value is larger, then the target is considered to be more excellent. The operation process is as follows.
- (1)
- Construct a decision matrix. Assuming that there are m nodes in the subway network, a total of four evaluation indicators are selected in this article. The evaluation eigenvalues of the i-th node under the j-th indicator are represented by , and then a decision matrix P is constructed as follows:
- (2)
- Standardization and weighting of decision matrices. There is more than one indicator selected for the evaluation object, and there are dimensional differences between different indicators. Therefore, it is necessary to standardize the decision matrix as follows:By combining the comprehensive weight values of the indicators calculated in Section 3.1.2 and multiplying them with the standardized decision matrix, the decision matrix is weighted to obtain the weighted feature factor matrix R as follows:
- (3)
- Determine the positive and negative ideal solution scheme. Based on the weighted feature factor matrix R, determine the values of the positive and negative ideal solution scheme for the subway station and as follows:
- (4)
- Calculate the distance scale. Use the Kullback–Leibler distance in the distance model of relative entropy to calculate the distance between each subway station and the positive and negative ideal solution scheme as follows:
- (5)
- Calculate the proximity evaluation index between the evaluation object and the ideal solution scheme based on the distance scale between the calculated subway stations and the positive and negative ideal solutions. The calculation formula is as follows: the larger the value, the higher the importance of the subway station.
3.2. A Model for Selecting Subway Transit Stations
3.2.1. Research Hypothesis
To simplify the model research, sort out the relevant existing literature and combine it with practical constraints. The following assumptions are made when the model uses the subway for the transportation of goods due to multiple objective factors during transit:
- (1)
- The location and cargo volume of each distribution center are well-known, with the cargo volume having the maximum transportation capacity of the underground logistics system;
- (2)
- The existing subway stations meet the construction and renovation conditions for completing logistics transportation, that is, all subway stations can serve as transfer nodes, and the cargo handling capacity of the metro transit nodes can meet the daily demand for goods distributed via the metro;
- (3)
- When multiple subway transit stations serve a distribution center, it will increase unnecessary transportation costs. Therefore, a distribution center must and can only be covered by one subway transit node;
- (4)
- A certain amount of funds is required for the renovation of subway stations, but after the renovation is completed, the service life of subway stations can be long, and subway companies can require logistics transportation to pay certain fees to them. Using subway transportation can reduce environmental pollution, alleviate ground traffic pressure, and generate certain external benefits. Therefore, this article does not consider the cost of subway station renovation;
- (5)
- Assume that the underground transportation time is not affected by objective factors, such as vehicle failures and track failures; it is only related to the length of line transportation, subway transportation speed, and the number of transfers on the line.
3.2.2. Variable Representation
: 0–1 variable; if , node i is covered by node k, that is, physical park goods need to be transported to subway stations for transfer. If , node i was not covered by node k, meaning that goods in the logistics park could not be transported to subway stations for transfer.
: 0–1 variable; if , node j is covered by node k, that is, the demand for goods in the distribution center is handled by the subway station . If , node j was not covered by node k, meaning that the demand for goods in the distribution center could not be transferred by subway stations .
: 0–1 variable; if , it indicates that the subway station is selected as the subway transit node. If , it was stated that the subway station was not a subway transit station.
: 0–1 variable indicates whether the transportation path from node i to node j is delivered through nodes u and v. If , it represents a transportation path formed by subway stations and transportation between logistics park nodes and distribution centers ; otherwise, .
: the amount of goods that need to be transported by the logistics park and distribution center .
: The amount of goods that a single truck can transport;
: The distance between nodes i and j;
: The unit fuel consumption cost of trucks during ground transportation;
: Fixed cost for subway transfer station i;
: Electric energy consumption per unit weight of goods;
: Unit electricity price;
: Total mass of goods transported at node i;
: Customer satisfaction;
: Customer’s expected delivery time for the goods, i.e., expected delivery time;
: The latest delivery time that the customer can accept;
: Transportation time of nodes i and j.
3.2.3. Location Models
The node selection model of the urban subway freight network mainly focuses on the perspectives of logistics companies and customers, with the objective functions of minimizing cost and maximizing customer satisfaction. The upper-level planning is a subway transfer node location plan determined by the decision-making level of logistics companies and other enterprises to minimize cost. The total cost includes freight transportation costs and node transfer costs. The lower-level planning starts from the perspective of customers, who focus on whether the goods can be delivered in a timely manner, with the goal of maximizing customer satisfaction.
Upper-level model
- (1)
- Objective function
Constraint condition
Equation (24) is the calculation formula for the total cost of the upper-level model objective function, which mainly includes transportation costs and transfer costs. Equation (25) calculates the number of goods passing through subway transit station or station . Equation (26) indicates that goods can only be transferred from subway station when they serve the logistics park . Similarly, Equation (27) indicates that goods can only be transferred from subway station when they serve the distribution center . Equation (28) indicates that the construction quantity of subway transfer stations cannot exceed the upper limit, in which is the upper limit of the construction quantity of subway transfer stations. Equation (29) is controlled by 0 and 1 variables.
- (2)
- Lower-level model.
Objective function
Constraint condition
Equation (30) is the calculation formula for the lower-level objective function, with the goal of minimizing customer satisfaction. Equation (31) is the calculation formula for customer satisfaction of logistics park and distribution center . Equation (32) represents the transportation time between logistics park and distribution center . Equation (33) indicates that only when subway station is a transit station can it serve logistics park . Equation (34) indicates that only when subway station is a transit station can it serve distribution center ; Equation (35) indicates that each logistics park is covered by at least one subway transfer node. Equation (36) indicates that each distribution center is covered by at least one subway transfer station. Equation (37) is a 0–1 variable limit.
4. Case Analysis
Three areas, Jiangning District, Lishui District, and Gaochun District, were selected as the case study areas. Based on data, such as the location and distance of logistics parks, subway line stations, and SF Express business points within the three areas, a case study was conducted. The relevant location map is shown in Figure 4.
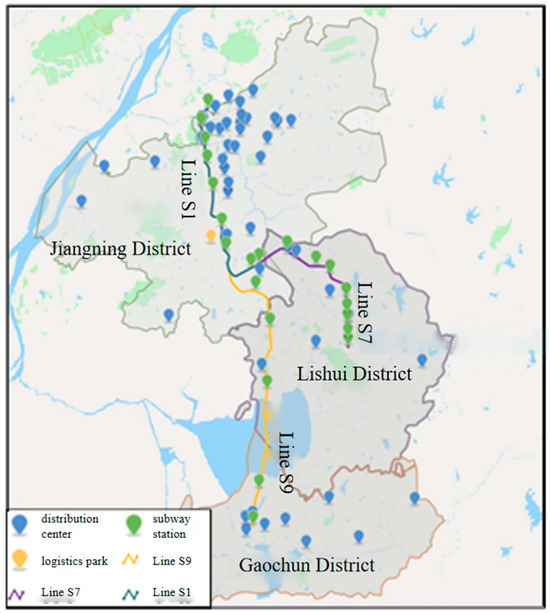
Figure 4.
Logistics node locations in the research area.
4.1. Basic Data
The basic data that need to be prepared for this example is as follows.
(1) Freight transportation distance and time. When using ground transportation, the transportation distance and time are related to the traffic congestion on the road. This article uses Baidu Maps to obtain the distance from the logistics park to various distribution centers. Assuming a ground transportation speed of 40 km/h, the transportation time when using ground transportation can be obtained by calculating the distance and speed. This value is used as the ideal delivery time for customers . After using the subway to transport goods, the total transportation time consists of ground transportation time and underground transportation time. The ground transportation time needs to be determined based on the specific situation from the logistics park to the subway station and from the subway station to the distribution center. Due to the principle of nearby distribution adopted by the logistics park, goods are transported to Xiangyu Road South Station for subway transportation. Therefore, the distance from the logistics park to the subway station is queried by Baidu Maps as 4.1 km. The distance from the subway station to the distribution center needs to be determined based on the specific location of the subway transfer center. The distance and time of underground transportation are determined by the location of subway stations, and the distance data between each subway station on the Nanjing Metro official website are obtained to determine the length of underground transportation distance. Due to the use of the subway for freight transportation, which uses passenger and freight lines and rear-coupled carriages for transportation, assuming a subway transportation speed of 60 km/h, the underground transportation time can be calculated based on distance and speed.
(2) Cargo volume. Assume the cargo volume and generate the cargo volume of 48 distribution centers based on a positive distribution.
(3) The latest acceptable delivery time for the customer’s goods . The customer has an estimated arrival time for ground transportation during the original ground transportation, which is used as the expected delivery time for subway transportation in this article. At the same time, the customer has a psychologically acceptable delay time for express delivery, which is recorded as 0.5 h in this article. Therefore, the maximum transportation time can be calculated as .
(4) Unit transportation cost. The unit mileage transportation cost of ground transportation trucks is set at RMB 1.11, and the unit mileage traction transportation cost of subway transportation goods is RMB 0.236. The electricity consumption per unit weight of goods transported between the ground and the ground through transportation equipment is kilowatt·hours.
(5) Constraint parameter values. Twenty-one subway stations within the study area can serve as transfer nodes, and there are forty-eight distribution centers within the area. Therefore, considering that subway stations are used for urban freight transportation in the initial stage, the subway transportation network should not only meet transportation needs but the number of node renovations should also not be too large. The number of subway transfer centers determined in this article is four.
(6) This article uses a two-level genetic algorithm to solve the bilevel programming model, and the algorithm parameters are set in Table 1.

Table 1.
Genetic algorithm parameter settings.
4.2. Result Solving and Analysis
4.2.1. Evaluation Results of Node Importance
Calculate the comprehensive weight of evaluation indicators as follows: .
According to the TOPSIS evaluation method introduced in Section 3, a comprehensive evaluation of subway stations is conducted. The characteristic values of each subway station’s indicators are standardized and weighted, and the positive and negative ideal solution evaluation scheme is determined as follows:
Calculate the proximity of each subway station to the positive and negative ideal solutions and rank them based on their scores, as shown in Table 2. Select the top ten subway stations as alternative subway transit stations, namely, Jiyin Avenue, Qunli, Shiqiu, Zhengfang Middle Road, Airport New City Lishui, Wolonghu, Tongshan, Mingjue, Hohai University Focheng West Road, and Gaochun.
Table 2.
Evaluation indicators for each station in the study area.
4.2.2. Analysis of Node Location Results
Compare the solution results of the simulated annealing algorithm, ant colony algorithm, and single-layer genetic algorithm with the solution results of the proposed double-layer genetic algorithm in this paper. The iterative process and final solution results are shown in Figure 5 and Table 3, respectively.
Figure 5.
The iterative process of different solving algorithms.
Table 3.
Performance comparison of different solving algorithms.
In Figure 5 and Table 3, it can be seen that the objective function values obtained by solving the urban freight network node selection bilevel planning model constructed in this paper using a double-layer genetic algorithm are more in line with the objectives of logistics network operation. At the same time, compared to the ant colony algorithm, simulated annealing algorithm, and single-layer genetic algorithm, the double-layer genetic algorithm can converge faster within a limited number of iterations and output the optimal solution. This reflects the superiority of the two-level genetic algorithm used in this article in solving bilevel programming models.
Using a double-layer genetic algorithm to solve the double-layer programming model for node location selection in the subway freight network, the optimal node locations are Focheng West Road, Zhengfang Middle Road, Qunli, and Gaochun at Hehai University. The distribution centers they serve are shown in Table 4. In this case, the total cost of the solution is RMB 2636, and customer satisfaction is RMB 40.21.
Table 4.
Distribution center allocation results after optimization.
After analyzing the optimized transportation plan, as shown in Table 5, with a 16.23% reduction in transportation efficiency, the transportation cost was reduced by 8.73%. The original plan had a total ground transportation distance of 1753.3 km, while the subway transportation of goods had a total ground transportation distance of 826.4 km, a reduction of 52.87%. That is to say, after using the optimized plan, 52.87% of the ground transportation distance was transferred to the underground, which is effective in alleviating urban traffic congestion and environmental pollution.
Table 5.
Comparison of effects before and after optimization.
The number of subway station renovations has a significant impact on the total network cost and customer satisfaction. The more subway renovations there are, the greater the financial support required. At the same time, more ground transportation routes are transferred to the underground, saving more transportation costs. The changes in network cost, customer satisfaction, and ground transportation distance compared to the number of different nodes in the renovation are shown in Table 6:
Table 6.
Comparison of different numbers of transfer stations.
In Table 6, it can be seen that with the increase in the number of subway station renovations, customer satisfaction is constantly increasing. This is because when transporting through the newly added subway transit stations, some transportation routes have been changed, reducing the distance and time of the transportation of goods. The total cost first decreases and then increases. This is because when the transportation cost saved by the newly added subway station is greater than the cost of the newly added and renovated subway station, the total network cost will decrease. Conversely, when the transportation cost saved by the newly added subway station is less than the cost of the newly added and renovated subway station, the total network cost will increase.
5. Conclusions and Outlook
5.1. Research Conclusions
By utilizing the existing subway networks, urban metro freight systems can effectively manage transportation costs while ensuring service quality, improving operational efficiency, and reducing energy consumption to achieve sustainable development. Concrete conclusions are as follows:
- (1)
- Considering factors such as the shape of the subway network and the location of subway stations, a node importance evaluation model was constructed to evaluate the importance of each subway station. Taking the Nanjing Metro Line Network as an example, the importance of each subway station was analyzed. The results showed that Jiyin Avenue, Qunli, Shiqiu, Zhengfang Middle Road, Airport New City Lishui, Wolonghu, Tongshan, Mingjue, Hohai University Focheng West Road, and Gaochun were alternative subway transfer stations.
- (2)
- After analyzing the feasibility of using subways for urban freight transportation, this article analyzes the factors that need to be considered in network structure optimization from the perspectives of managers and participants and constructs an optimization model for node selection of an urban subway freight network with the minimum total cost and the maximum customer satisfaction to study the problem of selecting transit stations for urban subways. To solve the optimal location scheme of the bilevel programming model, a bilevel genetic algorithm was designed based on the characteristics of different levels of the location model.
- (3)
- Jiangning District, Lishui District, and Gaochun District in Nanjing City were selected as the case study areas. Based on data such as the location and distance of logistics parks, subway line stations, and SF Express operating points in the three areas, a case study was conducted to obtain the optimal location plan for subway transfer nodes in the study area. The results showed that when Hohai University Focheng West Road, Zhengfang Middle Road, Qunli, and Gaochun were selected as subway transfer nodes, there was a significant reduction in ground transportation distance and cost.
5.2. Outlook
Further research can be carried out based on the following aspects:
- (1)
- In the feasibility analysis of urban subway freight transportation, and only from the perspective of subway distribution time, we did not consider the quantity range of goods suitable for transit through the subway. Too few goods may not be enough cost, and too many goods may affect passenger flow.
- (2)
- In the node importance evaluation model, the statistical indicators of nodes are only calculated according to the network shape. In future research, the complex network theory can be further studied to evaluate the importance of each subway station in the network more accurately.
- (3)
- In the node location model of the subway freight network, only the number of subway transfer stations is limited, and the actual capacity of nodes to handle goods is not considered. Future research can be based on the actual nodes to calculate the node cargo handling capacity so that the model is more in line with reality.
Author Contributions
Conceptualization, H.Y.; Investigation, H.H.; Resources, Y.S.; Writing—original draft, S.Z.; Writing—review & editing, C.L.; Supervision, C.Z. All authors have read and agreed to the published version of the manuscript.
Funding
This research received no external funding.
Institutional Review Board Statement
Not applicable.
Informed Consent Statement
Not applicable.
Data Availability Statement
Data is contained within the article.
Acknowledgments
The reviewers’ valuable advice and guidance are greatly appreciated, providing significant help and inspiration to the writing process.
Conflicts of Interest
Author Yang Shen was employed by the company Nanjing Communications Group. The remaining authors declare that the research was conducted in the absence of any commercial or financial relationships that could be construed as a potential conflict of interest.
References
- Stein, D. CargoCap—Innovative Freight Transportation through Pipes; Bauverlag GmbH: Gütersloh, Germany, 2003; Volume 69, pp. S86–S89. [Google Scholar]
- Guo, D.; Chen, Y.; Yang, J.; Tan, Y.H.; Zhang, C.; Chen, Z. Planning and application of underground logistics systems in new cities and districts in China. Tunn. Undergr. Space Technol. 2021, 113, 103947. [Google Scholar] [CrossRef]
- Kikuta, J.; Ito, T.; Tomiyama, I.; Yamamoto, S.; Yamada, T. New subway-integrated city logistics system. In Proceedings of the Seventh International Conference on City Logistics, Mallorca, Spain, 7–9 June 2011; pp. 476–489. [Google Scholar] [CrossRef]
- Chen, Z.Y. Feasibility Study on Urban Distribution in Nanjing Metro. Master’s Thesis, Nanjing University, Nanjing, China, 2017. [Google Scholar]
- Pan, X.; Dong, J.; Fu, G.; Zhang, G. Study on Comprehensive Evaluation Method of Underground Logistics System Feasibility Based on ANP-TOPSIS Method. Chin. J. Undergr. Space Eng. 2019, 15, 684–690. [Google Scholar]
- Villa, R. A metro-based system as sustainable alternative for urban logistics in the era of e-commerce. Sustainability 2021, 13, 4479. [Google Scholar] [CrossRef]
- James, K.; Marin, M. Innovative interior designs for urban freight distribution using light rail systems. Urban Rail Transit 2017, 3, 238–254. [Google Scholar]
- Wang, X.; Zhao, H. Discussion on Urban Underground Logistics System Based on Metro. Chin. J. Undergr. Space Eng. 2019, 15, 1273–1282. [Google Scholar]
- Ye, Y.; Guo, J.; Yan, L. A Metro Freight Plan for Mixed Passenger and Freight Transportation. J. Adv. Transp. 2022, 2022, 6602387. [Google Scholar] [CrossRef]
- Ren, M.; Fan, Z.; Wu, J.; Zhou, L.; Du, Z. Design and optimization of underground logistics transportation networks. IEEE Access 2019, 7, 83384. [Google Scholar] [CrossRef]
- He, M.; Sun, L.; Zeng, X.; Liu, W.; Tao, S. Node layout plans for urban underground logistics systems based on heuristic bat algorithm. Comput. Commun. 2020, 154, 465–480. [Google Scholar] [CrossRef]
- Yazdani, M.; Chatterjee, P.; Pamucar, D.; Chakraborty, S. Development of an integrated decision-making model for location selection of logistics centers in the Spanish autonomous communities. Expert Syst. Appl. 2020, 148, 113208. [Google Scholar] [CrossRef]
- Zhou, Y. Research and Application of Network Layout Planning Model for Urban Underground Logistics System. Master’s Thesis, North China Electric Power University, Beijing, China, 2019. [Google Scholar]
- Zhou, F.T.; Zhou, G.H.; Zhang, J. Research on the location of transfer points in urban distribution systems based on subway networks. Railw. Trans. 2019, 41, 16–25. [Google Scholar]
- Zheng, C.; Zhao, X.; Shen, J. Research on Location Optimization of Metro-Based Underground Logistics System with Voronoi Diagram. IEEE Access 2020, 8, 34407–34417. [Google Scholar] [CrossRef]
- Zhang, H.; Zhang, J.; Zheng, C.; Wang, B.; Chen, J. Node location of bi-level urban metro-based ground-underground logistics distribution. Multimodal Transp. 2024, 3, 100119. [Google Scholar] [CrossRef]
- Dong, J.; Hu, W.; Yan, S.; Ren, R.; Zhao, X. Network Planning Method for Capacitated Metro-Based Underground Logistics System. Adv. Civ. Eng. 2018, 2018, 6958086. [Google Scholar] [CrossRef]
- Ren, R.; Hu, W.; Dong, J.; Chen, Z. Optimization of Urban Metro-based Underground Logistics System Network with Hub-and-Spoke Layout. J. Syst. Simul. 2021, 33, 1699–1712. [Google Scholar]
- Mou, N.; Sun, S.; Yang, T.; Wang, Z.; Zheng, Y.; Chen, J.; Zhang, L. Assessment of the Resilience of a Complex Network for Crude Oil Transportation on the Maritime Silk Road. IEEE Access 2020, 8, 181311–181325. [Google Scholar] [CrossRef]
- Jia, G.L.; Ma, R.G.; Hu, Z.H. Urban Transit Network Properties Evaluation and Optimization Based on Complex Network Theory. Sustainability 2019, 11, 2007. [Google Scholar] [CrossRef]
- Sun, G.X. Robustness Analysis of an Urban Public Traffic Network Based on a Multi-Subnet Composite Complex Network Model. Entropy 2023, 25, 1377. [Google Scholar] [CrossRef]
- Hassan, R.; Yosri, A.; Ezzeldin, M.; El-Dakhakhni, W. Robustness Quantification of Transit Infrastructure under Systemic Risks: A Hybrid Network-Analytics Approach for Resilience Planning. J. Transp. Eng. Part A Syst. 2022, 148, 04022089. [Google Scholar] [CrossRef]
- Hu, Z.Q.; Shao, F.J.; Sun, R.C. A New Perspective on Traffic Flow Prediction: A Graph Spatial-Temporal Network with Complex Network Information. Electronics 2022, 11, 2432. [Google Scholar] [CrossRef]
- Bao, J.; Chen, W.; Shui, Y.S.; Xiang, Z.T. Complexity Analysis of Traffic Time Series Based on Multifractality and Complex Network. In Proceedings of the 2017 4th International Conference on Transportation Information and Safety (ICTIS), Banff, AB, Canada, 8–10 August 2017; pp. 257–263. [Google Scholar]
- Qiang, T.; Zhao, M.; Pei, Y. An Analysis of Characteristics of Complex Network and Robustness in Harbin Multi-mode Traffic Network. J. Transp. Inf. Saf. 2019, 37, 65–71. [Google Scholar]
- Bontorin, S.; Cencetti, G.; Gallotti, R.; Lepri, B.; De Domenico, M. Emergence of complex network topologies from flow-weighted optimization of network efficiency. arXiv 2023, arXiv:2301.08661. [Google Scholar]
- Yuan, P.; Mo, Y.; Gao, J.; Li, N.; Han, S. Critical hub identification method for freight transportation networks from a capacity reliability perspective. J. Xiamen Univ. Nat. Sci. 2023, 62, 709–718. [Google Scholar]
- Zhang, L.; Lu, J.; Fu, B.B.; Li, S.B. A cascading failures model of weighted bus transit route network under route failure perspective considering link prediction effect. Phys. A Stat. Mech. Its Appl. 2019, 523, 1315–1330. [Google Scholar] [CrossRef]
- Zhao, L.; Li, H.; Li, M.; Sun, Y.; Hu, Q.; Mao, S.; Xue, J. Location selection of intra-city distribution hubs in the metro-integrated logistics system. Tunn. Undergr. Space Technol. 2018, 80, 246–256. [Google Scholar] [CrossRef]
- Shi, Z. A Dissertation Submitted to Southeast University for the Academic Degree of Doctor of Engineering. Ph.D. Thesis, Southeast University, Nanjing, China, 2022. [Google Scholar]

Disclaimer/Publisher’s Note: The statements, opinions and data contained in all publications are solely those of the individual author(s) and contributor(s) and not of MDPI and/or the editor(s). MDPI and/or the editor(s) disclaim responsibility for any injury to people or property resulting from any ideas, methods, instructions or products referred to in the content. |
© 2024 by the authors. Licensee MDPI, Basel, Switzerland. This article is an open access article distributed under the terms and conditions of the Creative Commons Attribution (CC BY) license (https://creativecommons.org/licenses/by/4.0/).