Article

Ash Properties and Environmental Impact of Coal and Its Blend with Patent Fuel for Climate Sustainability

by
Marija Trkmić
1,*,
Lidija Ćurković
2,
Danijela Ašperger
3,*,
Magdalena Ujević Bošnjak
4,
Ivana Vinković Vrček
5 and
Sanja Matečić Mušanić
6
1
HEP-Proizvodnja, Central Laboratory for Chemical Technology, Zagorska 1, 10000 Zagreb, Croatia
2
University of Zagreb, Faculty Mechanical Engineering and Naval Architecture, Ivana Lucica 1, 10000 Zagreb, Croatia
3
University of Zagreb, Faculty of Chemical Engineering and Technology, Marulićev trg 19, 10000 Zagreb, Croatia
4
Croatian National Institute of Public Health, Rockfellerova 7, 10000 Zagreb, Croatia
5
The Institute for Medical Research and Occupational Health, Ksaverska cesta 2, 10000 Zagreb, Croatia
6
ZGI d.o.o., Vrandučka ulica 5 A, 10000 Zagreb, Croatia
*
Authors to whom correspondence should be addressed.
Sustainability 2024, 16(11), 4413; https://doi.org/10.3390/su16114413
Submission received: 22 March 2024 / Revised: 30 April 2024 / Accepted: 15 May 2024 / Published: 23 May 2024
(This article belongs to the Special Issue High-Value and Resource-Based Utilization of Coal-Based Solid Waste)

Abstract

:
Fossil fuels are still widely used today, and exploring more sustainable ways of using coal is crucial. One promising approach is to develop a patented fuel with reduced harmful gas emissions during combustion. This study aims to investigate the properties of the ash produced by burning steam coal mixed with various ratios of patent fuel. The combustion process was carried out using a standard solid fuel boiler with a power output of 70 kW. The ash samples were analyzed using various analytical methods, and ash leaching tests were conducted. The study found that adding patent fuel to coal affects combustion and ash composition. Determining the thermal stability of ash samples showed that adding patent fuel to coal results in decomposition starting earlier and in stronger combustion. The ash produced by patent fuel–coal mixtures contains lower concentrations of Ba, Cr, Ga, Li, Mn, V, and Zn than pure coal combustion. Leaching tests showed that coal ash leachates had higher concentrations of environmental pollutants, such as As, Cd, Co, Mn, Mo, Sb, and U, than patent fuel leachates. Adding patent fuel to coal affects combustion, ash properties, emissions, and disposal. Understanding these implications can help to develop sustainable coal usage and reduce environmental impact.

1. Introduction

Fossil fuels have been the primary source of energy for many years. Coal remains the most significant energy source for electricity generation, steelmaking, and cement production, playing a significant role in the global economy [1]. In 2022, the demand for coal reached its highest level ever, with over 8 billion tons of coal being mined in more than 40 countries annually. Currently, coal accounts for nearly 40% of the world’s electricity generation. It has become the preferred source for power generation due to its stability, reliability, low cost, easy logistics, and wide availability, making it a highly secure energy source [2].
However, coal-fired power plants are responsible for approximately 80% of the energy sector’s CO2 emissions. Large city-scale coal-fired combined heat and power (CHP) plants are the biggest contributors to greenhouse gas emissions [3]. While eliminating coal from the energy consumption mix is a viable solution for achieving environmental sustainability, it may also lead to a decline in the economic growth and development of many countries globally [4]. Therefore, the goal is to find a feasible way to reduce the contributions from both environmental and economic perspectives.
The biggest challenges of the 21st century are fighting climate change and achieving a clean and just energy transition, and coal is one of the sectors that needs to be prioritized for energy transition. These are also the main priorities in Europe’s new green, sustainable growth strategy, known as the “European Green Deal” [5]. The EU has set the targets of cutting CO2 emissions by at least 55% by 2030 and becoming climate-neutral by 2050, and substantial efforts will be required to achieve these international climate goals. While coal is still a primary fuel in the European energy mix, transitioning to cleaner forms of energy and innovative technologies, such as carbon capture and storage, is crucial in order to meet the EU’s commitments [6].
The world is currently facing an energy crisis that began in 2021 due to the rapid economic recovery after the pandemic, which was further intensified by Russia’s invasion of Ukraine in February 2022. Additionally, unexpected weather conditions led to lower hydro and nuclear power generation, which caused a surge in coal usage [7]. As a result, energy efficiency has become a crucial factor in energy management. Natural gas prices have surged to record levels, leading to an increase in electricity prices in some markets. Furthermore, oil prices are at their highest point since 2008 [8]. These high energy prices have also resulted in a sharp rise in inflation. Households are turning to coal as a source of heat, and high energy and gas prices have pushed many families into poverty. The situation has forced some factories to cut production or even shut down, and economic growth has slowed to the extent that some countries are on the verge of a severe recession.
Finding alternative raw materials and techniques that can reduce the use of natural aggregates and facilitate the move towards cleaner forms of energy is becoming increasingly important. Coal ash and desulfurization gypsum are waste products of coal mines and coal-fired power plants. One possible solution is to use bottom ash and fly ash as a partial or complete substitute for natural aggregates [9,10]. These materials are obtained at a minimal cost and are byproducts of coal processing, which is a more sustainable alternative to the resource-intensive processes involved in mining and processing natural aggregates. Studies have shown that these materials have significant potential in building and construction activities. Utilizing these waste products can lead to comprehensive resource utilization, reduce dependence on natural resources, and address the waste disposal problem.
One of the main reasons for the decreasing interest in coal usage in thermal power plants is its unfavorable environmental impact. The negative environmental effects of energy plants result from gaseous and particulate emissions, wastewater emissions, and liquid and solid waste production [11,12,13,14]. Nowadays, there are numerous technological possibilities for using coal in the industry in an environmentally acceptable way, including the choice of coal; temperature control in the combustion process to decrease volatile inorganic compounds emissions; the removal of pollutants before they enter and during the process; and the implementation of different working conditions during combustion to change the combustion products’ composition [15]. It is important to note that there is growing concern about safety conditions during coal mining and usage [16]. Important issues include paying attention to the characteristics of spontaneous coal combustion in order to prevent disasters that can harm production and usage safety and lead to significant losses [17].
Numerous papers and studies have revealed global problems connected to fly ash manipulation and disposal. It has been estimated that the world’s ash production is more than 550 Mt per year, and only a small portion of this is used for further commercial applications, while the majority ends up in waste disposal sites [18].
Many authors have described various applications of analytic instruments to determine ash characteristics from coal combustion, one of the most complex areas in the research of natural rocks and anthropogenic products. They highlighted the importance of understanding the behaviour of chemical species produced during coal combustion with regard to their impact on the environment, emissions, and transport. The complicated composition, small size, and variable morphology of particles cause problems in the identification, characterization, and data interpretation of ash [19,20,21,22,23,24,25,26,27,28].
J. Marrero et al. [29] highlighted that the determination of metals in ashes is a research area of permanent interest and is usually the first step in the subsequent evaluation of the associated environmental and biological risks. In their work, they have used different analytical approaches and instrumental techniques to provide morphological information, enrichment factors, and element concentrations regarding fly ashes.
N. Koukouzas et al. emphasised that the physical and chemical characteristics of fly ash, combined with the operational parameters of the power plant and the disposal environments in which the ashes are placed, control the susceptibility of these wastes to leaching and determine the potential for the contamination of groundwater aquifers [30].
An overview of the leaching behavior of elements from coal combustion fly ash provides insight into the factors that determine the leachability of elements and addresses the causes of their mobility. M. Izquierdo and X. Querol [31] found that the way in which a particular element occurs in the parent coal plays a crucial role in the leaching behavior of the fly ash. Additionally, the mobility of most elements in the ash is highly sensitive to pH.
According to N. Moreno et al. [32], leaching tests are very important for determining coal ash usage applications and their limitations because of the relatively high levels of leachable trace elements. Their study revealed that elements such as As, B, Ba, Cr, Mo, Se, and V, which have environmental significance, showed the highest mobility during the leaching tests.
The present study aims to investigate the influence of adding a patent fuel to steam coal on the properties of the resulting ash after combustion. Therefore, ash characterization and leaching tests were conducted utilizing various analytical techniques to determine the ashes’ chemical and phase compositions in order to identify potential applications.
What made this study unique was the use of a patent fuel in addition to coal and the comparison between ashes after the combustion of pure steam coal and mixtures and different ratios of coal and patent fuel.

2. Materials and Methods

2.1. Solid Fuels

Steam coal and patent fuel were used for the purpose of this study. The patent fuel was HYDROGEN INDUSTRIAL (HI fuel) (International Application Number: PCT/HR2010/000031; International Publication Number: WO 2012/032363 A1). According to the published literature, the gross calorific value of this HI fuel is about 95.69 MJ/kg [33,34].
The proximate and ultimate analyses of used coal, as well as its calorific value, are presented in Table 1. All results are on an as-received basis.
The combustion experiments were carried out at the 70 kW boiler at the Faculty of Mechanical Engineering and Naval Architecture, University of Zagreb, Croatia. Details of combustion processes are described by Dobrovic et al. [35].

2.2. Ash Samples

Table 2 presents the ash samples obtained during the experiment. However, the analysis of the operating parameters of the experimental boiler indicated that the best, most consistent, and representative results were obtained on the second day of the test. Therefore, more representative ash samples were collected on that day. Based on this, only three ash samples from the bottom of the combustion chamber were selected (as described in Table 3), which best represent the combustion products of pure coal, along with two coal mixtures with different proportions of patent fuel for complete ash characterization and leaching procedures. These samples are marked in Table 2 as 1, 5, and 6.
Other coal and patent fuel ratios did not show significant improvement during combustion, and those ash samples would not contribute to any conclusions about the impact of the addition of patent fuel to coal combustion and their residues. The number of fly ash samples from dust filters was insufficient to carry out all the characterization and leaching tests.
The procedure of preparing the ash analytical samples included grinding using the Cross-Beater Mill, Type SK 100R, dividing by sample divider PT 100, and sieving to a particle size less than 212 µm, with the AS 200Basic, DIN ISO 212 Micron Sieve. The ash samples for the characterization and leaching tests were additionally sieved to a particle size less than 50 µm using the RetschAS 200Basic and DIN ISO 50 Micron Sieve, Retsch, Verder Scientific, Haan, Germany.

2.3. Characterization of Ash Samples

Elemental CHNS analysis of ash samples was carried out using a LECO TrueSpec CHNS analyzer. The calorific values of the ash samples were obtained using the IKA C2000 calorimeter in an oxygen atmosphere.
The compositions of the ash samples were determined using an energy-dispersive X-ray fluorescence spectrometer (EDXRF): Oxford ED2000. Samples were prepared by pelletizing at 15 tonnes of pressure for 30 s with a P/N 25011, Specac manual hydraulic press, with Hoechst wax C micro powder (Merck) as a binder. The method was developed according to the standard ASTM D 4326 [36]. The calibration, validation, and estimation of measurement uncertainty were described in our earlier work [37].
For the determination of trace elements, a microwave-assisted acid digestion (MW-AD) was applied, followed by inductively coupled plasma-optical emission spectrometry (ICP-OES) [38,39]. A mixture of 9 mL HCl + 3 mL HNO3+ 3 mL HF was employed in the MW-AD, after which 25 mL 4% H3BO3 was added in order to remove HF from the reaction mixture [40,41,42,43,44]. The microwave digestion was perfomed using a CEM MARSX oven with XP1500 vessels. An ICP-OES measurement was performed using a Thermo Electron Corporation ”IRIS Intrepid II“ XSP, Duo, Thermo Elemental. The mineralogical composition of the ash samples was obtained by XRD [45] using a Shimadzu XRD 600 spectrometer. The thermal stability of samples was determined by thermogravimetric (TG) and differential thermal analysis (DTA) measurements that were carried out simultaneously using a TA Instruments simultaneous TG-DTA apparatus, model SDT 2960.

2.4. Leaching Tests in Deionized Water and Acid Rain

Leaching tests were carried out by mixing the ash samples with ultra-pure water and acid rain as leachants for periods of 7 days, one month, and three months at room temperature (25 °C) [46,47,48,49]. All leaching tests were performed in triplicate.
A portion of the 0.5 g ash samples were placed in a clean plastic container, which was filled with 50 mL of leachate. After the planned leaching time, the liquid phase (leachate) was separated from the solid (ash sample) by filtration through 0.45 μm filters. After a leaching period of 3 months, the pH value of each filtrate and the conductivity of the filtrates were measured. The concentration of Li, Be, Na, Mg, Al, K, Ca, V, Cr, Mn, Fe, Co, Ni Cu, Zn, As, Se, Rb, Se, Mo, Ag, Cd, Sb, Ba, Ce, Tl, Pb, Bi, and U ions in leachates was determined by an inductively coupled plasma mass spectrometry (ICP-MS) using an Agilent Technologies 7500cx ICP-MS system (Agilent, Waldbronn, Germany). The instrument was equipped with an integrated auto-sampler, a Scott Quartz spray chamber, and a MicroMist nebulizer (Glass Expansion, Australia). Verification of the accuracy and precision of the proposed method was performed using the following Standard Reference Materials (SRMs): SRM 1643e (Trace Elements in Water) from the National Institute of Standards and Technology (NIST) and SLRS-5 (River Water Reference Material for Trace Metals) from the National Research Council Canada (NRCC).
The obtained data were reported as averages ± SD. Validation data are shown in Table 4.

3. Results and Discussion

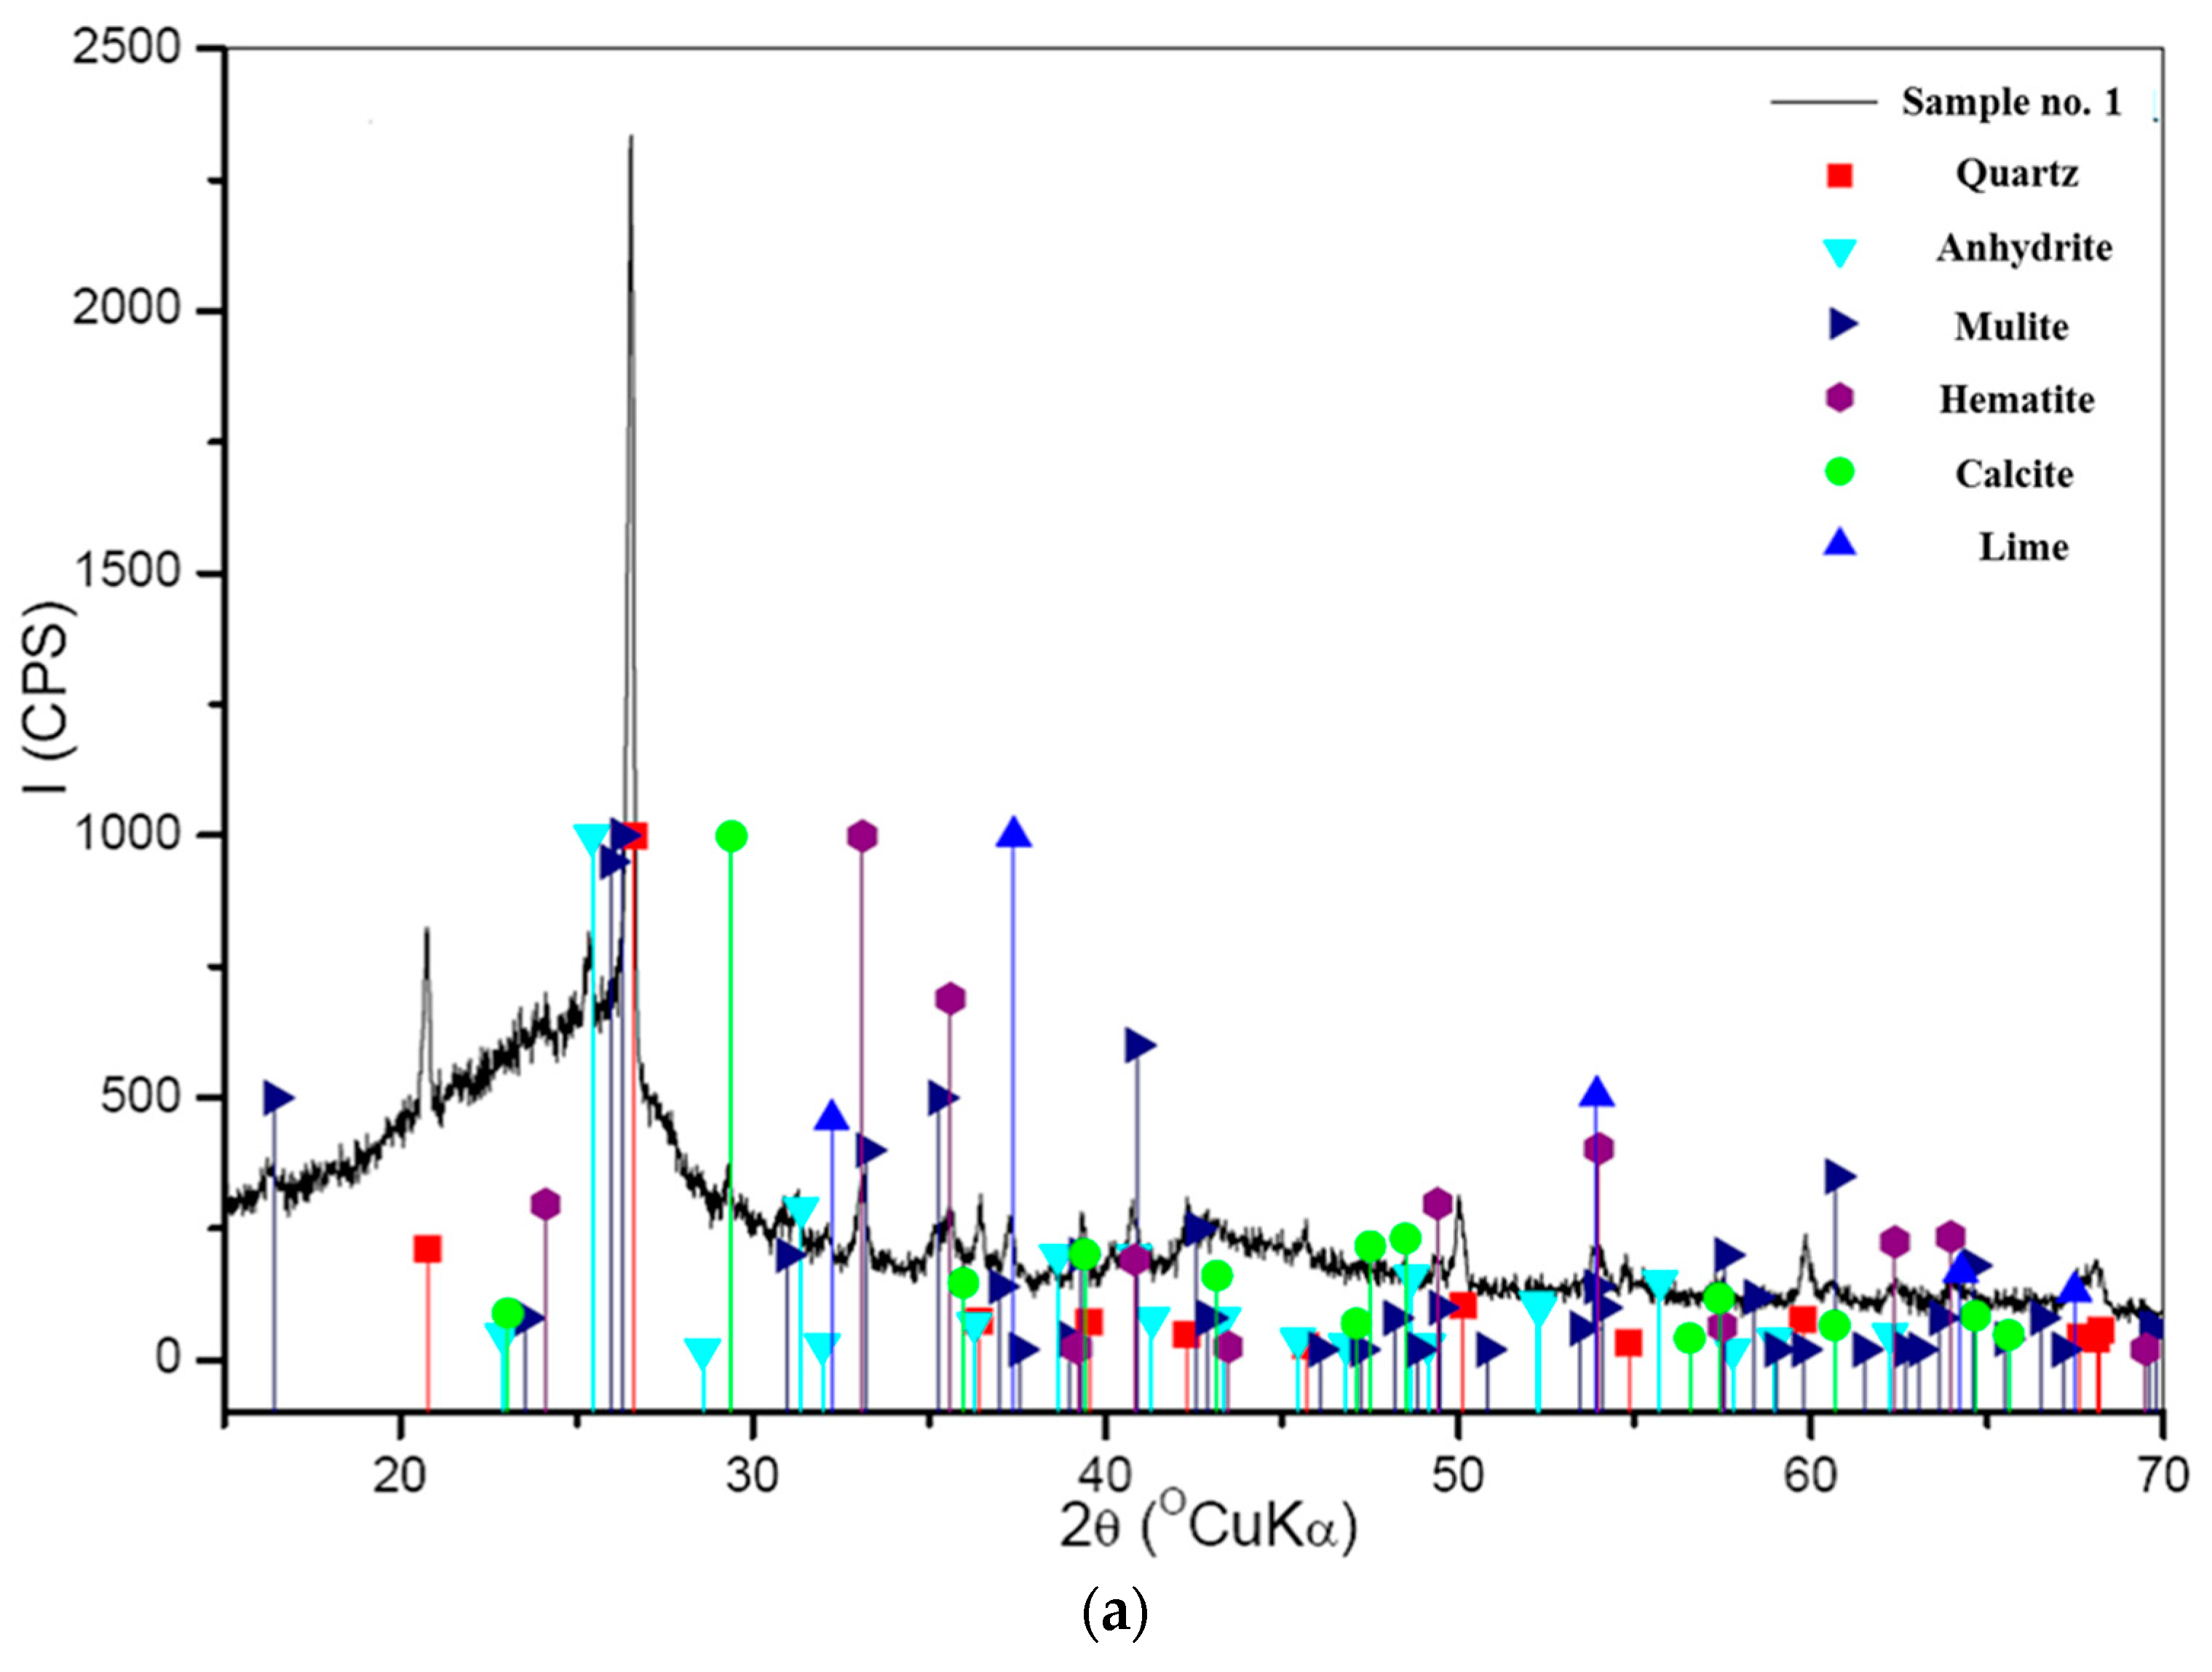
3.1. Chemical and Mineralogical Characterization

The elemental analysis results and calorific values provide information about the boiler’s combustion efficiency. These results are given in Table 5.
Elemental analysis (Table 5) showed that ash samples obtained from the combustion of a mixture of coal and patent fuel (samples 2 and 3) have higher sulphur content, indicating the patent fuel’s ability to attach sulphur from combustion flue gases to ash. The high gross calorific values of all samples indicate that the combustion in the boiler was uncompleted.
The content of the main and minor elements in the ash samples determined by EDXRF is presented in Table 6.
The greatest difference in the composition of these ash samples is in the CaO content, which is considerably higher in ash samples from the combustion of mixtures than in ash samples from pure steam coal. The concentration of CaO is associated with calcium, which exists in the composition of patent fuel.
The contents of trace elements were determined with inductively coupled plasma-optical emission spectrometry (ICP-OES). Table 7 represents the results obtained for trace element concentrations in ash samples.
The highest measured concentrations in all ash samples were for Ba, V, and Sr. The lowest concentration was the Se content. The concentrations of As and Tl were below the quantification limit of the method used. After comparing the trace element content in the pure coal ash (sample 1) with ash samples obtained from mixtures of coal and patent fuel (samples 2 and 3), it was found that there were significant differences in the levels of Ba, Cr, Cu, Ga, Li, Mn, Ni, Pb, V, and Zn. In general, the levels of all trace elements were lower in the ash from mixtures than in the pure coal ash, where the highest differences were observed for Ba, Cr, Ga, Li, Mn, V, and Zn.
The phase composition of the investigated samples was determined by qualitative X-ray diffraction (XRD). Many mineral phases were identified: quartz, cristobalite, hematite, rutile, and portlandite. The XRD patterns of ash samples from the combustion of a mixture of coal and patent fuel show higher diffraction maximum intensities for calcite, anhydrite, and lime, which is in accordance with earlier determinations of a higher calcium content in ash samples of mixtures with patent fuel (Table 5). The identified mineral phases are presented in Figure 1.
Figure 1 clearly shows that the contents of quartz (SiO2) and anhydrite (CaSO4) were very similar in all samples. Different relative intensities of diffraction maximums were observed for the other mineral phases, especially calcite (CaCO3), which showed the most significant difference between all XRD patterns.

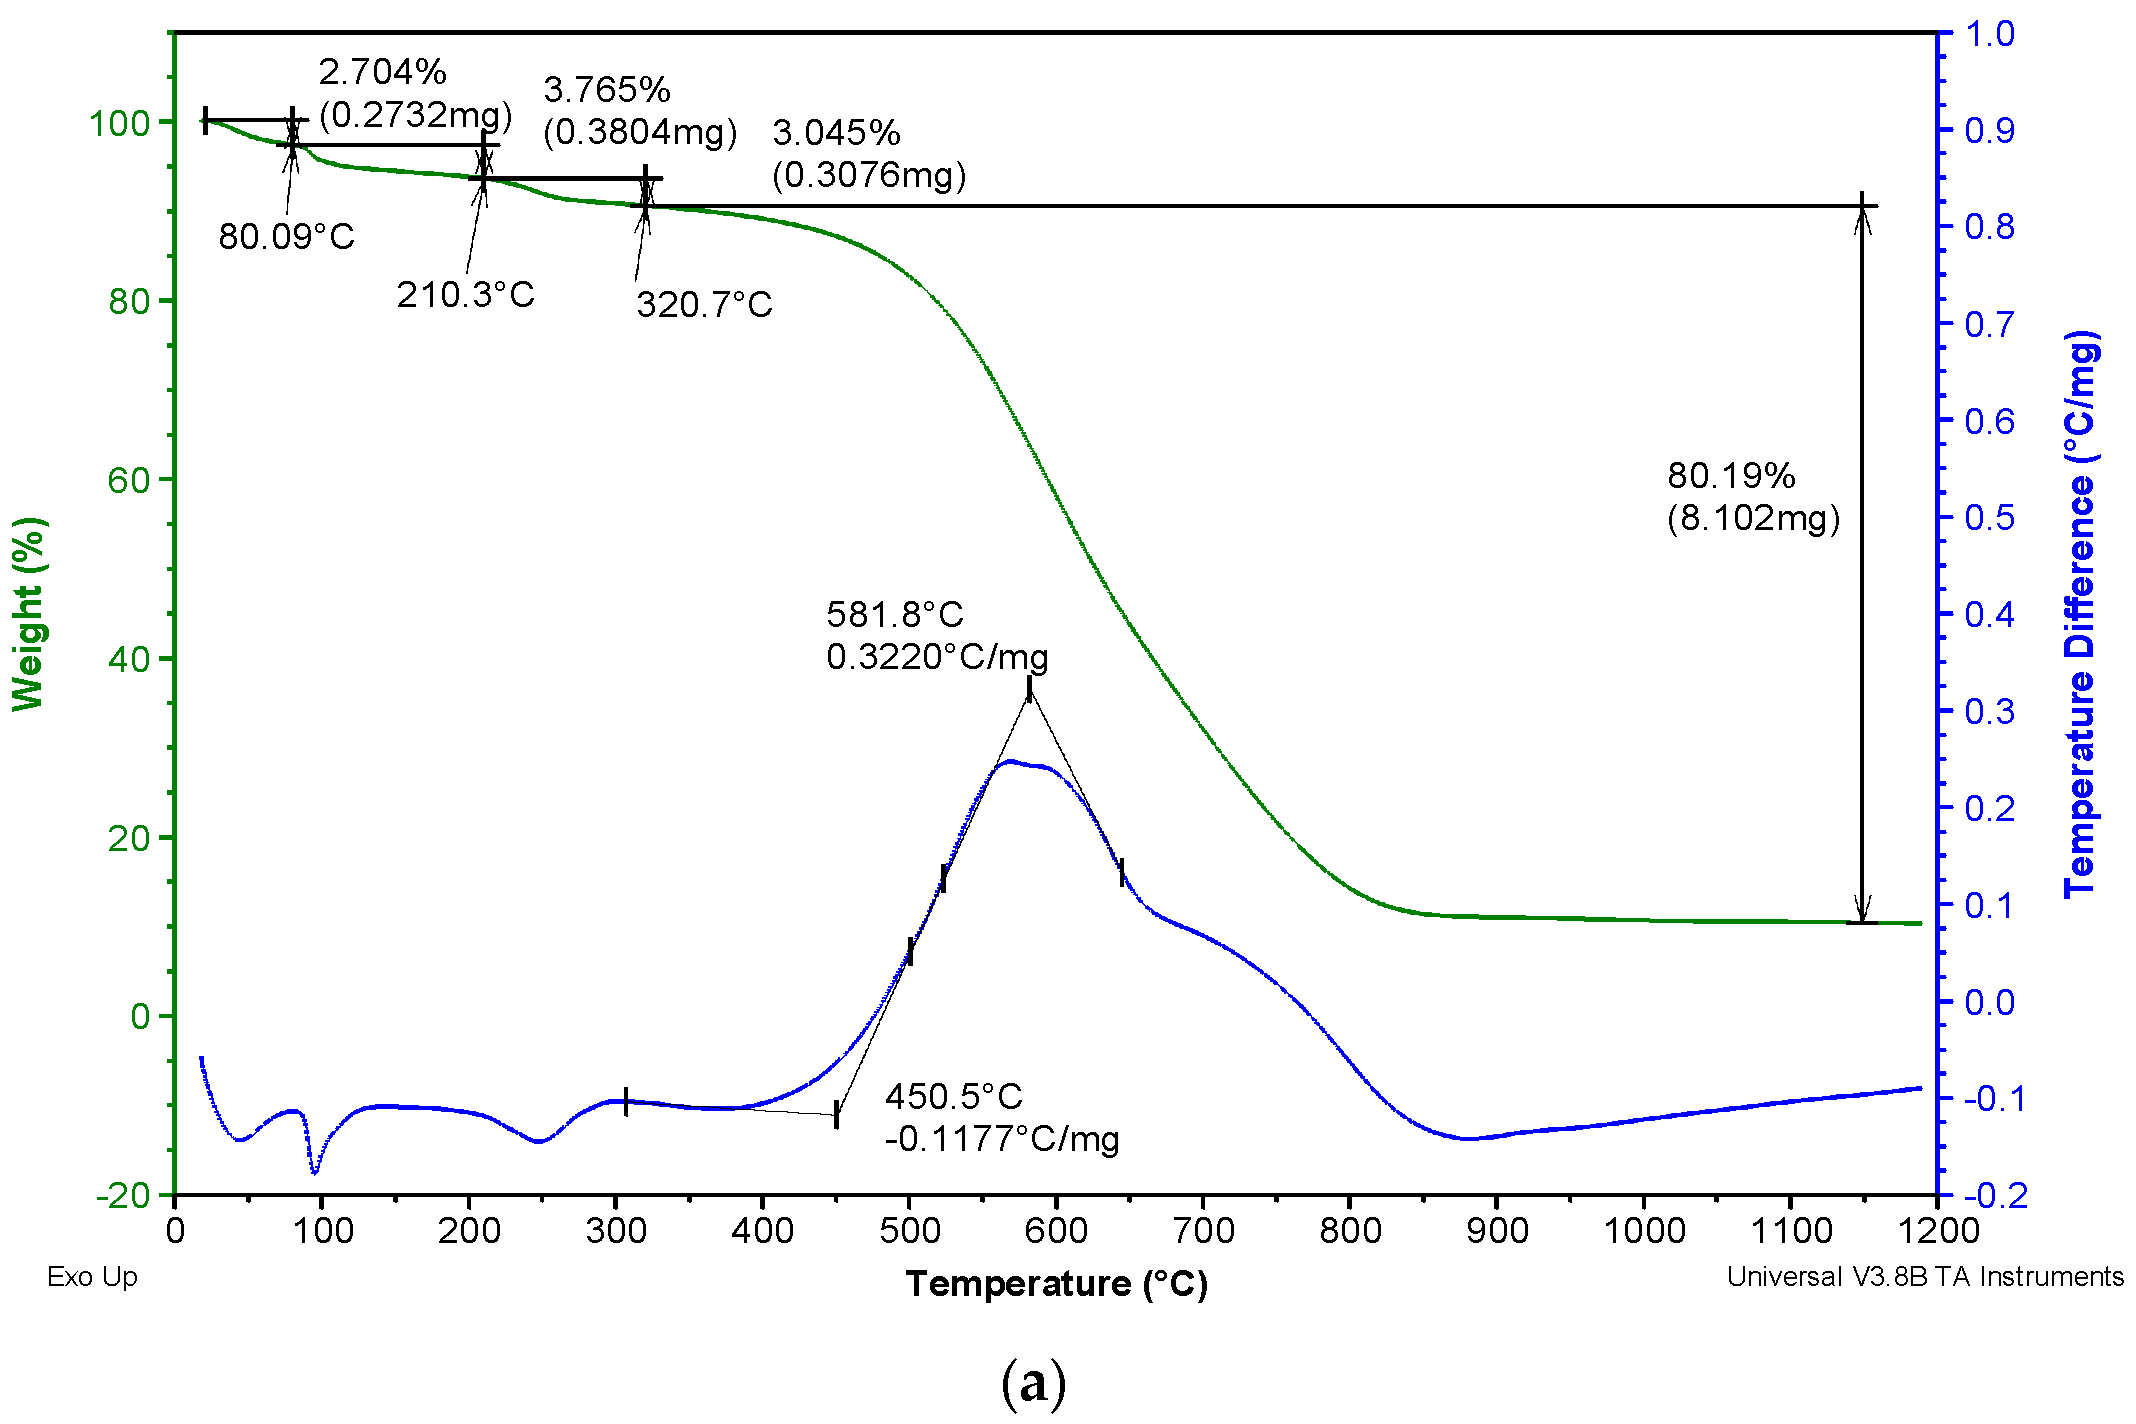
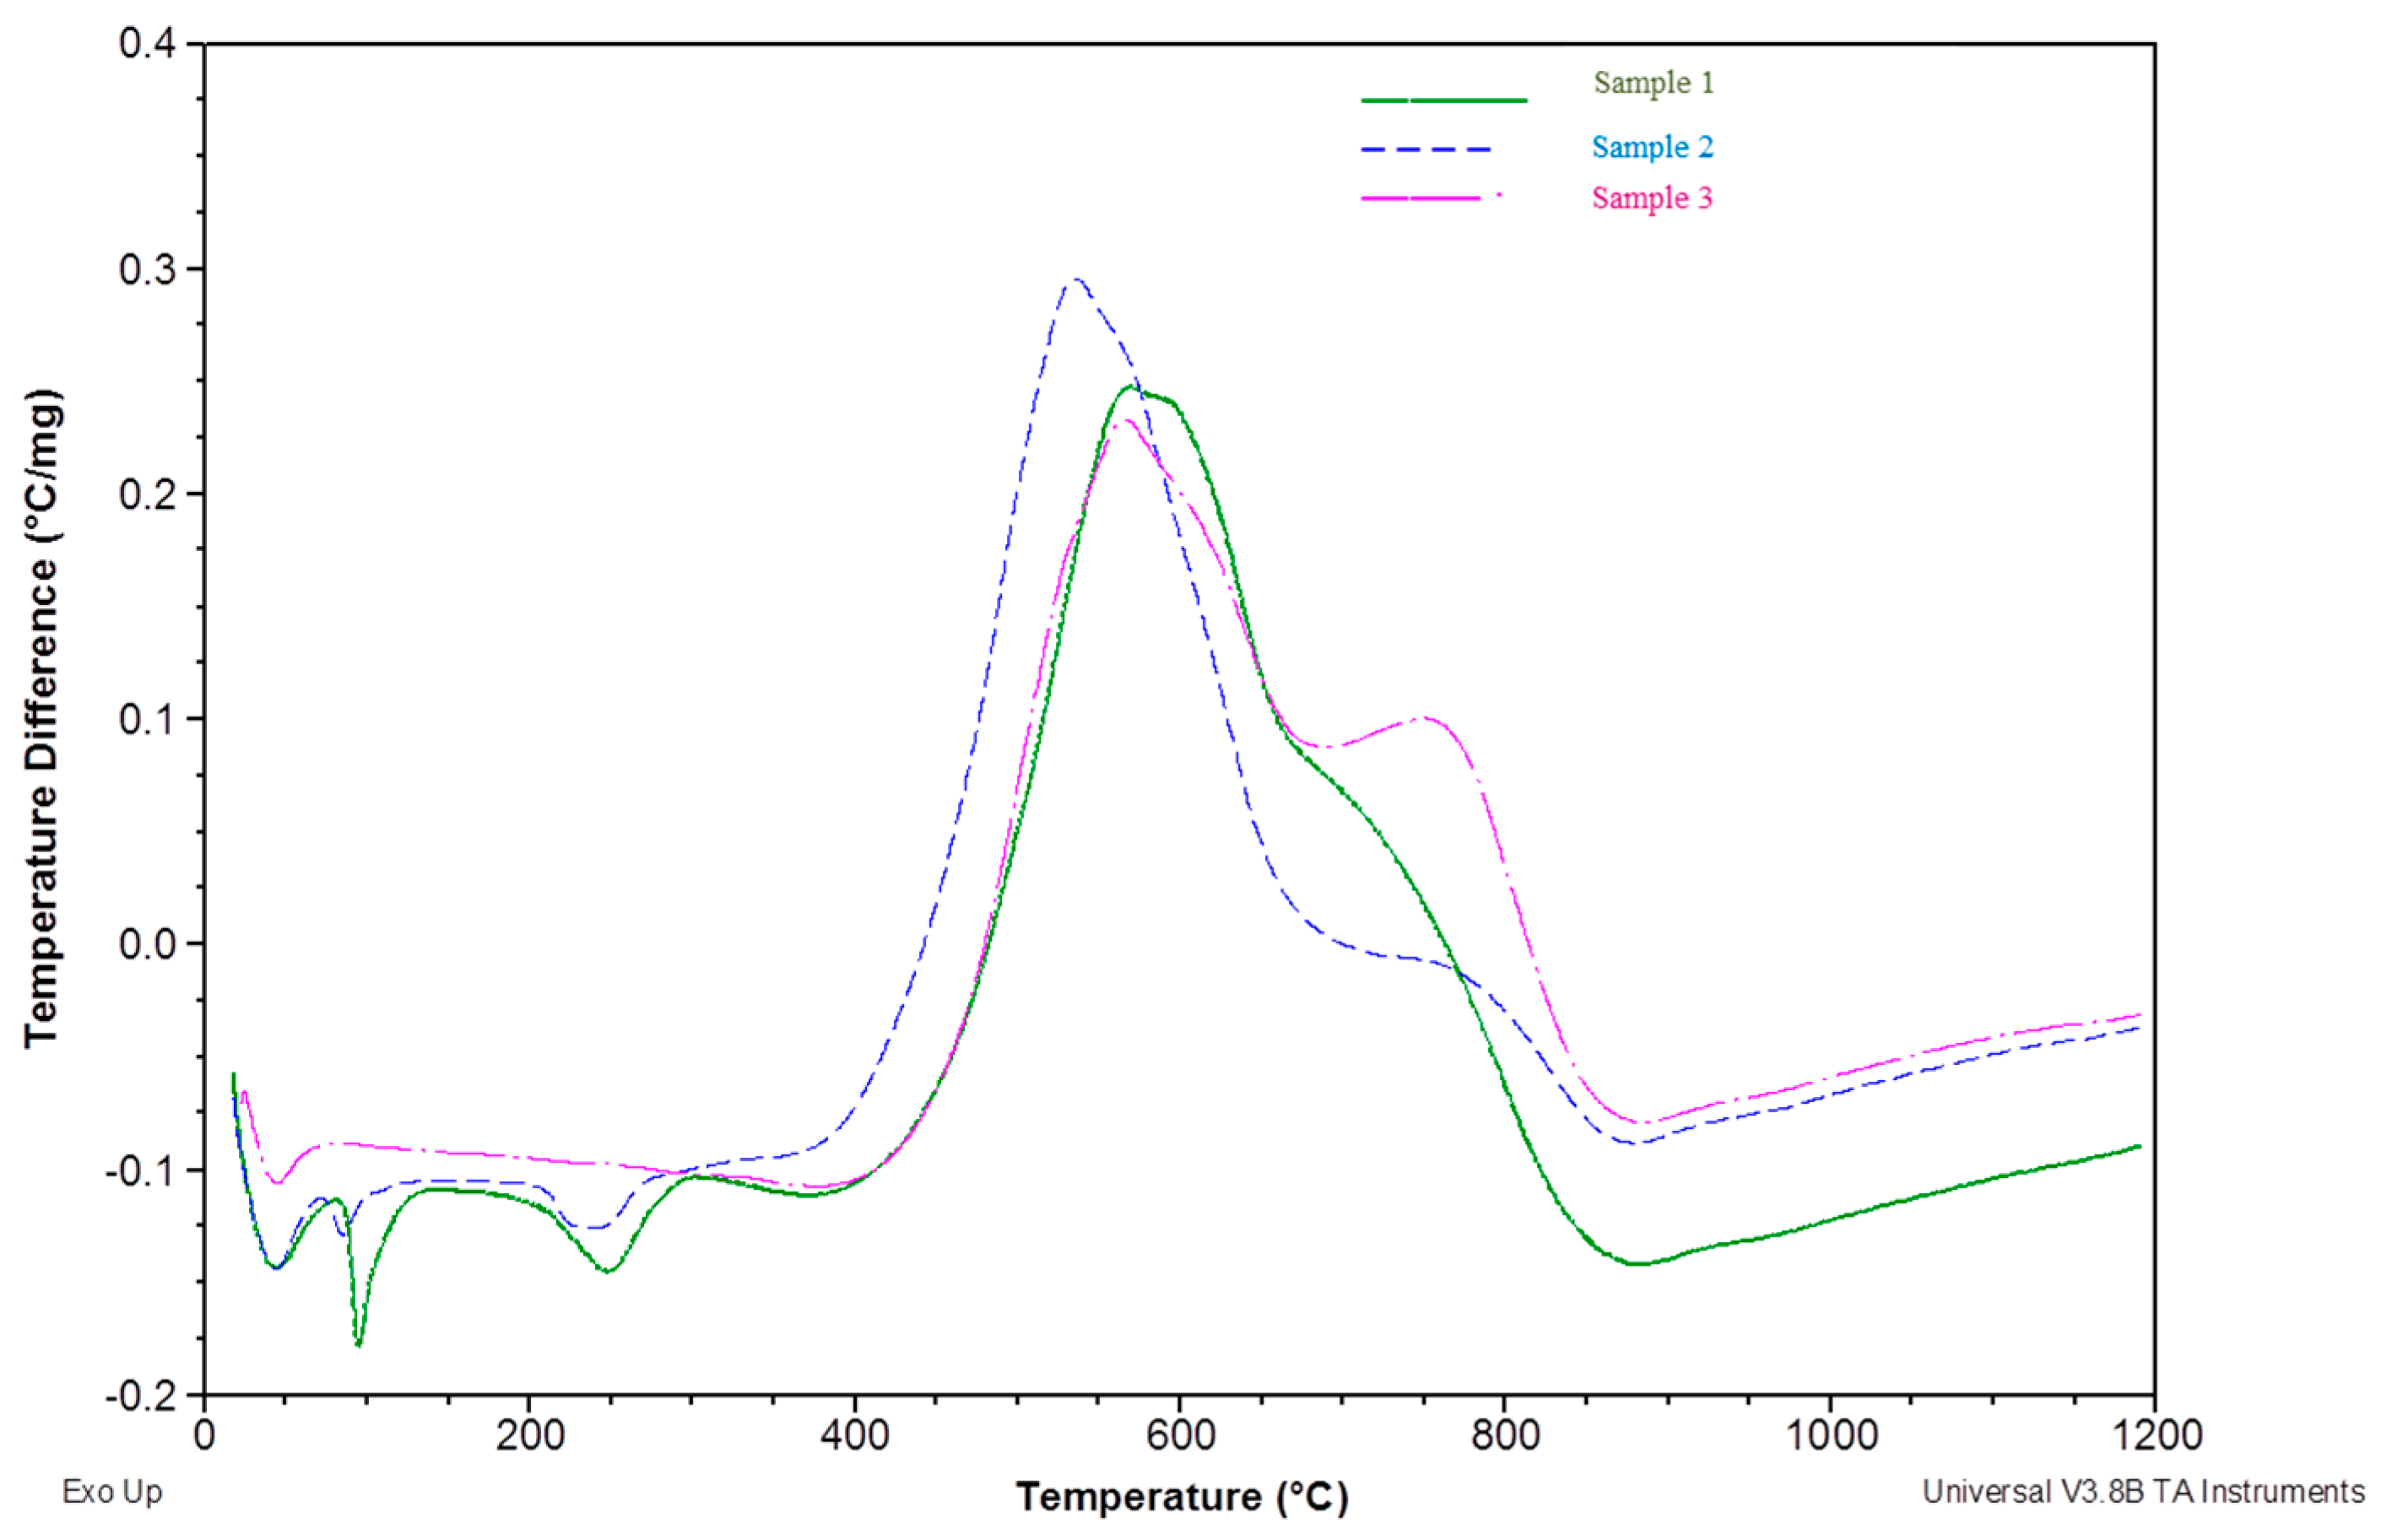
3.2. Thermal Analysis

Thermogravimetric measurements were obtained in the temperature interval from room temperature (25 °C) up to 1200 °C, which allowed for the identification of the main changes in the mass of the samples according to temperature increases.
The results obtained from the TGA/DTA characterization of the pure coal ash sample—sample 1 (Figure 2a)—show three main mass losses:
  • A loss of mass from the sample due to the evaporation of absorbed water during the temperature interval from room temperature up to 80 °C;
  • A two-step loss of mass in the temperature interval between 80 and 320 °C due to the evaporation of chemically bonded water (water which occurs in the sample in hydrate form);
  • A loss of mass due to coal oxidation and combustion in the temperature interval between 320 and 850 °C.
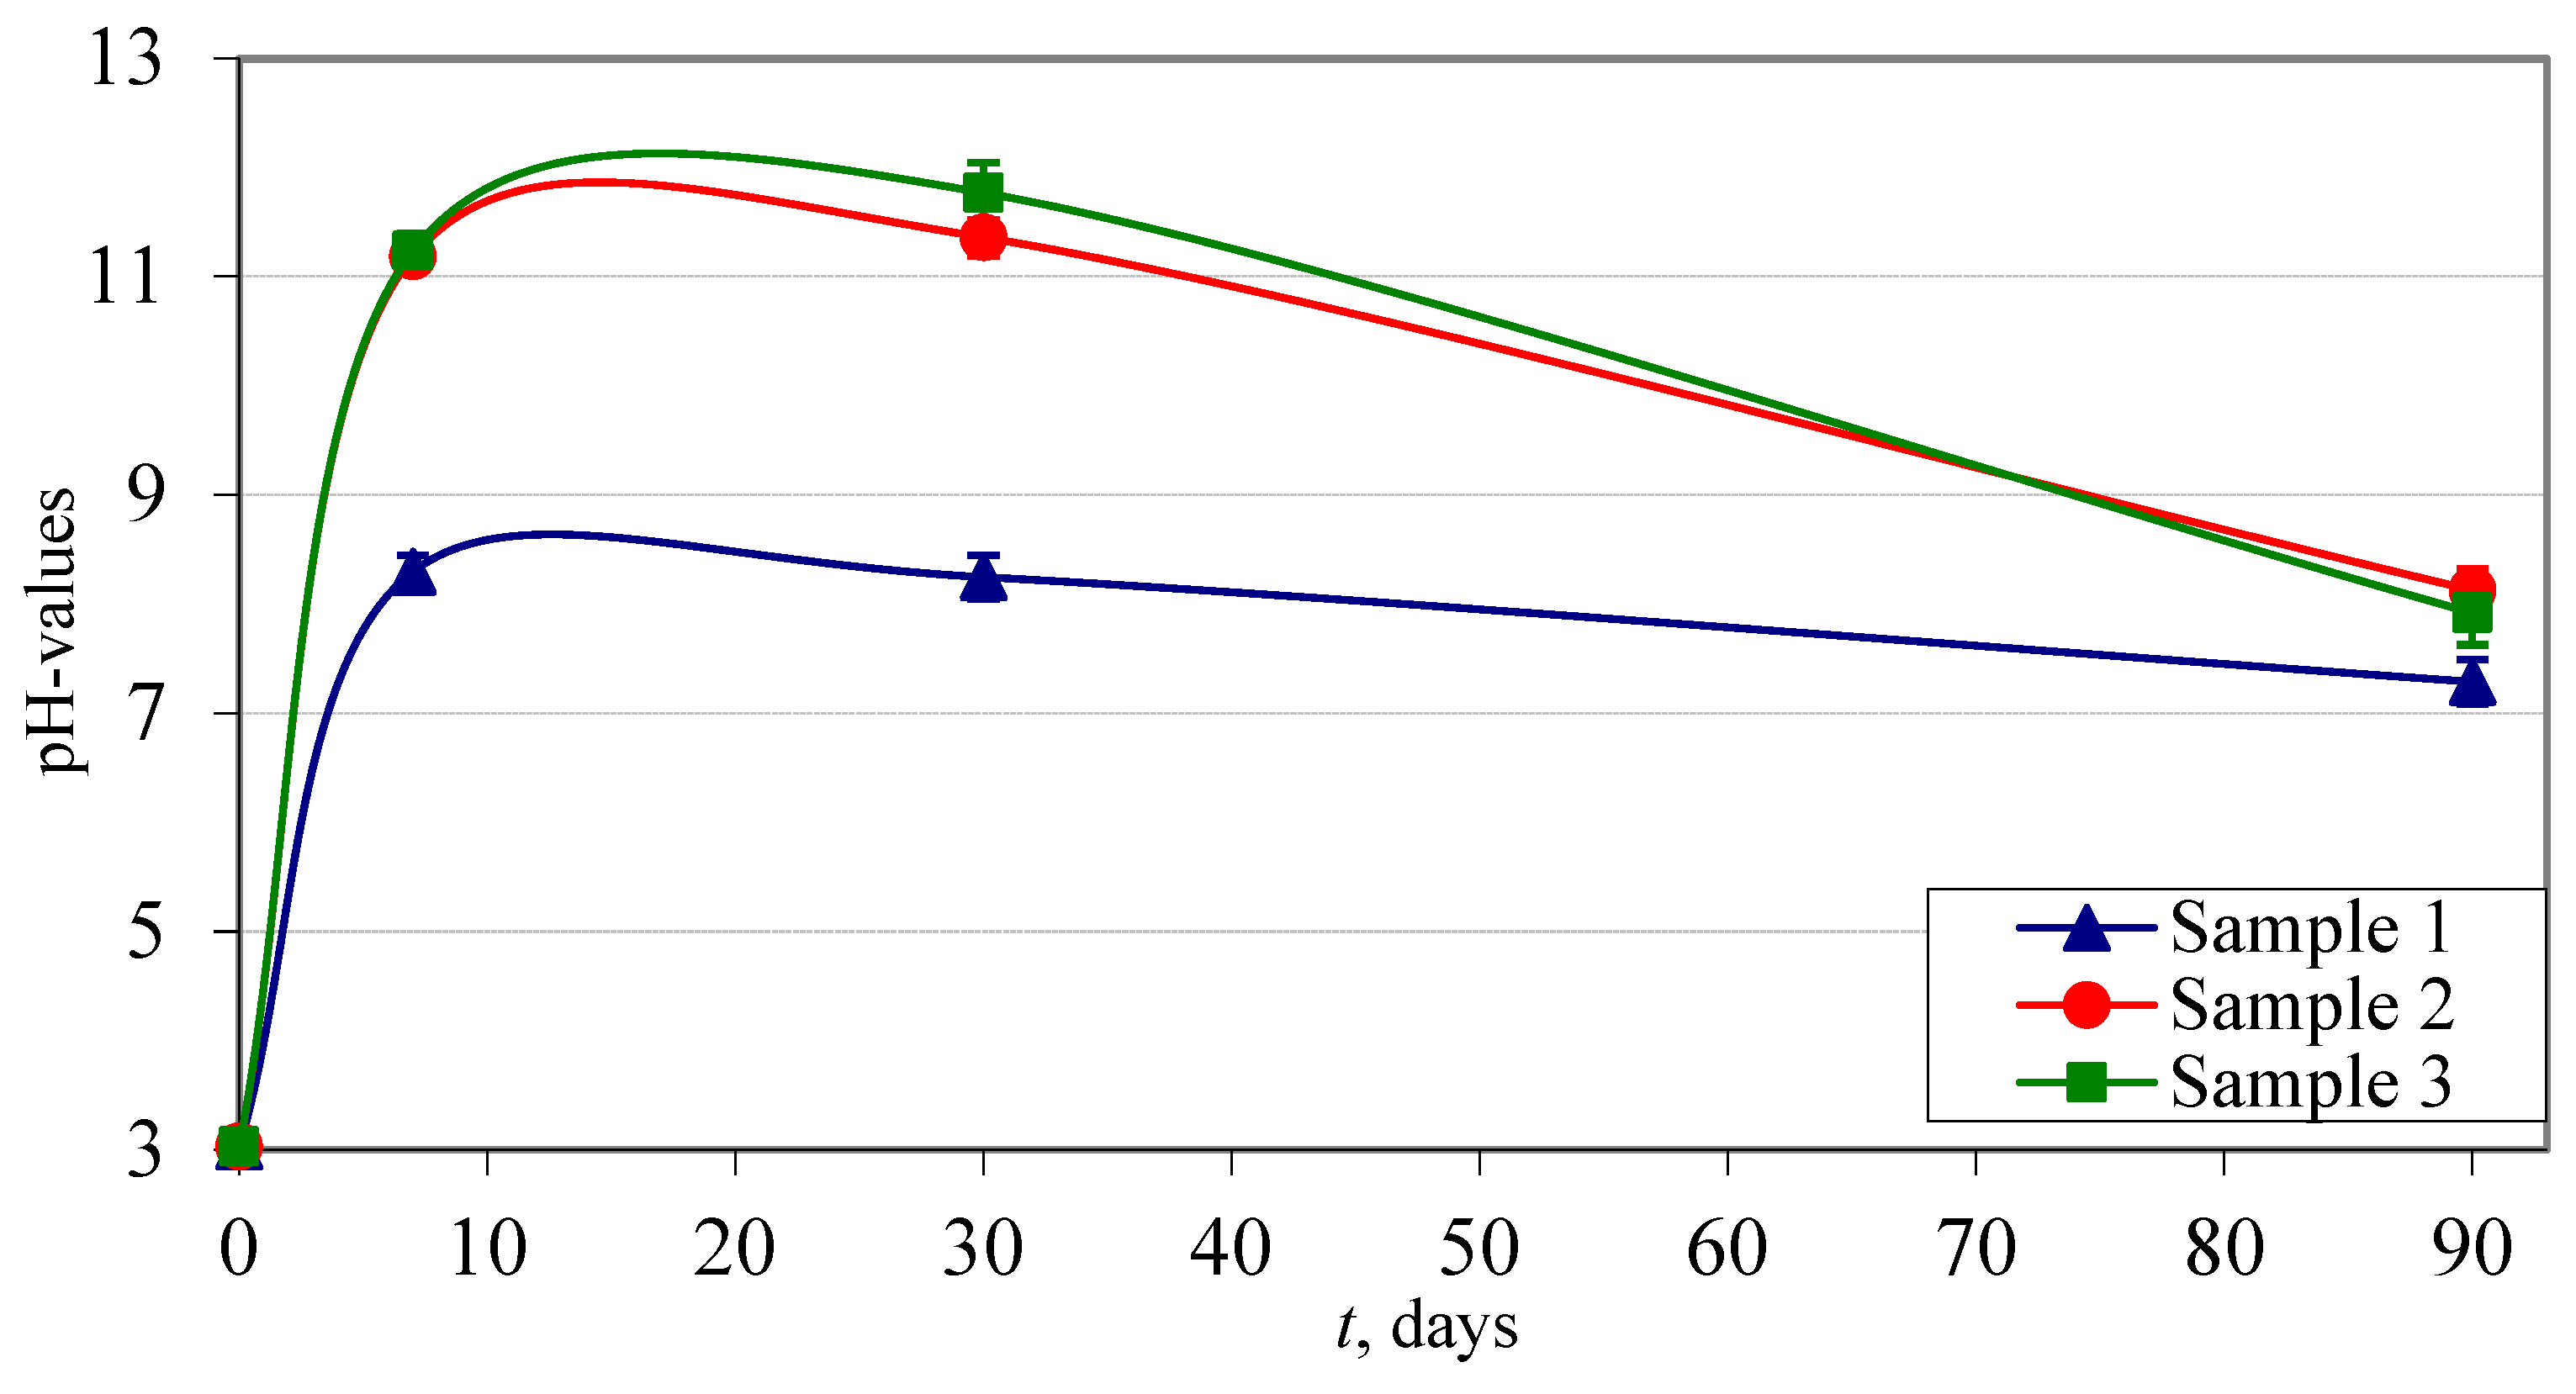
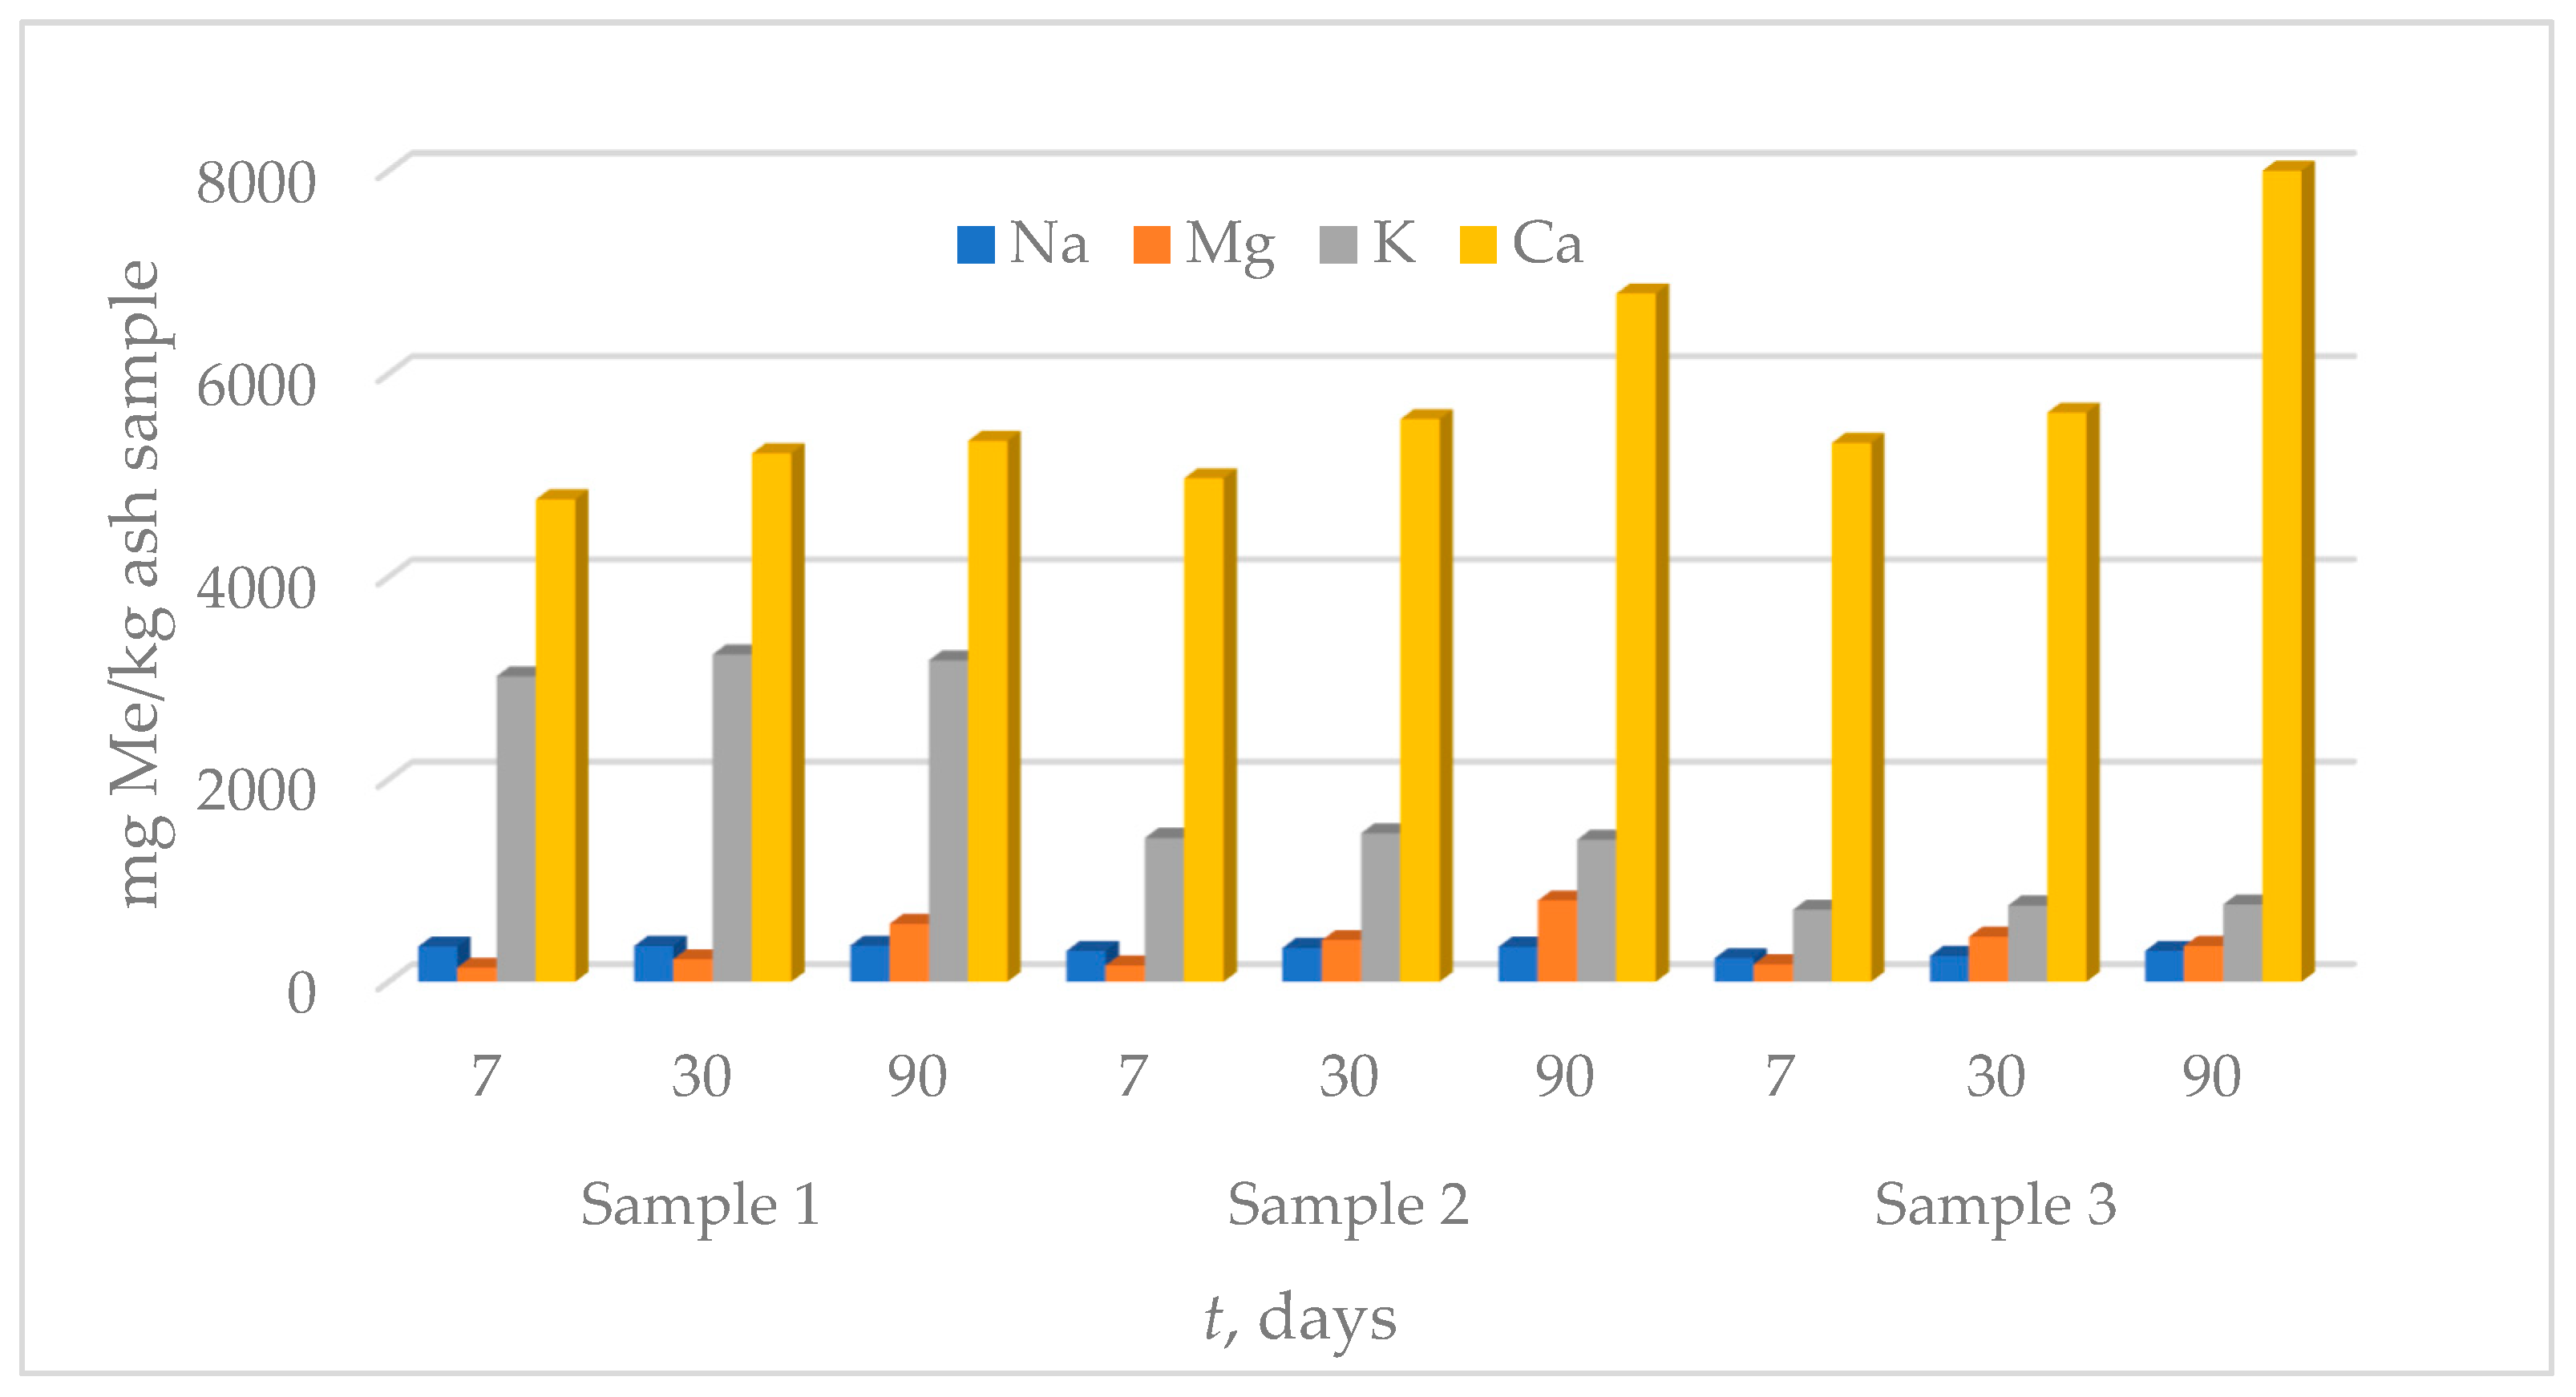
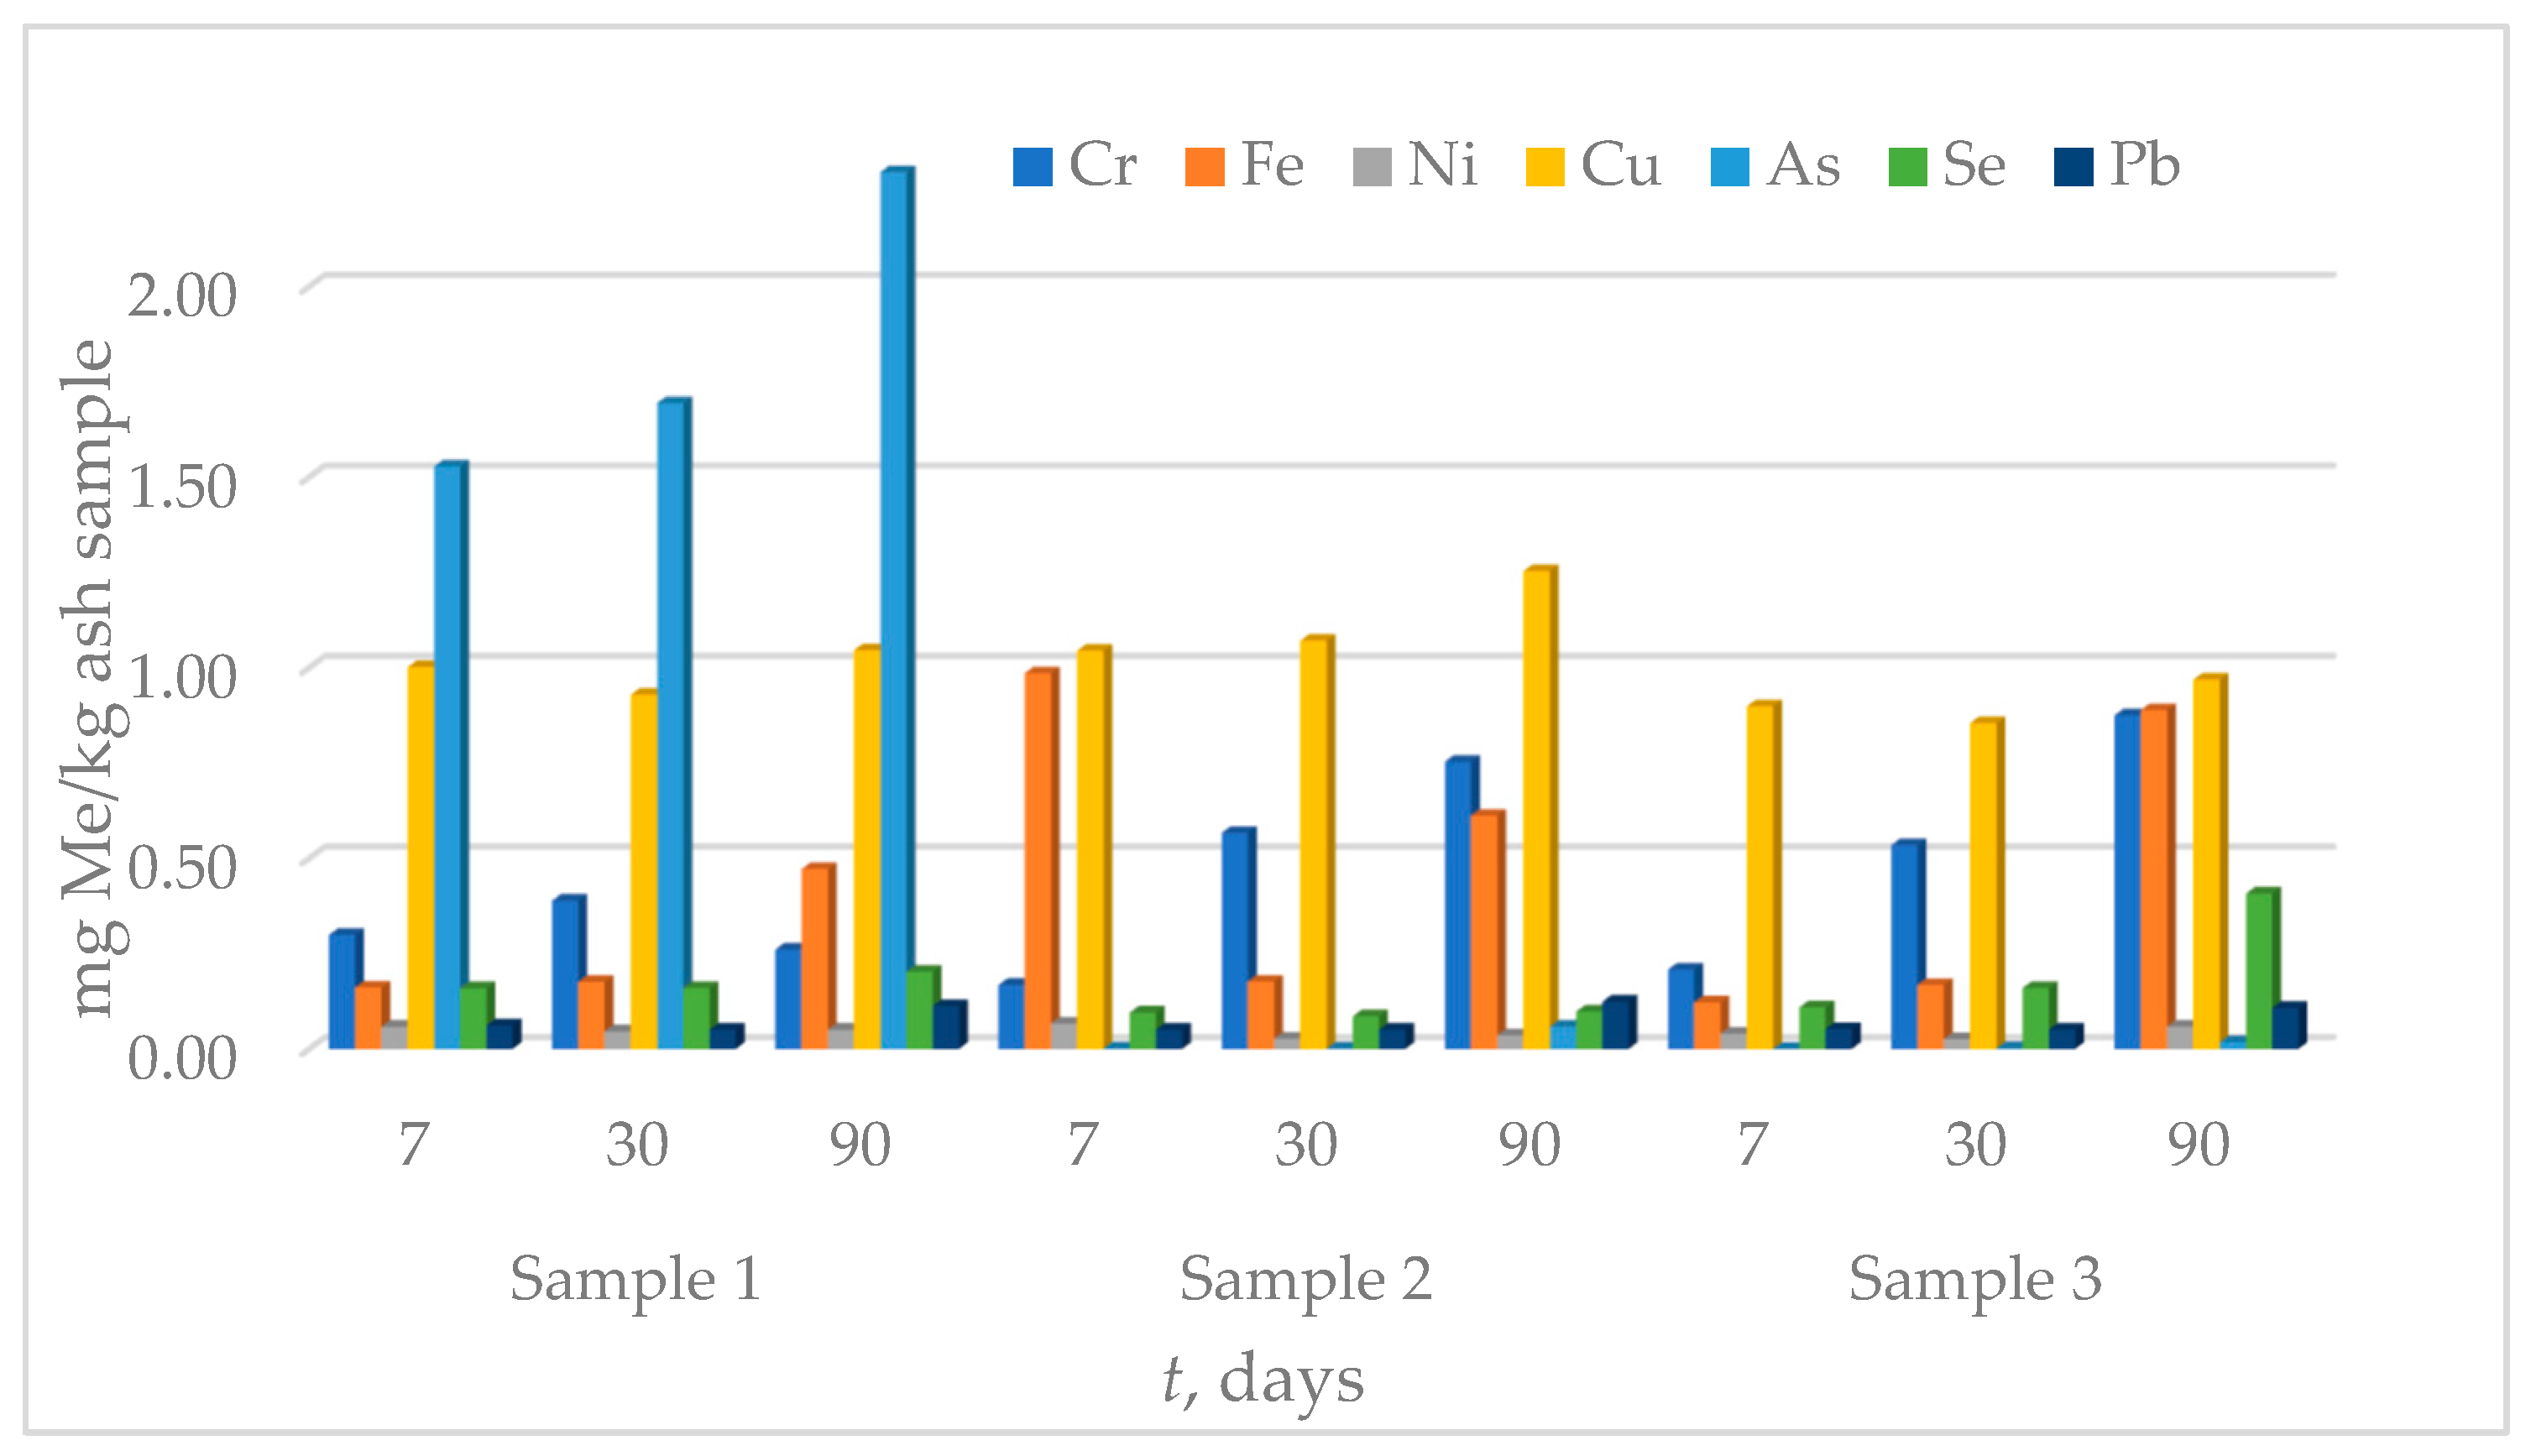
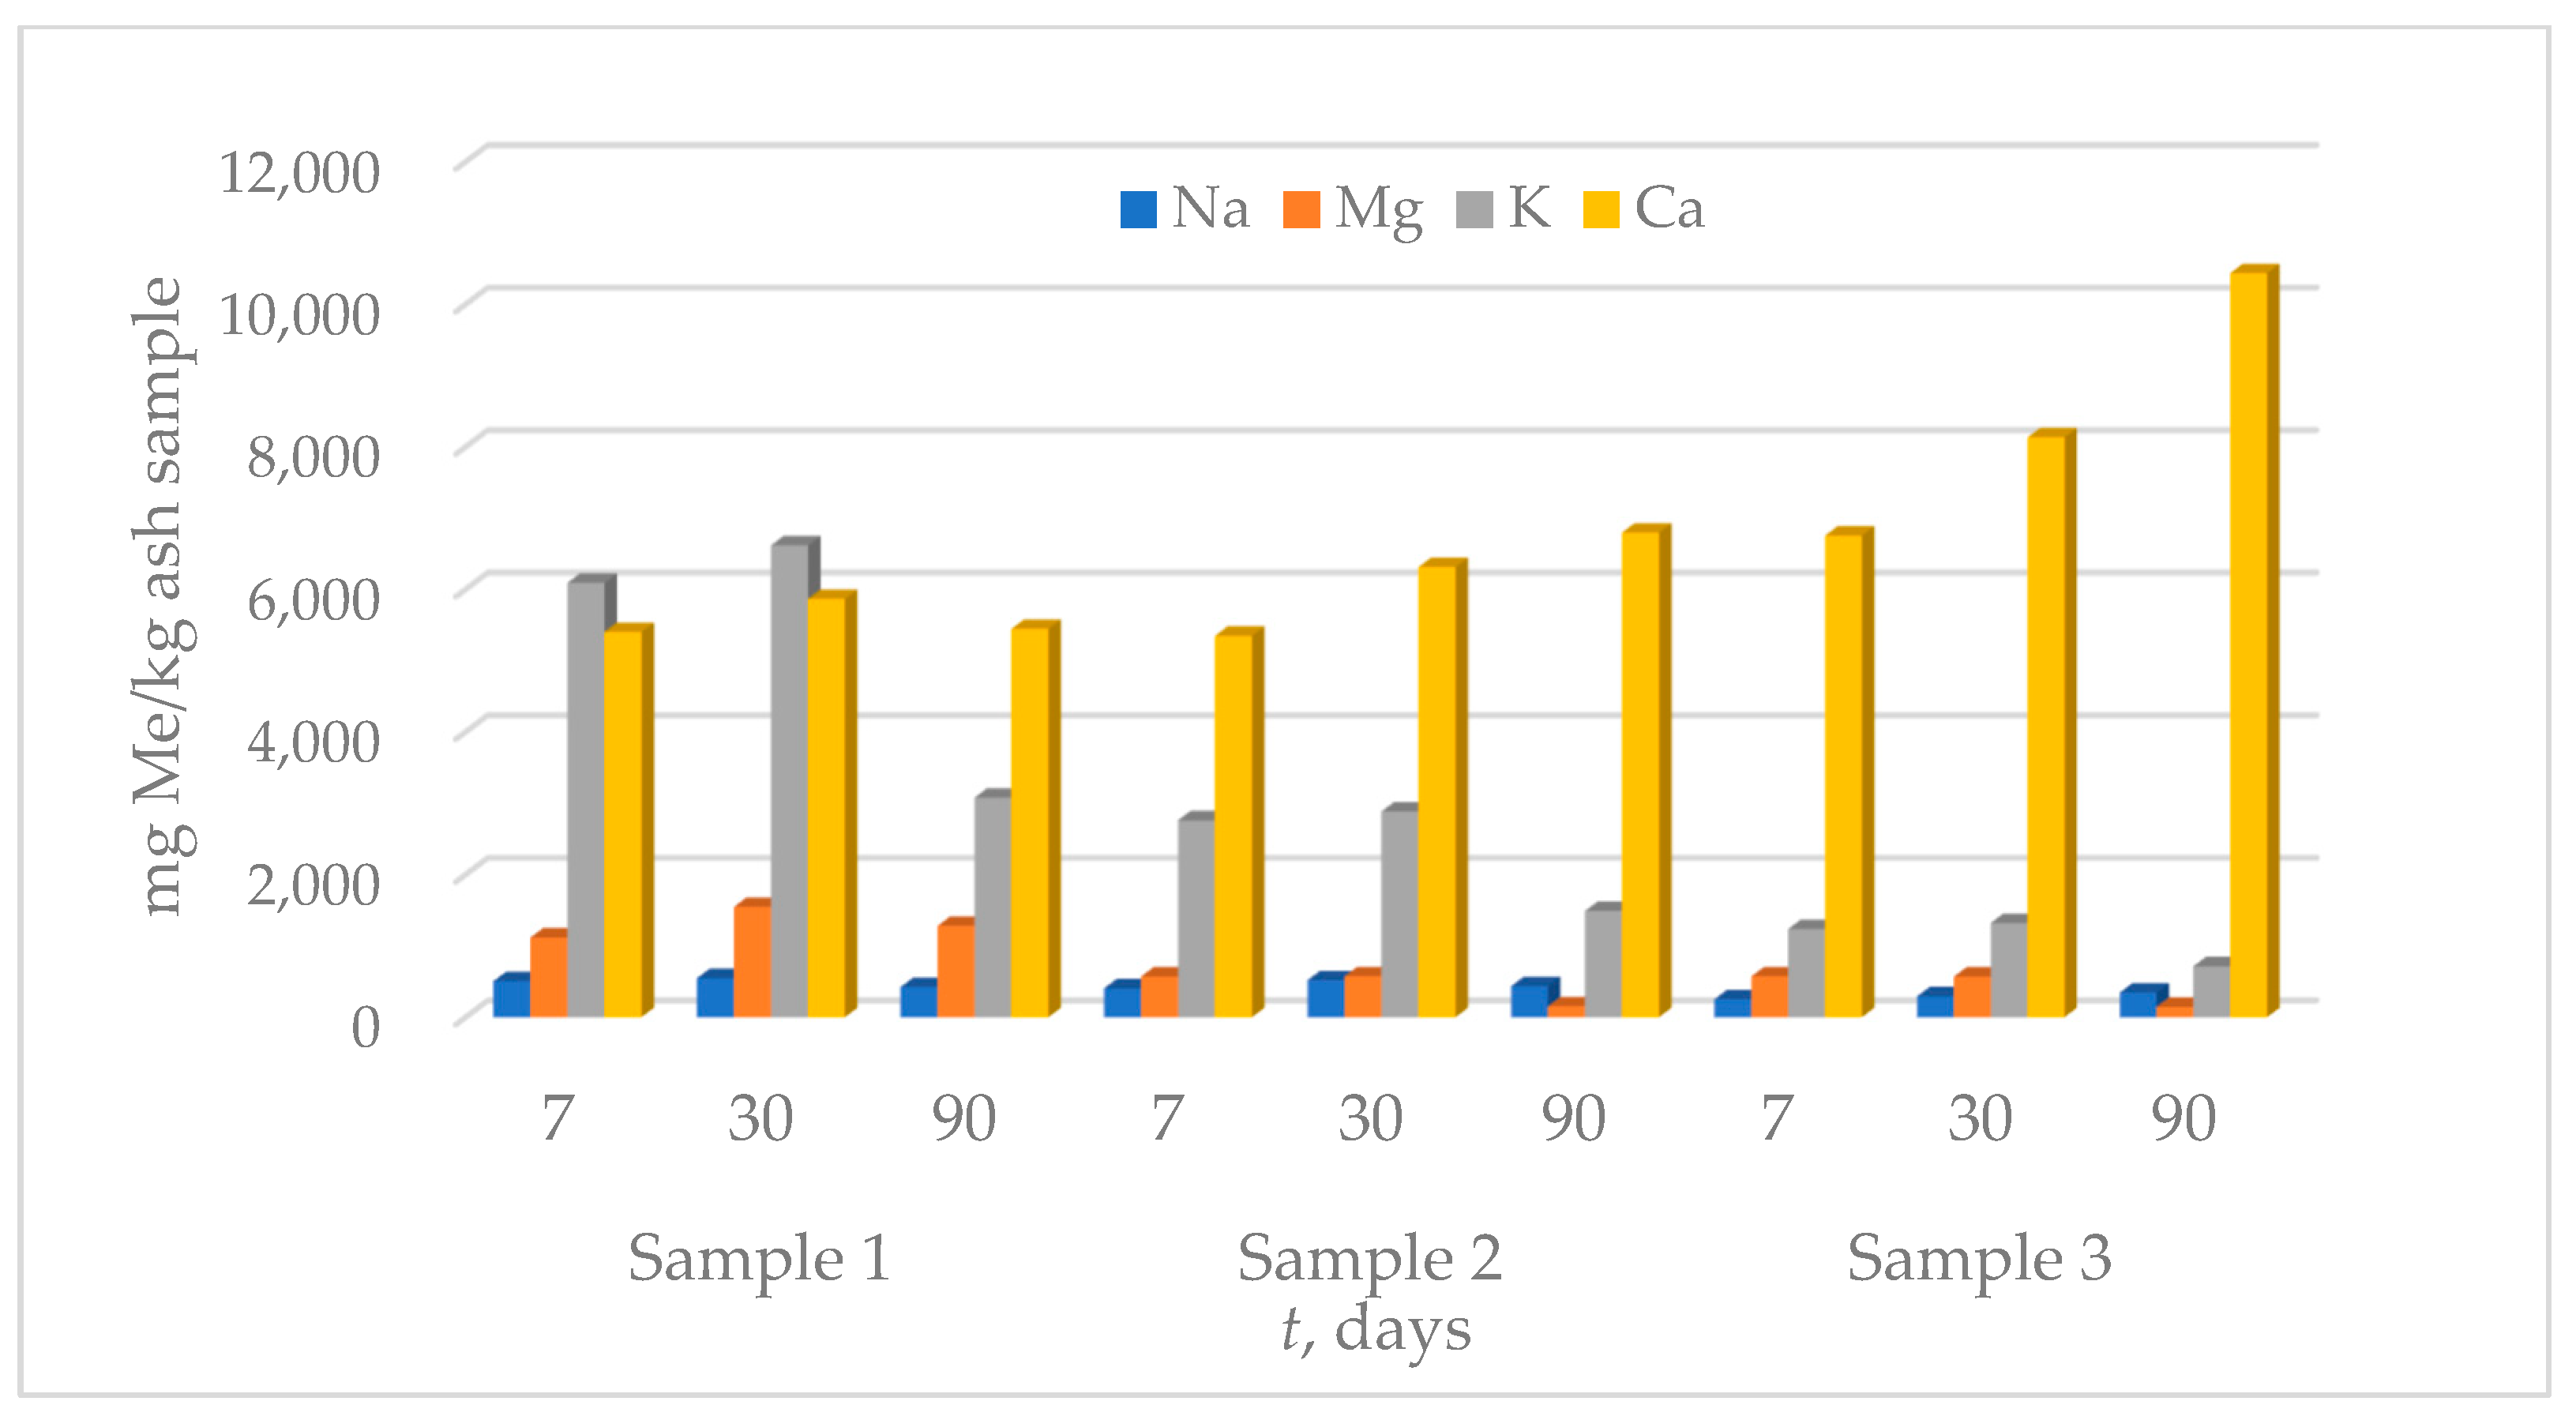
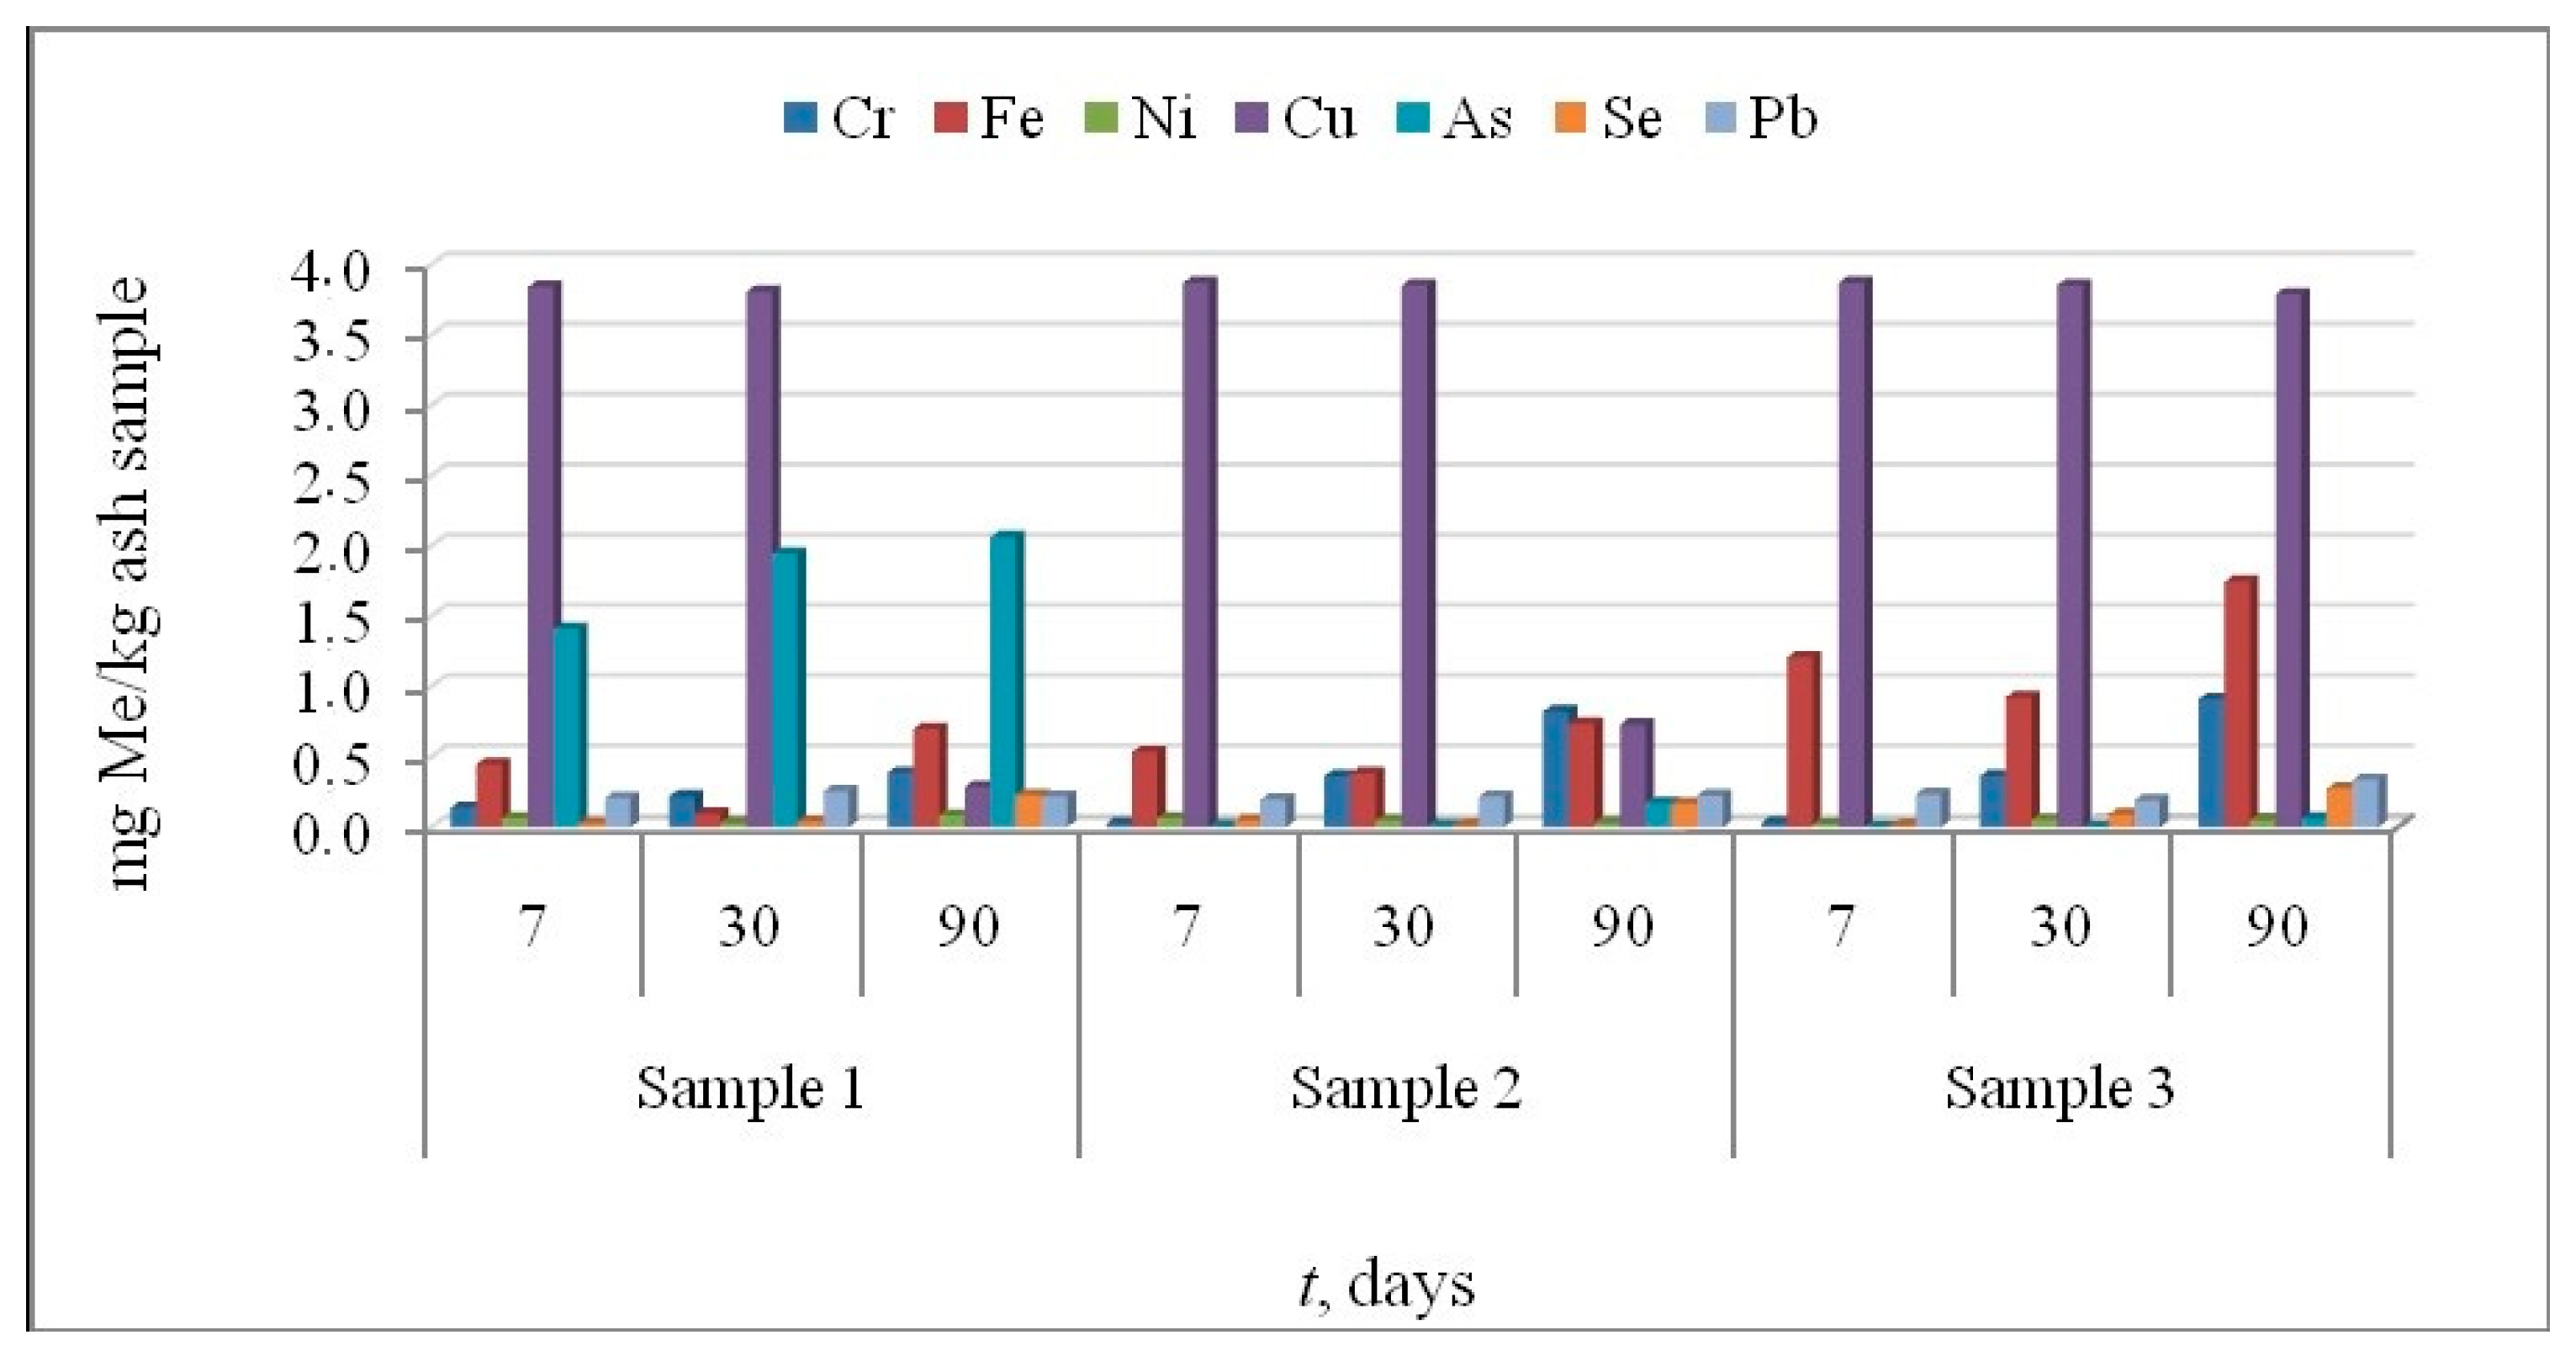
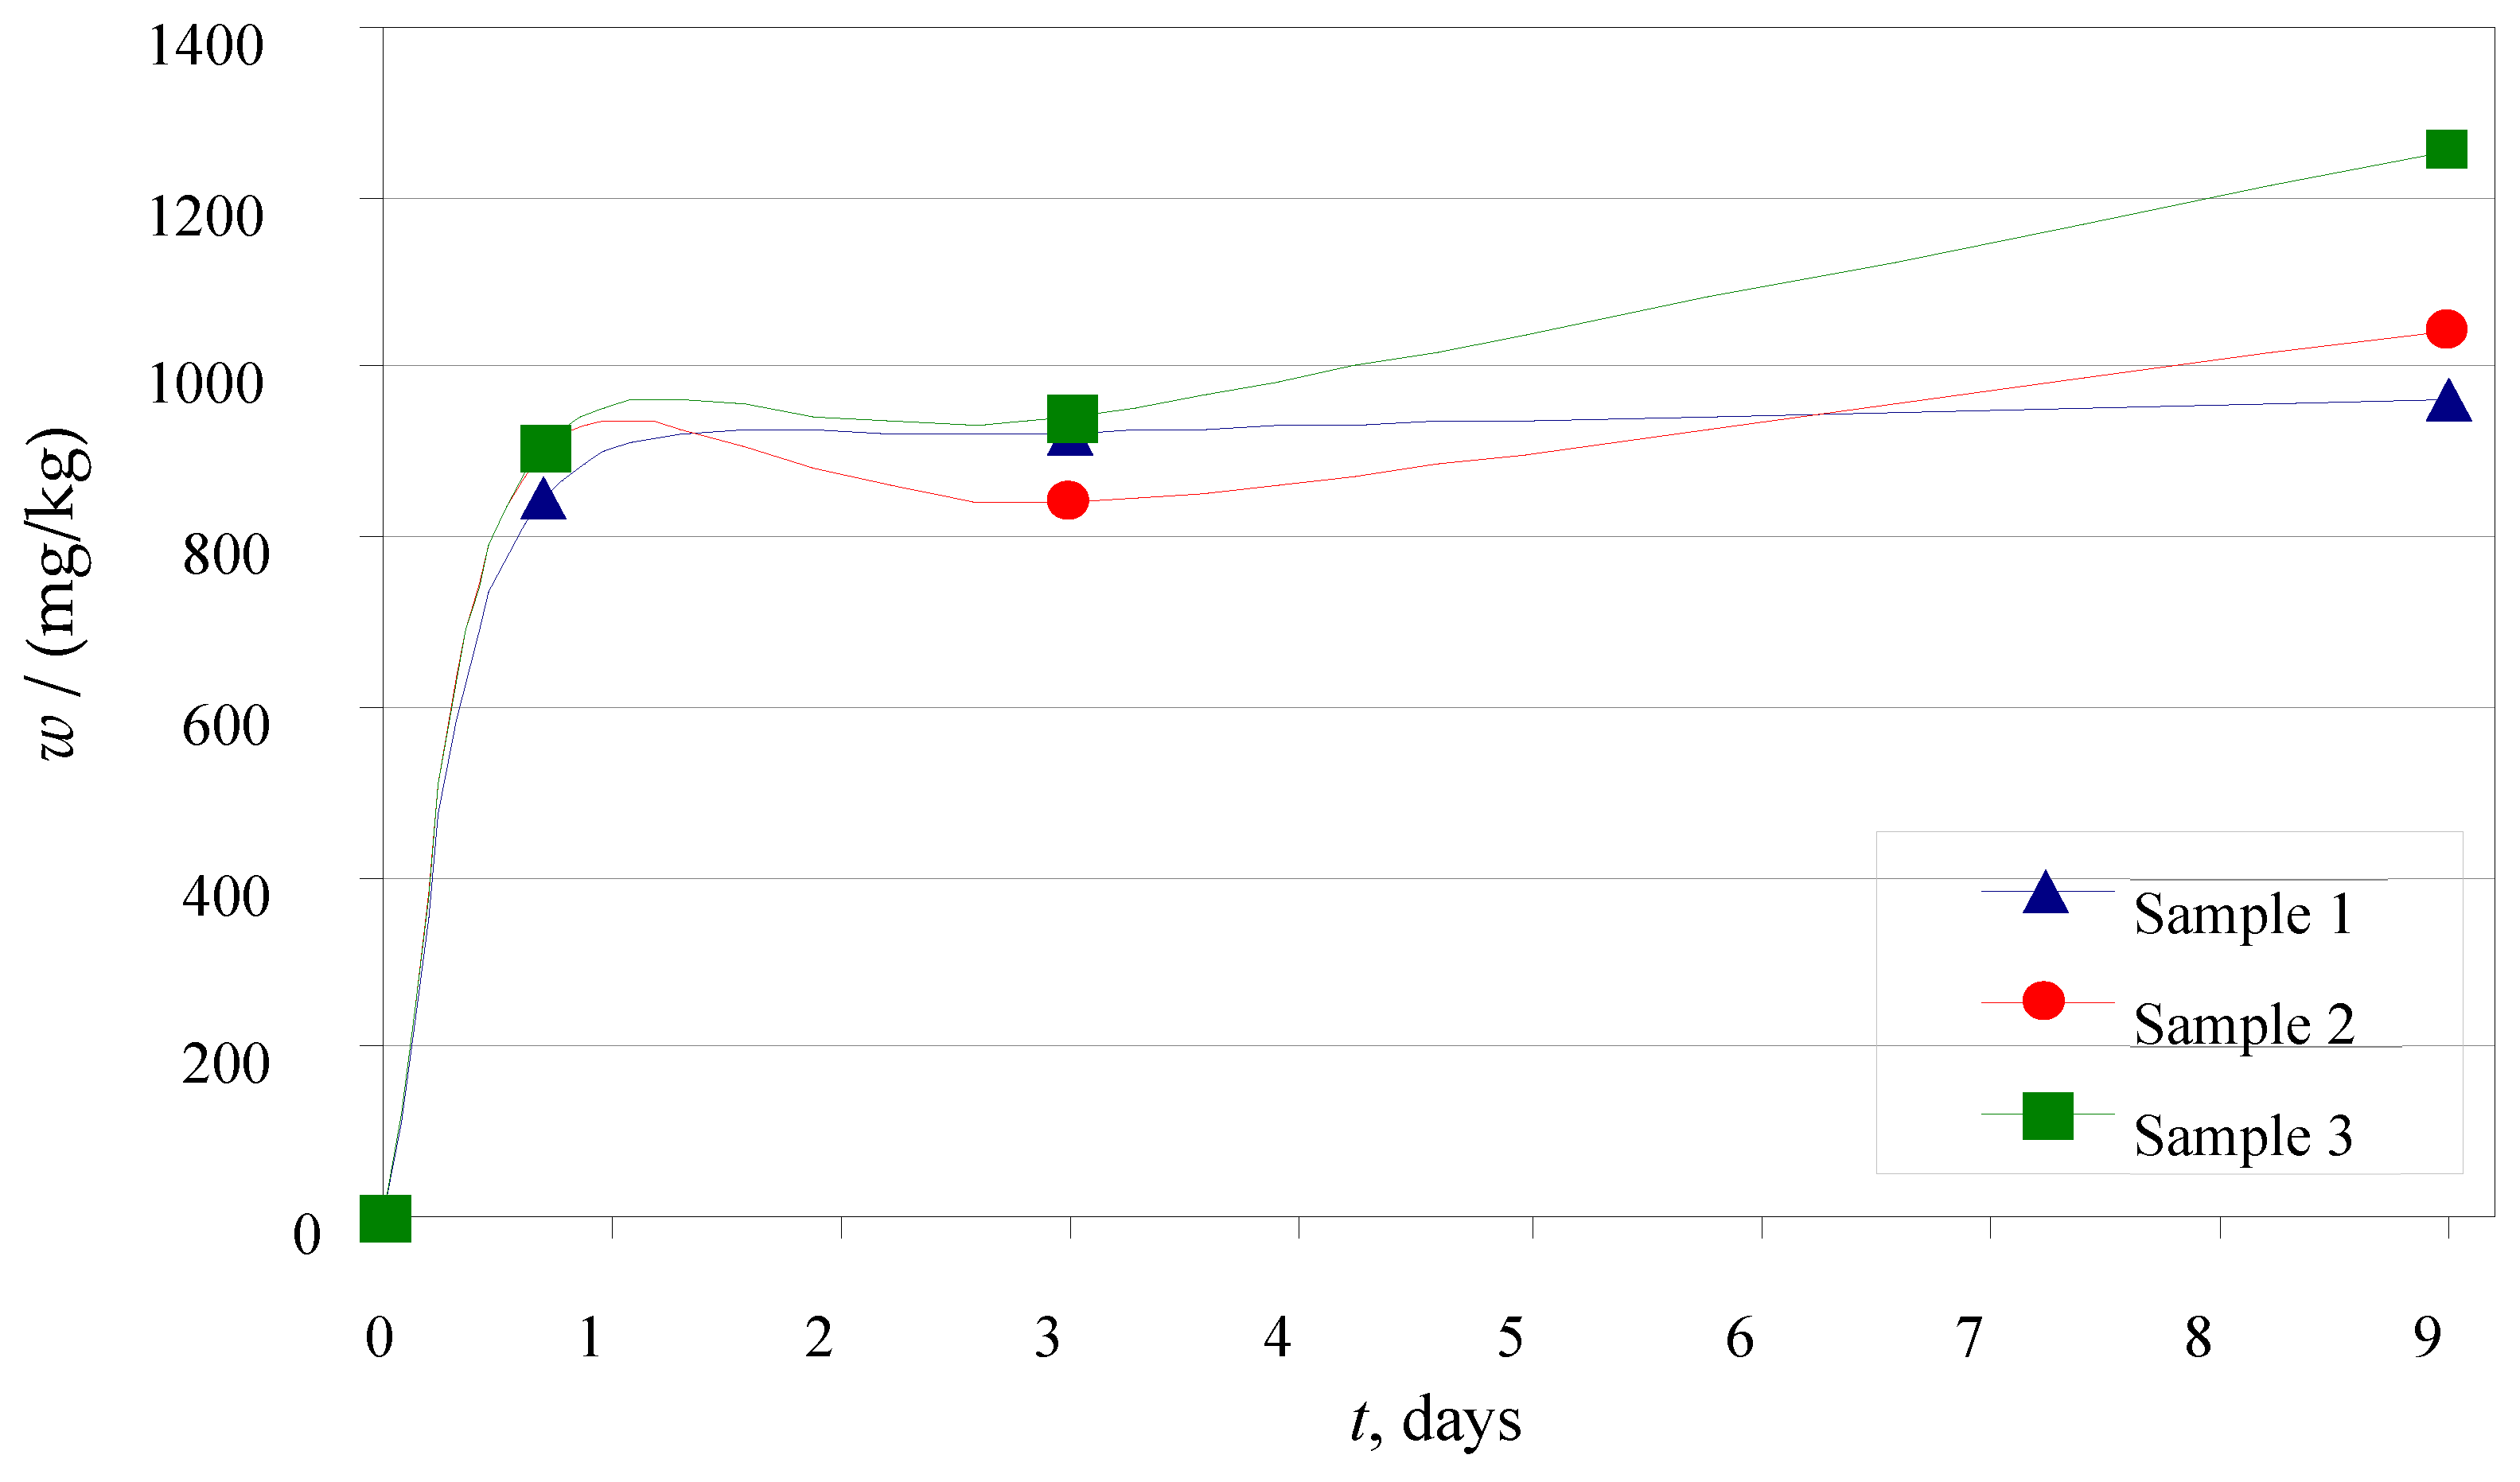
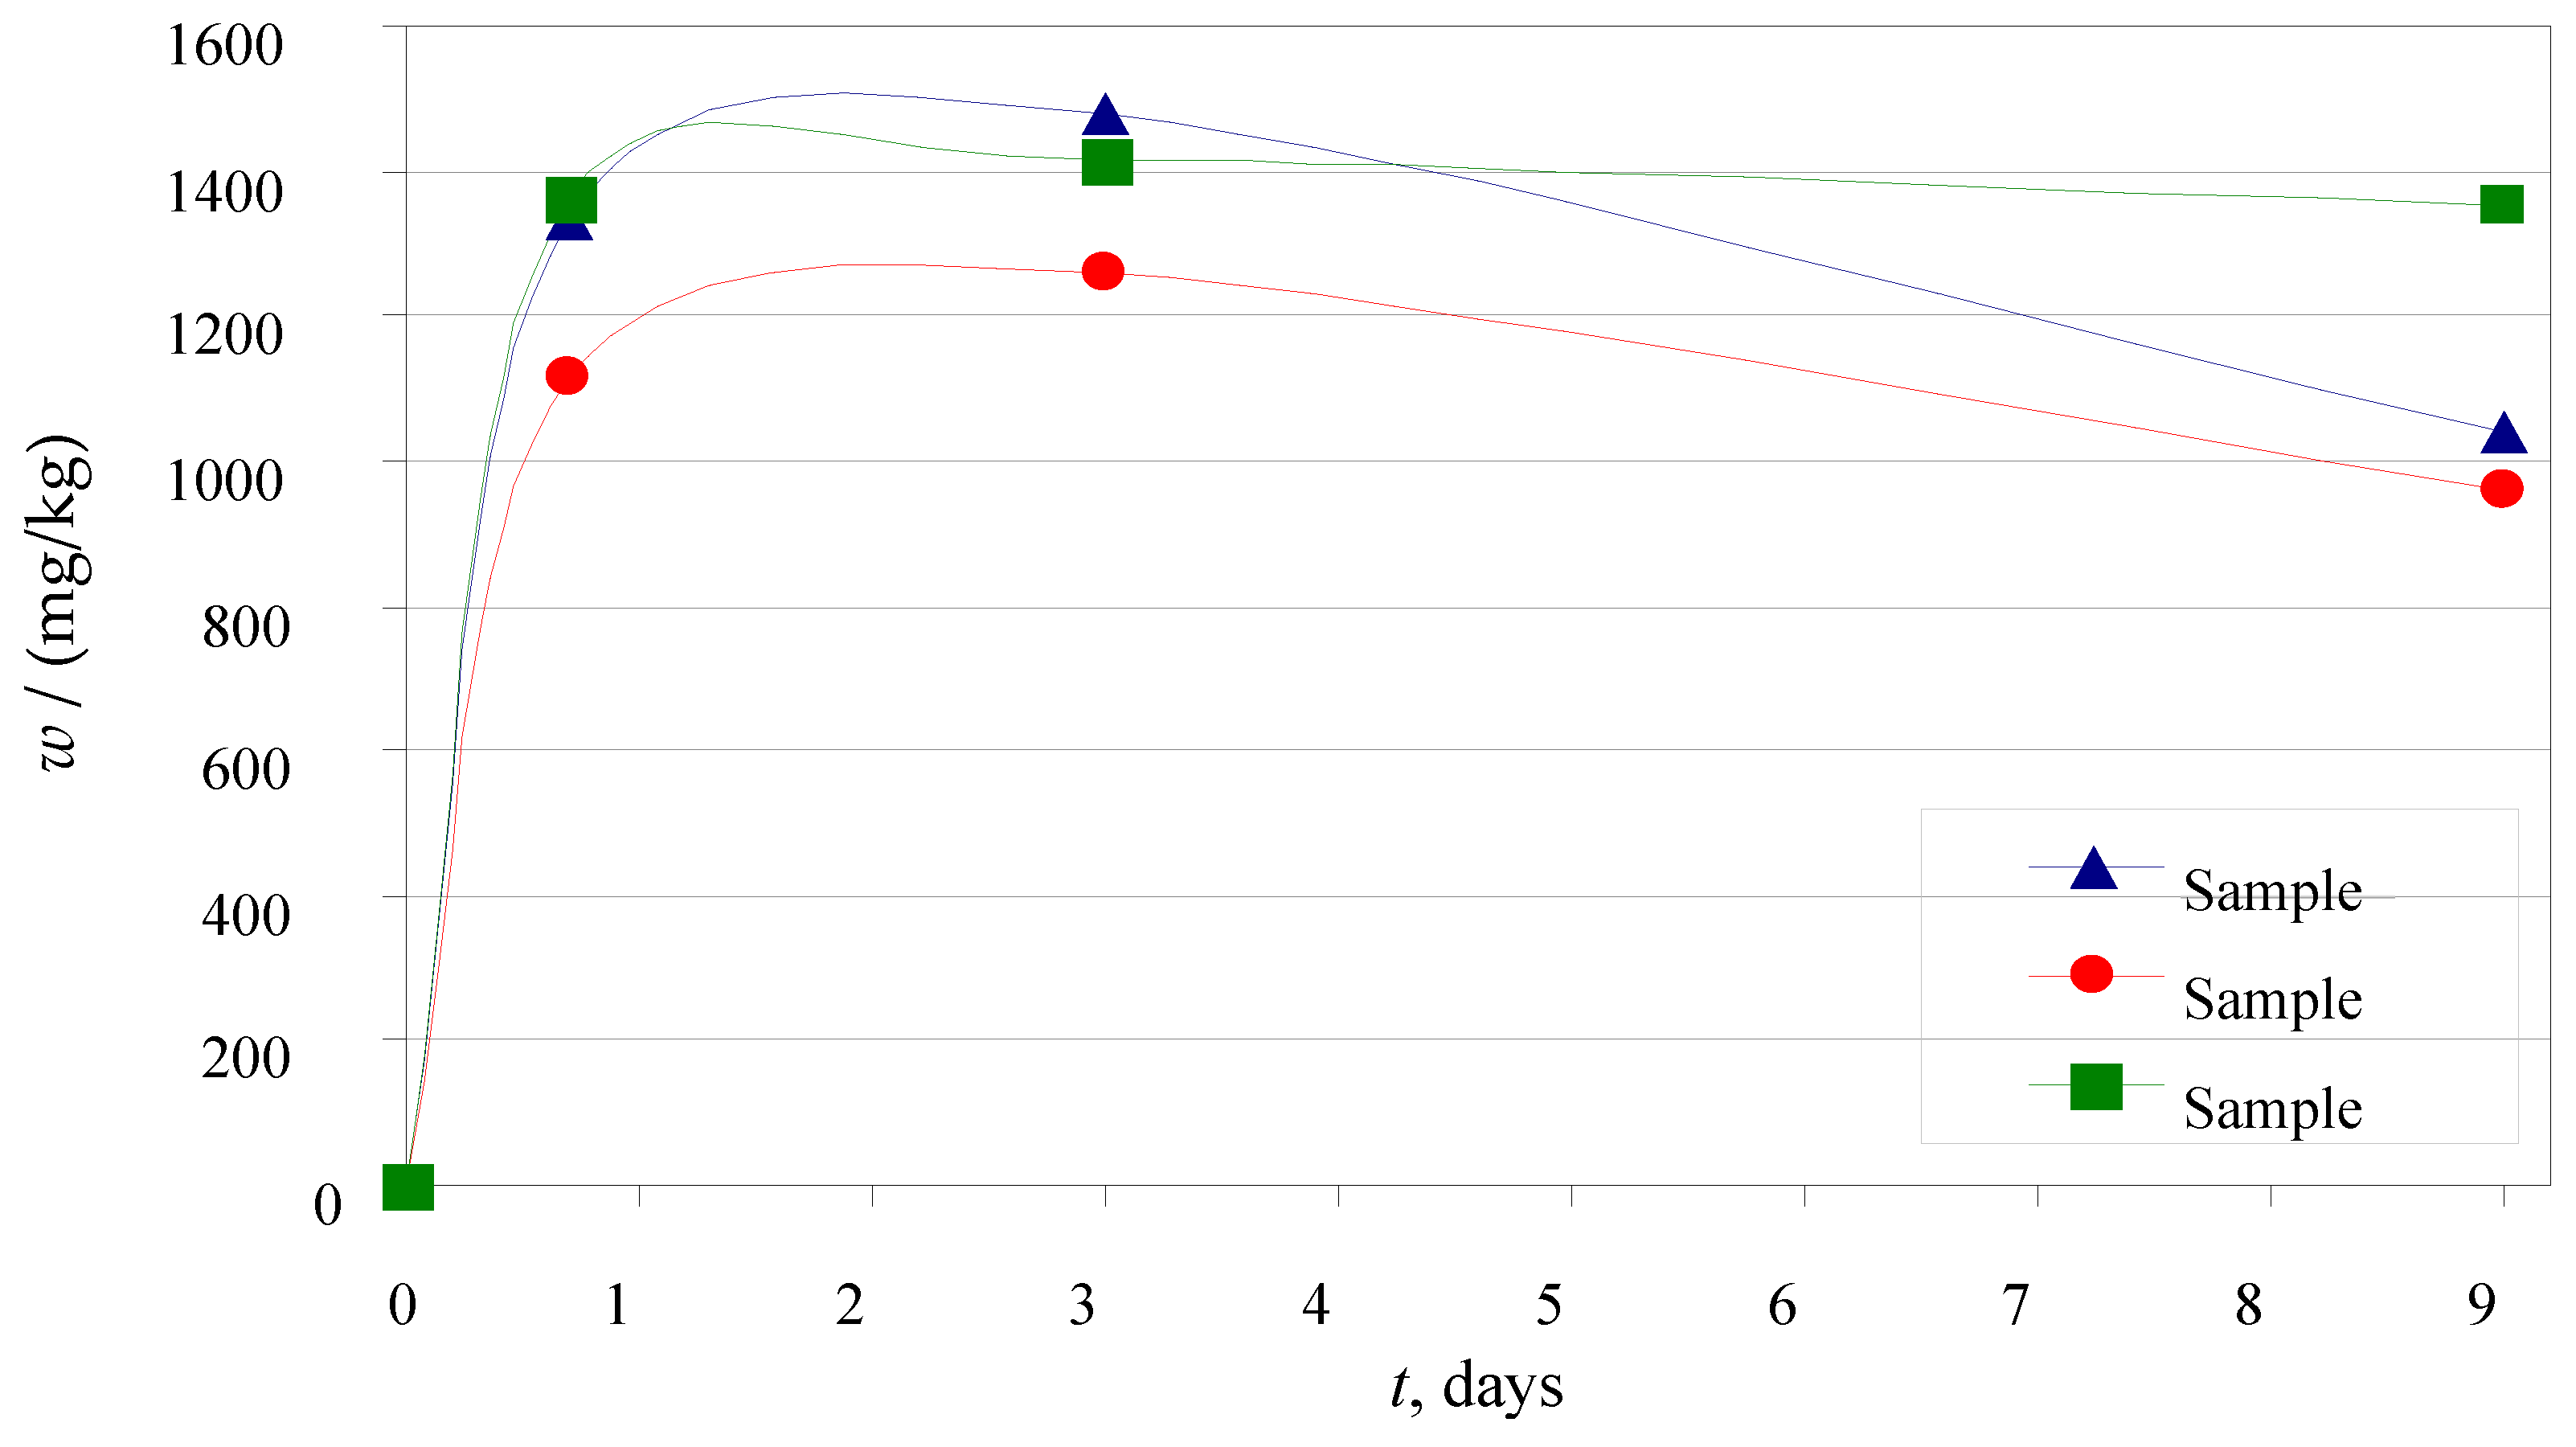
Several of the losses from the mass samples, which are about 10% in the temperature range up to 320 °C, concur with three endothermic peaks in the DTA curve, indicating the evaporation process of physically and chemically bound water and other volatile compounds from the sample. The exothermic peak beginning at 450 °C with a maximum of 582 °C corresponds to an 80% mass loss from the ash sample (Figure 2a). This broad exothermic peak is the result of the oxidation/combustion of pure coal ash. The exothermic peak in the DTA curve is not symmetric; the local maximum is visible at around 700 °C, indicating two steps of decomposition. Despite this, it can be seen that the DTA curve continues to increase in the range above 900 °C. However, loss from the mass sample was not detected in this area of the TGA curve. This change in energy may be due to some structural changes in the sample. Similar thermal behaviour was noticed for the ash samples that inclided mixtures with patent fuel: samples 2 and 3 (shown in Figure 2b,c). However, during the temperature interval between 320 and 1100 °C, more significant changes in the two-step decomposition of samples (Figure 3) were identified as a consequence of the presence of patent fuel in the samples. These changes were particularly emphasized in the ash sample with a higher content of patent fuel (sample 3).
A comparison of the DTA thermograms of all three samples is presented in Figure 3.
The TGA/DTA curves of the ash samples taken from the fuel mixtures exhibit minor overlapping but offer a better differentiation between mass and energy changes with temperature compared to the pure coal ash. Nonetheless, an additional energetic component in the ash with patent fuel was observed in the temperature range of approximately 800 °C, resulting in increased energy production.

3.3. Leaching Tests

For these tests, batch leaching was conducted using both ultra-pure water and synthetic acid rain [50]. The leaching was carried out for set durations of 7 days, one month, and three months, after which the obtained leachates were separated from the residues, and their pH values were measured. The pH values continued to decrease throughout the leaching period, reaching their lowest point at the end of the three-month period.
Figure 4 and Figure 5 illustrate the changes in pH value with the leaching time of the ash samples in ultra-pure water and acid rain. In both cases, the pH values increased after a leaching period of 7 days due to the dissolving of alkaline oxides, such as CaO, MgO, Li2O, Na2O, K2O, and BaO. After 30 days of leaching, pH values began to decrease due to various reactions in the water–ash system, such as the dissolving, hydrolysis, precipitation, and sorption of some elements from water to ash particles [51,52]. The pH value of the leachate and the concentration of metals in leachate are inversely related, and the pH value can significantly vary with the source of fly ash [53,54].
Table 8 shows the results of the measurement of the conductivity of leachates after a three-month leaching period. It is assumed that a precipitation reaction occurred in the leachates due to hydrolysis reactions caused by dissolved elements and hydroxide ions in the acid rain (Figure 6). Additionally, the particles in the ash samples absorbed certain elements from the solution, leading to a reduction in the conductivity of the acid rain solutions. These combined reactions resulted in a decrease in the conductivity of the acid rain solutions.

3.3.1. Leaching in Ultra-Pure Water

The concentrations of elements obtained in the ultra-pure water show increased concentrations of major and trace elements during the whole leaching period (shown in Figure 6 and Figure 7).
Figure 6 presents a comparison between the concentrations of Na, Mg, K, and Ca in leachates after leaching periods of 7 days, one month, and three months.
Figure 7 presents the concentration of potential toxicological elements in ultra-pure water leachate (As, Cr, Cu, Fe, Ni, Pb, and Se), which may negatively impact human health and the environment [13].
The highest concentrations for all three samples after a leaching period of three months were measured for Ca (5339.53, 6790.67, and 8022.96 mg/kg for sample 1, 2, and 3, respectively); Al (13.53, 1015.90, and 2992.41 mg/kg for sample 1, 2, and 3, respectively); and K (3174.94, 1404.07, and 764.51 mg /kg for sample 1, 2, and 3, respectively).
Interestingly, the addition of the patent fuel significantly reduced the As (arsenic) level in the ash leachates. Among the three samples, the highest concentration of As was found in the leachate of sample 1 (2.32 mg/kg) after a leaching period of three months. On the other hand, the concentration of As in the leachates of samples 2 and 3 was significantly lower, at 0.06 mg/kg and 0.02 mg/kg, respectively. This observation may have implications for the environmental impact of the combustion process.
In the leachates of sample 2 and sample 3, the highest trace element concentration was measured for Cu. After three months of leaching, the Cu levels in the leachates of samples 2 and 3 were 1.25 and 0.97 mg/kg, respectively. Also, in these leachates, considerable increases in the Cr (0.75 mg/kg for sample 2, and 0.86 mg/kg for sample 3) and Fe contents (0.61 mg/kg for sample 2, and 0.89 mg/kg for sample 3) were determined.
In the leachate of sample 3, an increase in Se content was detected, and its final concentration after three months of leaching was 0.41 mg/kg. After the same period, the Se concentrations in the leachates were 0.11 mg/kg for sample 1 and 0.16 mg/kg for sample 2.

3.3.2. Leaching in Synthetic Acid Rain

Figure 8 and Figure 9 present a comparison between the concentrations of the main (Na, Mg, K, Ca) and trace elements (As, Cr, Cu, Fe, Ni, Pb, Se) in the acid rain leachates after leaching periods of 7 days, one month, and three months.
Although it was anticipated that the concentration of elements in leachates would increase throughout the leaching period, it has been observed that the concentration of certain elements has either stagnated or decreased after one month of leaching. The most significant decreases were observed for K, Mg, and Cu. This decrease can be explained by the precipitation process of these cations with anions present in the solution.
The highest values in the acid rain leachates after three months of leaching were measured for Ca (5445.77 mg/kg in sample 1; 6795.46 mg/kg in sample 2; and 10,437.34 mg/kg in sample 3), K (3077.41 mg/kg in sample 1; 1489.20 mg/kg in sample 2; and 714.76 mg/kg in sample 3), and Al (15.56 mg/kg in sample 1; 648.70 mg/kg in sample 2; and 1739.02 mg/kg in sample 3). These elements also had the highest concentration levels in the ultra-pure water leachates.
The highest concentration of trace elements was found to be Cu. Interestingly, the same Cu levels were observed in the ultra-pure water leachates. After a three-month leaching period, the Cu concentrations were 0.29, 0.73, and 3.79 mg/kg for samples 1, 2, and 3, respectively. After one month of leaching, the Cu content in the leachates of samples 1 and 2 started to decrease.
Increases in the concentrations of other elements were also shown. The highest increasing rates of concentrations were measured for Cr and As; their concentrations increased 30 times. The final concentrations of Cr were 0.39, 0.82, and 0.91 mg/kg for samples 1, 2, and 3, respectively, whereas the concentrations for As were 2.06, 0.17, and 0.06 mg/kg. A tendency towards increasing levels during the whole leaching period was also observed for Fe. After 7 days of leaching, the increase in the Fe concentration was 40–50%. The final concentrations of Fe were 0.70, 0.74, and 0.84 mg/kg in the leachates of samples 1, 2, and 3, respectively. Other significant increases in concentrations were noticed for Cd, Se, Ce, Tl, and Co.
It is important to mention that the leaching of As and U in both water and acid rain was observed only in the leachate of the pure coal ash and not in the leachate of the ash from the mixtures. Both leachates (ultra-pure water and acid rain) showed that the leachate of the pure coal ash contained higher concentrations of Li, K, V, Mn, Zn, As, Rb, Mo, Sb, Ba, and U. On the other hand, in the leachates from the mixtures (sample 2 and sample 3), the concentrations of Al, Ca, Cr, Cu, Se, Sr, and Zn were higher.
The affinity of different elements for leaching in ultra-pure water or acid rain was determined by calculating the total amount of leached-out metal ions. The following metal ions were considered: Li, Be, Na, Mg, Al, K, Ca, V, Cr, Mn, Fe, Co, Ni, Cu, Zn, As, Se, Rb, Mo, Ag, Cd, Sb, Ba, Ce, Tl, Pb, Bi, and U. The results obtained from both leachates are presented in Figure 10 and Figure 11.
Most elements have a higher tendency to leach in acid rain than in water, particularly Co, Ag, Cd, Ce, Tl, Pb, and Bi. Co showed the biggest difference, leaching 13 times better in acid rain than in water, followed by Ag and Cd, which leached 7 times better in acid rain. However, for V and Rb, better leaching was observed in water compared to acid rain.
In Figure 10, it can be seen that the concentration of ions in the ultra-pure water leachates increased over time. This increase is more noticeable in the leachates of samples 2 and sample 3 (ash samples resulting from the combustion of coal and patent fuel) and less in the leachate of the pure steam coal.
In Figure 11, it can be seen that the concentration of ions in acid rain changes similarly to leaching in water. However, after 30 days of leaching, the overall ion concentration begins to decrease. This is due to certain elements reacting with precipitation and being absorbed by ash particles. The decrease is more evident for the pure coal sample (sample 1) and sample 2, while for sample 3, it is smoother.
The release of trace elements from ash into the solution, as well as the rate of release, is influenced by three factors [55]:
  • The concentration of elements in the solid phases;
  • The distribution of elements among ash particles;
  • The possibility of the incorporation of elements into secondary solids.
The ratios of the content of trace elements in leachates after the overall leaching period to the total content of trace elements in ash samples (wleach/wash × 100) were also calculated for ultra-pure water and acid rain. The results show that all ratios are below 1% except for Cu (1.32–7.97%), Se (3.28–12.42%), Sr (12.44–24.60%), and V (1.14–17.60%), which indicates that these elements have the highest leaching activity. From an environmental perspective, special consideration should be applied to these elements during ash disposal.

4. Conclusions

This study aimed to evaluate the effect that adding patent fuel to steam coal has on the composition and properties of the ash resulting from combustion. The conclusions of this research are summarised below:
(1)
Patent fuel can absorb sulphur from flue gases during combustion, with 0.85 mas.% of sulphur in the ash sample after the combustion of pure steam coal (Sample 1) compared to 1.44 mas.% in the ash sample (Sample 3) after the combustion of 0.44 kg steam coal with ten ampoules of patent fuel.
(2)
The addition of patent fuel led to lower concentrations of trace elements in the ash, specifically for the elements Ba, Cr, Ga, Li, Mn, V, and Zn. For Ba, Ga, and Zn, the reduction in these elements in the ash produced by patent fuel–coal combinations compared to the ash produced by pure coal combustion was up to 70%.
(3)
Qualitative XRD diffraction identified that the main mineral phase in ash samples is quartz (SiO2). Other minor mineral components were mulite (3Al2O3 × 2SiO2), calcite (CaCO3), lime (CaO), anhydrite (CaSO4), and hematite (Fe2O3). Ash samples after the combustion of mixtures of coal and patent fuel also had cristobalite (SiO2), portlandite (Ca(OH)2), and rutile (TiO2).
(4)
Adding patent fuel to coal results in an earlier start of decomposition, stronger combustion, and faster oxidation, resulting in the release of more energy in the same temperature range.
(5)
The leaching tests revealed that most of the elements, particularly Co, Ag, Cd, Ce, Tl, Pb, and Bi, were found to leach more easily in acid rain compared to water. Co showed the biggest difference, with thirteen times better leaching in acid rain than in water, followed by Ag and Cd with seven times better leaching in acid rain.
(6)
The leaching characteristics of the measured elements were found to be dependent on the pH value.
(7)
The coal ash leachates contained higher levels of environmental pollutants, including As, Cd, Co, Mn, Mo, Sb, and U, than the patent fuel leachates.
After conducting a comprehensive series of tests, the key findings of this study indicate that the addition of a patent fuel to steam coal significantly enhances its properties during combustion. This not only improves the efficiency of the process but also reduces the negative environmental impact associated with ash disposal.

Author Contributions

Investigation, writing—Original draft, formal analysis, validation—M.T.; Conceptualization and supervision—L.Ć.; Writing—Review and editing—D.A.; Formal Analysis—M.U.B.; Formal Analysis—I.V.V.; Formal Analysis—S.M.M. All authors have read and agreed to the published version of the manuscript.

Funding

This research received no external funding.

Institutional Review Board Statement

Not applicable.

Informed Consent Statement

Not applicable.

Data Availability Statement

Data are contained within the article.

Acknowledgments

This study has been supported by the Croatian Ministry of Science, Education and Sports—Project no. 120-1201833-1789.

Conflicts of Interest

Author Sanja Matečić Mušanić was employed by the company ZGI d.o.o. The remaining authors declare that the research was conducted in the absence of any commercial or financial relationships that could be construed as a potential conflict of interest.

References

  1. IEA. Coal 2023 Analysis and Forecast to 2026. Available online: https://www.iea.org/reports/coal-2023 (accessed on 3 March 2024).
  2. Uyanik, S.; Dogerlioglu Isiksungur, O. How Realistic Are Coal Phase-Out Timeline Targets for Turkey? Sustainability 2024, 16, 1649. [Google Scholar] [CrossRef]
  3. Chicherin, S.; Zhuikov, A.; Kuznetsov, P. The Return of Coal-Fired Combined Heat and Power Plants: Feasibility and Environmental Assessment in the Case of Conversion to Another Fuel or Modernizing an Exhaust System. Sustainability 2024, 16, 1974. [Google Scholar] [CrossRef]
  4. Alhassan, A.; Ozturk, I.; Fahmi AL-Zyoud, M.; Bekun, F.V. Coal consumption-environmental sustainability nexus in developed and developing major coal-consuming economies. Heliyon 2024, 10, E25619. [Google Scholar] [CrossRef] [PubMed]
  5. European Commission. A European Green Deal. Available online: https://commission.europa.eu/strategy-and-policy/priorities-2019-2024/european-green-deal_en (accessed on 5 March 2024).
  6. European Commission. In focus: Towards a Just and Clean Energy Transition. Available online: https://commission.europa.eu/news/focus-towards-just-and-clean-energy-transition-2020-10-01_en (accessed on 5 March 2024).
  7. Nakamura, T.; Maruyama, A.; Masuda, S.; Lloyd, S. The Impact of Russia’s Invasion of Ukraine on Germany’s Energy Choice Attitudes among Residents in German States with Nuclear Power Plants in Commission or Decommissioned. Sustainability 2024, 16, 1999. [Google Scholar] [CrossRef]
  8. Gajdzik, B.; Wolniak, R.; Nagaj, R.; Žuromskaitė-Nagaj, B.; Grebski, W.W. The Influence of the Global Energy Crisis on Energy Efficiency: A Comprehensive Analysis. Energies 2024, 17, 947. [Google Scholar] [CrossRef]
  9. Shu, L.; Wang, H.; He, X. Physicochemical Properties and Planting Performance of Artificial Soil Developed from Multiple Coal-Based Solid Waste Materials. Sustainability 2024, 16, 1955. [Google Scholar] [CrossRef]
  10. Pandey, S.P.; Yu, H.; Lau, C.; Ng, K. New Coal Char-Based Building Products: Manufacturing, Engineering Performance, and Techno-Economic Analysis for the USA Market. Sustainability 2024, 16, 1854. [Google Scholar] [CrossRef]
  11. Goodarzi, F. Mineralogy, elemental composition and modes of occurrence of elements in Canadian feed-coals. Fuel 2002, 81, 1199–1213. [Google Scholar] [CrossRef]
  12. Srinivasa Reddy, M.; Basha, S.; Joshi, H.V.; Jha, B. Evaluation of the emission characteristics of trace metals from coal and fuel oil fired power plants and their fate during combustion. J. Hazard. Mater. 2005, 123, 242–249. [Google Scholar] [CrossRef]
  13. Vejahati, F.; Xu, Z.; Gupta, R. Trace elements in coal: Associations with coal and minerals and their behavior during coal utilization—A review. Fuel 2010, 89, 904–911. [Google Scholar] [CrossRef]
  14. Nelson, P.F.; Shah, P.; Strezov, V.; Halliburton, B.; Carras, J.N. Environmental impacts of coal combustion: A risk approach to assessment of emissions. Fuel 2010, 89, 810–816. [Google Scholar] [CrossRef]
  15. Van Heek, K.H. Progress of coal science in the 20th century. Fuel 2000, 79, 1–26. [Google Scholar] [CrossRef]
  16. Ma, L.; Fan, J.; Guo, R.-Z.; Zhang, P.-Y.; Li, C.-H. Characteristics of fires in coal mine roadways and comparative analysis of control effectiveness between longitudinal ventilation and cross-section sealing. Case Stud. Therm. Eng. 2024, 53, 103878. [Google Scholar] [CrossRef]
  17. Deng, J.; Qu, G.; Ren, S.; Wang, C.; Su, H.; Yuan, Y.; Duan, X.; Yang, N.; Wang, J. Effect of water soaking and air drying on the thermal effect and heat transfer characteristics of coal oxidation at the low-temperature oxidation stage. Energy 2024, 288, 129705. [Google Scholar] [CrossRef]
  18. Sushil, S.; Batra, V.S. Analysis of fly ash heavy metal content and disposal in three thermal power plants in India. Fuel 2006, 85, 2676–2679. [Google Scholar] [CrossRef]
  19. Armesto, L.; Merino, J.L. Characterization of some coal combustion solid residues. Fuel 1999, 78, 613–618. [Google Scholar] [CrossRef]
  20. Goodarzi, F. Morphology and chemistry of fine particles emitted from a Canadian coal- fired power plant. Fuel 2006, 85, 273–280. [Google Scholar] [CrossRef]
  21. Wan, X.; Wang, W.; Ye, T.; Guo, Y.; Gao, X. A study on the chemical and mineralogical characterization of MSWI fly ash using a sequential extraction procedure. J. Hazard. Mater. 2006, 134, 197–201. [Google Scholar] [CrossRef] [PubMed]
  22. Nathan, Y.; Dvorachek, M.; Pelly, I.; Mimran, U. Characterization of coal fly ash from Israel. Fuel 1999, 78, 205–213. [Google Scholar] [CrossRef]
  23. Koukouzas, N.; Ketikidis, C.; Itskos, G. Heavy metal characterization of CFB- derived coal fly ash. Fuel Process. Technol. 2011, 92, 441–446. [Google Scholar] [CrossRef]
  24. Medina, A.; Gamero, P.; Querol, X.; Moreno, N.; Leon, B.; Almanza, M.; Vargas, G.; Izquierdo, M.; Font, O. Fly ash from a Mexican mineral coal I: Mineralogical and chemical characterization. J. Hazard. Mater. 2010, 181, 82–90. [Google Scholar] [CrossRef]
  25. Lewandowski, J.; Kalkreuth, W. Chemical and petrographical characterization of feed coal, fly ash and bottom ash from the FigueiraPower Plant, Paraná, Brazil. Int. J. Coal Geol. 2009, 77, 269–281. [Google Scholar] [CrossRef]
  26. Querol, X.; Umana, J.C.; Alustuey, A.; Bertrana, C.; Lopez-Soler, A.; Plana, F. Physicochemical Characterization of Spanish Fly Ashes. Energ. Source Part A 2010, 21, 883–898. [Google Scholar] [CrossRef]
  27. Vassilev, S.V.; Vassileva, C.G. Methods for Characterization of Composition of Fly Ashes from Coal- Fired Power Stations: A Critical Overview. Energ. Fuel 2005, 19, 1084–1098. [Google Scholar] [CrossRef]
  28. Marrero, J.; Polla, G.; Rebagliati, R.J.; Pla, R.; Gomez, D.; Smichowski, P. Characterization and determination of 25 elements in fly ashes collected in a thermal power plant in Argentina using different instrumental techniques. Spectrochim. Acta 2007, 62, 101–108. [Google Scholar] [CrossRef]
  29. Vassilev, S.V.; Tascon, J.M.D. Methods for Characterization of Inorganic and Mineral Matter in Coal: A Critical Overview. Energy Fuels 2003, 17, 271–281. [Google Scholar] [CrossRef]
  30. Koukouzas, N.; Hämäläinen, J.; Papanikolaou, D.; Tourunen, A.; Jäntti, T. Mineralogical and elemental composition of fly ash from pilot scale fluidised bed combustion of lignite, bituminous coal, wood chips and their blends. Fuel 2007, 86, 2186–2193. [Google Scholar] [CrossRef]
  31. Izquierdo, M.; Querol, X. Leaching behaviour of elements from coal combustion fly ash: An overview. Int. J. Coal Geol. 2011, 94, 54–66. [Google Scholar] [CrossRef]
  32. Moreno, N.; Querol, X.; Andrés, J.M.; Stanton, K.; Towler, K.; Nugteren, H.; Janssen- Jurkovicova, M.; Jones, R. Physico- chemical characteristics of European pulverized coal combustion fly ashes. Fuel 2005, 84, 1351–1363. [Google Scholar] [CrossRef]
  33. Ćosić, D. Vodikovo gorivo kao ekološki doprinos funkcioniranju postojećih termoelektrana na ugljen. In Proceedings of the 18th Forum: Day of Energy in Croatia, HED, Zagreb, Croatia, 18 November 2009. [Google Scholar]
  34. Ćosić, D.; Rakin, P. Vodonično gorivo kao ekološki doprinos funkcionisanju postojećih termoelektrana na ugalj. In Proceedings of the Zbornik Radova Hrvati u BIH Danas, Banja Luka, Bosnia and Herzegovina, 6 March 2011. [Google Scholar]
  35. Dobrović, S.; Švaić, S.; Ljubas, D.; Juretić, H.; Rodić, A. Report on Applicability of Patented Fuel Hydrogen-Industrial; Faculty of Mechanical Engineering and Naval Architecture, University of Zagreb: Zagreb, Croatia, 2011. [Google Scholar]
  36. ASTM D 4326-21; Standard Test Method for Major and Minor Elements in Coal and Coke Ash by X-ray Fluorescence. American Society for Testing and Materials: West Conshohocken, PA, USA, 2013.
  37. Trkmić, M.; Ćurković, L.; Ašperger, D. Chemical analysis of solid residue from liquid and solid fuel combustion: Method development and validation. Materialwiss. Werkst. 2012, 43, 503–510. [Google Scholar] [CrossRef]
  38. Iwashita, A.; Nakajima, T.; Takanashi, H.; Ohki, H.; Fujita, Y.; Yamashita, T. Determination of trace elements in coal and coal fly ash by joint- use of ICP-AES and atomic absorption spectrometry. Talanta 2007, 71, 251–257. [Google Scholar] [CrossRef]
  39. Wang, J.; Nakazato, T.; Sakanishi, K.; Yamada, O.; Tao, H.; Saito, I. Single-step microwave digestion with HNO3 alone for determination of trace elements in coal by ICP spectrometry. Talanta 2006, 68, 1584–1590. [Google Scholar] [CrossRef]
  40. Wang, J.; Nakazato, T.; Sakanishi, K.; Yamada, O.; Tao, H.; Saito, I. Microwave digestion with HNO3/H2O2 mixture at high temperatures for determination of trace elements in coal by ICP-OES and ICP-MS. Anal. Chim. Acta 2004, 514, 115–124. [Google Scholar] [CrossRef]
  41. Iwashita, A.; Nakaijima, T.; Takanashi, H.; Ohki, A.; Fujita, Y.; Yamashita, T. Effects of pretreatment conditions on the determination of major and trace elements in coal fly ash using ICP-AES. Fuel 2006, 85, 257–263. [Google Scholar] [CrossRef]
  42. Sandroni, V.; Smith, C.M.M. Microwave digestion of sludge, soil and sediment samples for metal analysis by inductively coupled plasma-atomic emission spectrometry. Anal. Chim. Acta 2002, 468, 335–344. [Google Scholar] [CrossRef]
  43. Das, A.K.; Chakraborty, R.; Guardia, M.; Cerera, M.L.; Goswami, D. ICP-MS multielement determination in fly ash after microwave-assisted digestion of samples. Talanta 2001, 54, 975–981. [Google Scholar] [CrossRef] [PubMed]
  44. Xu, Y.H.; Iwashita, A.; Nakajima, T.; Yamashita, H.; Takanashi, H.; Ohki, A. Effect of HF addition on the microwave-assisted acid-digestion for the determination of metals in coal by inductively coupled plasma- atomic emission spectrometry. Talanta 2005, 66, 58–64. [Google Scholar] [CrossRef]
  45. Font, O.; Moreno, N.; Querol, X.; Izquierdo, M.; Alvarez, E.; Diez, S.; Elvira, J.; Antenucci, D.; Nugteren, H.; Plana, F.; et al. X-ray powder diffraction- based method for the determination of the glass content and mineralogy of coal (co)-combustion fly ashes. Fuel 2010, 89, 2971–2976. [Google Scholar] [CrossRef]
  46. Kim, A.G.; Hesbach, P. Comparison of fly ash leaching method. Fuel 2009, 88, 926–937. [Google Scholar] [CrossRef]
  47. Dutta, B.K.; Khanra, S.; Mallick, D. Leaching of elements from coal fly ash: Assessment of its potential for use in filling abandoned coal mines. Fuel 2009, 88, 1314–1323. [Google Scholar] [CrossRef]
  48. Raman, N.; Sathiyanarayanan, D. An USEPA approach of heavy metal analysis in solid waste by multiple extraction procedure using synthetic acid rain as extraction fluid. Rasayan J. Chem. 2010, 3, 539–544. [Google Scholar] [CrossRef]
  49. USEPA Method 1320 Multipleextraction procedure, Publication SW-846: Test methods for Evaluating Solid Waste, Physical/Chemical Methods, Washington, DC, USA. 1986. Available online: https://www.epa.gov/sites/default/files/2015-12/documents/1320.pdf (accessed on 3 March 2024).
  50. Hesbach, P.A.; Kim, A.G.; Abel, A.S.P.; Lamey, S.C. Serial batch procedure for characterization of coal fly ash. Environ. Monit. Asses. 2010, 168, 523–545. [Google Scholar] [CrossRef]
  51. Jegadeesan, G.; Al-Abed, S.R.; Pinto, P. Influence of trace metal distribution on its leachability from coal fly ash. Fuel 2008, 87, 1887–1893. [Google Scholar] [CrossRef]
  52. Gitari, W.M.; Fatoba, O.O.; Petrik, L.F.; Vadapalli, V.R.K. Leaching characteristics of selected South African fly ashes: Effect of pH on the release of major and trace species. J. Environ. Sci. Health Part A 2009, 44, 206–220. [Google Scholar] [CrossRef]
  53. Palumbo, A.V.; Tarver, J.R.; Fagan, L.A.; McNeilly, M.S.; Ruter, R.; Fisher, L.S.; Amonette, J.E. Comparing metal leaching and toxicity from high pH, low pH, and high ammonia fly as. Fuel 2007, 86, 1623–1630. [Google Scholar] [CrossRef]
  54. Pathan, S.M.; Aylmore, L.A.G.; Colmer, T.D. Properties of Several Fly Ash Materials in Relation to Use as Soil Amendments. J. Environ. Qual. 2003, 32, 687–693. [Google Scholar] [CrossRef]
  55. Jankowski, J.; Ward, C.R.; French, D.; Groves, S. Mobility of trace elements from selected Australian fly ashes and its potential impact on aquatic ecosystems. Fuel 2006, 85, 243–256. [Google Scholar] [CrossRef]
Figure 1. XRD pattern of (a) sample 1—pure coal ash sample; (b) sample 2—ash sample after combustion block of 0.54 kg steam coal + 8 ampoules of patent fuel; (c) sample 3—ash sample after combustion block of 0.44 kg steam coal + 10 ampoules of patent fuel.
Sustainability 16 04413 g001aSustainability 16 04413 g001b
Figure 2. TGA/DTA thermograms for (a) sample 1—pure coal ash; (b) sample 2—ash sample after combustion block of 0.54 kg steam coal + 8 ampoules of patent fuel; (c) sample 3—ash sample after combustion block of 0.44 kg steam coal + 10 ampoules of patent fuel. The temperature is expressed in degrees Celsius (°C). Green lines present weight loss (TGA line) in % of each sample due to temperature increase, while blue lines present Temperature Difference (DTA line), expressed in °C/mg for each sample.
Sustainability 16 04413 g002aSustainability 16 04413 g002b
Figure 3. DTA thermograms of ash samples: sample 1—pure coal ash; sample 2—ash sample after combustion block of 0.54 kg steam coal + 8 ampoules of patent fuel; sample 3—ash sample after combustion block of 0.44 kg steam coal + 10 ampoules of patent fuel.
Sustainability 16 04413 g003
Figure 4. Changes in pH value with leaching time of ash samples in ultra-pure water (mean values and standard deviation intervals).
Sustainability 16 04413 g004
Figure 5. Changes in pH value with leaching time of ash samples in synthetic acid rain (mean values and standard deviation intervals).
Sustainability 16 04413 g005
Figure 6. The amount of Na, Mg, K, and Ca, given in mg of metals (Me) per kg of ash sample, leached from the ash samples in ultra-pure water as a function of leaching time.
Sustainability 16 04413 g006
Figure 7. The amounts of As, Cr, Cu, Fe, Ni, Pb, and Se, given in mg of metals (Me) per kg of ash sample, that leached out of the ash samples in ultra-pure water as a function of leaching time.
Sustainability 16 04413 g007
Figure 8. The amount of metals (Me: Na, Mg, K, and Ca) leached out of ash samples in acid rain as a function of leaching time, given in mg of Me per kg of ash sample.
Sustainability 16 04413 g008
Figure 9. The amount of metals (Me: As, Cr, Cu, Fe, Ni, Pb, and Se) leached out of ash samples in acid rain as a function of leaching time, given in mg of Me per kg of ash sample.
Sustainability 16 04413 g009
Figure 10. Correlation between the sum of the amount of leached-out Me ions (Me: Li, Be, Na, Mg, Al, K, Ca, V, Cr, Mn, Fe, Co, Ni Cu, Zn, As, Se, Rb, Se, Mo, Ag, Cd, Sb, Ba, Ce, Tl, Pb, Bi, and U) and leaching time of ash samples in ultra-pure water.
Sustainability 16 04413 g010
Figure 11. Correlation between the sum of the amount of leached-out Me ions (Me: Li, Be, Na, Mg, Al, K, Ca, V, Cr, Mn, Fe, Co, Ni Cu, Zn, As, Se, Rb, Se, Mo, Ag, Cd, Sb, Ba, Ce, Tl, Pb, Bi and U) and leaching time of ash samples in acid rain.
Sustainability 16 04413 g011
Table 1. Proximate and ultimate analyses of used coal.
ParametersTest MethodsResults
Surface moistureASTM D 33022.96%
Inherent moistureASTM D 31733.25%
Total moistureASTM D 33026.21%
Ash contentISO 117110.04%
Volatile matterISO 56234.06%
C-fixby calculation49.68%
Total sulphurASTM D 42391.43%
C contentASTM D 537370.00%
H contentASTM D 53735.18%
N contentASTM D 53731.42%
O contentby calculation5.72%
Gross calorific valueISO 192827.97 MJ/kg
Net calorific valueISO 192826.69 MJ/kg
Emission factorEC 2018/206696.17 tCO2/TJ
Table 2. Ash samples from combustion in the experimental combustion chamber.
No.Sample DescriptionMasss (Sample)/gDay of Experiment
1.Bottom ash after hard coal combustion5001st day of combustion
2.Bottom ash
Mixture: packages with a ratio of 0.44 kg hard coal + 10 ampoules
500
3.Bottom ash
Mixture: packages with a ratio of 0.54 kg hard coal + 8 ampoules
500
4.Bottom ash from combustion chamber, after cleaning the combustion remains from the previous day.5002nd day of combustion
5.Bottom ash
Mixture: packages with a ratio of 0.54 kg hard coal + 8 ampoules
500
6.Bottom ash
Mixture: packages with a ratio of 0.44 kg hard coal + 10 ampoules
500
7.Samples from the filter: 3 quartz filters with ash and soot from the flue gases—after hard coal combustion.0.06
8.Samples from the filter: 2 quartz filters with ash and soot from the flue gases—after combustion of 0.54 kg hard coal + 8 ampoules.0.02
9.Samples from the filter: 1 quartz filter with ash and soot from the flue gases—after combustion of 0.44 kg hard coal + 10 ampoules.0.06
Table 3. Ash samples for characterization and leaching tests.
SamplesDescription
Sample 1Ash sample after combustion of pure steam coal
Sample 2Ash sample after combustion block of 0.54 kg steam coal + 8 ampoules of patent fuel
Sample 3Ash sample after combustion block of 0.44 kg steam coal + 10 ampoules of patent fuel
Table 4. Certified and found values in µg/kg obtained for Standard Reference Materials: River Water Reference Material for Trace Metals (SLRS-5) and Trace Elements in Water (SRM 1643a) together with detection limits (DLs) of elements (in µg/kg).
ElementDLsSLRS-5SRM 1643e
Certified
(Mean ± SD)
Found
(Mean ± SD)
% DCertified
(Mean ± SD)
Found
(Mean ± SD)
% D
Li0.0116-0.28 ± 0.02-17.00 ± 1.7017.22 ± 0.23101.3
Be0.00090.005 20.003 ± 0.00161.913.64 ± 0.168.91 ± 0.1165.3
Na 11.81025.38 ± 0.104.75 ± 0.0288.420.23 ± 0.2520.01 ± 0.8298.9
Mg 10.62402.54 ± 0.162.28 ± 0.1489.77.84 ± 0.097.42 ± 0.1594.7
Al0.177449.50 ± 5.0050.12 ± 0.52101.3138.33 ± 8.40151.69 ± 0.60109.7
K 16.52700.84 ± 0.040.77 ± 0.0191.61.98 ± 0.032.01 ± 0.03101.1
Ca 14.651910.50 ± 0.409.66 ± 0.0492.031.50 ± 1.1032.77 ± 0.28104.0
V0.00070.32 ± 0.030.30 ± 0.0195.036.93 ± 0.5735.73 ± 0.2796.8
Cr0.00520.21 ± 0.020.22 ± 0.02104.019.90 ± 0.2321.21 ± 0.16106.6
Mn0.00534.33 ± 0.184.17 ± 0.0596.338.02 ± 0.4439.27 ± 0.29103.3
Fe0.243091.20 ± 5.8093.71 ± 0.74102.795.70 ± 1.4098.44 ± 5.57102.9
Co0.00060.05 20.05 ± 0.07102.126.40 ± 0.3227.04 ± 0.10102.4
Ni0.01380.48 ± 0.060.50 ± 0.02104.960.89 ± 0.6762.93 ± 0.74103.4
Cu0.097417.40 ± 1.3016.74 ± 0.0696.222.20 ± 0.3116.20 ± 0.1473.0
Zn0.91860.85 ± 0.090.86 ± 0.54101.676.50 ± 2.1093.22 ± 10.87121.9
As0.00160.41 ± 0.040.40 ± 0.0197.358.98 ± 0.7061.48 ± 1.36104.2
Se0.0029-0.04 ± 0.00-11.68 ± 0.1311.32 ± 0.4696.9
Rb0.0010-1.19 ± 0.01-13.80 ± 0.1713.80 ± 0.13100.0
Sr0.007153.60 ± 1.3052.92 ± 0.5198.7315.20 ± 3.50331.66 ± 2.50105.2
Mo0.02780.50 20.38 ± 0.0475.6118.50 ± 1.30119.75 ± 1.04101.1
Ag0.0007 0.01 ± 0.00-1.04 ± 0.070.78 ± 0.1575.2
Cd0.00020.006 ± 0.0010.007 ± 0.000123.36.41 ± 0.076.39 ± 0.0699.7
Sb0.00110.30 20.30 ± 0.01100.156.88 ± 0.6058.27 ± 0.63102.4
Ba0.040014.00 ± 0.5013.87 ± 0.1299.0531.00 ± 5.60554.59 ± 5.67104.4
Ce0.0005-0.31 ± 0.02--0.76 ± 0.02-
Tl0.0062-0.06 ± 0.00-7.26 ± 0.097.12 ± 0.3098.1
Pb0.00300.08 ± 0.010.09 ± 0.01116.619.15 ± 0.2018.09 ± 0.6994.5
Bi0.0033-0.03 ± 0.00-13.75 ± 0.1512.10 ± 0.5188.0
U0.00080.10 20.12 ± 0.03116.2-0.001 ± 0.000-
SD—standard deviations of measurements; DL—detection limits of method; %D- percentage difference between the observed concentration and the expected value; 1 certified and found values are expressed in mg kg−1. 2 The values shown are not certified, but included for informational purposes only.
Table 5. Elemental analysis and calorific values of the ash samples.
Samplewt.(S)/%wt.(C)/%wt.(H)/%wt.(N)/%Gross Calorific Value/MJ/kg
Sample 10.8559.800.481.0420.60
Sample 21.3763.070.481.1721.66
Sample 31.4464.800.311.0621.47
Table 6. Main and minor element content of the ash samples (wt.,%).
SampleTiO2Fe2O3Na2OMgOAl2O3SiO2P2O5SO3K2OCaO
Sample 11.286.450.71.818.2154.621.427.41.885.94
Sample 21.166.091.321.8915.148.421.288.151.8414.49
Sample 31.504.61.21.9215.9144.091.248.011.6419.62
Table 7. Concentration of trace elements in ash samples (mg/kg).
ElementSample 1Sample 2Sample 3
X ± SDX ± SDX ± SD
As<QL<QL<QL
Ba1053.34 ± 30.47321.78 ± 11.34312.76 ± 6.73
Cd7.87 ± 0.197.63 ± 0.597.57 ± 0.10
Co21.50 ± 0.4117.22 ± 0.8720.19 ± 0.65
Cr242.88 ± 2.39127.12 ± 6.84113.62 ± 2.92
Cu76.28 ± 1.0655.48 ± 3.6047.55 ± 1.29
Ga343.81 ± 0.96126.23 ± 6.48162.39 ± 1.66
Li110.78 ± 7.1170.59 ± 3.7375.10 ± 0.15
Mn320.67 ± 2.47114.81 ± 6.1697.04 ± 1.52
Ni154.69 ± 1.72134.34 ± 5.70117.36 ± 3.25
Pb48.58 ± 3.3135.46 ± 2.2341.80 ± 7.70
Se3.29 ± 1.163.05 ± 1.163.30 ± 0.47
Sr402.52 ± 9.19341.96 ± 13.85408.10 ± 3.68
Tl<QL<QL<QL
V420.19 ± 2.90207.14 ± 9.39277.96 ± 3.61
Zn93.51 ± 1.0827.98 ± 2.0327.23 ± 1.13
X—mean value of measurements; SD—standard deviation of measurements; QL—limit of quantification.
Table 8. Leachates’ conductivities after leaching period of three months (µS/cm).
LeachateSampleConductivity, µS/cm
Ultra-pure water1370.1
2394.30
3441.33
Acid rain1325.50
2398.67
3411.15
Disclaimer/Publisher’s Note: The statements, opinions and data contained in all publications are solely those of the individual author(s) and contributor(s) and not of MDPI and/or the editor(s). MDPI and/or the editor(s) disclaim responsibility for any injury to people or property resulting from any ideas, methods, instructions or products referred to in the content.

