Abstract
The land use change (LUC) and urbanization caused by human activities have markedly increased the occurrence of landslides, presenting significant challenges in accurately predicting landslide susceptibility despite decades of model advancements. This study, focusing on the Li River Valley (LRV) within the Yongding District, China, employs two common models, namely an analytic hierarchy process–comprehensive index (AHP-CI) model and a logistic regression (LR) model to assess landslide susceptibility (LS). The AHP-CI model is empirically based, with the advantage of being constructible and applicable at various scales without a dataset, though it remains highly subjective. The LR model is a statistical model that requires a training set. The two models represent heuristic and statistical approaches, respectively, to assessing LS. Meanwhile, the basic geological and environmental conditions are considered in the AHP-CI model, while the LR model accounts for the conditions of LUC and urbanization. The results of the multicollinearity diagnostics reflect the rationality of the predisposing factor selection (1.131 < VIF < 4.441). The findings reveal that the AHP-CI model underperforms in LUC and urbanization conditions (AUROC = 0.645, 0.628, and 0.667 for different validation datasets). However, when all the time-varying human activity predisposing factors are considered, the LR model (AUROC = 0.852) performs significantly better under the conditions of solely considering 2010 (AUROC = 0.744) and 2020 (AUROC = 0.810). The CA–Markov model was employed to project the future land use for the short-term (2025), mid-term (2030), and long-term (2040) planning periods. Based on these projections, maps of future LS were created. Importantly, this paper discussed the relationships between landslide management and regional sustainable development under the framework of the UN SDGs, which are relevant to Goal 1, Goal 11, Goal 13, and Goal 15. Finally, this study highlights the importance of integrating strategic land planning, reforestation efforts, and a thorough assessment of human impact predisposing factors with SDG-aligned LS predictions, advocating for a comprehensive, multi-stakeholder strategy to promote sustainable landslide mitigation.
1. Introduction
Since the economic reforms of 1987, China has experienced a swift phase of urban expansion. Some regions have witnessed a rise in geological hazards due to suboptimal urban planning and risk management practices [1,2,3,4]. Landslide susceptibility (LS) refers to the likelihood of landslide occurrences within a specific region, and landslide susceptibility assessment (LSA) involves forecasting the potential for future landslides by integrating both quantitative and qualitative approaches with pertinent factors that influence landslide events [5,6]. Currently, diverse models have been proposed for LSA, which can be categorized into heuristic, statistical, and deterministic models [7,8,9]. Heuristic methods, largely qualitative, utilize expert judgments and prior knowledge, exemplified by techniques such as the analytic hierarchy process (AHP) [10] and weighted linear combination (WLC) [11]. These methods, adaptable across various scales, often rely heavily on an expert understanding of landslides’ causes, introducing subjectivity and uncertainty into LSA [12,13]. Deterministic methods, on the other hand, quantify LS based on the physical principles governing slope stability [14,15]. They are pivotal for engineering design and understanding failure mechanisms, utilizing models like TRIGRS [16], SHALSTAB [17], SINMAP [18], and FSLAM [19]. Despite their precision, deterministic approaches are constrained by their requirement for detailed geotechnical or monitoring data and their applicability to largely homogenous slopes and simple landslide scenarios [4,20,21,22]. Statistical methods, including logistic regression (LR) [23], frequency ratios [24], weight of evidence [25], and artificial neural networks (ANNs) [26], predict future landslide occurrences by analyzing past events [6,27,28]. These approaches, particularly machine learning models, have become mainstream due to their objectivity and high performance. However, these methods, relying on historical data, are very accurate in considering static predisposing factors (e.g., lithology, aspect, and faults) but face challenges when dealing with changing environments and conditions, such as land use change (LUC) and urbanization [21,29,30,31].
Since 1980, human activities have triggered over 70% of landslides in urban areas across China [21]. The urbanization process exerts a significant strain on geological environments [32], subsequently elevating the risk of geological hazards [33]. Meanwhile, the land use types may rapidly change in areas of intense human activities, especially areas of urban expansion and farmland reclamation [34,35]. Hence, the influence of human interventions, particularly LUCs, on LS has been a focal point of numerous studies in recent years. For example, Pisano et al. [36] identified that alterations in land cover could compromise slope stability and modify the distribution of LS. Meneses et al. [37] determined that the precision of land use data significantly influences the accuracy of predicting LS for road networks. Xiong et al. [21] considered LUCs over different periods for LSA and discovered that models incorporating the latest land use and the changes therein exhibited higher model performance. They advocated for a collaborative approach between land managers and landslide managers, emphasizing the incorporation of future land use scenarios into the LSA framework. Recently, Pham et al. [38] adopted the above approach, forecasting land use in 2050, and utilized future land use as an predisposing factor for LSA. Hürlimann et al. [39] found that an increase in the land use of forest will significantly decrease LS despite more intense rainfall. Similar conclusions were also reached by Jurchescu et al. [40], who explored the impact of land use/cover changes on LS in Romania at the national level, finding that an increase in forest areas in the future will significantly reduce landslide risks. These pioneering studies have made significant contributions to understanding LUC in LSA.
However, on the one hand, while some studies highlight the significance of LUC and urbanization in LSA, and some studies such as Chowdhuri et al. [41] and Pham et al. [38] have considered LUC as a predisposing factor in LSA, their analyses of dynamic predisposing factors have not been comprehensive. Key time-varying human activity predisposing factors, such as road density and changes in the NDVI, have not been fully addressed. On the other hand, despite calls to integrate future land use scenarios into the LSA framework, as stated in Xiong et al. [21], case studies implementing this framework are still limited. Lastly, the aim of LSA is to facilitate improved sustainable landslide management for city development, which is linked with the United Nation’s Sustainable Development Goals (SDGs), particularly Goal 11 (Sustainable Cities and Communities) and Goal 15 (Life on Land) [42,43]. However, there is currently a lack of a comprehensive framework for integrating landslides, land use, and regional sustainable development [42,44].
Considering the above research gaps, this study will employ two typical heuristic and statistical models, namely the analytic hierarchy process–consistency index (AHP-CI) model and the LR model, to discuss the impact of changes in three time-varying human activity predisposing factors (changes in land type, the NDVI, and traffic density) on LSA by taking the Li River Valley in Yongding as a case study. The AHP-CI model is empirically based. Its advantage lies in the fact that it can be constructed without a dataset and applied at various scales, although it is highly subjective. On the other hand, the LR model is a statistical model that requires a training set. The two models represent heuristic and statistical approaches, respectively, to assessing LS. It should be emphasized that our intention is not to compare the relative performance of the AHP-CI and LR models. Instead, we aim to demonstrate how each model addresses landslide susceptibility in the context of changing environments (land use and urban expansion) from different perspectives. The AHP-CI model focuses on basic geological conditions and reflects “changes” across different landslide validation datasets. In contrast, the LR model considers changes within its predisposing factors and uses landslides from different periods as the training and validation set data. Additionally, the CA–Markov model will be used to predict future land use and to create LS maps for the short-term (2025), mid-term (2030), and long-term (2040) planning periods. Finally, a framework concerning land, landslides, and sustainable development has been proposed to comprehensively guide decision-makers in achieving urban sustainable development from the perspectives of geological hazard and land management. The Li River Valley (LRV) is a deep-cut valley area in the northwest of Hunan Province, China. Due to its complex geological structure and large topographic relief, landslides occur frequently in the LRV. The specific objectives include (1) comparing the ability of the AHP-CI model and the LR model to predict LS with current land use conditions and landslide data; (2) determining whether the time-varying human activity predisposing factors can improve the model prediction performance for LSA under LUCs and assessing their impact; and (3) using these findings to forecast land use and LS, offering strategies for landslide mitigation towards sustainable development.
2. Materials and Methods
2.1. Study Area
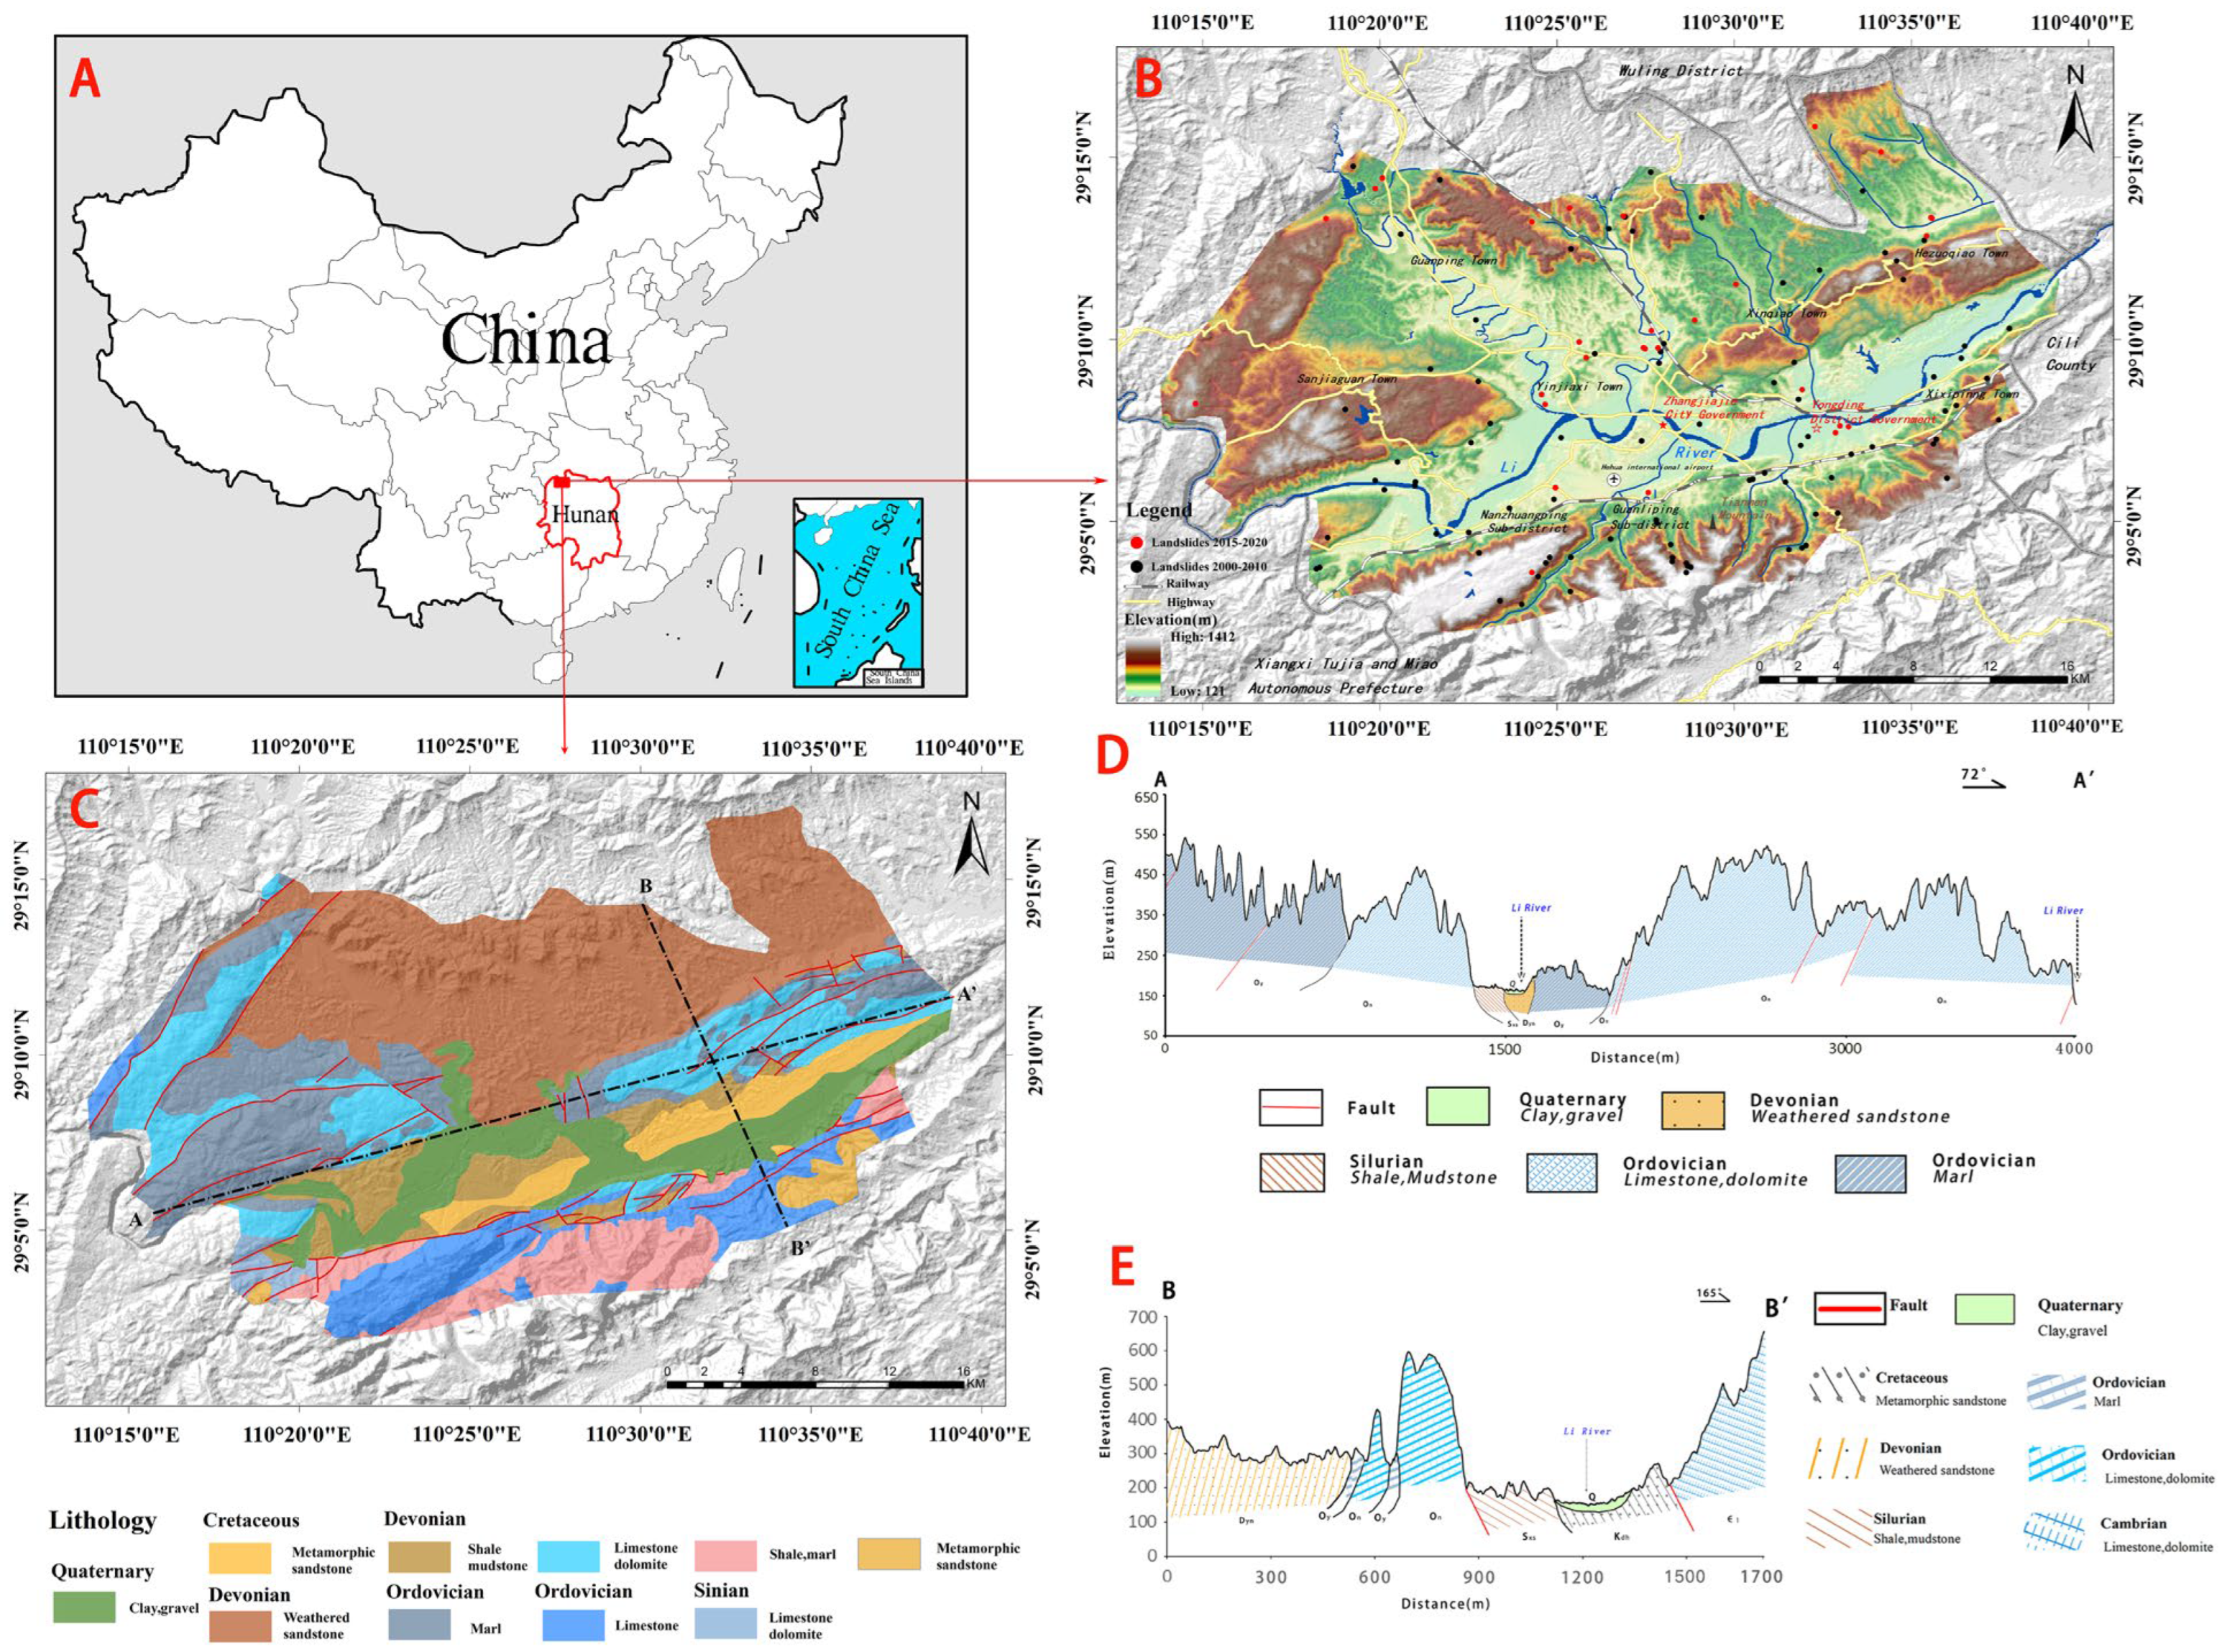
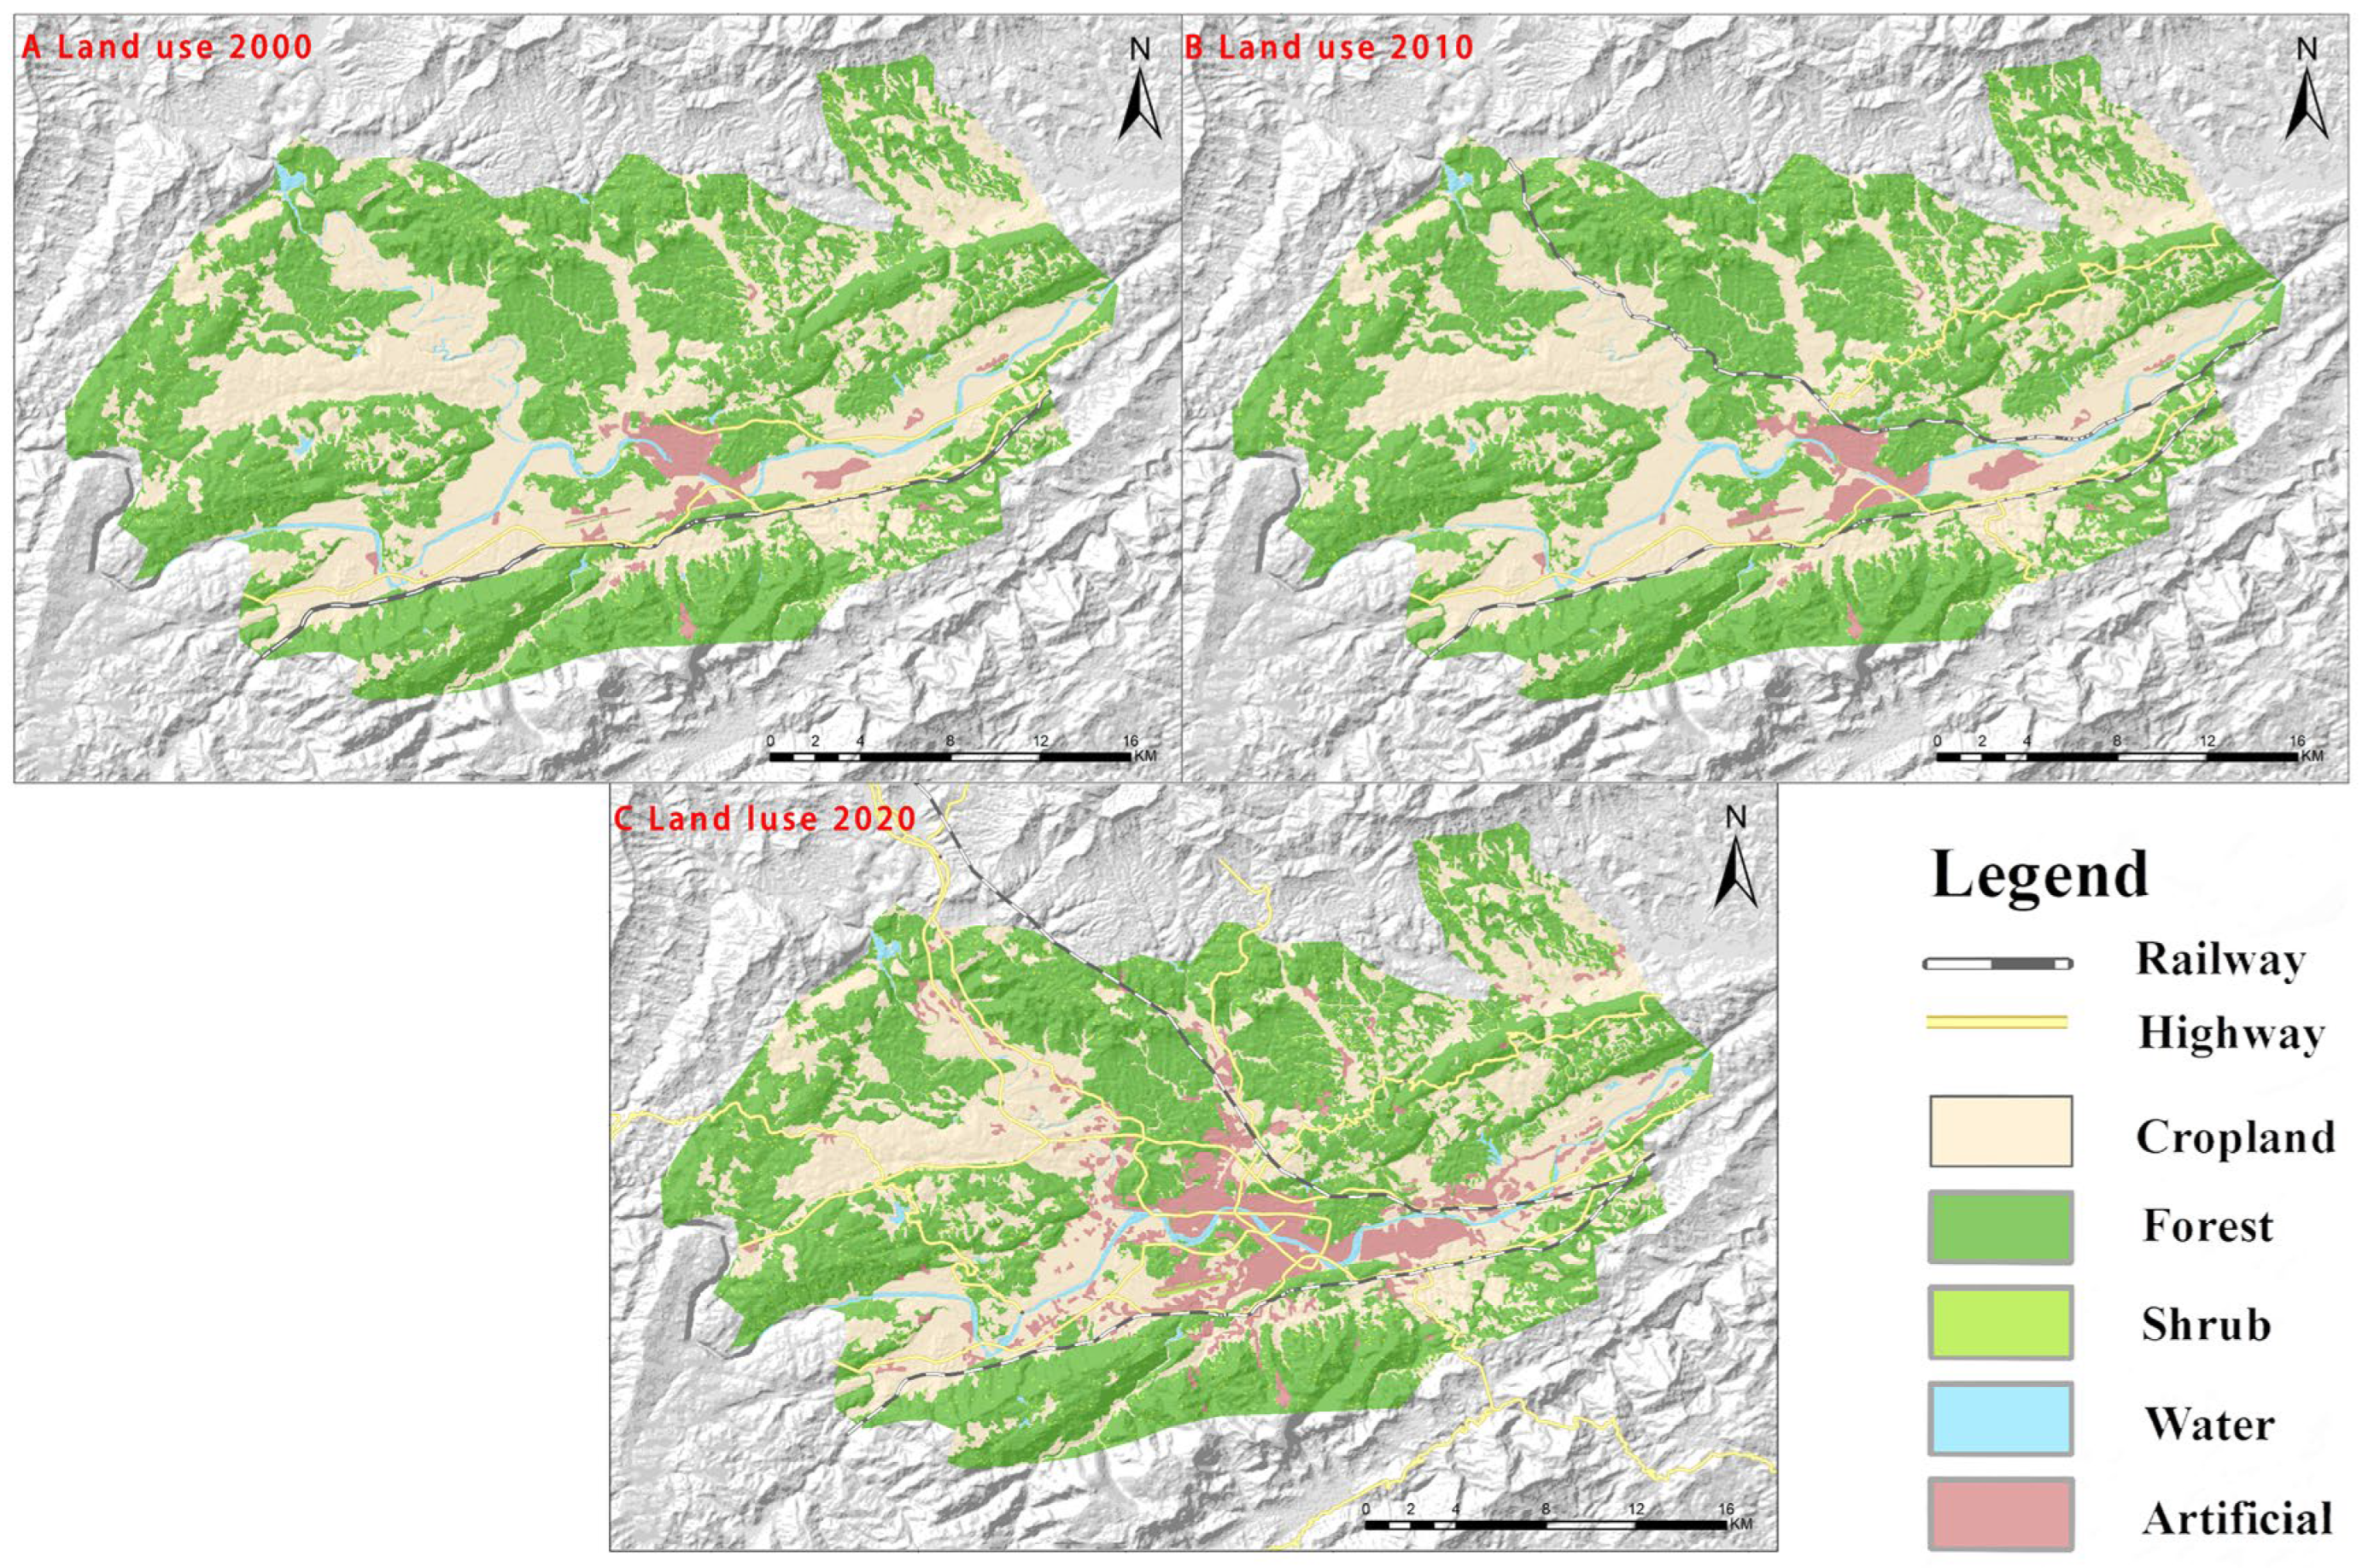
The LRV, covering approximately 680 km2, is situated within a pronounced valley in the northwest of Hunan Province (110°04′ E to 110°39′ E longitude and 28°01′ N to 29°18′ N latitude) (Figure 1). The region is characterized by a humid subtropical monsoon climate, with an average annual precipitation of approximately 1377.4 mm, which is relatively uniform across the area. Seasonal variability is marked, with spring and summer experiencing significant rainfall. Geomorphologically influenced by the Wuling Mountains and the Li River, the terrain exhibits a gradient from high in the northwest to low in the southeast, culminating in a central deep valley (Figure 1B,D,E). The area is traversed by multiple faults, predominantly following NE and NEE orientations. The northern mountainous zones predominantly feature heavily weathered Carboniferous sandstone and siltstone, whereas the valleys flanking the Li River predominantly comprise Quaternary sediments due to erosion and sediment accumulation. The areas with carbonate rocks display widespread dissolution in their tectonic topography, while tectonic denudation in the topography, primarily constituting metamorphic rocks and rocks with weak intercalations, emerges notably in the fault-affected zones (Figure 1C). The human activities within the LRV are significantly influenced by its topographical and geological makeup, with settlements and agricultural activities primarily concentrated along the Li River and its tributaries. Over time, as human encroachment has intensified, there has been a notable expansion in areas designated for shrubs, cropland, and artificial structures at the expense of forestland, evidencing significant LUCs (Figure 2).
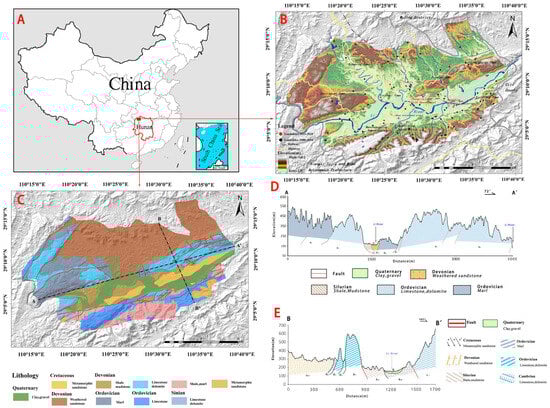
Figure 1.
Location and basic geological conditions of the study area: (A) location of the study area; (B) elevation and landslides points; (C) stratigraphic lithology and geological structure; (D) cross-section of A-A’; (E) cross-section of B-B’.

Figure 2.
Land use conditions in the study area: (A) land use in 2000; (B) land use in 2010; (C) land use in 2020.
2.2. Data Source
The DEM data were provided by the Geospatial Data Cloud site, Computer Network Information Center, the Chinese Academy of Sciences (http://www.gscloud.cn/ (accessed on 5 February 2023)); the traffic route distribution data were from Baidu Map; the traffic data were from the public information of Zhangjiajie People’s Government; the land use data were from GlobeLand30 (http://www.globallandcover.com/ (accessedon 5 February 2023)); the annual NDVI data were synthesized from MOD13Q1 data; the data on the lithology, faults, and landslides during 2000~2010 are from Hunan Geological Environment Monitoring Station; and the data on landslides during 2015~2020 were collected from Zhangjiajie City and Hunan Provincial People’s Government (Table 1). All the data were resampled to a resolution of 30 m.

Table 1.
Data sources.
2.3. Methods
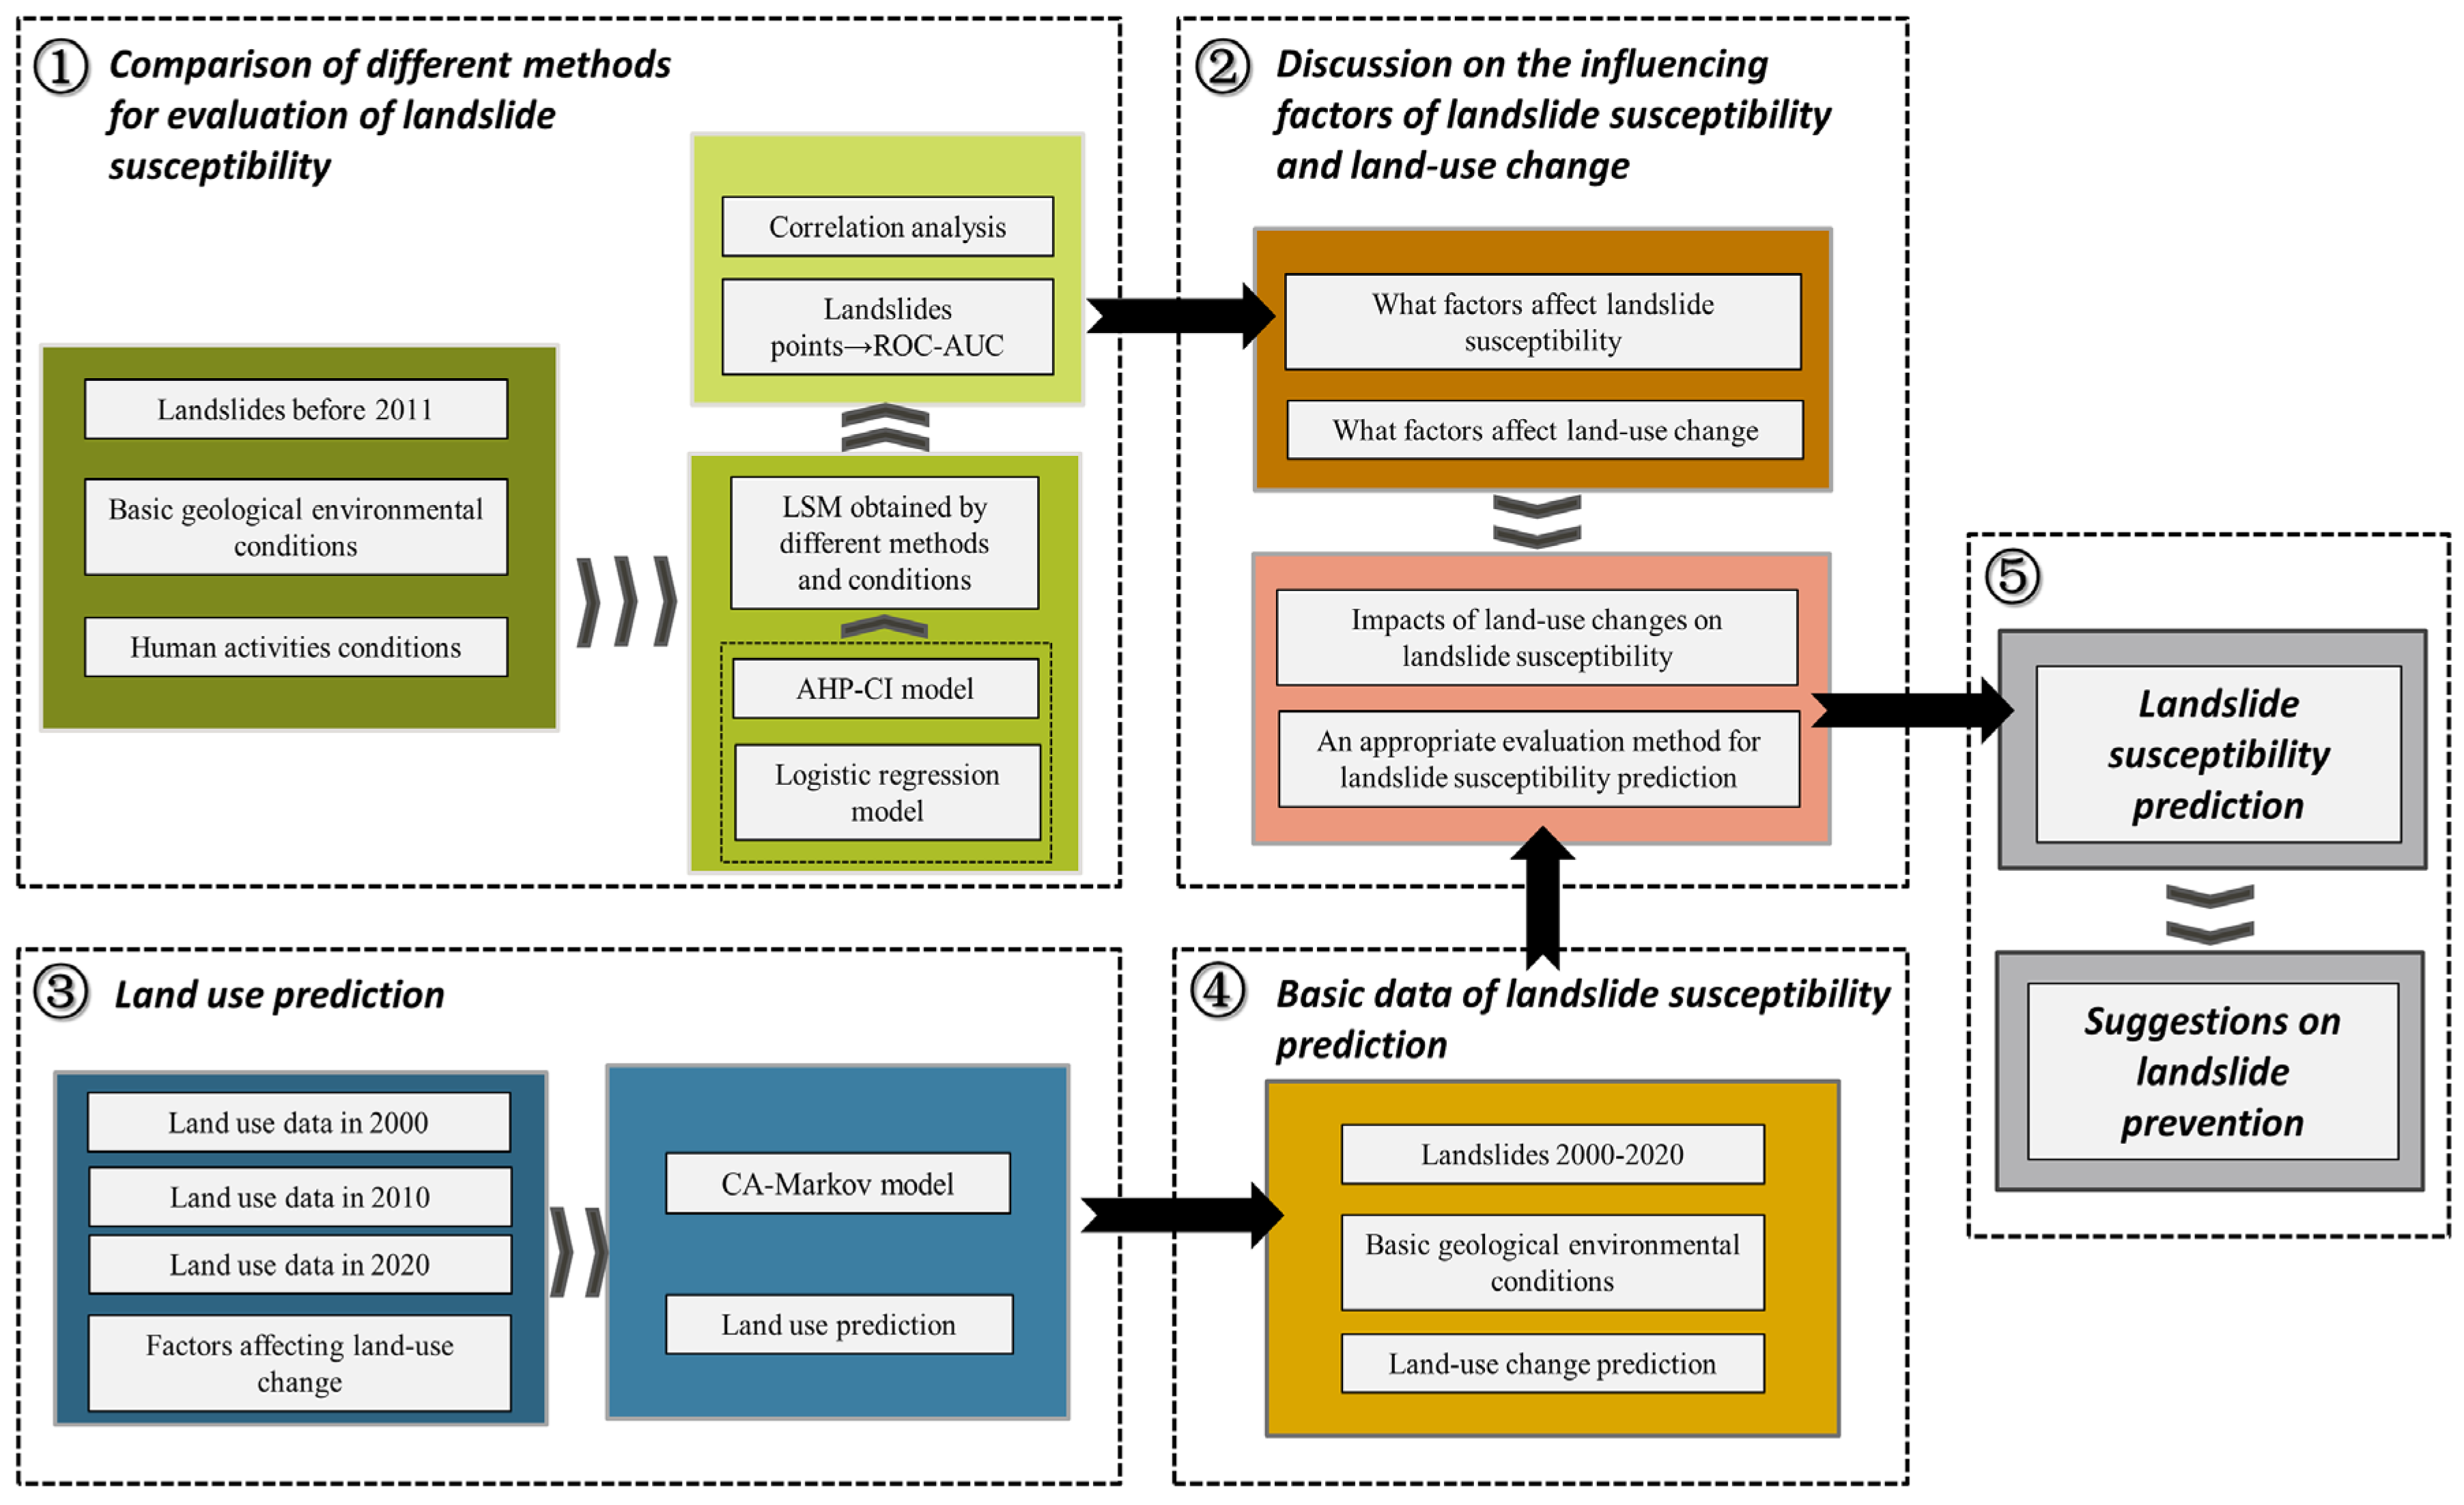
Figure 3 shows a schematic diagram of this study. In this study, the AHP-CI and LR models were used to LSA. The AHP-CI model provides an assessment including basic geological and environmental factors. Conversely, the LR model addresses the variability in LS according to the NDVI, land use, and traffic conditions, incorporating time-varying predisposing factors. Specifically, regression coefficients (RCs) derived from data spanning from 2000 to 2010 were applied to the subsequent decade (2010–2020) to estimate the updated landslide occurrence probabilities. The empirical foundation for this analysis was established by leveraging landslides recorded between 2000 and 2010 to derive the informational value of various predisposing factors, while the period from 2015 to 2020 served to validate our evaluative models. To project future land use scenarios, we utilized the CA–Markov model, which informed our predictions of LS over the next 5, 10, and 20 years by integrating the anticipated LUCs (Figure 3). Specifically, in land planning, the periods of 5 years, 10 years, and 20 years, respectively, represent short-term, medium-term, and long-term intervals. Therefore, these three periods are also applied in landslide management in this study.
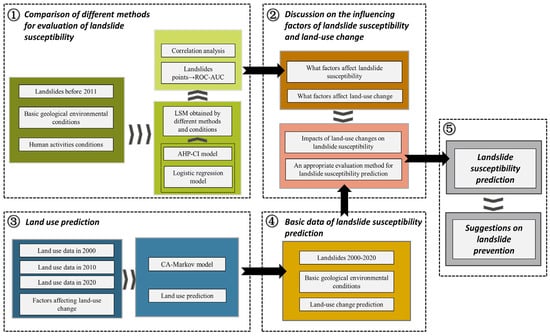
Figure 3.
Schematic diagram of this study.
2.3.1. Predisposing Factor Selection and Rating Criteria
In the analysis of LS within the study area, a total of seven predisposing factors were initially chosen for the AHP-CI model to assess slope stability. These predisposing factors encompass slope gradient, elevation, slope aspect, lithology, fault density, river density, and vegetation coverage conditions. Each predisposing factor was rated on a scale from 1 to 5, where a rating of 1 indicates high slope stability, and a rating of 5 signifies a high propensity toward instability. The classes, separation values, and scores assigned to these classes are based on our understanding of how various factors influence landslide occurrence in the study area, with this understanding drawn from an extensive literature review [45,46,47,48,49,50,51,52,53]. These scores are used exclusively in the AHP-CI model and not in the LR model. Given that the AHP-CI model is empirical, it is acceptable to assign ratings based on our prior understanding. Subsequently, these ratings were subjected to normalization to ensure uniformity in the analysis. The relationships between the predisposing factors and LS, as well as the corresponding scores, can be found in Table 2.
Table 2.
Selected predisposing factors and scores of AHP-CI model.
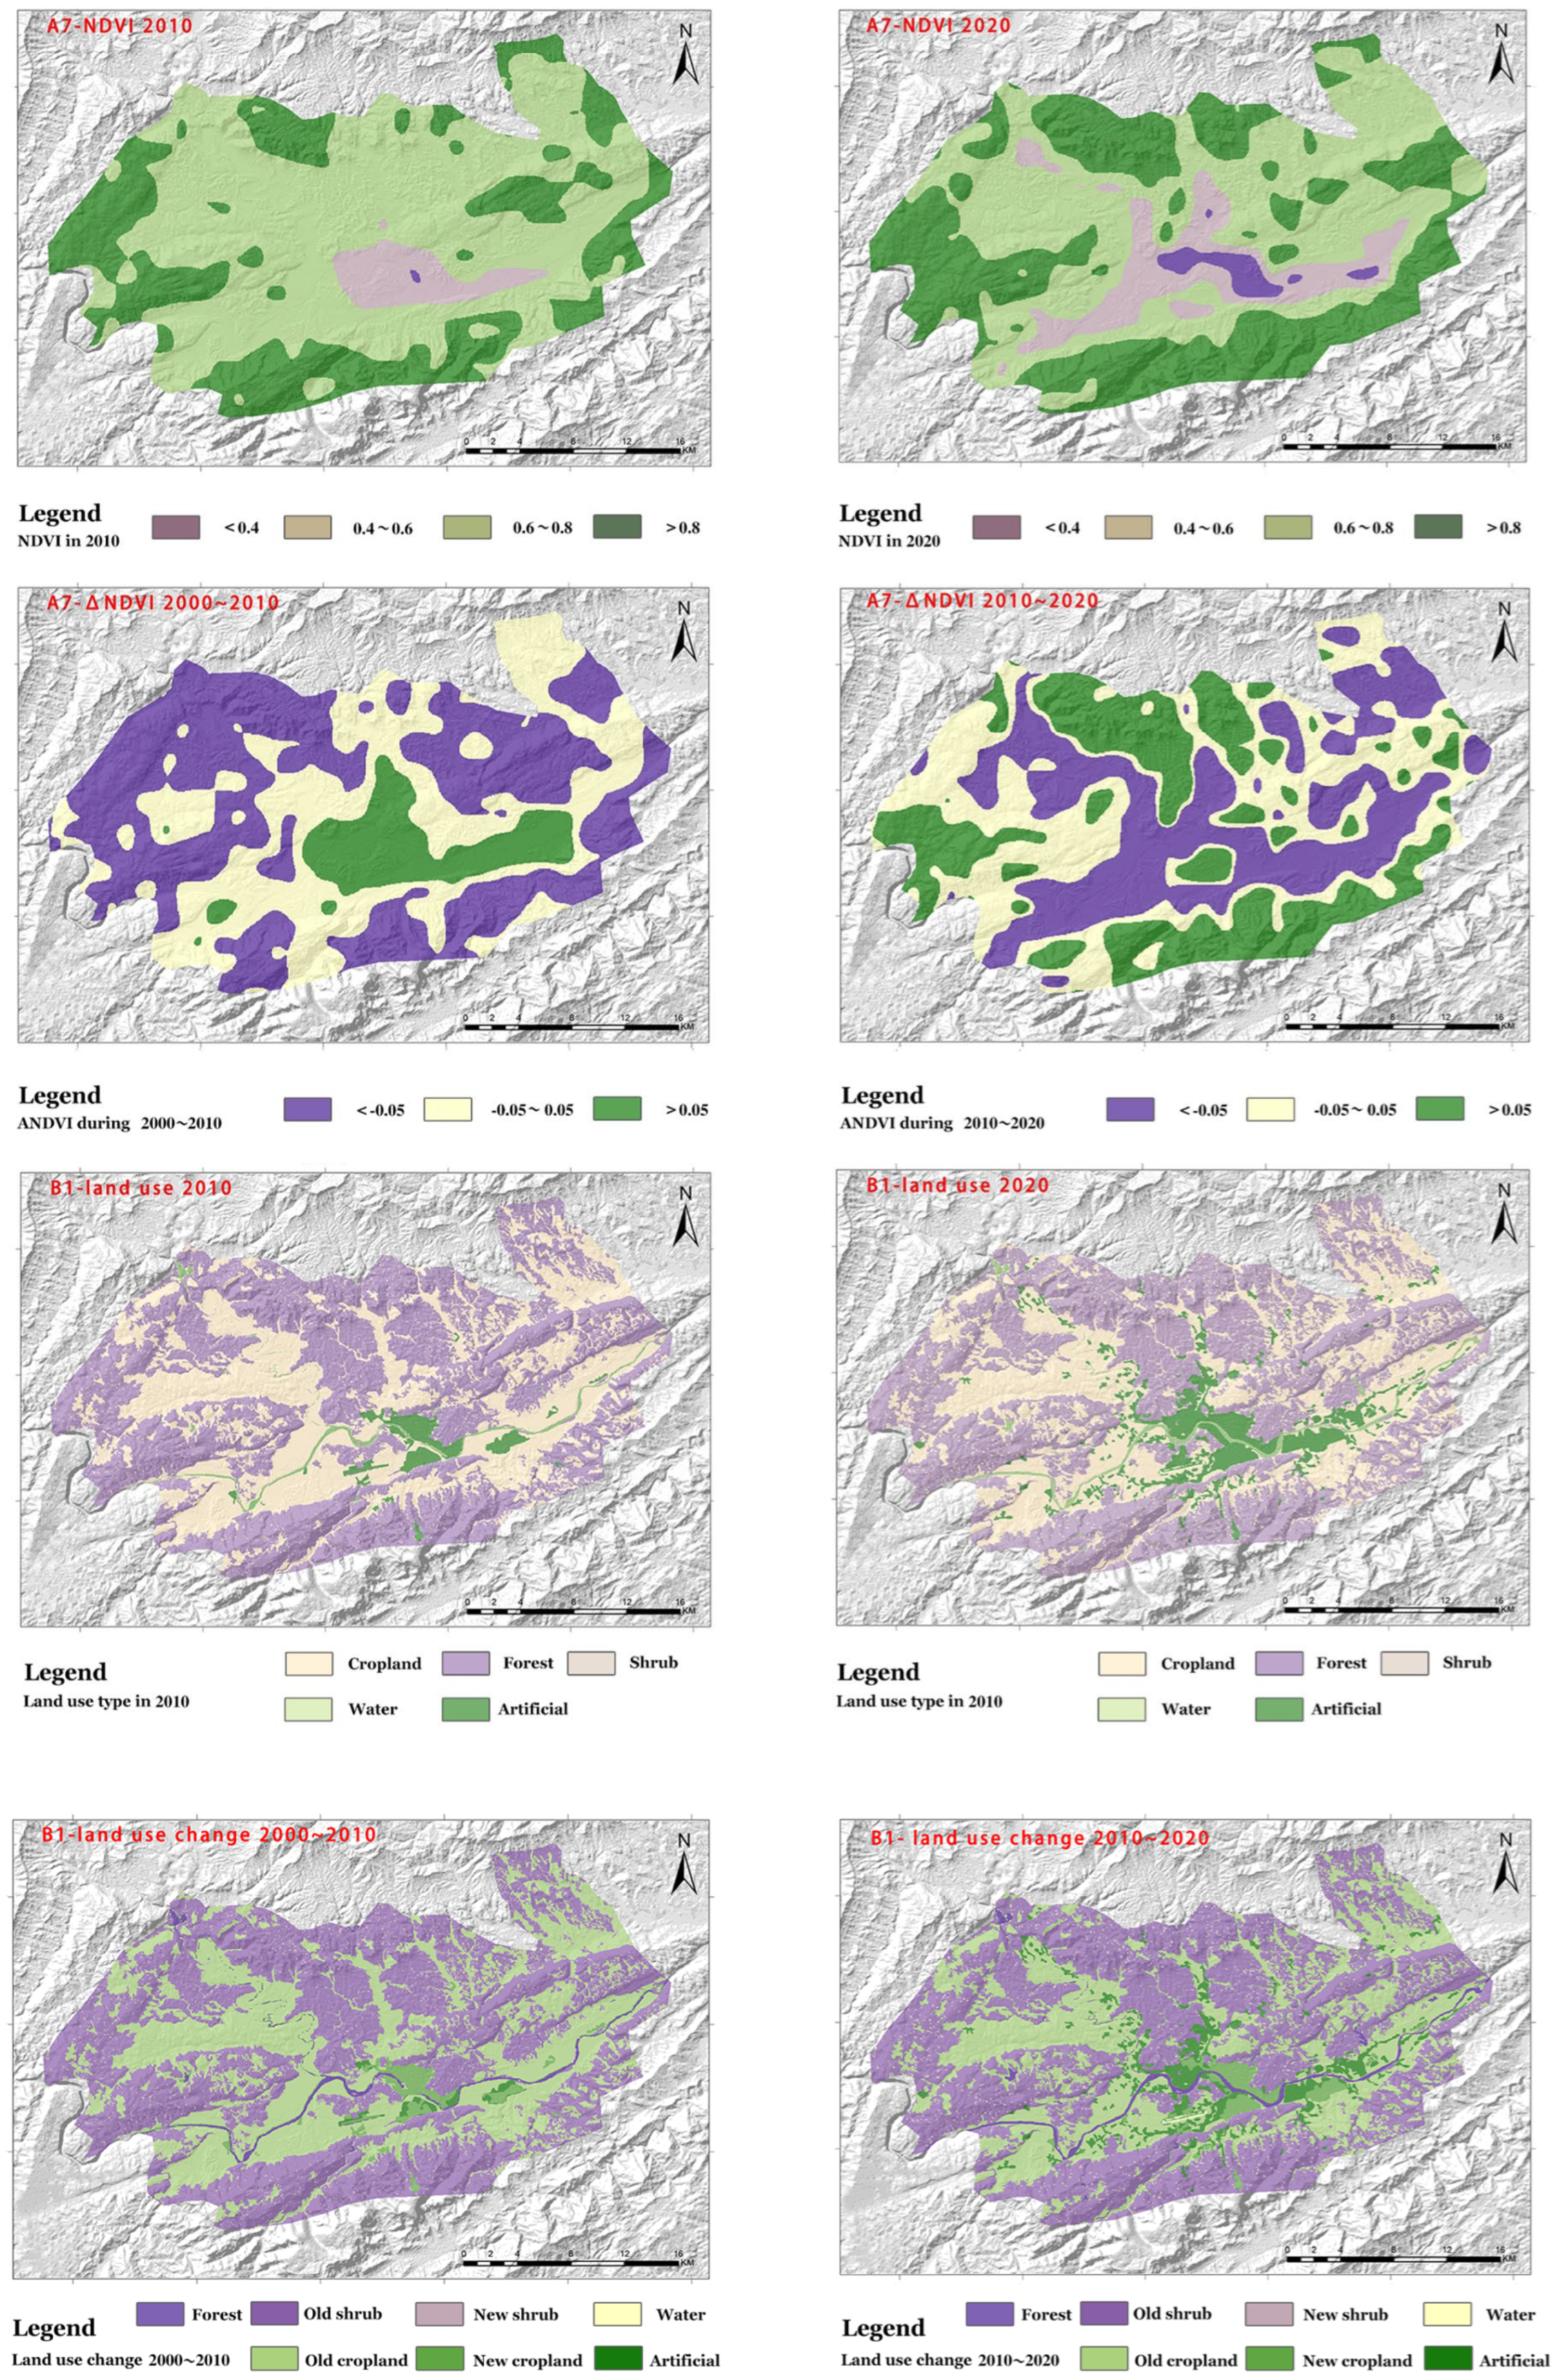
Addressing the impact of human activities, the LR model incorporated an additional three predisposing factors (LUCs, traffic condition changes, and vegetation condition changes), expanding upon the initial six to provide a more comprehensive evaluation of LS. When considering the change in the NDVI over time, Equation (1) was used to calculate the change degree relative to the base year.
where is the relative rate of change in the NDVI, and and are the NDVIs in different years. This study divided the into 4 grades: <−0.15, −0.15~0.05, −0.05~0.05, 0.05~0.15, and >0.15.
Human activities significantly alter land surfaces, with varied impacts across different land use types. Construction activities can undermine slope stability by excavating slope toes and increasing the slope load, while blasting and vibrations exacerbate instability. In agricultural areas, certain vegetation types and irrigation can cause soil erosion and heighten slope mass. Conversely, urban areas with developed infrastructure and long-term croplands typically see enhanced slope stability through effective landslide mitigation and ecological measures. Thus, landslides triggered by human activities predominantly occur in areas of new construction and new cropland, and we consider old shrubland, new shrubland, old cropland, and new cropland.
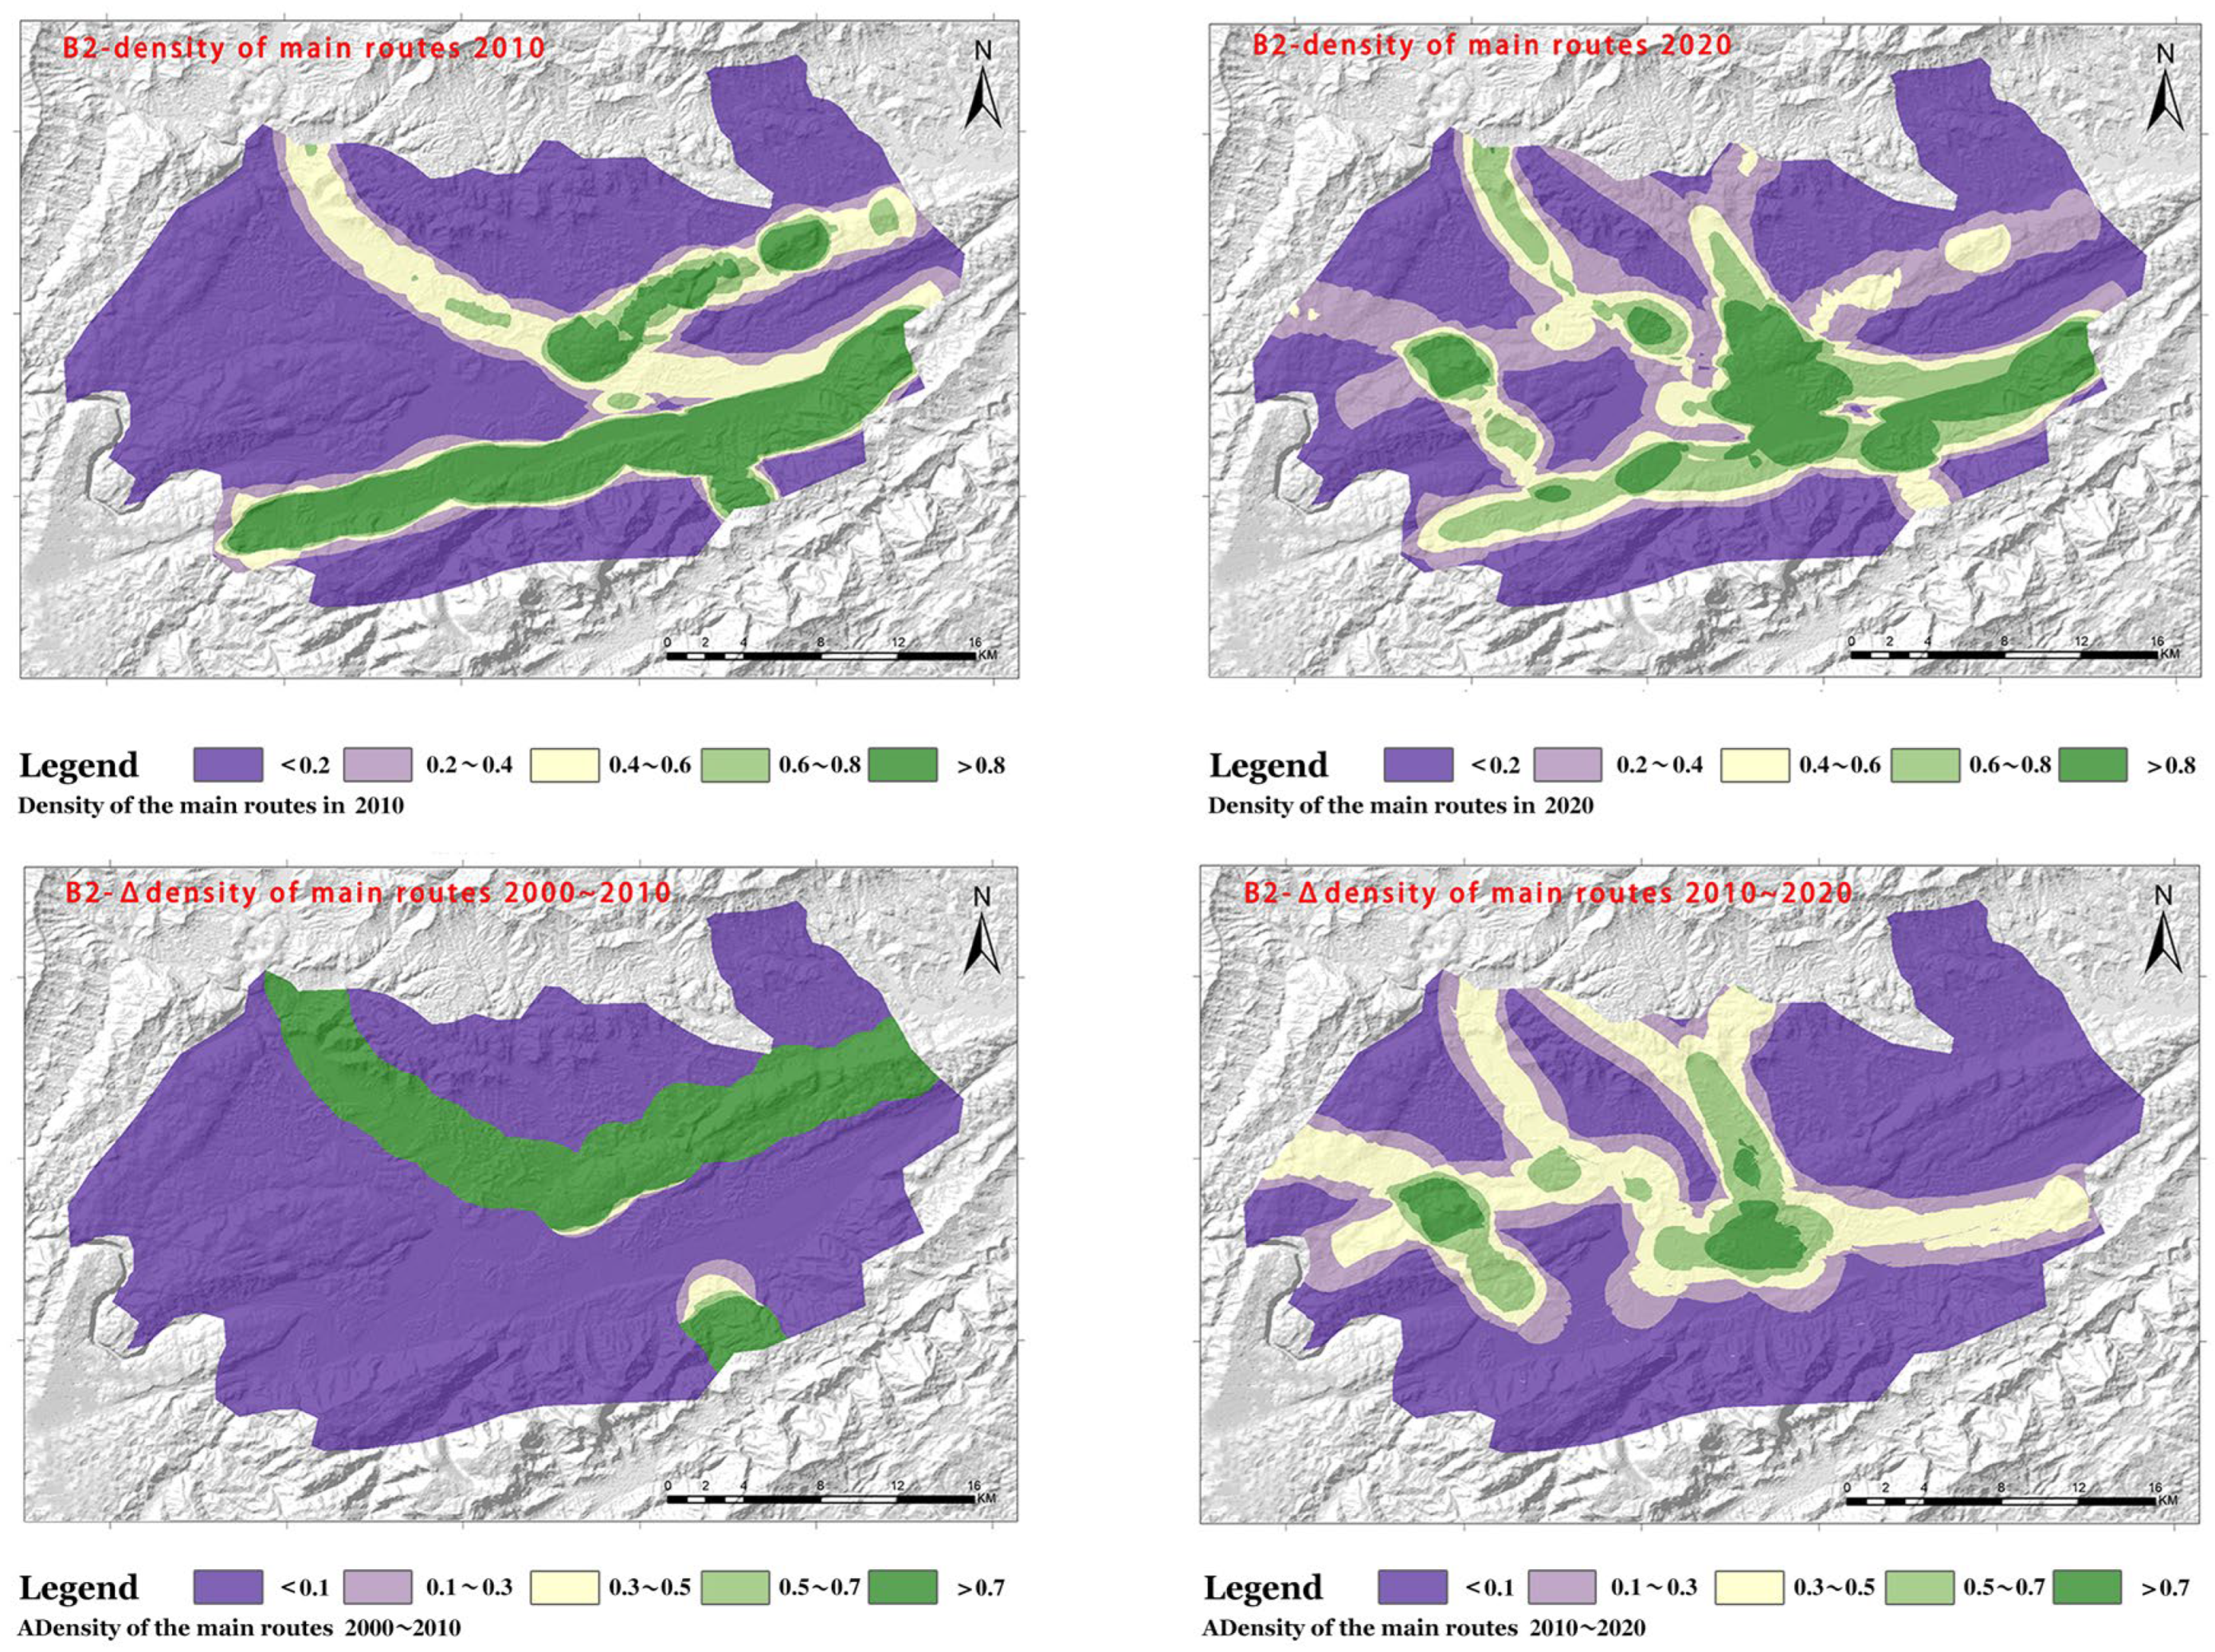
The construction of transportation infrastructure, specifically through excavation and blasting, is a notable trigger for landslides in mountainous regions. However, once completed, such infrastructure often incorporates slope protection measures that reduce landslide risks. This distinction highlights the complex impact of traffic route development on slope stability. This study employs traffic density as a predisposing factor for traffic conditions, recognizing the significant variation in this factor over time. To address this, we calculate relative density using Equation (2):
where is the density of the main routes; is the minimum of the density of the main routes; is the maximum of the density of the main routes. And the relative density was divided into 4 grades: <0.2, 0.2~0.4, 0.4~0.6, 0.6~0.8, and >0.8.
When considering the change in traffic conditions over time, Equation (3) was used to calculate the change degree relative to the base year:
where is the relative rate of change in the density of the main routes, and and are the densities of the main routes in different year. This paper divided into 4 grades: <0.1, −0.1~0.3, 0.3~0.5, 0.5~0.7, and >0.7.
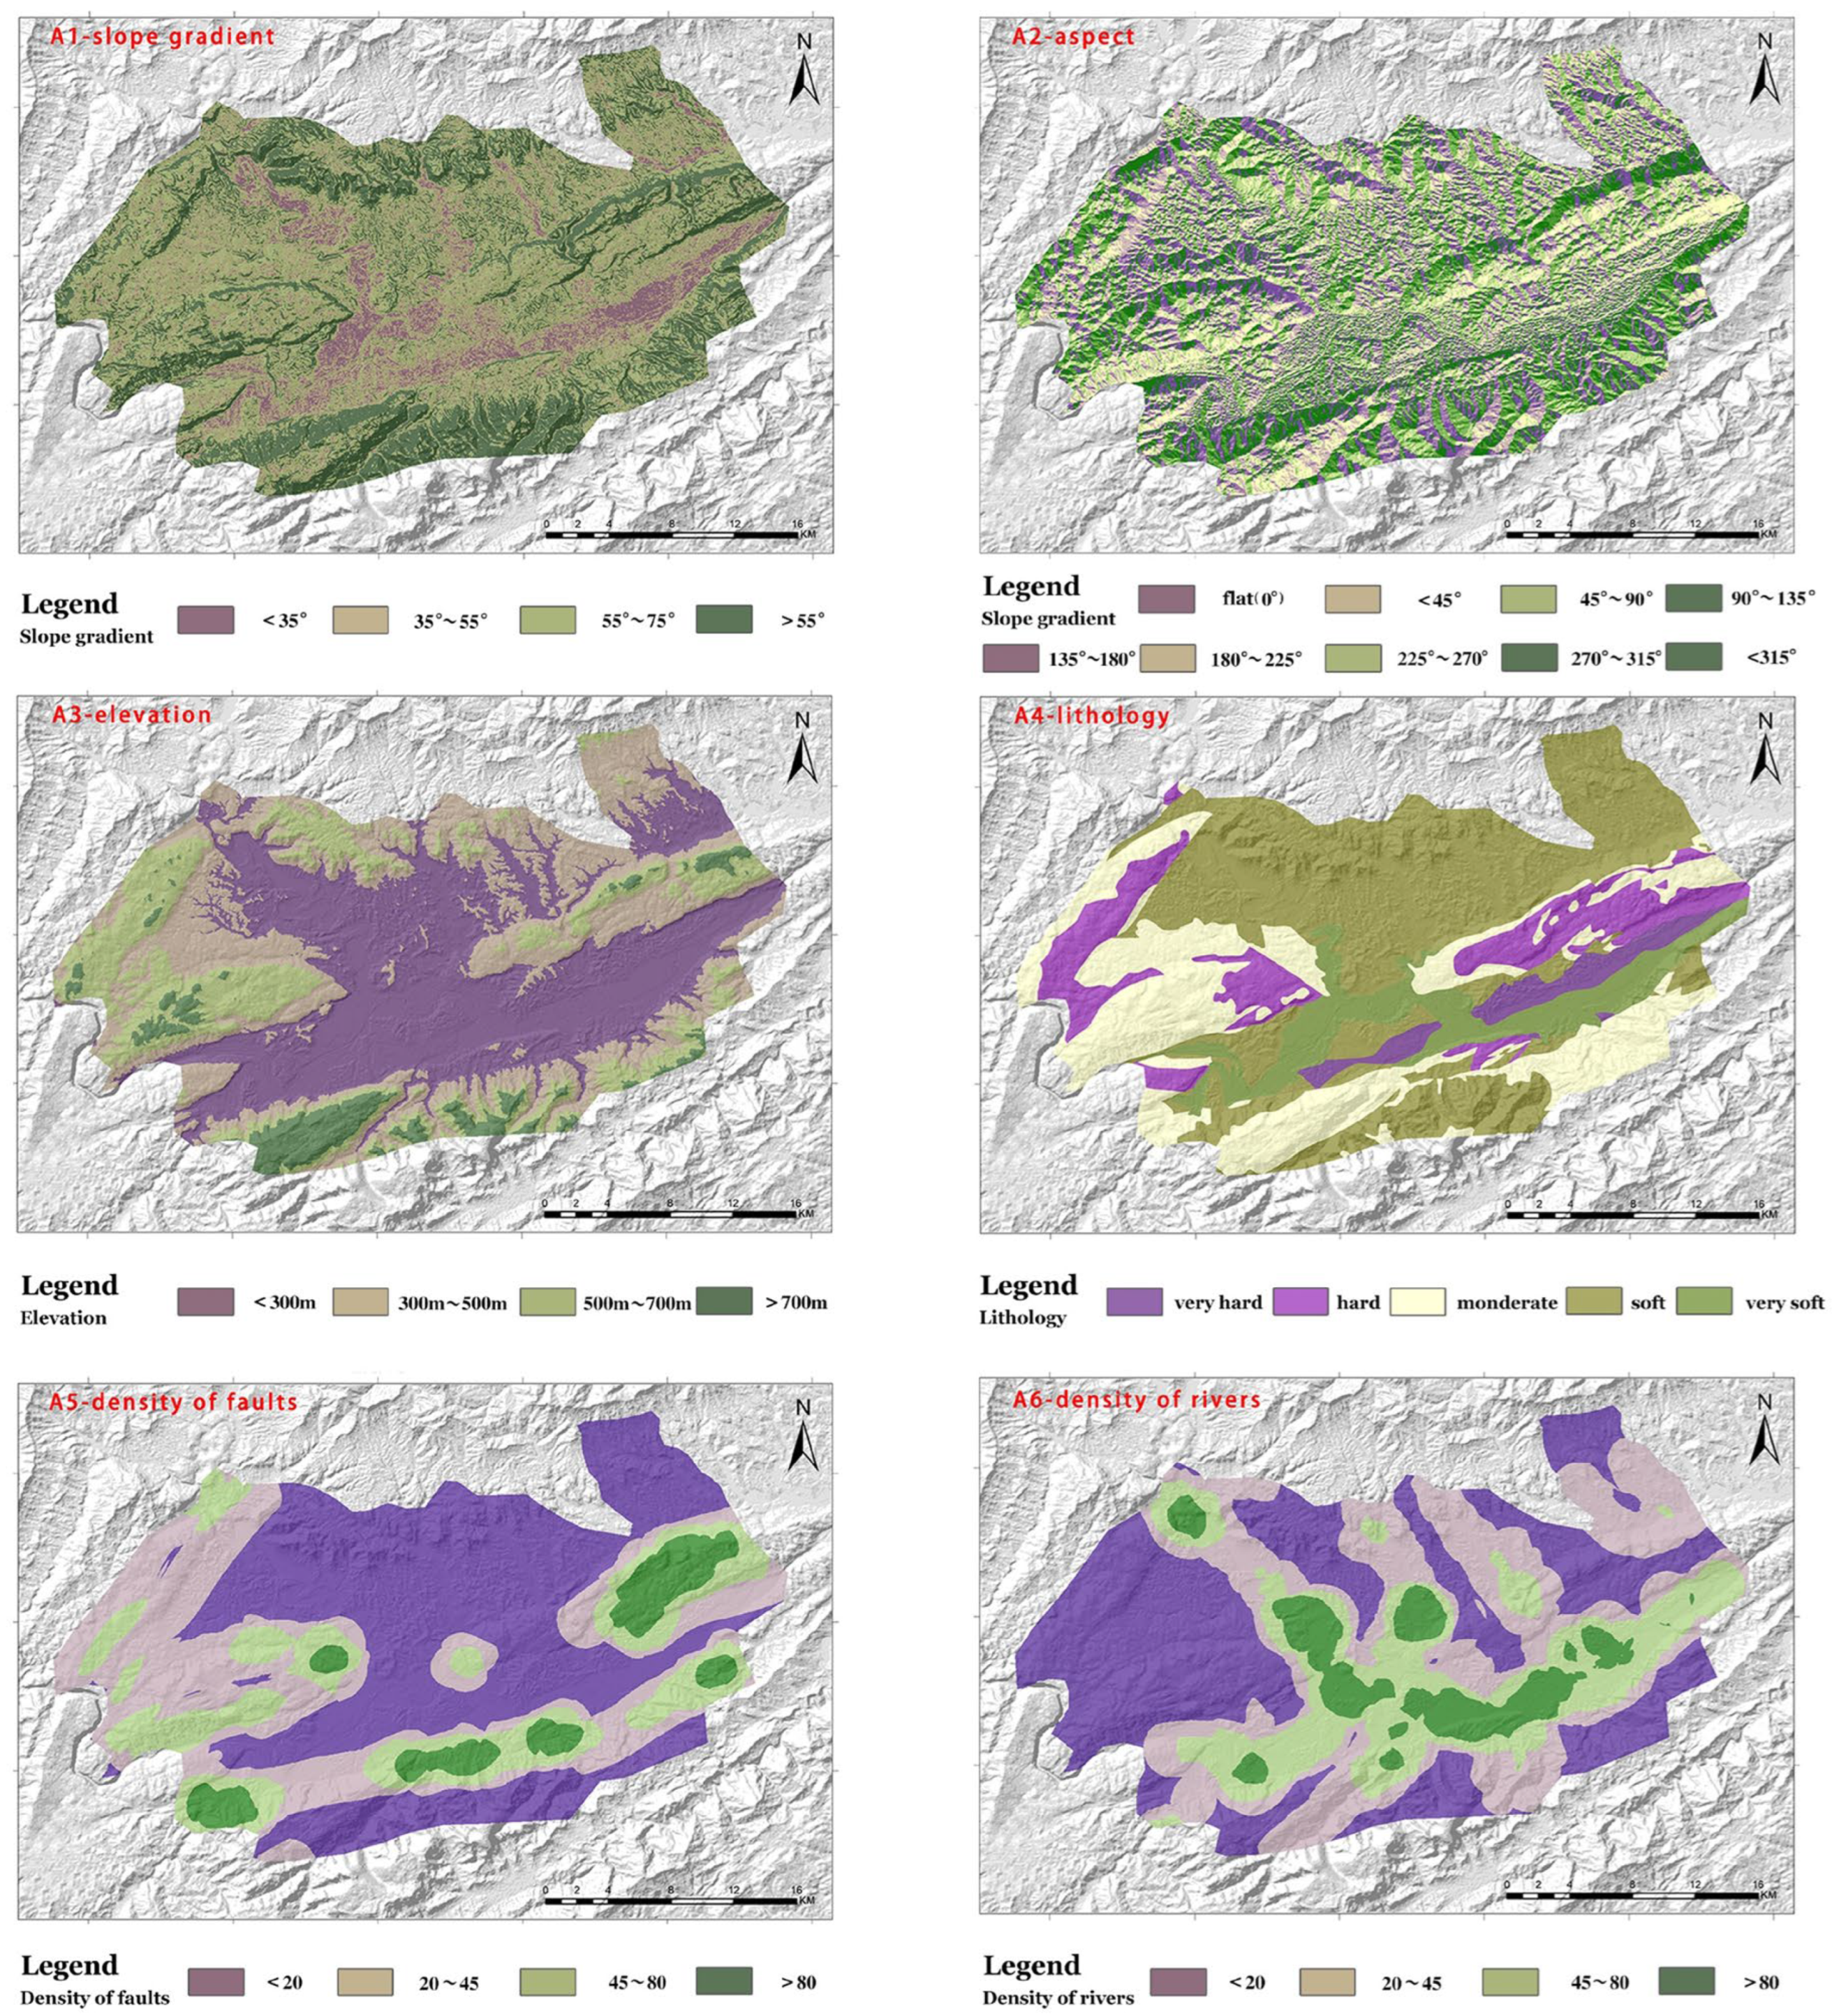
The relevant predisposing factors are shown in Figure 4. Notably, all continuous variables have been transformed into categorical variables for input into the LR model, which offers several advantages, such as ease of interpretation, relationship simplification, handling of non-linear effects, and control for outliers [54,55,56].
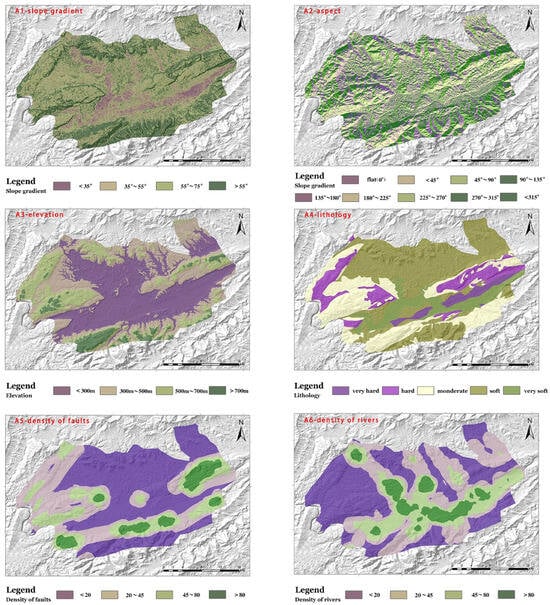

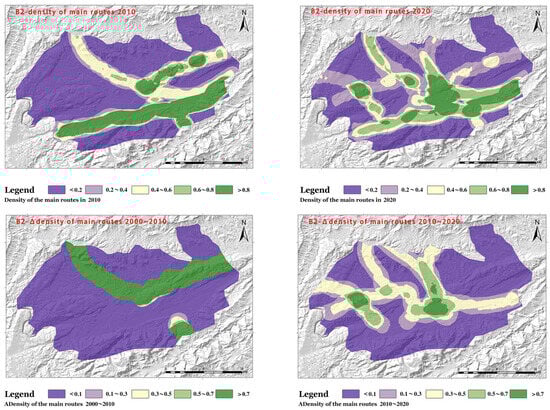
Figure 4.
Predisposing factor maps for LSA.
2.3.2. Multicollinearity Analysis
Collinearity between predisposing factors will affect the model construction and the accuracy of the output results. On the one hand, the AHP-CI model assumes that each factor is independent from the others; on the other hand, multicollinearity will lead to unstable outcomes of the LR model. Thus, before the calculation and/or training of the AHP-CI and LR models, the multicollinearity between factors was analyzed using Equations (4) and (5):
where and are the variance inflation factor and tolerance of the th predisposing factor, respectively, and is the coefficient of determination of the multi-liner regression model.
2.3.3. AHP-CI Model
The AHP-CI model, introduced by Saaty [57], is a structured technique for organizing and analyzing complex decisions based on mathematics and psychology. It facilitates the breakdown of a problem into a hierarchy of more easily comprehended sub-problems, each of which can be analyzed independently. The method employs pairwise comparisons for ranking and prioritizing the importance of various elements, thereby allowing for both qualitative and quantitative evaluation [58,59,60,61]. Notably, the AHP’s effectiveness in weight calculation does not necessitate information on the landslide distribution, enabling the derivation of more accurate weights for fundamental geological and environmental conditions, unaffected by the clustering of landslides due to human activities. In this study, the AHP-CI model was utilized to ascertain the LS within the basic geological environment of the designated area. The comparative significance of each predisposing factor in the evaluation was quantified using a judgment matrix, with the nine-scale method adopted to assess the importance of each predisposing factor, as detailed in Table 3.
Table 3.
Intensity of importance and definition in the nine-scale method.
The consistency test is passed when the consistency ratio . can be calculated by applying Equations (6) and (7):
where is the random consistency index; is the maximum characteristic root of the matrix; and is the order of the matrix. And the weights of the predisposing factors can be obtained by calculating and normalizing the eigenvector corresponding to the maximum eigenvalue. The LS index () can be calculated with the weights of the predisposing factors () and the corresponding score of each evaluation predisposing factor () by applying Equation (8):
2.3.4. LR Model
The LR model is a generalized linear regression model and the most common data-driven LS evaluation method. In this study, binary LR was adopted, and a regression relationship was built between the dependent variable (whether landslides occurred) and the independent variable (affecting factors of landslides) to calculate the probability of landslides in a certain region. Y = 1 and 0 are defined to indicate whether a landslide occurred or did not, respectively. The odds function is defined as the ratio of landslide occurring to not occurring, and its logarithm is taken to obtain the following formula:
where is the probability of landslide occurrence; is each factor affecting landslides; is the constant term; is the RC of each factor.
In this study, we used the backward elimination method for indicator selection and the Wald test with a p-value threshold of 0.25. This is because conventional thresholds like 0.05 may not adequately capture variables that are known to be significant [62,63,64,65].
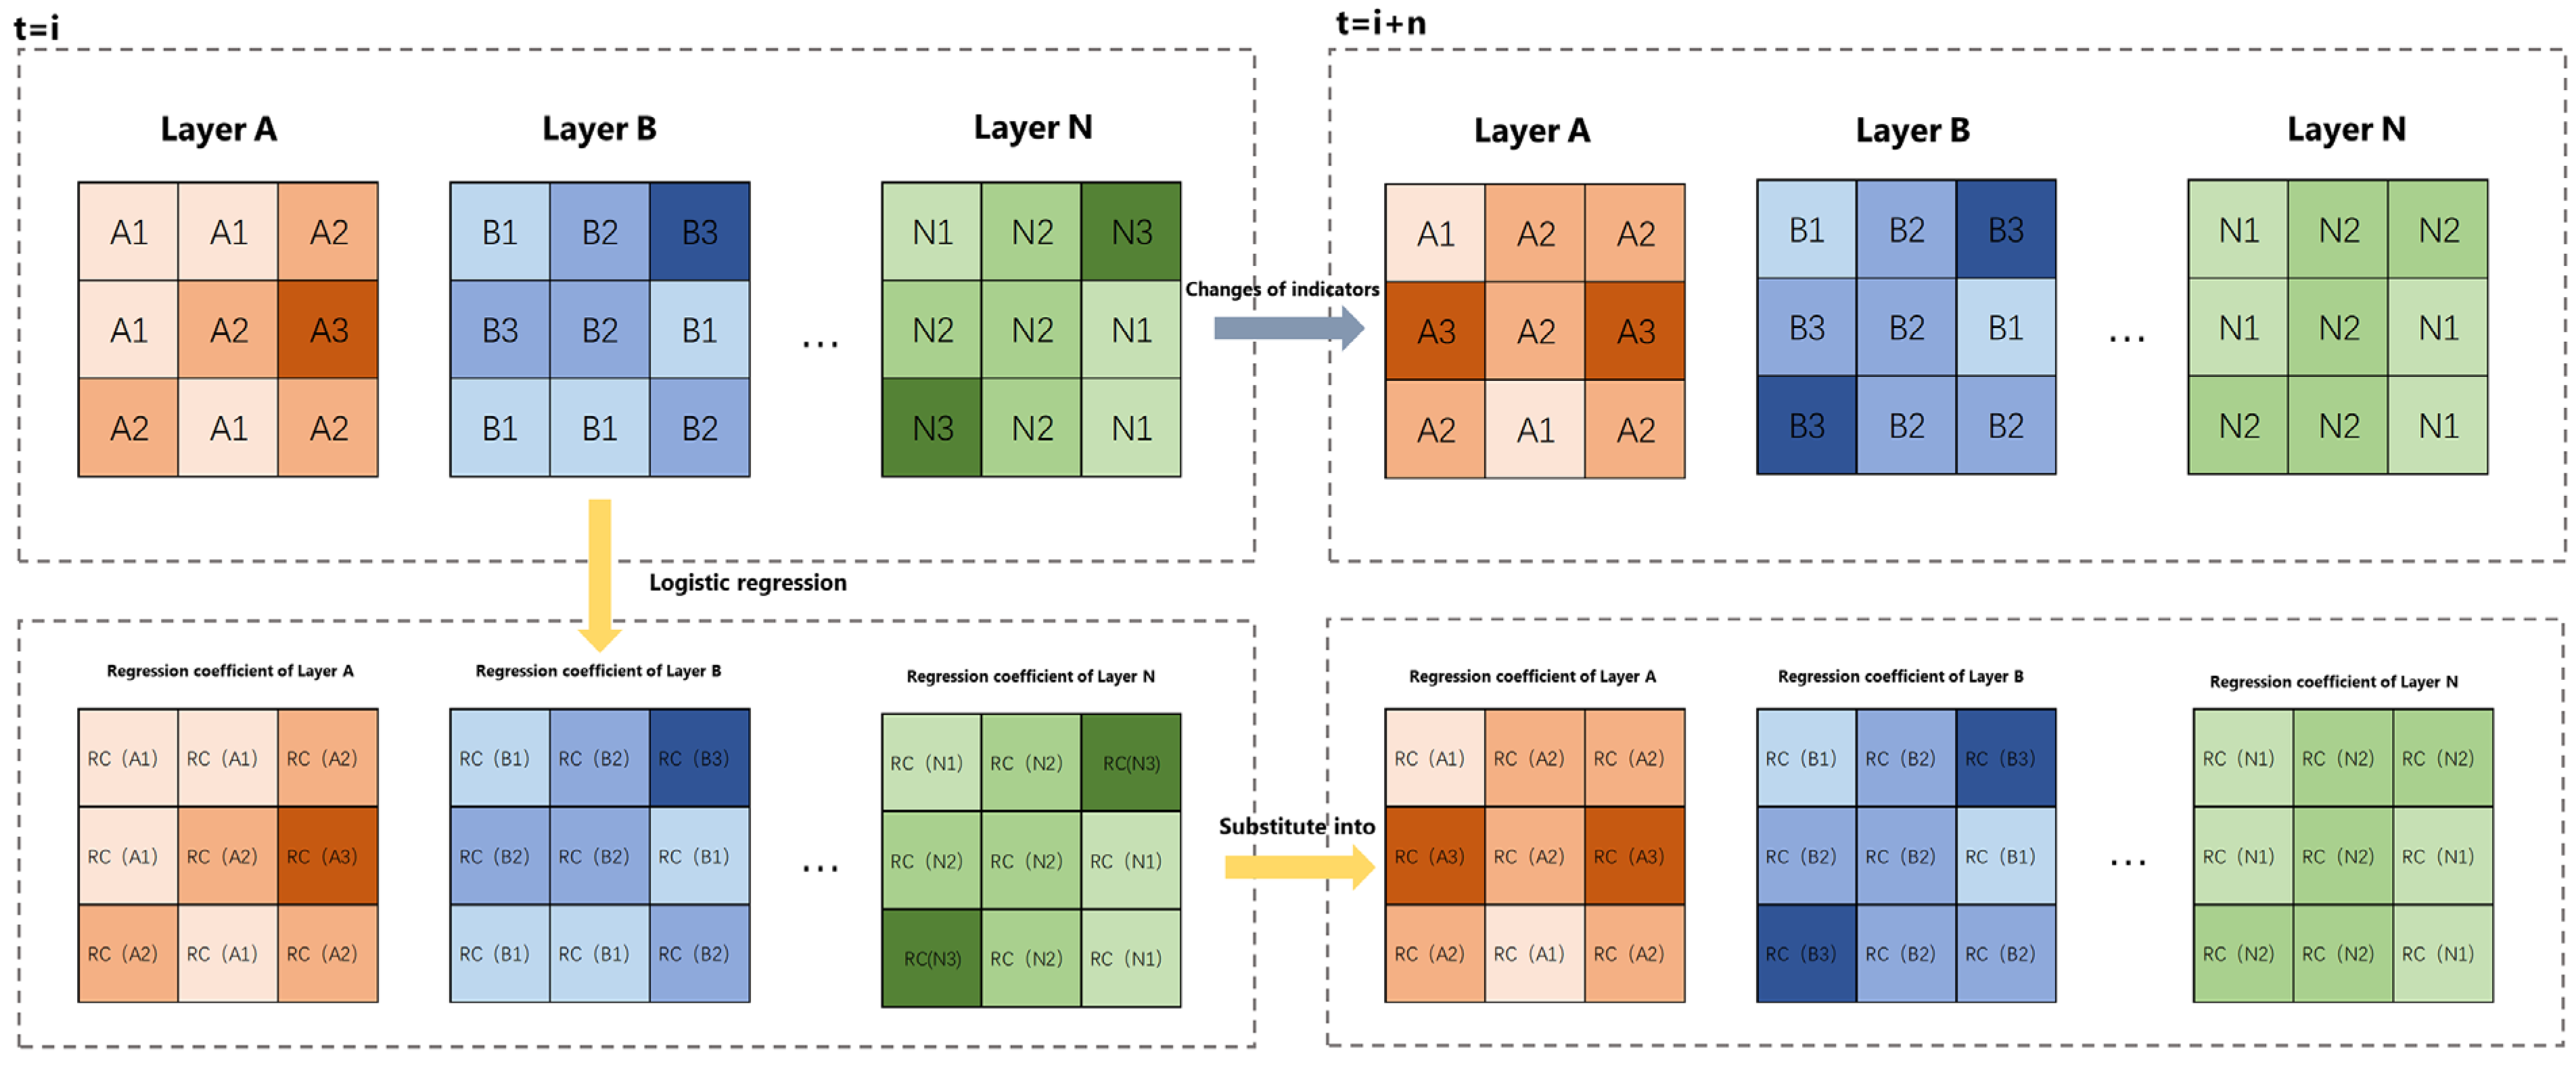
This paper assumes that the logistic RC of the same predisposing factor does not change when the affecting factors change with time. The logistic RC calculated from the early affecting factors was substituted into the later influencing factors for superposition calculation. When time-varying predisposing factors (NDVI, LUC, and traffic density changes) are considered, the use of the LR model for these predisposing factors is shown in Figure 5.
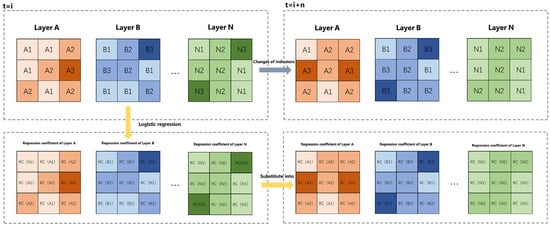
Figure 5.
Schematic diagram of LR model when predisposing factors change with time.
2.3.5. Model Validation
Model validation plays a crucial role in the assessment of LS, guaranteeing the predictive models’ dependability and robustness. For this research, we employed several key predisposing factors for validation purposes: precision, recall, F1 score, overall accuracy (OA), and the area under the receiver operating characteristic (AUROC) curve. The calculations of these metrics are shown as follows:
where denotes the instances where landslides were correctly predicted by the model to occur and did indeed occur; represents the instances where the model inaccurately predicted landslides that did not occur; and indicates the locations accurately identified by the model as not prone to landslides, where no landslides occurred. are the cases where the model failed to predict landslides yet landslides happened. is the false positive rate (ratio of false positives to the total number of actual negatives) at the threshold; is the false positive rate at the threshold; refers to the true positive rate (also known as recall or sensitivity) at the threshold, representing the ratio of true positives to the total number of actual positives; and is the true positive rate at the threshold.
2.3.6. CA–Markov Model
The CA–Markov model was employed to project the land use patterns in 2025, 2030. and 2040. The land use data of 2010 and 2020 and the slope gradient, lithology, elevation, density of faults, and density of rivers were selected as driving factors. This model integrates Cellular Automata (CA) with Markov chain analysis for land cover predictions [66]. Based on the CA–Markov model, the IDRISI Selva 17.0 software can be used to predict future land use types. The general steps are as follows:
- Convert the existing land use data and driving factor data into ASCII format and import the ASCII data into IDRISI Selva software.
- Reclass the land use data.
- Use the Markov function in the software to make the Markov transition area file on land use and set the proportion error as 0.1 (10%).
- Use the Reclass function to make a binary map of every land use type in the prediction base year.
- Use a binary map to collect transition suitability images for the driving factors and every land use type with the Logistic function in the software.
- Predict the future land use data in ASCII format by using the base year land use data, the transition suitability image collection, and the Markov transition area file, with the CA-Markov function in the software. And set the number of iterations to 5/10/20 times.
- Convert ASCII future land use data into vector data.
3. Results
3.1. Results of Multicollinearity Analysis
The results of the multicollinearity analysis are detailed in Table 4, where all the Variable Inflation Factor (VIF) values are shown to be less than 10 (1.131 to 4.053). This confirms that there is no significant issue of multicollinearity among the indicators used in our study, which validates the appropriateness of our choice of predisposing factor selection.
Table 4.
Results of multicollinearity analysis.
3.2. Outcomes of the AHP-CI Model and the LR Model
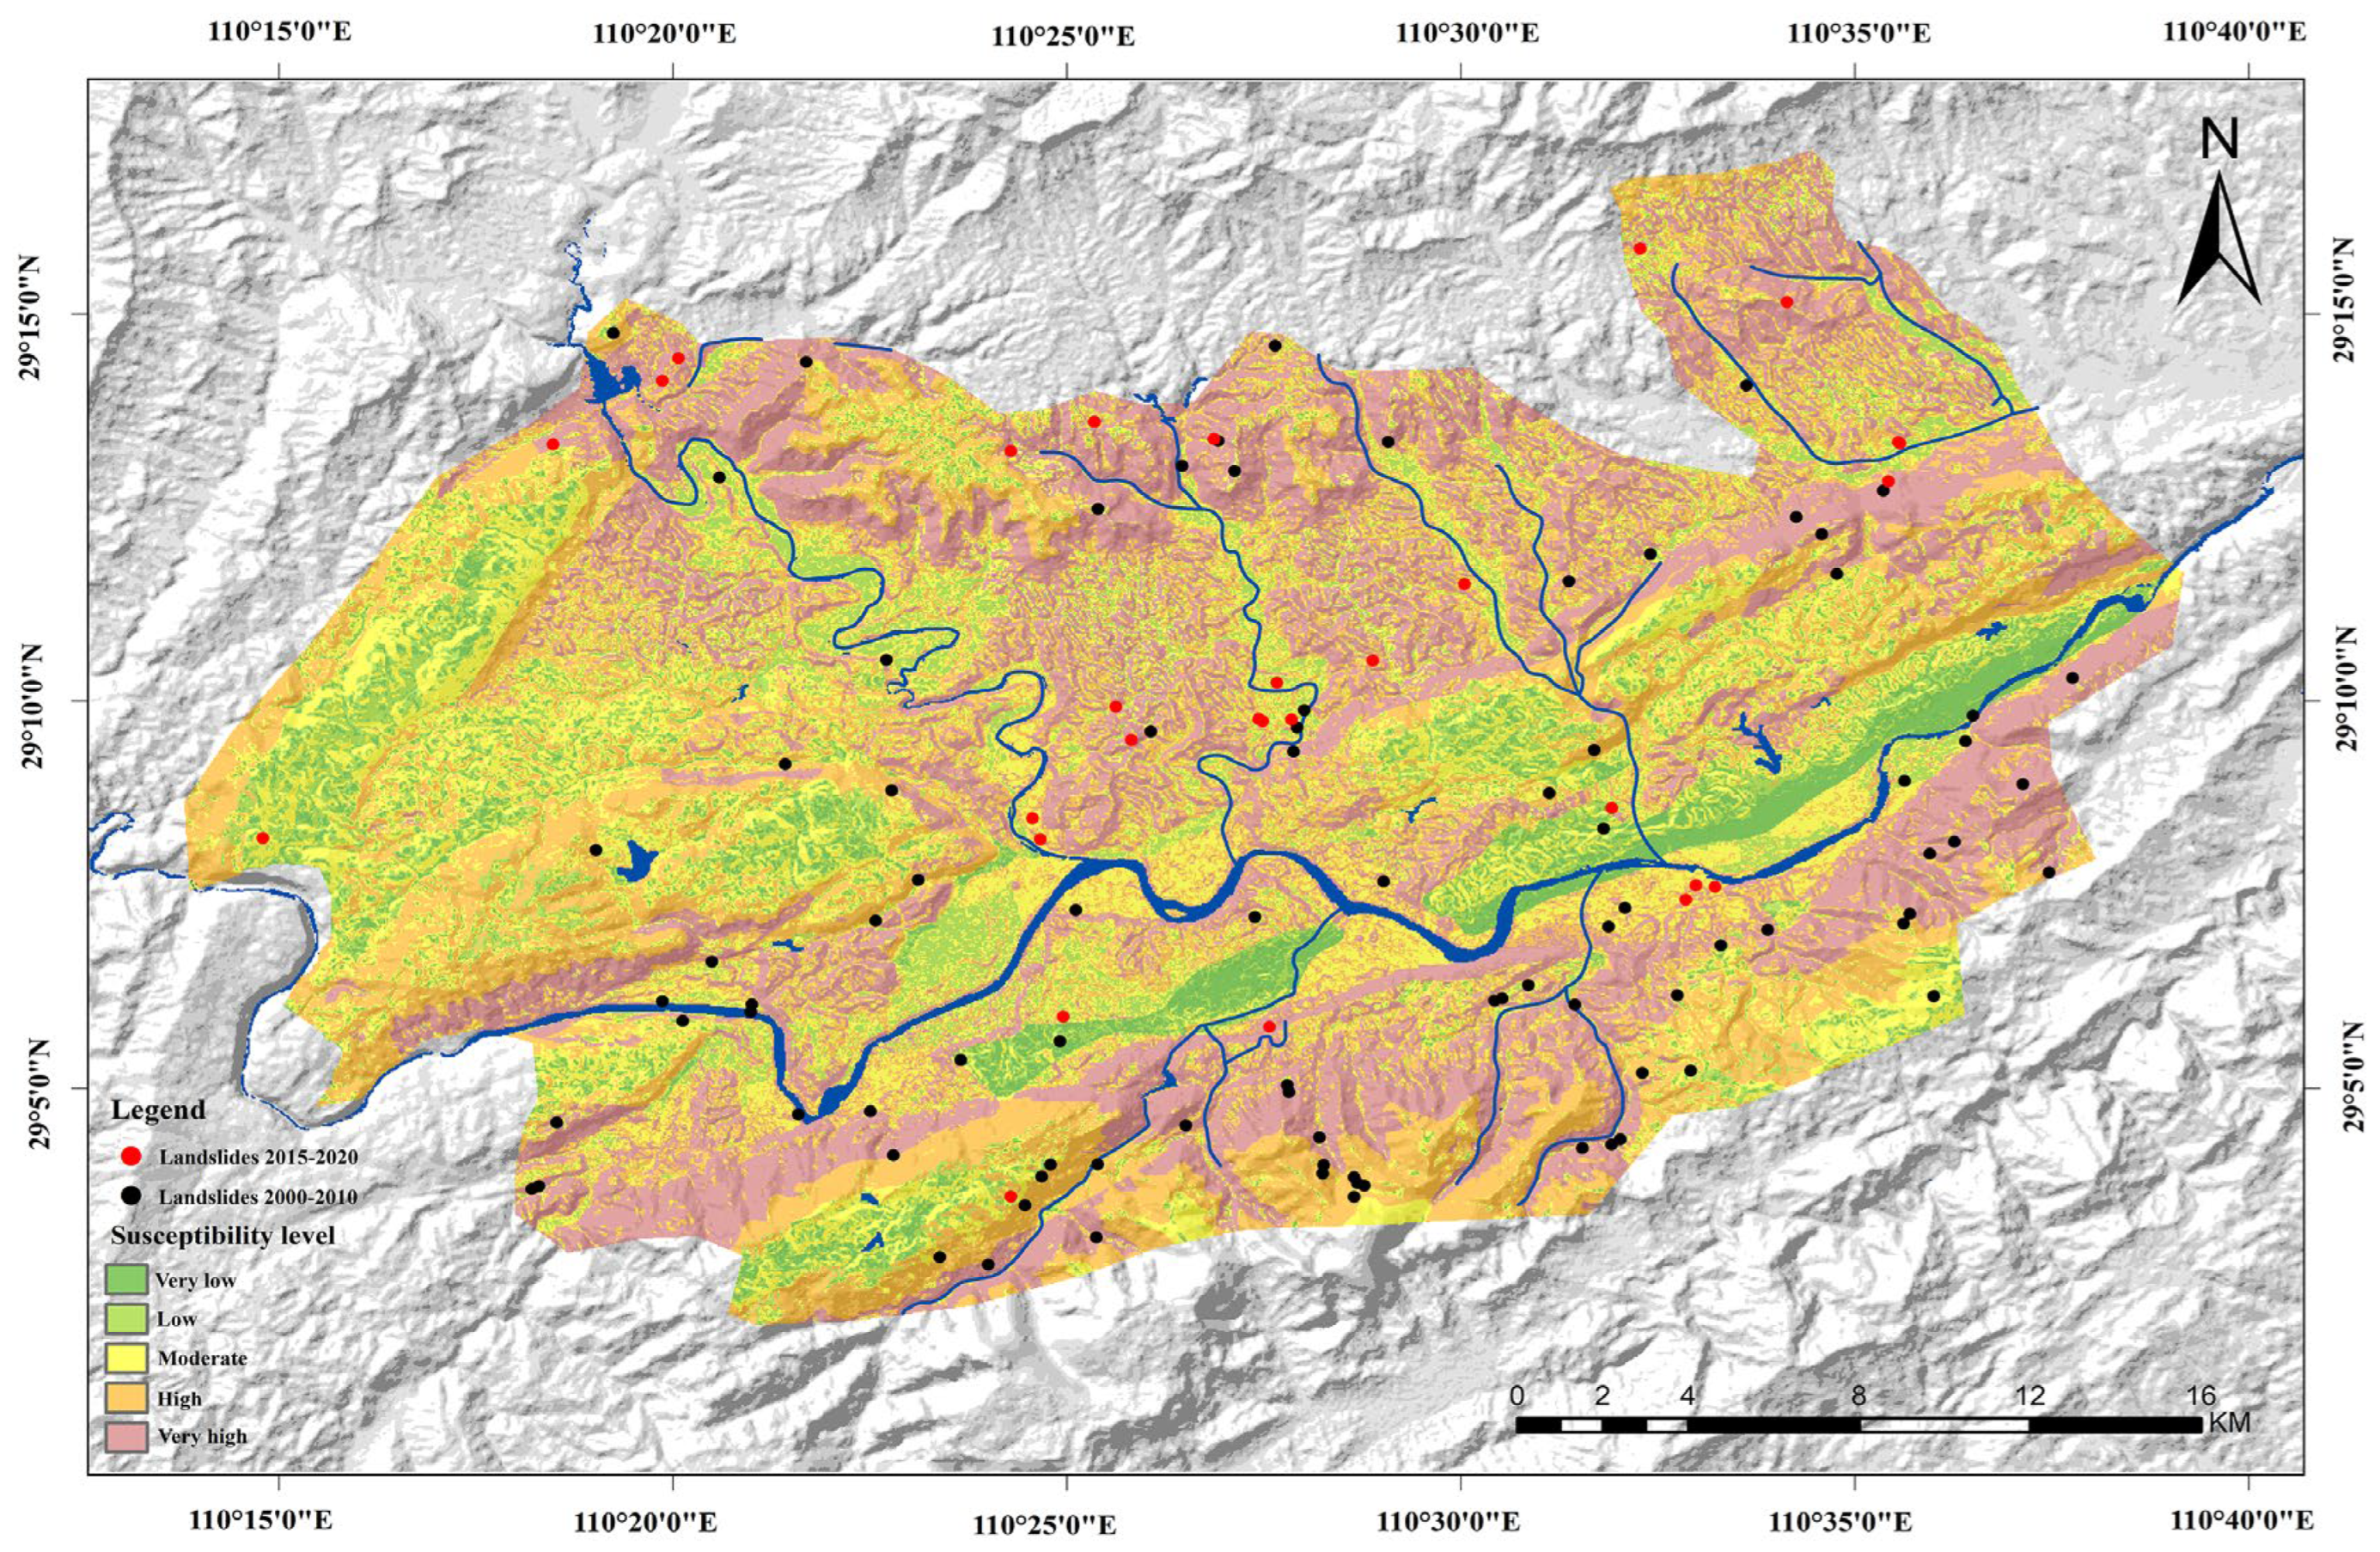
A judgment matrix was constructed through expert scoring, and the weight of each predisposing factor in the evaluation was calculated (Table 5). And the LS index (LSI) in the study area was calculated by applying Equation (6): . The study area was divided into five grades using the natural break method: very high (30.43%), high (30.65%), moderate (22.00%), low (12.55%), and very low (4.37%) (Figure 6). The low- to very low-susceptibility areas are mainly distributed in the flat area around the Li River and its tributaries, while the high- to very high-susceptibility areas are mainly distributed in the mountainous areas and densely developed faults north and south of the LRV.
Table 5.
Weights of factors in AHP-CI model.

Figure 6.
LS map of AHP-CI model.
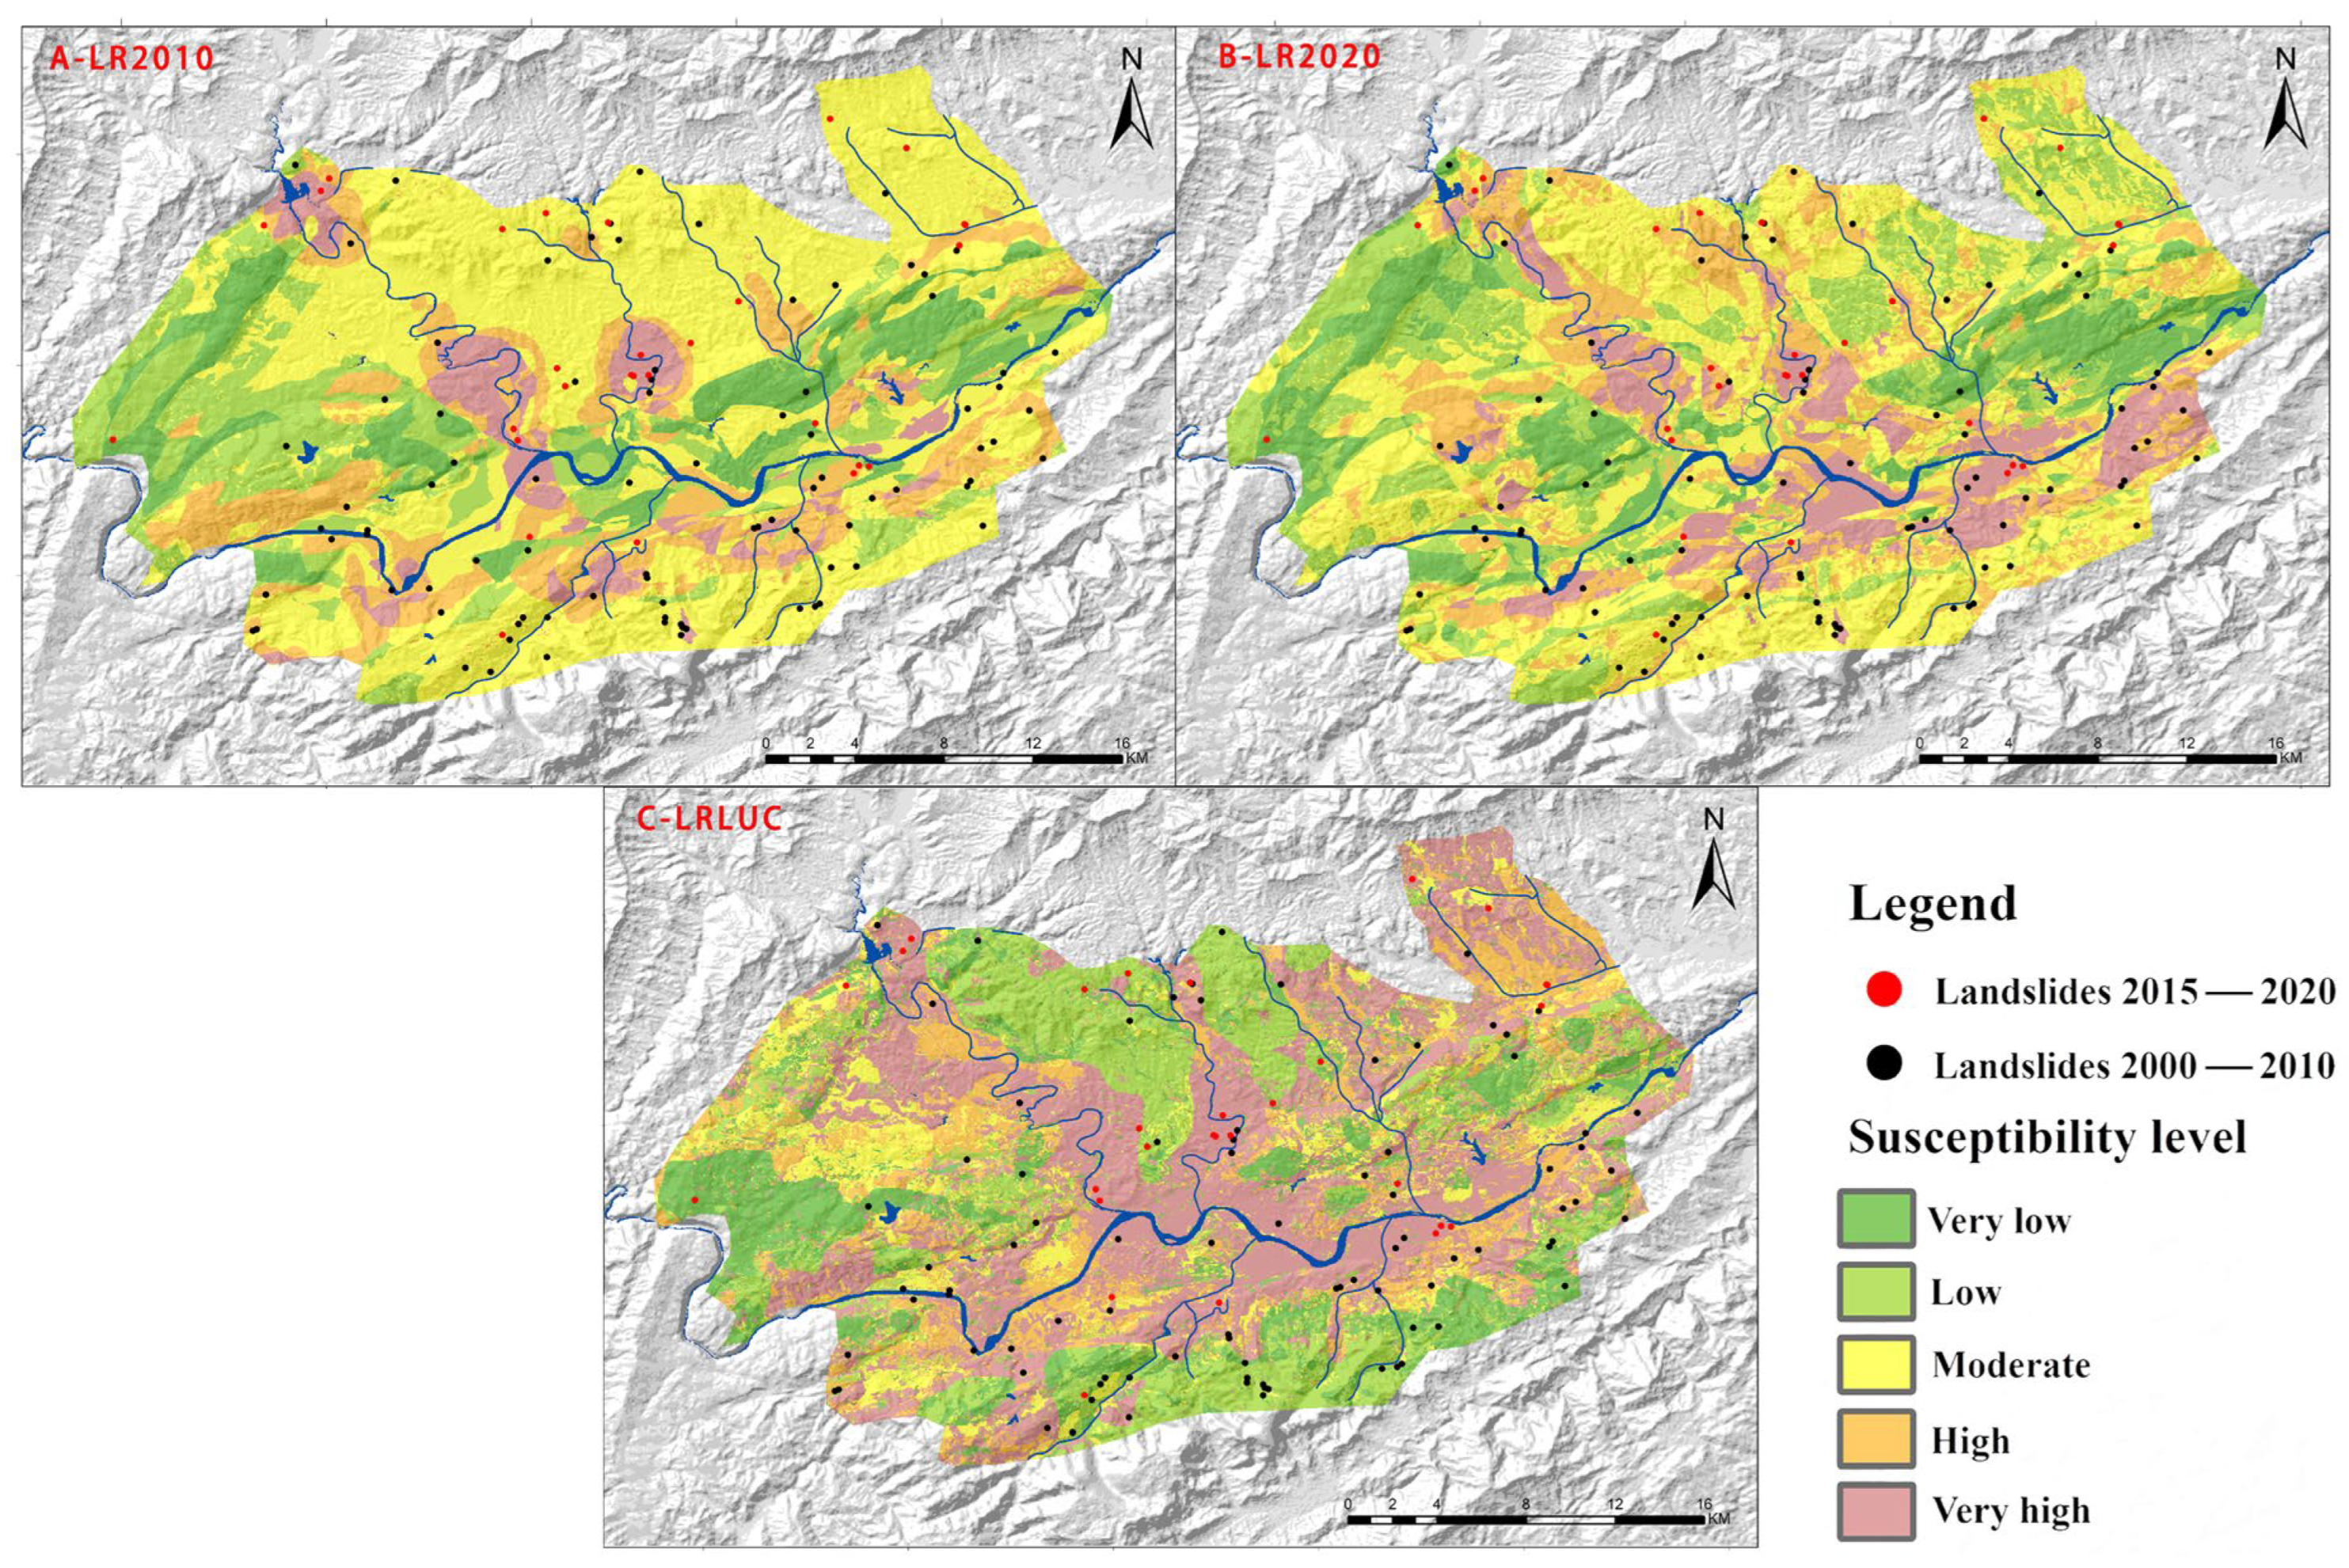
Table 6 shows the results of the LR model for different conditions. Before the analysis, a significance test of the parameters was carried out, and the non-significant (with 95% levels) predisposing factors were eliminated (shown as slashes). It can be observed that slope, aspect, and elevation are not significant indicators, whereas changes in the NDVI and land use play a significant role in the generation process of the LR model. The maps created by the LR model (Figure 7) were classified into five susceptibility categories using the equal interval method, based on the calculated probabilities (P): very high (>0.8), high (0.6–0.8), moderate (0.4–0.8), low (0.2–0.4), and very low (<0.2) (Figure 7). For the maps considering the time-varying predisposing factors in 2010 and 2020, the low- to very low-LS areas are mainly distributed in the mountainous areas north of the Li River, while the high- to very high-LS areas are mainly distributed in the croplands and artificial surface areas around the Li River and its tributaries (Figure 7A,B). When the changes in the predisposing factors are considered, the low- to very low-LS areas are mainly distributed in the mountainous areas and densely developed faults north and south of the LRV, while the high- to very high-LS areas are mainly distributed in the cropland and artificial surface areas around the Li River and its tributaries (Figure 7C).
Table 6.
Results of LR model.
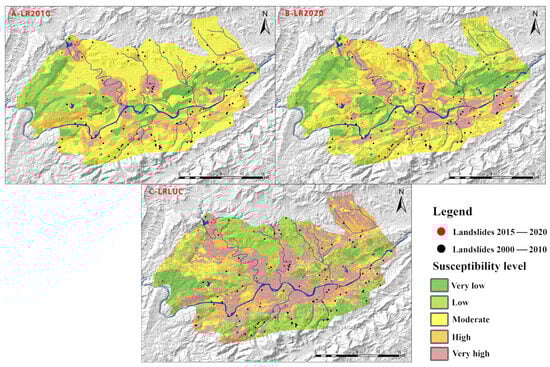
Figure 7.
LS maps of LR model: (A) LS map in 2010; (B) LS map in 2020; (C) LS map considering LUCs.
3.3. Model Validation and Performance Comparsion
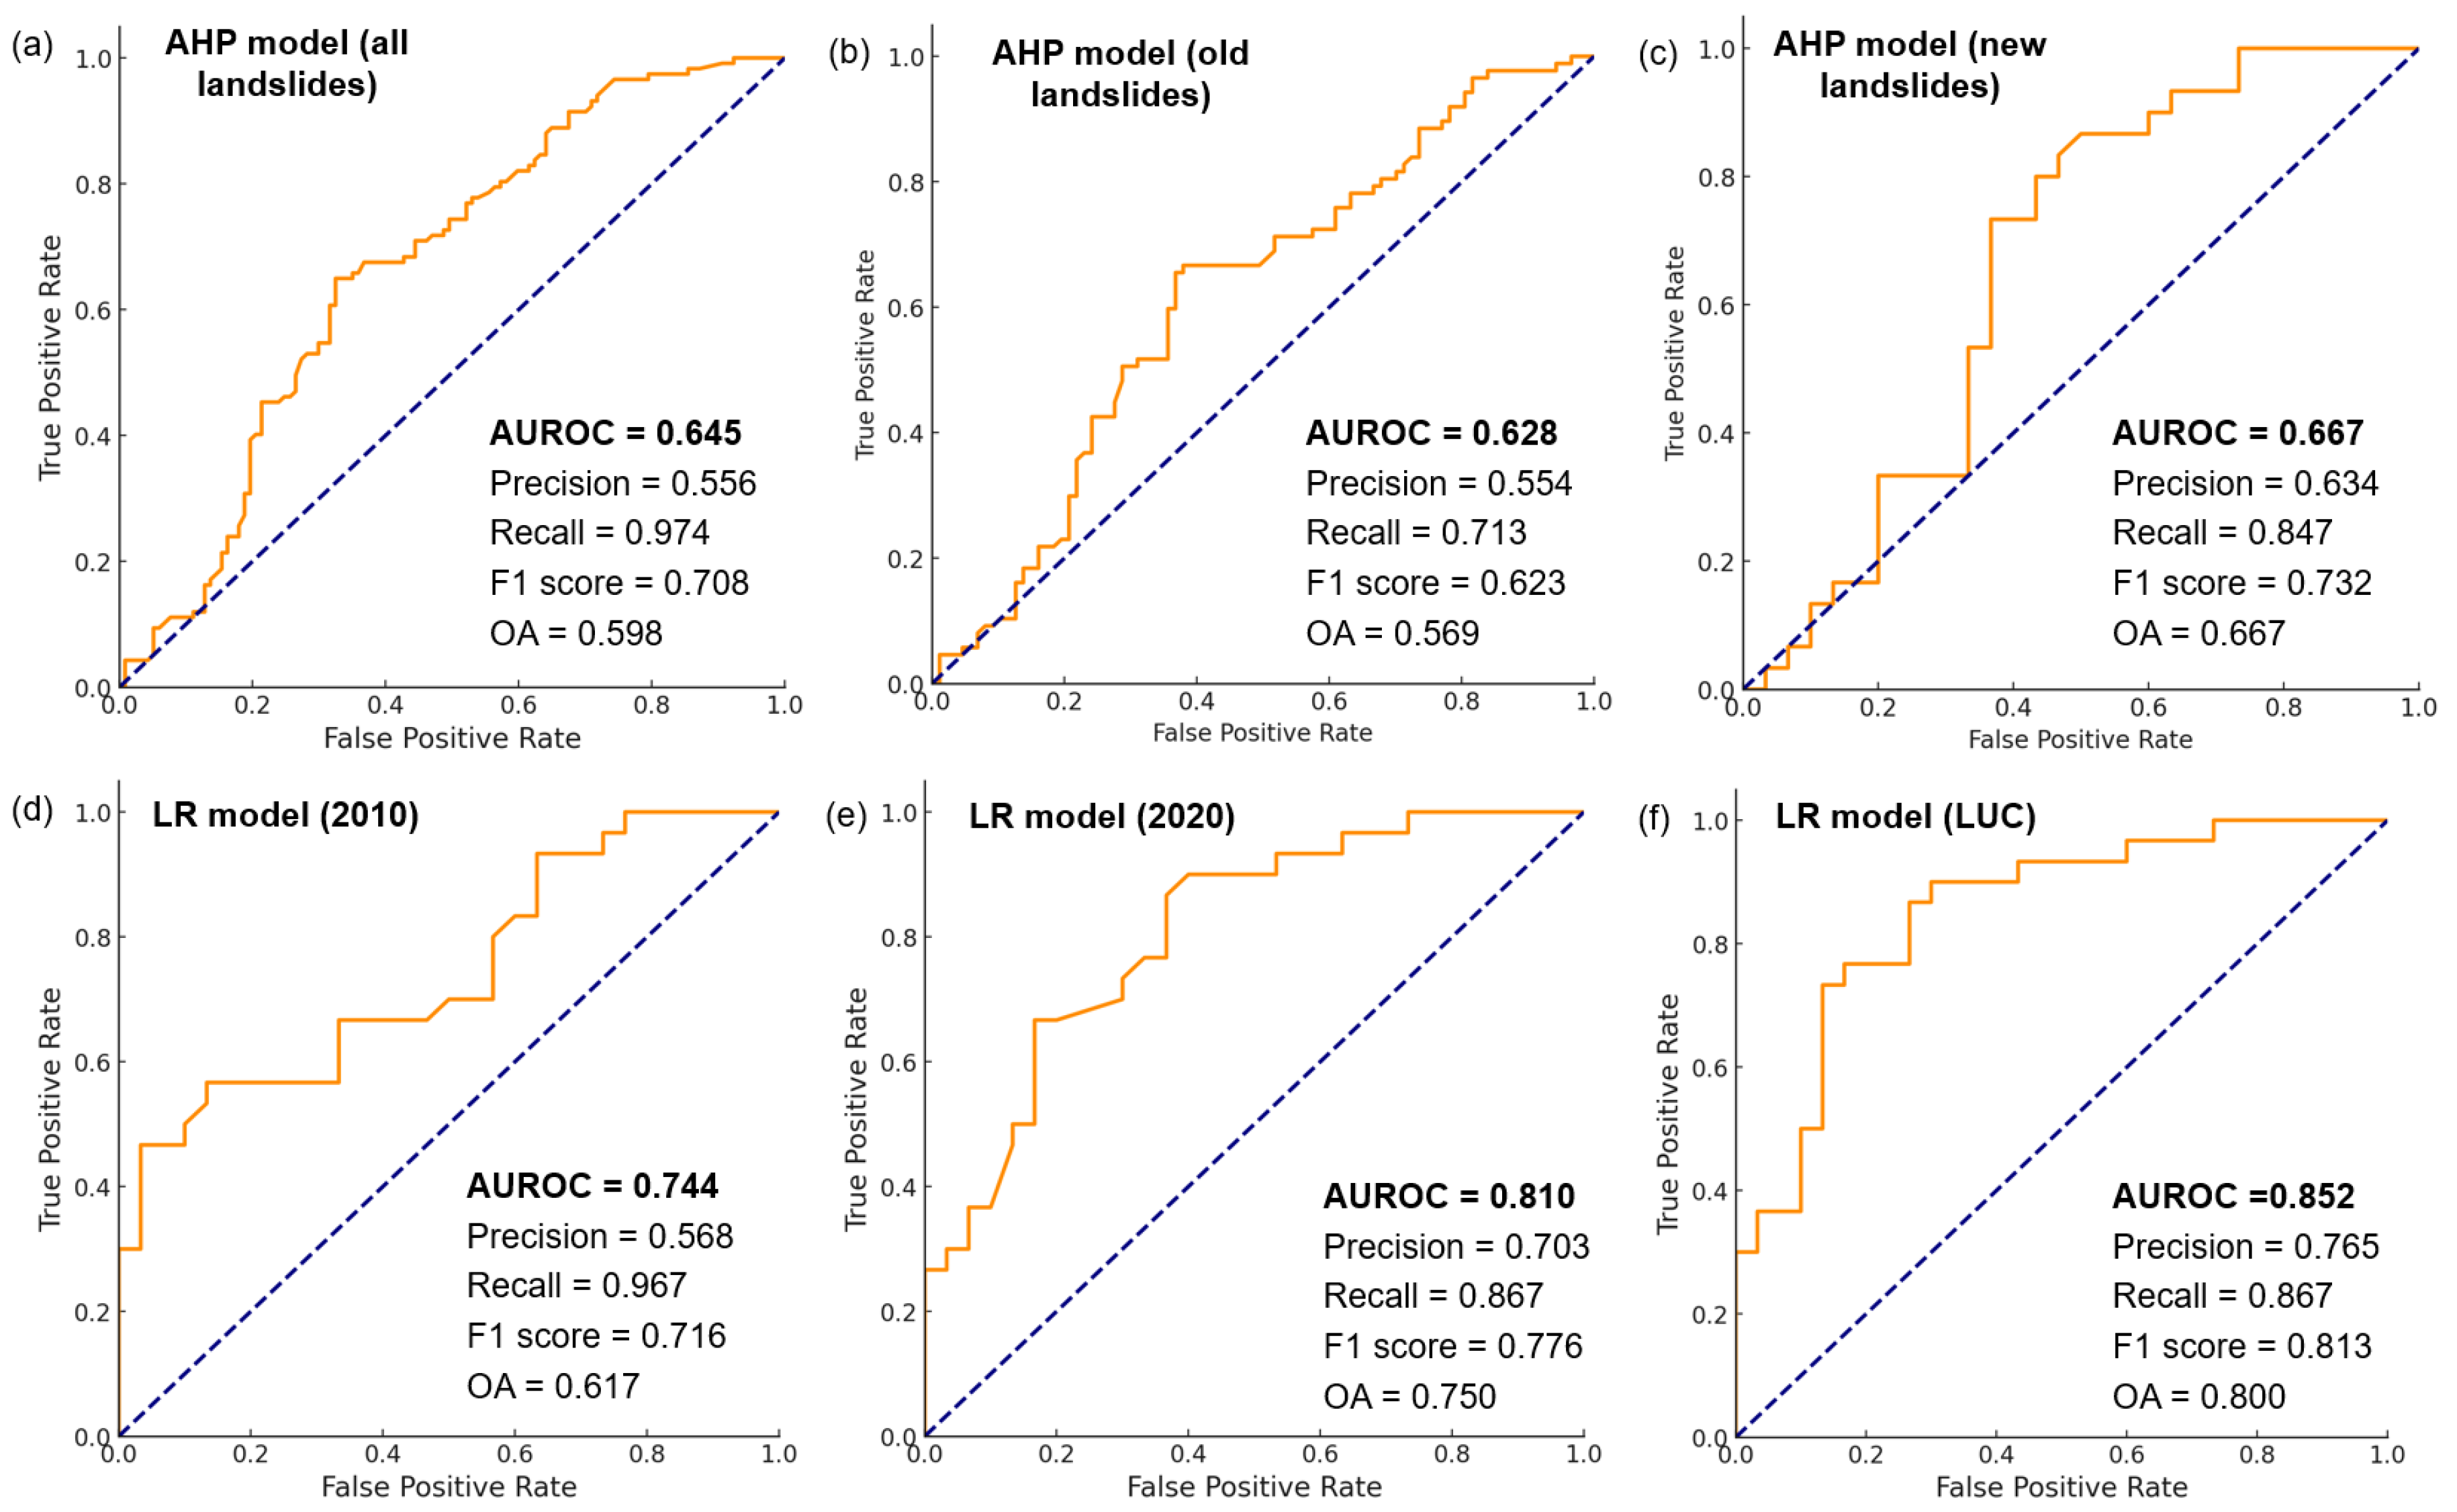
Figure 8 presents the validation results for the AHP-CI and LR models, and Table 7 shows the 95% confidence intervals of the ROC curves generated by bootstrap sampling 1000 times. For the AHP-CI model, validation was conducted using old landslide points, new landslide points, and all the landslide points, respectively, and the AUROC values were 0.628 (precision = 0.554, recall = 0.713, F1 score = 0.623, and OA = 0.569), 0.667 (with precision = 0.634, recall = 0.847, F1 score = 0.732, and OA = 0.667), and 0.645 (with precision = 0.556, recall = 0.974, F1 score = 0.708, and OA = 0.598), respectively (Figure 8a–c). For these three models, the lower bounds of their AUROC values range between 0.5 and 0.6, while the upper bounds are between 0.7 and 0.8. The LR model was validated using new landslides, and the AUROCs considering human activities in 2010 and 2020 are 0.744 (with precision = 0.568, recall = 0.968, F1 score = 0.716, and OA = 0.617) and 0.810 (with precision = 0.703, recall = 0.867, F1 score = 0.776, and OA = 0.750), respectively (Figure 8d,e). Figure 8f illustrates the performance of the LR model considering the human activity predisposing factors, and its UROC, precision, recall, F1 score, and OA are 0.852, 0.765, 0.813, and 0.800, respectively.
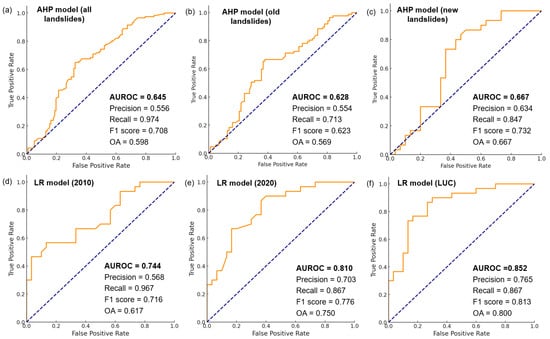
Figure 8.
Model performance comparison: (a) AHP-CI model (all landslides); (b) AHP-CI model (old landslides); (c) AHP-CI model; (d) LR model (2010); (e) LR model (2020); (f) LR model (LUC).
Table 7.
AUROC summary with 95% confidence intervals.
3.4. Future Prediction of LSA Using the CA–Markov Model
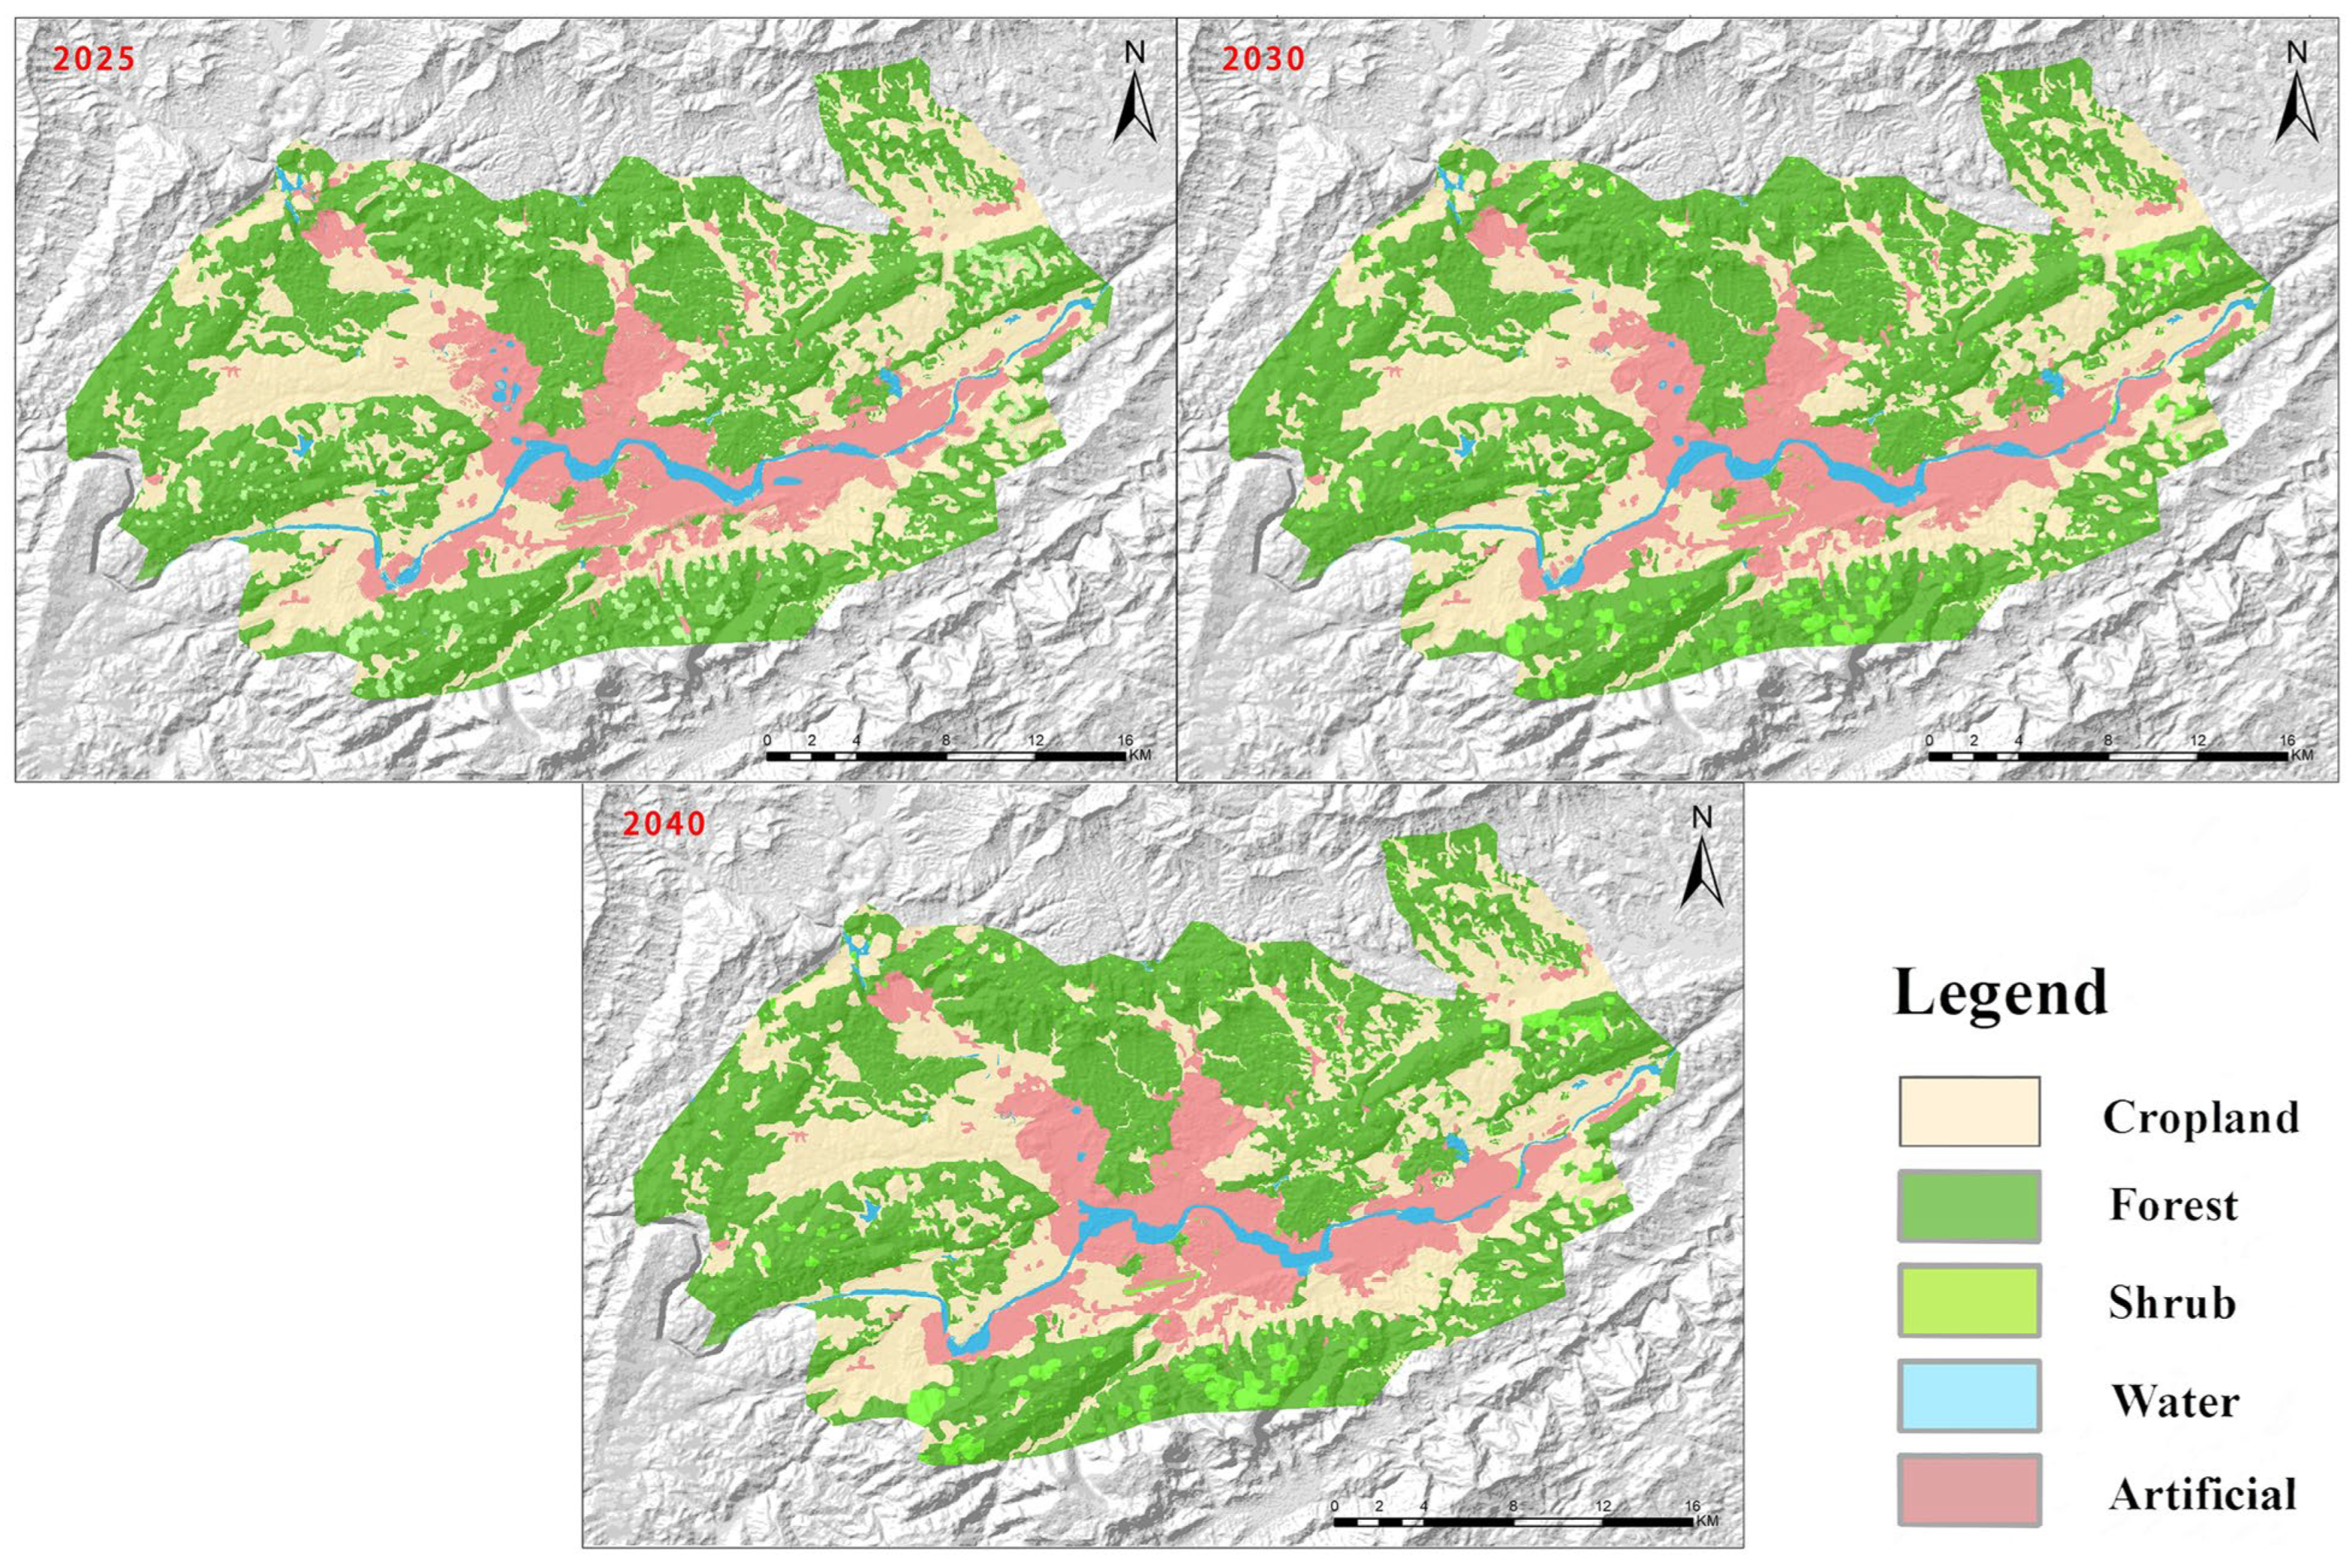
Building on the model performance comparison, it is determined that the LR model, incorporating existing landslide occurrences and time-varying predisposing factors (NDVI, LUC, and traffic density changes), serves as an effective tool for forecasting future LS. Due to the challenges associated with predicting future NDVI values in the current study and considering that changes in traffic density do not have a significant impact on landslide occurrences in the areas of the LRV (Table 6), we focus on land use as a case study for conducting future predictions of LSA. Utilizing the CA–Markov model, we predict future land changes to spatially forecast future landslide susceptibility in 2025, 2030, and 2040 as the short term, medium term, and long term. The slope gradient, lithology, elevation, density of faults, and density of rivers were selected as driving factors according to the above discussion results and previous results [67,68,69]. Figure 9 shows the predictions for land use in 2025, 2030, and 2040, respectively. Then, based on the prediction of land use, the future landslide susceptibility was assessed (Figure 10), indicating that with an expansion of the range of human activities, the high- to highest-susceptibility areas are mainly concentrated in the reaches of the Li River and its tributaries, and the low- to lowest-susceptibility areas are mainly distributed in the mountainous area with less human activity.
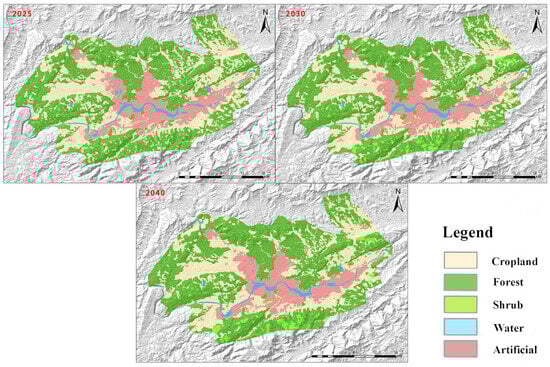
Figure 9.
Prediction of land use in 2025, 2030, and 2040.
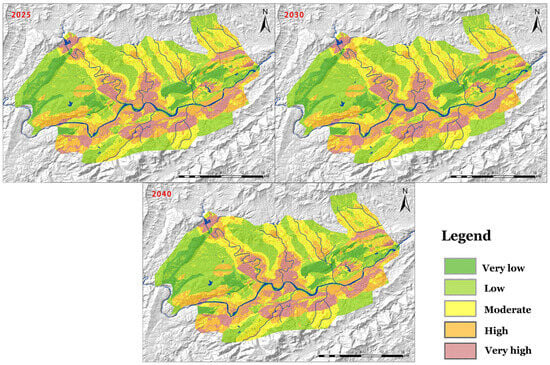
Figure 10.
Prediction of LS in 2025, 2030, and 2040.
4. Discussion
4.1. AHP-CI and LR Model Result Interpretation
In the AHP-CI model, slope gradient and lithology are considered the most critical predisposing factors, both having the same weight of 0.3281, which aligns with the outcomes of many studies on LSA based on the AHP-CI model [70,71,72,73]. This indicates that the geotechnical body, as the main body of landslides, along with slope as the driving force, are considered important factors causing landslides in the minds of most people. However, this contrasts with the outcomes from the LR model, highlighting the significant differences between heuristic and statistical models in their approach to model construction. According to Table 6, it can be found that slope gradient, aspect, and elevation were not significant factors in the LR model, despite slope gradient often being considered a crucial indicator of landslide occurrence. This is primarily attributed to the concentration of urban expansion in areas with gentle slopes from 2000 to 2010. With the expansion of cities, human activities, especially engineering construction, rapidly expand to high-slope regions, leading to an increase in landslides in areas with gentle slopes. This diminishes the importance of slope gradient as an indicator in the LR model. Similarly, human activities can reasonably account for the insignificance of aspect and elevation. Another interesting finding is that among the three new predisposing factors considering temporal changes, the NDVI and LUC played a role, but changes in traffic density did not affect landslide occurrence. Notably, regions with a ΔNDVI greater than 0.05 saw an RC of −3.513, while new cropland areas had an RC of 2.936. This suggests that afforestation policies can reduce the likelihood of landslides, whereas the conversion of land into cropland increases it, aligning with the findings of Xiong et al. [21], Depicker et al. [74], Hürlimann et al. [39], and Jurchescu et al. [40]. Therefore, prudent land planning is a vital measure for landslide management, and integrating environmental considerations (e.g., planting) into development projects is essential to reduce landslide susceptibility.
4.2. Model Performance Comparsion and Future Prediction of LSA by CA-Markov Model
In terms of the AHP-CI model, the results based on the ROC curve in Figure 8 demonstrate minimal variation and generally poor performance. Regardless of whether validation was conducted using old landslides, new landslides, or all the landslide points, all the AUROC values fell below 0.7. The AUROC values are very low, bordering on unacceptable, and the lower bound of the three AHP-CI models even approaches 0.5. The AHP-CI model primarily considers geological and environmental factors. It struggles to accurately predict landslides primarily driven by human activities, whether this human activity impacts occur over short-term (old landslides) or long-term (new landslides) periods. This limitation reflects the model’s inability to incorporate the significant impact of human interventions on landslide susceptibility effectively. Moreover, compared to the data-driven LR model, the inherent subjectivity of the AHP-CI model has also adversely affected its performance to some extent [6,75]. Therefore, the heuristic AHP-CI model, which is based solely on geological and environmental conditions, is not recommended for LSA under scenarios of LUC and urbanization from a temporal perspective.
For the three LR models, by using new landslides as validation data, it is found that using updated predisposing factors (2020) significantly improves the model performance compared to using the predisposing factors from 2010. This is primarily due to the dramatic LUC and urbanization, which also impact the fundamental geological and environmental conditions, such as the NDVI, land use, and traffic conditions [30,76,77]. Meanwhile, the models exhibit their best performance when employing time-varying predisposing factors. This not only confirms that LUCs and urbanization significantly affect landslide occurrences [41,76,78,79,80] but also indicates that not only the condition of LUC should be considered. Variations in the NDVI are also crucial measures of human activities, greatly contributing to the accuracy of the LSA models. However, the current predisposing factors measuring human activities or expansion primarily rely on changes in land use. The consideration of changes in the NDVI, road density, urbanization index, city accessibility, and other factors remain insufficient in existing studies. Therefore, a comprehensive consideration of predisposing factors that measure the impact of human activities and urban expansion on landslides may be key to enhancing model accuracy.
Figure 9 and Figure 10, respectively, show predictive maps for future land use and LS. This approach aligns with the framework for LSA simulations, with dynamic LUCs proposed by Xiong et al. [21] and Pham et al. [38]. Based on the results for 2025, 2030, and 2040, we can conclude that new artificial surfaces are mainly concentrated in the reaches of the Li River’s tributaries. These predictive results underscore the urgent need for proactive management strategies that not only focus on controlling and monitoring the spread of artificial surfaces but also incorporate comprehensive land use planning that integrates with LSA. For these high-LS areas, enhanced land management should involve the establishment of strict zoning laws and regulations that limit construction in these areas, the reinforcement of infrastructure to withstand potential landslides, and the restoration of natural vegetation to stabilize slopes and manage runoff. Furthermore, community awareness and preparedness programs are essential to ensure local populations understand the risks and can respond effectively in the event of a landslide.
4.3. Landslide Management and Sustainable Development
Land use and its changes are considered closely related to landslide management, and a bilateral management framework for landslide management and land management has also been proposed. However, there is currently a lack of a comprehensive understanding of integrating landslides, land use, and regional sustainable development. The UN SDGs offer a comprehensive framework, aiming to address global challenges such as poverty, inequality, and climate change, promoting a collaborative effort towards achieving a sustainable and equitable world by 2030 [81]. As reported by Nanehkaran et al. [42], Although none of the Sustainable Development Goals (SDGs) directly target landslides, multiple goals tangentially relate to this issue, including Goal 1 (No Poverty), Goal 11 (Sustainable Cities and Communities), Goal 13 (Climate Action), and Goal 15 (Life on Land). The relationship between these four SDGs and landslide mitigation is illustrated in Table 8, showcasing how each goal contributes to reducing landslide susceptibility through various strategies and actions. Herein, we aim to emphasize that although a significant body of literature positions LSA as a mechanism for managing landslides and mitigating the associated risks, this objective should not be perceived as terminal. Under the framework of the UN SDGs, greater emphasis should be placed on the attainment of landslide-related SDGs, as delineated in Table 8. The summary in Table 8 highlights a broad range of interconnected areas, including but not limited to land use, resource governance, housing solutions, early warning systems, urban planning strategies, infrastructure development, climatic considerations, and the ecosystem. Therefore, landslide management cannot rely solely on a single department; while bilateral management with land departments is crucial, it is not the end goal. A trend towards integrated, multi-sectoral management is emerging for the future. Consequently, future research should concentrate on how the results of landslide susceptibility predictions can be linked with the SDGs and on developing a more comprehensive and multi-stakeholder framework for sustainable landslide management.
Table 8.
The relationship between these four SDGs and landslide mitigation.
4.4. Limitations and Future Research
This study acknowledges four limitations and outlines four future directions. The first limitation concerns the inconsistency in the resolution of predisposing factors. Although resampling techniques were employed to address this issue, their impact on the results remains uncertain. This effect is deemed acceptable, aligning with assertions made in some publications on landslide susceptibility [21,82]. The second limitation derives from the LR model’s findings, which identify changes in the NDVI as a critical indicator for future LSA. However, predicting the NDVI is currently a challenging task in the field of remote sensing [83]. The third limitation is regarding the models we used. The AHP-CI model is an expert-based model, yet subjectivity still exists within it. The LR model is a data-dependent machine learning model, and the 117 landslide location samples used to build the model are somewhat insufficient. The fourth limitation concerns the transformation of continuous variables into categorical variables, which may oversimplify relationships and increase the model complexity due to the high number of parameters when there are many levels. Future research directions encompass three key areas: firstly, the adoption of prudent land planning and the integration of environmental considerations, such as reforestation, into development projects are deemed essential for reducing landslide susceptibility. Secondly, there is a need for a comprehensive evaluation of predisposing factors that quantify the impact of human activities on landslide occurrences. Thirdly, it is crucial to explore alternative methods like the Generalized Additive Model (GAM) in LSA to address the issue of nonlinearities. Lastly, forthcoming studies should focus on aligning the outcomes of landslide susceptibility predictions with SDGs, aiming to establish a more inclusive and multi-stakeholder framework that promotes sustainable management of landslide risks. This holistic approach is pivotal in advancing our understanding and mitigation strategies against landslides, highlighting the interplay between human activities, environmental stewardship, and sustainable development objectives.
5. Conclusions
Despite advancements in the modeling over decades, landslide occurrence caused by LUC and urbanization due to extensive human activities poses ongoing challenges for precise LS predictions. This study employs two typical heuristic (AHP-CI) and statistical (LR) models to discuss the impact of changes in three time-varying and human activity predisposing factors (changes in land type, the NDVI, and traffic density) on LSA by taking the LRV in Yongding as a case study. The main findings are shown as follows.
Four LS maps were generated using the AHP-CI and LR models, and the RCs in the LR model highlight the significance of land changes and NDVI variations as key parameters. The AHP-CI model, constrained by its focus on geological and environmental factors and subjective nature, underperforms in LUC and urbanization. For the AHP-CI model, the validation process was conducted using old landslide points, new landslide points, and all landslide points, respectively. Their respective AUROC values were 0.628, 0.667, and 0.645, with the AUROC values consistently below 0.7. Conversely, however, when all the time-varying human activity predisposing factors (changes of land use, NDVI and traffic density) are considered, the LR model (AUROC = 0.852, precision = 0.765, recall = 0.867, F1 score = 0.813 and overall accuracy = 0.800) performs significantly better in terms of its accuracy under the conditions of only considering 2010 (AUROC = 0.744) and 2020 (AUROC = 0.810). This highlights the importance of incorporating a broad spectrum of human-related factors for improving LSA accuracy.
Employing the CA–Markov model for predicting future land use, our study spatially forecasts LS for 2025, 2030, and 2040. The predictions indicate increased LS in areas near the Li River due to urban expansion, highlighting the need for focused management strategies in terms of artificial surface control and the integration of land use planning with LSA to reduce landslide risks effectively.
While LUCs are closely linked to landslide management, the existing frameworks lack a holistic view integrating landslides, land use, and sustainable development. The UN SDGs provide a broad scaffold for addressing global challenges, including those related to landslides through Goals 1, 11, 13, and 15. Our analysis underscores the necessity of transcending traditional, single-department approaches and moving towards a comprehensive, multi-sectoral strategy that aligns LSA with the broader objectives of the SDGs. Future research should aim to enhance landslide management through prudent land planning, reforestation, comprehensive evaluation of human-impact-related predisposing factors, and the alignment of LS predictions with the SDGs, fostering a holistic, multi-stakeholder approach to sustainable mitigation strategies.
Author Contributions
Conceptualization, H.X. and Y.Q.; methodology, C.Y., Y.Q. and J.W.; software, Y.Q., J.W. and S.L.; validation, C.Y., H.X. and R.X.; formal analysis, H.X. and S.L.; investigation, Y.Q. and C.Y.; resources, Y.Q. and X.L.; data curation, C.Y.; writing—original draft preparation, Y.Q.; writing—review and editing, C.Y., J.W., S.L., R.X., X.L., L.G., X.G., C.M. and H.X.; visualization, C.Y.; supervision, H.X. and Y.Q.; project administration, C.M., H.X. and Y.Q.; funding acquisition, X.G. All authors have read and agreed to the published version of the manuscript.
Funding
This work was financially supported by Kashgar Regional Science and Technology Program Funding Project (Construction of Meteorological Risk Warning System for Regional Landslide Disasters Induced by Rainfall, KS202330).
Institutional Review Board Statement
Not applicable.
Informed Consent Statement
Not applicable.
Data Availability Statement
The authors do not have permission to share the data.
Conflicts of Interest
The authors declare no conflicts of interest.
References
- Rohan, T.; Shelef, E.; Mirus, B.; Coleman, T. Prolonged influence of urbanization on landslide susceptibility. Landslides 2023, 20, 1433–1447. [Google Scholar] [CrossRef]
- Thein, K.S.M.; Nagai, M.; Nakamura, T.; Phienwej, N.; Pal, I. Assessment of the Impacts of Urbanization on Landslide Susceptibility in Hakha City, A Mountainous Region of Western Myanmar. Land 2023, 12, 1036. [Google Scholar] [CrossRef]
- Malka, A. GIS-Based Landslide Susceptibility Modelling in Urbanized Areas: A Case Study of the Tri-City Area of Poland. GeoHazards 2022, 3, 508–528. [Google Scholar] [CrossRef]
- Ye, B.; Qiu, H.; Tang, B.; Liu, Y.; Liu, Z.; Jiang, X.; Yang, D.; Ullah, M.; Zhu, Y.; Kamp, U. Creep deformation monitoring of landslides in a reservoir area. J. Hydrol. 2024, 632, 130905. [Google Scholar] [CrossRef]
- Guzzetti, F.; Reichenbach, P.; Ardizzone, F.; Cardinali, M.; Galli, M. Estimating the quality of landslide susceptibility models. Geomorphology 2006, 81, 166–184. [Google Scholar] [CrossRef]
- Reichenbach, P.; Rossi, M.; Malamud, B.D.; Mihir, M.; Guzzetti, F. A review of statistically-based landslide susceptibility models. Earth-Sci. Rev. 2018, 180, 60–91. [Google Scholar] [CrossRef]
- Huang, F.; Cao, Z.; Guo, J.; Jiang, S.-H.; Li, S.; Guo, Z. Comparisons of heuristic, general statistical and machine learning models for landslide susceptibility prediction and mapping. Catena 2020, 191, 104580. [Google Scholar] [CrossRef]
- Pellicani, R.; Frattini, P.; Spilotro, G. Landslide susceptibility assessment in Apulian Southern Apennine: Heuristic vs. statistical methods. Environ. Earth Sci. 2014, 72, 1097–1108. [Google Scholar] [CrossRef]
- Cervi, F.; Berti, M.; Borgatti, L.; Ronchetti, F.; Manenti, F.; Corsini, A. Comparing predictive capability of statistical and deterministic methods for landslide susceptibility mapping: A case study in the northern Apennines (Reggio Emilia Province, Italy). Landslides 2010, 7, 433–444. [Google Scholar] [CrossRef]
- Yalcin, A. GIS-based landslide susceptibility mapping using analytical hierarchy process and bivariate statistics in Ardesen (Turkey): Comparisons of results and confirmations. Catena 2008, 72, 1–12. [Google Scholar] [CrossRef]
- Akgun, A.; Dag, S.; Bulut, F. Landslide susceptibility mapping for a landslide-prone area (Findikli, NE of Turkey) by likelihood-frequency ratio and weighted linear combination models. Environ. Geol. 2008, 54, 1127–1143. [Google Scholar] [CrossRef]
- Stanley, T.; Kirschbaum, D.B. A heuristic approach to global landslide susceptibility mapping. Nat. Hazards 2017, 87, 145–164. [Google Scholar] [CrossRef] [PubMed]
- Du, J.; Glade, T.; Woldai, T.; Chai, B.; Zeng, B. Landslide susceptibility assessment based on an incomplete landslide inventory in the Jilong Valley, Tibet, Chinese Himalayas. Eng. Geol. 2020, 270, 105572. [Google Scholar] [CrossRef]
- De Vita, P.; Napolitano, E.; Godt, J.; Baum, R. Deterministic estimation of hydrological thresholds for shallow landslide initiation and slope stability models: Case study from the Somma-Vesuvius area of southern Italy. Landslides 2013, 10, 713–728. [Google Scholar] [CrossRef]
- Jelínek, R.; Wagner, P. Landslide hazard zonation by deterministic analysis (Veľká Čausa landslide area, Slovakia). Landslides 2007, 4, 339–350. [Google Scholar] [CrossRef]
- Ciurleo, M.; Cascini, L.; Calvello, M. A comparison of statistical and deterministic methods for shallow landslide susceptibility zoning in clayey soils. Eng. Geol. 2017, 223, 71–81. [Google Scholar] [CrossRef]
- Pradhan, A.M.S.; Oh, J.-R.; Jung, M.-S.; Kim, Y.-T. Predictive capability of deterministic and statistical models in weathered granite soil watershed. In Landslide Science for a Safer Geoenvironment; Volume 2: Methods of Landslide Studies; Springer: Berlin/Heidelberg, Germany, 2014; pp. 507–512. [Google Scholar]
- Lin, W.; Yin, K.; Wang, N.; Xu, Y.; Guo, Z.; Li, Y. Landslide hazard assessment of rainfall-induced landslide based on the CF-SINMAP model: A case study from Wuling Mountain in Hunan Province, China. Nat. Hazards 2021, 106, 679–700. [Google Scholar] [CrossRef]
- Guo, Z.; Tian, B.; He, J.; Xu, C.; Zeng, T.; Zhu, Y. Hazard assessment for regional typhoon-triggered landslides by using physically-based model–a case study from southeastern China. Georisk Assess. Manag. Risk Eng. Syst. Geohazards 2023, 17, 740–754. [Google Scholar] [CrossRef]
- Jia, N.; Mitani, Y.; Xie, M.; Tong, J.; Yang, Z. GIS deterministic model-based 3D large-scale artificial slope stability analysis along a highway using a new slope unit division method. Nat. Hazards 2015, 76, 873–890. [Google Scholar] [CrossRef]
- Xiong, H.; Ma, C.; Li, M.; Tan, J.; Wang, Y. Landslide susceptibility prediction considering land use change and human activity: A case study under rapid urban expansion and afforestation in China. Sci. Total Environ. 2023, 866, 161430. [Google Scholar] [CrossRef]
- Liu, Y.; Qiu, H.; Kamp, U.; Wang, N.; Wang, J.; Huang, C.; Tang, B. Higher temperature sensitivity of retrogressive thaw slump activity in the Arctic compared to the Third Pole. Sci. Total Environ. 2024, 914, 170007. [Google Scholar] [CrossRef] [PubMed]
- Lee, S. Application of logistic regression model and its validation for landslide susceptibility mapping using GIS and remote sensing data. Int. J. Remote Sens. 2005, 26, 1477–1491. [Google Scholar] [CrossRef]
- Park, S.; Choi, C.; Kim, B.; Kim, J. Landslide susceptibility mapping using frequency ratio, analytic hierarchy process, logistic regression, and artificial neural network methods at the Inje area, Korea. Environ. Earth Sci. 2013, 68, 1443–1464. [Google Scholar] [CrossRef]
- Kayastha, P.; Dhital, M.R.; De Smedt, F. Landslide susceptibility mapping using the weight of evidence method in the Tinau watershed, Nepal. Nat. Hazards 2012, 63, 479–498. [Google Scholar] [CrossRef]
- Shahri, A.A.; Spross, J.; Johansson, F.; Larsson, S. Landslide susceptibility hazard map in southwest Sweden using artificial neural network. Catena 2019, 183, 104225. [Google Scholar] [CrossRef]
- Wang, Y.; Fang, Z.; Wang, M.; Peng, L.; Hong, H. Comparative study of landslide susceptibility mapping with different recurrent neural networks. Comput. Geosci. 2020, 138, 104445. [Google Scholar] [CrossRef]
- Remondo, J.; Bonachea, J.; Cendrero, A. A statistical approach to landslide risk modelling at basin scale: From landslide susceptibility to quantitative risk assessment. Landslides 2005, 2, 321–328. [Google Scholar] [CrossRef]
- Pacheco Quevedo, R.; Velastegui-Montoya, A.; Montalván-Burbano, N.; Morante-Carballo, F.; Korup, O.; Daleles Rennó, C. Land use and land cover as a conditioning factor in landslide susceptibility: A literature review. Landslides 2023, 20, 967–982. [Google Scholar] [CrossRef]
- Shu, H.; Hürlimann, M.; Molowny-Horas, R.; González, M.; Pinyol, J.; Abancó, C.; Ma, J. Relation between land cover and landslide susceptibility in Val d’Aran, Pyrenees (Spain): Historical aspects, present situation and forward prediction. Sci. Total Environ. 2019, 693, 133557. [Google Scholar] [CrossRef]
- Gariano, S.L.; Guzzetti, F. Landslides in a changing climate. Earth-Sci. Rev. 2016, 162, 227–252. [Google Scholar] [CrossRef]
- Baioni, D. Human activity and damaging landslides and floods on Madeira Island. Nat. Hazards Earth Syst. Sci. 2011, 11, 3035–3046. [Google Scholar] [CrossRef]
- Zhou, N.-Q.; Zhao, S. Urbanization process and induced environmental geological hazards in China. Nat. Hazards 2013, 67, 797–810. [Google Scholar] [CrossRef]
- Mitsuda, Y.; Ito, S. A review of spatial-explicit factors determining spatial distribution of land use/land-use change. Landsc. Ecol. Eng. 2011, 7, 117–125. [Google Scholar] [CrossRef]
- Rowcroft, P. Frontiers of change: The reasons behind land-use change in the Mekong Basin. AMBIO J. Hum. Environ. 2008, 37, 213–218. [Google Scholar] [CrossRef]
- Pisano, L.; Zumpano, V.; Malek, Ž.; Rosskopf, C.M.; Parise, M. Variations in the susceptibility to landslides, as a consequence of land cover changes: A look to the past, and another towards the future. Sci. Total Environ. 2017, 601, 1147–1159. [Google Scholar] [CrossRef]
- Meneses, B.M.; Pereira, S.; Reis, E. Effects of different land use and land cover data on the landslide susceptibility zonation of road networks. Nat. Hazards Earth Syst. Sci. 2019, 19, 471–487. [Google Scholar] [CrossRef]
- Pham, Q.B.; Chandra Pal, S.; Chakrabortty, R.; Saha, A.; Janizadeh, S.; Ahmadi, K.; Khedher, K.M.; Anh, D.T.; Tiefenbacher, J.P.; Bannari, A. Predicting landslide susceptibility based on decision tree machine learning models under climate and land use changes. Geocarto Int. 2022, 37, 7881–7907. [Google Scholar] [CrossRef]
- Hürlimann, M.; Guo, Z.; Puig-Polo, C.; Medina, V. Impacts of future climate and land cover changes on landslide susceptibility: Regional scale modelling in the Val d’Aran region (Pyrenees, Spain). Landslides 2022, 19, 99–118. [Google Scholar] [CrossRef]
- Jurchescu, M.; Kucsicsa, G.; Micu, M.; Bălteanu, D.; Sima, M.; Popovici, E.-A. Implications of future land-use/cover pattern change on landslide susceptibility at a national level: A scenario-based analysis in Romania. Catena 2023, 231, 107330. [Google Scholar] [CrossRef]
- Chowdhuri, I.; Pal, S.C.; Chakrabortty, R.; Malik, S.; Das, B.; Roy, P.; Sen, K. Spatial prediction of landslide susceptibility using projected storm rainfall and land use in Himalayan region. Bull. Eng. Geol. Environ. 2021, 80, 5237–5258. [Google Scholar] [CrossRef]
- Nanehkaran, Y.A.; Chen, B.; Cemiloglu, A.; Chen, J.; Anwar, S.; Azarafza, M.; Derakhshani, R. Riverside landslide susceptibility overview: Leveraging artificial neural networks and machine learning in accordance with the United Nations (UN) sustainable development goals. Water 2023, 15, 2707. [Google Scholar] [CrossRef]
- Yahman, N.K.; Sarkom, Y.; Ariff, N.R.M. Achieving SDGs 11: A Review on Neighbourhood Engagement in Local Authorities towards Disaster Risk Reduction of Highland Developments in Selangor; IOP Conference Series: Earth and Environmental Science; IOP Publishing: Bristol, UK, 2022; p. 012007. [Google Scholar]
- Tian, N.; Lan, H. The indispensable role of resilience in rational landslide risk management for social sustainability. Geogr. Sustain. 2023, 4, 70–83. [Google Scholar] [CrossRef]
- Bolla, A.; Paronuzzi, P. Geomechanical field survey to identify an unstable rock slope: The Passo della Morte case history (NE Italy). Rock Mech. Rock Eng. 2020, 53, 1521–1544. [Google Scholar] [CrossRef]
- Ma, C.; Yan, Z.; Huang, P.; Gao, L. Evaluation of landslide susceptibility based on the occurrence mechanism of landslide: A case study in Yuan’an county, China. Environ. Earth Sci. 2021, 80, 94. [Google Scholar] [CrossRef]
- Gomez, H.; Kavzoglu, T. Assessment of shallow landslide susceptibility using artificial neural networks in Jabonosa River Basin, Venezuela. Eng. Geol. 2005, 78, 11–27. [Google Scholar] [CrossRef]
- Tan, J.; Yang, C.; Wang, Y.; Xiong, H.; Ma, C. A hybrid model to overcome landslide inventory incompleteness issue for landslide susceptibility prediction. Geocarto Int. 2024, 39, 2322066. [Google Scholar] [CrossRef]
- Ercanoglu, M.; Gokceoglu, C. Assessment of landslide susceptibility for a landslide-prone area (north of Yenice, NW Turkey) by fuzzy approach. Environ. Geol. 2002, 41, 720–730. [Google Scholar]
- Segoni, S.; Pappafico, G.; Luti, T.; Catani, F. Landslide susceptibility assessment in complex geological settings: Sensitivity to geological information and insights on its parameterization. Landslides 2020, 17, 2443–2453. [Google Scholar] [CrossRef]
- Xie, Z.; Chen, G.; Meng, X.; Zhang, Y.; Qiao, L.; Tan, L. A comparative study of landslide susceptibility mapping using weight of evidence, logistic regression and support vector machine and evaluated by SBAS-InSAR monitoring: Zhouqu to Wudu segment in Bailong River Basin, China. Environ. Earth Sci. 2017, 76, 313. [Google Scholar] [CrossRef]
- Pourghasemi, H.R.; Teimoori Yansari, Z.; Panagos, P.; Pradhan, B. Analysis and evaluation of landslide susceptibility: A review on articles published during 2005–2016 (periods of 2005–2012 and 2013–2016). Arab. J. Geosci. 2018, 11, 193. [Google Scholar] [CrossRef]
- Pourghasemi, H.R.; Kornejady, A.; Kerle, N.; Shabani, F. Investigating the effects of different landslide positioning techniques, landslide partitioning approaches, and presence-absence balances on landslide susceptibility mapping. Catena 2020, 187, 104364. [Google Scholar] [CrossRef]
- Bui, D.T.; Lofman, O.; Revhaug, I.; Dick, O. Landslide susceptibility analysis in the Hoa Binh province of Vietnam using statistical index and logistic regression. Nat. Hazards 2011, 59, 1413–1444. [Google Scholar] [CrossRef]
- Raja, N.B.; Çiçek, I.; Türkoğlu, N.; Aydin, O.; Kawasaki, A. Landslide susceptibility mapping of the Sera River Basin using logistic regression model. Nat. Hazards 2017, 85, 1323–1346. [Google Scholar] [CrossRef]
- Chen, T.; Niu, R.; Jia, X. A comparison of information value and logistic regression models in landslide susceptibility mapping by using GIS. Environ. Earth Sci. 2016, 75, 867. [Google Scholar] [CrossRef]
- Saaty, T.L. Axiomatic foundation of the analytic hierarchy process. Manag. Sci. 1986, 32, 841–855. [Google Scholar] [CrossRef]
- Xiong, H.; Sun, Y.; Ren, X. Comprehensive assessment of water sensitive urban design practices based on multi-criteria decision analysis via a case study of the University of Melbourne, Australia. Water 2020, 12, 2885. [Google Scholar] [CrossRef]
- Li, M.; Guo, Y.; Luo, D.; Ma, C. A Hybrid Variable Weight Theory Approach of Hierarchical Analysis and Multi-Layer Perceptron for Landslide Susceptibility Evaluation: A Case Study in Luanchuan County, China. Sustainability 2023, 15, 1908. [Google Scholar] [CrossRef]
- Wang, Z.; Xiong, H.; Ma, C.; Zhang, F.; Li, X. Assessment of groundwater vulnerability by applying the improved DRASTIC model: A case in Guyuan City, Ningxia, China. Environ. Sci. Pollut. Res. 2023, 30, 59062–59075. [Google Scholar] [CrossRef]
- Wang, Z.; Xiong, H.; Zhang, F.; Qiu, Y.; Ma, C. Sustainable development assessment of ecological vulnerability in arid areas under the influence of multiple indicators. J. Clean. Prod. 2024, 436, 140629. [Google Scholar] [CrossRef]
- Bursac, Z.; Gauss, C.H.; Williams, D.K.; Hosmer, D.W. Purposeful selection of variables in logistic regression. Source Code Biol. Med. 2008, 3, 17. [Google Scholar] [CrossRef] [PubMed]
- Stoltzfus, J.C. Logistic regression: A brief primer. Acad. Emerg. Med. 2011, 18, 1099–1104. [Google Scholar] [CrossRef] [PubMed]
- Morrissey, E.R.; McElnay, J.C.; Scott, M.; McConnell, B.J. Influence of drugs, demographics and medical history on hospital readmission of elderly patients: A predictive model. Clin. Drug Investig. 2003, 23, 119–128. [Google Scholar] [CrossRef]
- Bendel, R.B.; Afifi, A.A. Comparison of stopping rules in forward “stepwise” regression. J. Am. Stat. Assoc. 1977, 72, 46–53. [Google Scholar]
- Sang, L.; Zhang, C.; Yang, J.; Zhu, D.; Yun, W. Simulation of land use spatial pattern of towns and villages based on CA–Markov model. Math. Comput. Model. 2011, 54, 938–943. [Google Scholar] [CrossRef]
- Wu, Y.; Ke, Y.; Chen, Z.; Liang, S.; Zhao, H.; Hong, H. Application of alternating decision tree with AdaBoost and bagging ensembles for landslide susceptibility mapping. Catena 2020, 187, 104396. [Google Scholar] [CrossRef]
- Daba, M.H.; You, S. Quantitatively assessing the future land-use/land-cover changes and their driving factors in the upper stream of the Awash River based on the CA–markov model and their implications for water resources management. Sustainability 2022, 14, 1538. [Google Scholar] [CrossRef]
- Hamad, R.; Balzter, H.; Kolo, K. Predicting land use/land cover changes using a CA-Markov model under two different scenarios. Sustainability 2018, 10, 3421. [Google Scholar] [CrossRef]
- Pourghasemi, H.R.; Pradhan, B.; Gokceoglu, C. Application of fuzzy logic and analytical hierarchy process (AHP) to landslide susceptibility mapping at Haraz watershed, Iran. Nat. Hazards 2012, 63, 965–996. [Google Scholar] [CrossRef]
- Kayastha, P.; Dhital, M.R.; De Smedt, F. Application of the analytical hierarchy process (AHP) for landslide susceptibility mapping: A case study from the Tinau watershed, west Nepal. Comput. Geosci. 2013, 52, 398–408. [Google Scholar] [CrossRef]
- Abedini, M.; Tulabi, S. Assessing LNRF, FR, and AHP models in landslide susceptibility mapping index: A comparative study of Nojian watershed in Lorestan province, Iran. Environ. Earth Sci. 2018, 77, 405. [Google Scholar] [CrossRef]
- Ercanoglu, M.; Kasmer, O.; Temiz, N. Adaptation and comparison of expert opinion to analytical hierarchy process for landslide susceptibility mapping. Bull. Eng. Geol. Environ. 2008, 67, 565–578. [Google Scholar] [CrossRef]
- Depicker, A.; Jacobs, L.; Mboga, N.; Smets, B.; Van Rompaey, A.; Lennert, M.; Wolff, E.; Kervyn, F.; Michellier, C.; Dewitte, O. Historical dynamics of landslide risk from population and forest-cover changes in the Kivu Rift. Nat. Sustain. 2021, 4, 965–974. [Google Scholar] [CrossRef]
- Shano, L.; Raghuvanshi, T.K.; Meten, M. Landslide susceptibility evaluation and hazard zonation techniques—A review. Geoenviron. Disasters 2020, 7, 18. [Google Scholar] [CrossRef]
- Rabby, Y.W.; Li, Y.; Abedin, J.; Sabrina, S. Impact of land use/land cover change on landslide susceptibility in Rangamati Municipality of Rangamati District, Bangladesh. ISPRS Int. J. Geo-Inf. 2022, 11, 89. [Google Scholar] [CrossRef]
- Pineda, M.; Viloria, J.; Martínez-Casasnovas, J.A. Landslides susceptibility change over time according to terrain conditions in a mountain area of the tropic region. Environ. Monit. Assess. 2016, 188, 255. [Google Scholar] [CrossRef] [PubMed]
- Chen, L.; Guo, Z.; Yin, K.; Shrestha, D.P.; Jin, S. The influence of land use and land cover change on landslide susceptibility: A case study in Zhushan Town, Xuan’en County (Hubei, China). Nat. Hazards Earth Syst. Sci. 2019, 19, 2207–2228. [Google Scholar] [CrossRef]
- Tyagi, A.; Tiwari, R.K.; James, N. Mapping the landslide susceptibility considering future land-use land-cover scenario. Landslides 2023, 20, 65–76. [Google Scholar] [CrossRef]
- Persichillo, M.G.; Bordoni, M.; Meisina, C. The role of land use changes in the distribution of shallow landslides. Sci. Total Environ. 2017, 574, 924–937. [Google Scholar] [CrossRef]
- Hák, T.; Janoušková, S.; Moldan, B. Sustainable Development Goals: A need for relevant indicators. Ecol. Indic. 2016, 60, 565–573. [Google Scholar] [CrossRef]
- Roodposhti, M.S.; Aryal, J.; Pradhan, B. A novel rule-based approach in mapping landslide susceptibility. Sensors 2019, 19, 2274. [Google Scholar] [CrossRef] [PubMed]
- Berger, A.; Ettlin, G.; Quincke, C.; Rodríguez-Bocca, P. Predicting the Normalized Difference Vegetation Index (NDVI) by training a crop growth model with historical data. Comput. Electron. Agric. 2019, 161, 305–311. [Google Scholar] [CrossRef]

Disclaimer/Publisher’s Note: The statements, opinions and data contained in all publications are solely those of the individual author(s) and contributor(s) and not of MDPI and/or the editor(s). MDPI and/or the editor(s) disclaim responsibility for any injury to people or property resulting from any ideas, methods, instructions or products referred to in the content. |
© 2024 by the authors. Licensee MDPI, Basel, Switzerland. This article is an open access article distributed under the terms and conditions of the Creative Commons Attribution (CC BY) license (https://creativecommons.org/licenses/by/4.0/).