Article

Harnessing Curtailed Wind-Generated Electricity via Electrical Water Heating Aggregation to Alleviate Energy Poverty: A Use Case in Ireland

1
Dublin Energy Lab & Built Environment Research and Innovation Centre, Technological University Dublin, D07 EWV4 Dublin, Ireland
2
MaREI—SFI Research Centre for Energy, Climate and Marine Research, P43 C573 Cork, Ireland
*
Author to whom correspondence should be addressed.
Sustainability 2024, 16(11), 4470; https://doi.org/10.3390/su16114470
Submission received: 25 March 2024 / Revised: 9 May 2024 / Accepted: 20 May 2024 / Published: 24 May 2024
(This article belongs to the Special Issue Renewable Energies in the Built Environment)

Abstract

:
Ireland experiences high energy poverty rates alongside surplus wind energy resources. With 77% of Irish households equipped with electrical immersion heaters for domestic hot water (DHW) generation, this study proposes an Electrical Water Heating Aggregation (EWHA) scheme. The scheme allocates surplus wind-generated electricity to provide DHW to fuel-poor households, thereby alleviating energy poverty through harnessing curtailed wind energy. Through a developed wind-generated electricity allocation model and half-hourly data analysis for a weather year, this research assesses the feasibility and economic viability of the EWHA scheme, focusing on the householder as the primary benefactor from the scheme (as opposed to ancillary grid service provision). The results suggest an optimal aggregation size where maximum curtailment and carbon offset coincide with maximum benefits for participants. The findings indicate that fuel-poor households in Ireland could receive a full DHW tank every three weeks using surplus wind energy, harnessing 89% of overnight curtailed wind energy and offsetting 33 MkgCO2 annually. Moreover, the scheme could potentially save the Irish state approximately EUR 4 million by 2030, increasing to EUR 11 million by 2050, in carbon costs. Overall, this research demonstrates the potential of EWHA schemes to alleviate energy poverty, optimise wind energy utilisation, and contribute significantly to carbon emission reduction targets.

1. Introduction

Increased penetration of wind and solar energy into power systems is being sought to offset fossil fuels and decarbonise electricity generation [1]. Driven by policies, incentives and declining costs, wind and solar electricity generation has increased substantially [1,2] and is set to continue as follows:
  • The share of renewable energy in the European Union (EU) is targeted to double from 17.5% in 2017 [3] to 42.5% in 2030 [4];
  • The United States is targeting a 50% to 52% reduction in greenhouse gas (GHG) emissions from 2005 levels by 2030 [5].
  • China has pledged that 25% of its primary energy will be derived from non-fossil fuels by 2030 [6].
Global electricity generation capacity from wind has multiplied over five-fold from 200 GW in 2010 to 651 GW in 2019 [7] and 1021 GW in 2024 [8], providing 7.33% of the world’s electricity demand in 2022 [9]. Wind met a significant amount of the national electricity demand in 2019 in Denmark (47.2%), Ireland (30.7%), Portugal (26.3%), Germany (21.2%) and Spain (20.8%) [10].
Increases in variable, less predictable, non-synchronous wind- and solar-generated electricity result in electrical power systems encountering transmission and/or operational constraints to maintain system stability [1,11]. To ensure that there is sufficient dispatchable synchronous generation on the system to maintain the security of supply and system stability, system operators sometimes accept less wind- or solar-generated electricity than is potentially available [12]. System Non-Synchronous Penetration (SNSP) [12], also referred to as a variable renewable energy (VRE) limit [13], is a real-time measure of the percentage of generation from non-synchronous sources relative to the system demand given by Equation (1):
S N S P = N o n s y n c h r o n o u s   p o w e r S y n c h r o n o u s   a n d   n o n s y n c h r o n o u s   o n   t h e   s y s t e m = W i n d + S o l a r + H i g h   V o l t a g e   D i r e c t   C u r r e n t E l e c t r i c i t y   D e m a n d + E x p o r t s
Transmission system operators (TSOs) limit SNSP when the following applies [12]:
  • Wind power production exceeds the SNSP limit, addressed by dispatching down wind generators across the entire national grid, referred to as curtailment.
  • Line or cable capacity cannot transmit the electricity produced to serve demand because of one of the following [14]:
    More wind generation than the localised carrying capacity of the network;
    An outage for maintenance, upgrade works or faults,
    referred to as constraint.
  • Generation exceeds demand, referred to as energy balancing.
Increasing renewable generated electricity energy requires TSOs to increase SNSP limits [15]. For example, since 2010, the SNSP limit in Ireland has increased from 50% in 2015 to 75% in 2022, with strategies in place to meet a 95% target by 2030 [16]. Ireland has a relatively isolated electrical system, so it experiences high amounts of unharnessed wind-generated electricity [12,14,17] while energy-balancing requirements are forecasted to increase significantly with greater penetration of wind energy [11,12,17,18].
Otherwise, unused VRE has monetary value; based on annual wind curtailment figures [15,19,20,21] matched to the average yearly retail price of electricity [22], the total retail value of unused VRE in Ireland between 2017 and 2021 is estimated at EUR 1.105 billion, shown in Table 1 to range from EUR 85M in 2017 to EUR 441M in 2020.
Curtailment, constraint and energy balancing have traditionally been viewed as wasted energy [23] or as a limitation on the penetration of VRE [24]. However, in the last two years, studies have shown the advantages of obtaining more:
  • Electrical services, through electric vehicle charging [25,26], heating [27], cooling [28] and energy harvesting through battery storage [21,23].
  • Financial services, through profit generation from the provision of energy to support energy users, such as bitcoin mining [29].
  • Social services, through provisioning potentially left-behind groups with otherwise unused energy [27,30].
  • Grid services, through the provision of demand services supporting an increase in VRE/SNSP limits [31] that can mitigate localised constraint issues [30] if provision is localised to a constraint (enabled by GIS mapping).
Unused VRE electricity can inter alia be stored for later use in batteries, pumped hydro, compressed air, and electro-thermal storage. Demand-side management/response (DSM/DSR) can also provide system stability and flexibility [32]. DSM comprises a set of load management strategies, incorporating planning, integration, and monitoring of pre-assigned routine activities based on the consumer’s usage pattern [33] whereas DSR can be defined [34] as “changes in electric use by demand-side resources from their normal consumption patterns in response to changes in the price of electricity, or to incentive payments”. DSM/DSR systems aim to efficiently use available energy without installing new transmission infrastructure. Article 32 of the EU 2019 Clean Energy Package [35] requires TSOs to consider flexibility in grid planning as an alternative to system expansion [30].
The residential sector accounts for 25% of the overall electrical load in Ireland [32], so it correspondingly impacts overall power balance, stability, and efficient power management. Article 32 further requires market access for residential consumers. Due to regulatory barriers as well as a lack of market products suitable for small end users, the demand-side flexibility potential in the residential sector in Ireland is underutilised [36,37]. Residential customers in Ireland can only participate in DSM/DSR through tariff-based schemes where they are encouraged to move their usage to cheaper off-peak night-time hours.
Agbonaye et al. [38] explored the value of demand flexibility for managing wind energy constraint and curtailment in Northern Ireland, finding that the optimum aggregation size and household savings varied based on whether constraint or curtailment was the primary control parameter, further making the point that there could be other competing uses for unused wind such as the production of green hydrogen for industrial use, grid-scale storage, and district heating schemes. Agbonaye et al. [27], in a different study, highlighted that households at risk of fuel poverty do not have the capital to invest in heat pumps, photovoltaics, batteries, etc., while the electrification of heat and transport is likely to result in increased network costs, disproportionately affecting vulnerable households; they concluded that it makes sense to prioritise the use of flexibility for vulnerable consumers so that they are not left behind in the transition to clean energy. Agbonaye et al. [30] went on to develop a methodology for identifying vulnerable neighbourhoods along with a flexibility prioritisation framework that ensured a fair distribution of flexibility opportunities.
Figure 1 illustrates that hot water tanks make up around a quarter of the capacity used in residential demand-side flexibility applications [36], due to the ready use of stored hot water. Smart controls can provide customers with control over how much hot water they need at particular times [39].
Across Europe, water heating accounted for 17% of energy consumption in households in 2012 [40]. Due to their energy storage characteristics, EWHs are considered ideal candidates for demand response [41], and it is proven that EWHA schemes are useful for frequency regulation and power balancing [42,43,44]. France leads the market with installed electrical heating and cooling technology assets, estimated to be over 200 MW [36]. To create a more constant day/night electrical base load suiting nuclear energy generation, Électricité de France (EDF) has used Electrical Water Heating Aggregation (EWHA), along with tariffs that incentivise consumers to use Electrical Water Heaters (EWHs) during off-peak hours [45]. In 2017, more than 13 million EWHs were installed in French households, representing around 50% of residential hot water systems (the rest are supplied by gas and oil heating systems), accounting for an annual consumption of 20 TWh and a peak demand of 8 GW [45]. EWHA schemes have also been implemented in the US; Florida Power & Light have been installing controllable electric EWHs in hundreds of thousands of homes since the 1970s [46], and since the early 1990s, Great River Energy (Minnesota) have implemented an EWHA system in over 110,000 homes [46,47].
Mabina et al., 2021 [48], reviewed control methods concerned with the application of demand response to control EWHA schemes, focusing particularly on studies that sought to provide ancillary grid-balancing services and supporting an increase in VRE in power systems. Most studies [48] focused on controlling a single parameter, such as minimising peak load [49,50,51,52,53,54,55,56] or frequency control [57,58,59,60], with one study focused on increasing the integration of wind [61]. Studies that sought to control multiple (two to three) parameters sought to control (i) load shifting and peak load reduction [53], (ii) voltage and load reduction [62], as well as (iii) frequency regulation, load shifting, and peak load reduction [63]. Interestingly to this study, none of the EWHA studies reviewed sought to maximise the benefit to the householder as a control parameter, so this study is novel in its approach.
“Real Value” [64] and “EU-SysFlex” [32] are two large DSM studies with the Irish TSO as a participant. “RealValue” [64] ran from 2015 to 2018 and deployed Smart Electric Thermal Storage (SETS) in 1250 homes in Germany, Latvia, and Ireland (volumes per country are unspecified), demonstrating scalability through modelling and virtual simulation [65,66] and finding that SETS can meet householders’ space and water heating needs in a low-cost and energy-efficient manner whilst enabling residential storage heaters to connect on a cloud aggregation platform to charge based on grid constraints and market price signals. “EU-SysFlex” [32], carried out between 2018 and 2020, trialled “Residential Service Provision” through the “Power Off and Save project” [32,67], in which over 1400 households in Ireland were engaged to reduce their electricity consumption at peak times. This trial showed that switching off the standard 3 KW electrical hot water immersions at peak times was a cost-effective way to control domestic electrical load [67] without impacting occupant comfort.
Due to a historically high price of electricity in Ireland, compared to other European countries, most homes in Ireland heat and generate hot water through fossil-fuelled hydronic radiator systems and indirect domestic hot water cylinders and thus do not have electric space heating installed [68]. Most (77%) Irish homes have a secondary electric hot water immersion fitted to domestic hot water tanks that acts as a backup or as an alternative to the boiler. Ireland, whose predominant fuel source is oil, has seen the average fuel price for households (EUR cent/kWh) [18] rise for electricity (22%), gas (32%), and oil (70%), with energy poverty in Ireland being at its highest recorded rate in 2022 [69]. It is known that to ration energy use, some fuel-poor householders routinely go without heat or electricity, with many allowing themselves very limited hot water [69].

Research Aim and Objectives

Unharnessed curtailed wind, while a growing resource, is a finite variable resource. Using Ireland as a case study, this research assesses how unharnessed curtailed wind energy in Ireland could be effectively redeployed to DHW in households, with a focus on maximising benefits for fuel-poor households (as opposed to the provision of ancillary grid services). This research aim will be addressed through the following objectives:
  • Characterise curtailed wind energy in Ireland for a representative weather year.
  • Review the literature to establish DHW consumption profiles to characterise DHW loads for Irish households, especially for fuel-poor households, where explicit data may be lacking.
  • Develop a wind-generated electricity allocation model utilising half-hourly wind data to assess the feasibility and economics of reallocating surplus wind energy to DHW.
  • Establish model parameters to ensure equitable energy allocation within an EWHA scheme, considering various aggregation sizes.
  • Evaluate the benefit to the householder of participating in an EWHA scheme as a function of aggregation size.

2. Materials and Methods

The overarching methodological approach is to redeploy unharnessed variable wind-generated electricity to heat hot water by matching or balancing hot water demand to meet the available supply. It was necessary to characterise curtailed wind energy in Ireland (Section 2.1) as well as typical DHW loads in Irish households (Section 2.2). Model parameters were set up (Section 2.3) to ensure that each household aggregated within an EWHA scheme received an equitable allocation of energy, while the annualised benefit to householders from participating in an EWHA scheme was assessed for various aggregation sizes. DHW profiles for Irish households are not explicitly available and no profiles for fuel-poor households in Ireland exist; therefore, a review of hot water consumption profiles was carried out in Section 2.2. Equitable distribution across the aggregation was validated in Section 2.5.

2.1. Curtailed Wind Profile

Curtailment, constraint, and energy balancing each pose different challenges to network operators. Curtailment is managed at a nationwide level, whereas constraint is caused by a local and often transitory issue, while energy balancing is required at very high (>70%) penetrations of variable renewable energy. This study only considers curtailed wind-generated electricity. As wind curtailment data for 2020 are considered unrepresentative due to the SARS-CoV-2 pandemic, 2019 curtailment data for Ireland, totalling 319 GWh, were used. As shown in Figure 2, 73% of curtailments, totalling 233 GWh, occur at night between 10 p.m. and 7 a.m. coinciding with low electricity demand. As hot water is generally consumed during the day [70], overnight 2019 curtailed wind data were used as a case study year.
Further to Figure 2, the number of nights that overnight wind curtailment was present is examined in Figure 3a. It is seen that wind curtailment was not present during any half-hour between 10 p.m. and 7 a.m. for most (61%) or 222 nights in 2019. Notwithstanding when curtailed wind was observed in the other (39%) 143 nights of the year, it was present for a significant duration, as 85% (122/143) of nights saw wind curtailment for at least 6 half-hours—the time required to heat an assumed ”cold” hot water tank fully to 60 °C. Figure 3b shows the distribution of the 222 “curtailment nights” over a weekly timeframe; it is seen that although overnight wind curtailment was not observed in 6 calendar weeks, a night of curtailment was observed for the remaining 46 (88%) calendar weeks of the year.

2.2. DHW Consumption Profiles

DHW loads vary by region and climate; daily DHW consumption in non-fuel-poor dwellings varies from a low of 43 litres/day in Finland to a high of 256 litres/day in Florida, while the global average is 202 litres/day [71]. The day of the week, season, outdoor temperature, and precipitation levels also have distinct effects on water demand [72,73,74]. DHW consumption is found to increase on hot days in some regions (New York) but reduce in others (Florida) [72,73,74]. Conversely, in German-speaking regions in Switzerland [75], no significant decrease in consumption during weekends was found, and neither was a correlation with weather conditions established. Water consumption patterns also vary by occupant profiles [76,77]; older people use toilets more often and so use more water and young children take a bath more often, while teenagers take long showers [77]. Behaviour is also influenced by environmental factors and socioeconomic status [71,78].
Notwithstanding the variances listed, hot water usage is largely simultaneous [71,79,80,81,82] with two day-time peaks, one in the morning and one in the evening, with the balance spread over the day. Peak characteristics vary by country; for instance, in Finland, the peak is higher in the evening and lower in the morning, whereas the behaviour is the opposite in Germany [75] and in Ireland [83].
DHW consumption profiles have been studied for single-family dwellings in the US [60], UK [70], Netherlands [77], Germany and Switzerland [84,85], Finland [86], and Sweden [87]. DHW consumption profiles of apartments have been characterised in Greece [88]. No metered DHW study has been carried out in the Irish context (the aforementioned study in Ireland [83] characterised standard profiles for building archetype models based on studies conducted across European countries). In the absence of an Irish study, the closest region climatically and geographically is the UK. A hot water consumption study [70] of significance, used in many DHW modelling studies [40,61,89], was carried out by the UK Energy Saving Trust in 2006. Domestic hot water consumption in 112 dwellings was recorded for one year at ten-minute intervals. When water run-off was detected, the sampling rate increased to five seconds. The data was then resampled at constant intervals of 1, 2, and 3 h. This study found the following [70]:
  • The mean water consumption rate per UK household was 122 litres/day with a 95% confidence interval of ±18 litres/day.
  • Hot water heating time was 2.6 h/day, estimated with a 95% confidence interval of ±0.35 h/day, finding that some households heated water as and when it was required, and the remainder generally heated water between 8:00 a.m. and 10:00 a.m., and again between 6:00 p.m. and 11:00 p.m.
  • Storage temperatures were significantly below the widely assumed value of 60 °C, with a mean value of 51.9 °C estimated with a 95% confidence interval of ±1.3 °C.
  • A key factor influencing consumption is the number of occupants.
The typical hot water consumption profile for UK dwellings published in the study [70] did not account for days of the week, seasonal variations, or occupancy.
Fuel-poor and non-fuel-poor households consume hot water differently. The Building Research Establishment (BRE) [90], in a 2018 UK study, found that fuel-poor households were significantly (60%) more likely than non-fuel-poor households (45%) to be taking less than one shower and/or bath per person per day. Households in fuel poverty were less likely (21%) than those not in fuel poverty (31%) to take a shower and/or bath once per person per day. Fuel-poor households were less likely (84%) to heat their water with a central heating system, compared with non-fuel-poor households (92%), and fuel-poor households were almost twice as likely (13%) to heat their water with an electric immersion heater than non-fuel-poor households (7%). Fuel-poor households were more likely (47%) to use an electric shower than non-fuel-poor households (35%) and were less likely to use a shower that was pumped from the main hot water system (10% compared with 16%). Regrettably, the UK BRE study [90] did not publish hourly water consumption patterns for the fuel-poor households studied.
Electrical DHW immersion heaters in Ireland are typically rated at 3 kilowatts (3 kW), supplied with a 230-volt single-phase supply limited to 13 amperes. A standard 3 kW electrical immersion will consume 9 kWh of electricity in 3 h to heat 155 litres of 60 °C hot water from 10 °C. Typical domestic hot water cylinders in Ireland store an average hot water requirement of 9.63 kWh/day [91]. At a boiler efficiency of 85% and an average hot water heating time of 2.6 h per household, this equates to 129 L/day heated to 51.9 °C or 108 litres heated to 60 °C and so correlates with the findings of the UK study [70].
This research hypothesis assumes DHW tanks are heated overnight (before 7 a.m.), with hot water available for morning draw-off. This shifts DHW loads from day to night, coinciding with a lower grid carbon intensity, and simplifies the modelling approach. To meet the DHW load in each household, six 1.5 kW half-hour time periods are allocated overnight to each household within the EWHA scheme. Each household receives 9 kWh to almost meet the national daily average hot water consumption figure of 9.63 kWh [91] at 60 °C. A minimum activation period of 30 min and multiples thereof is applied to limit excessive relay switching and to coincide with the available data and electricity market trading intervals.

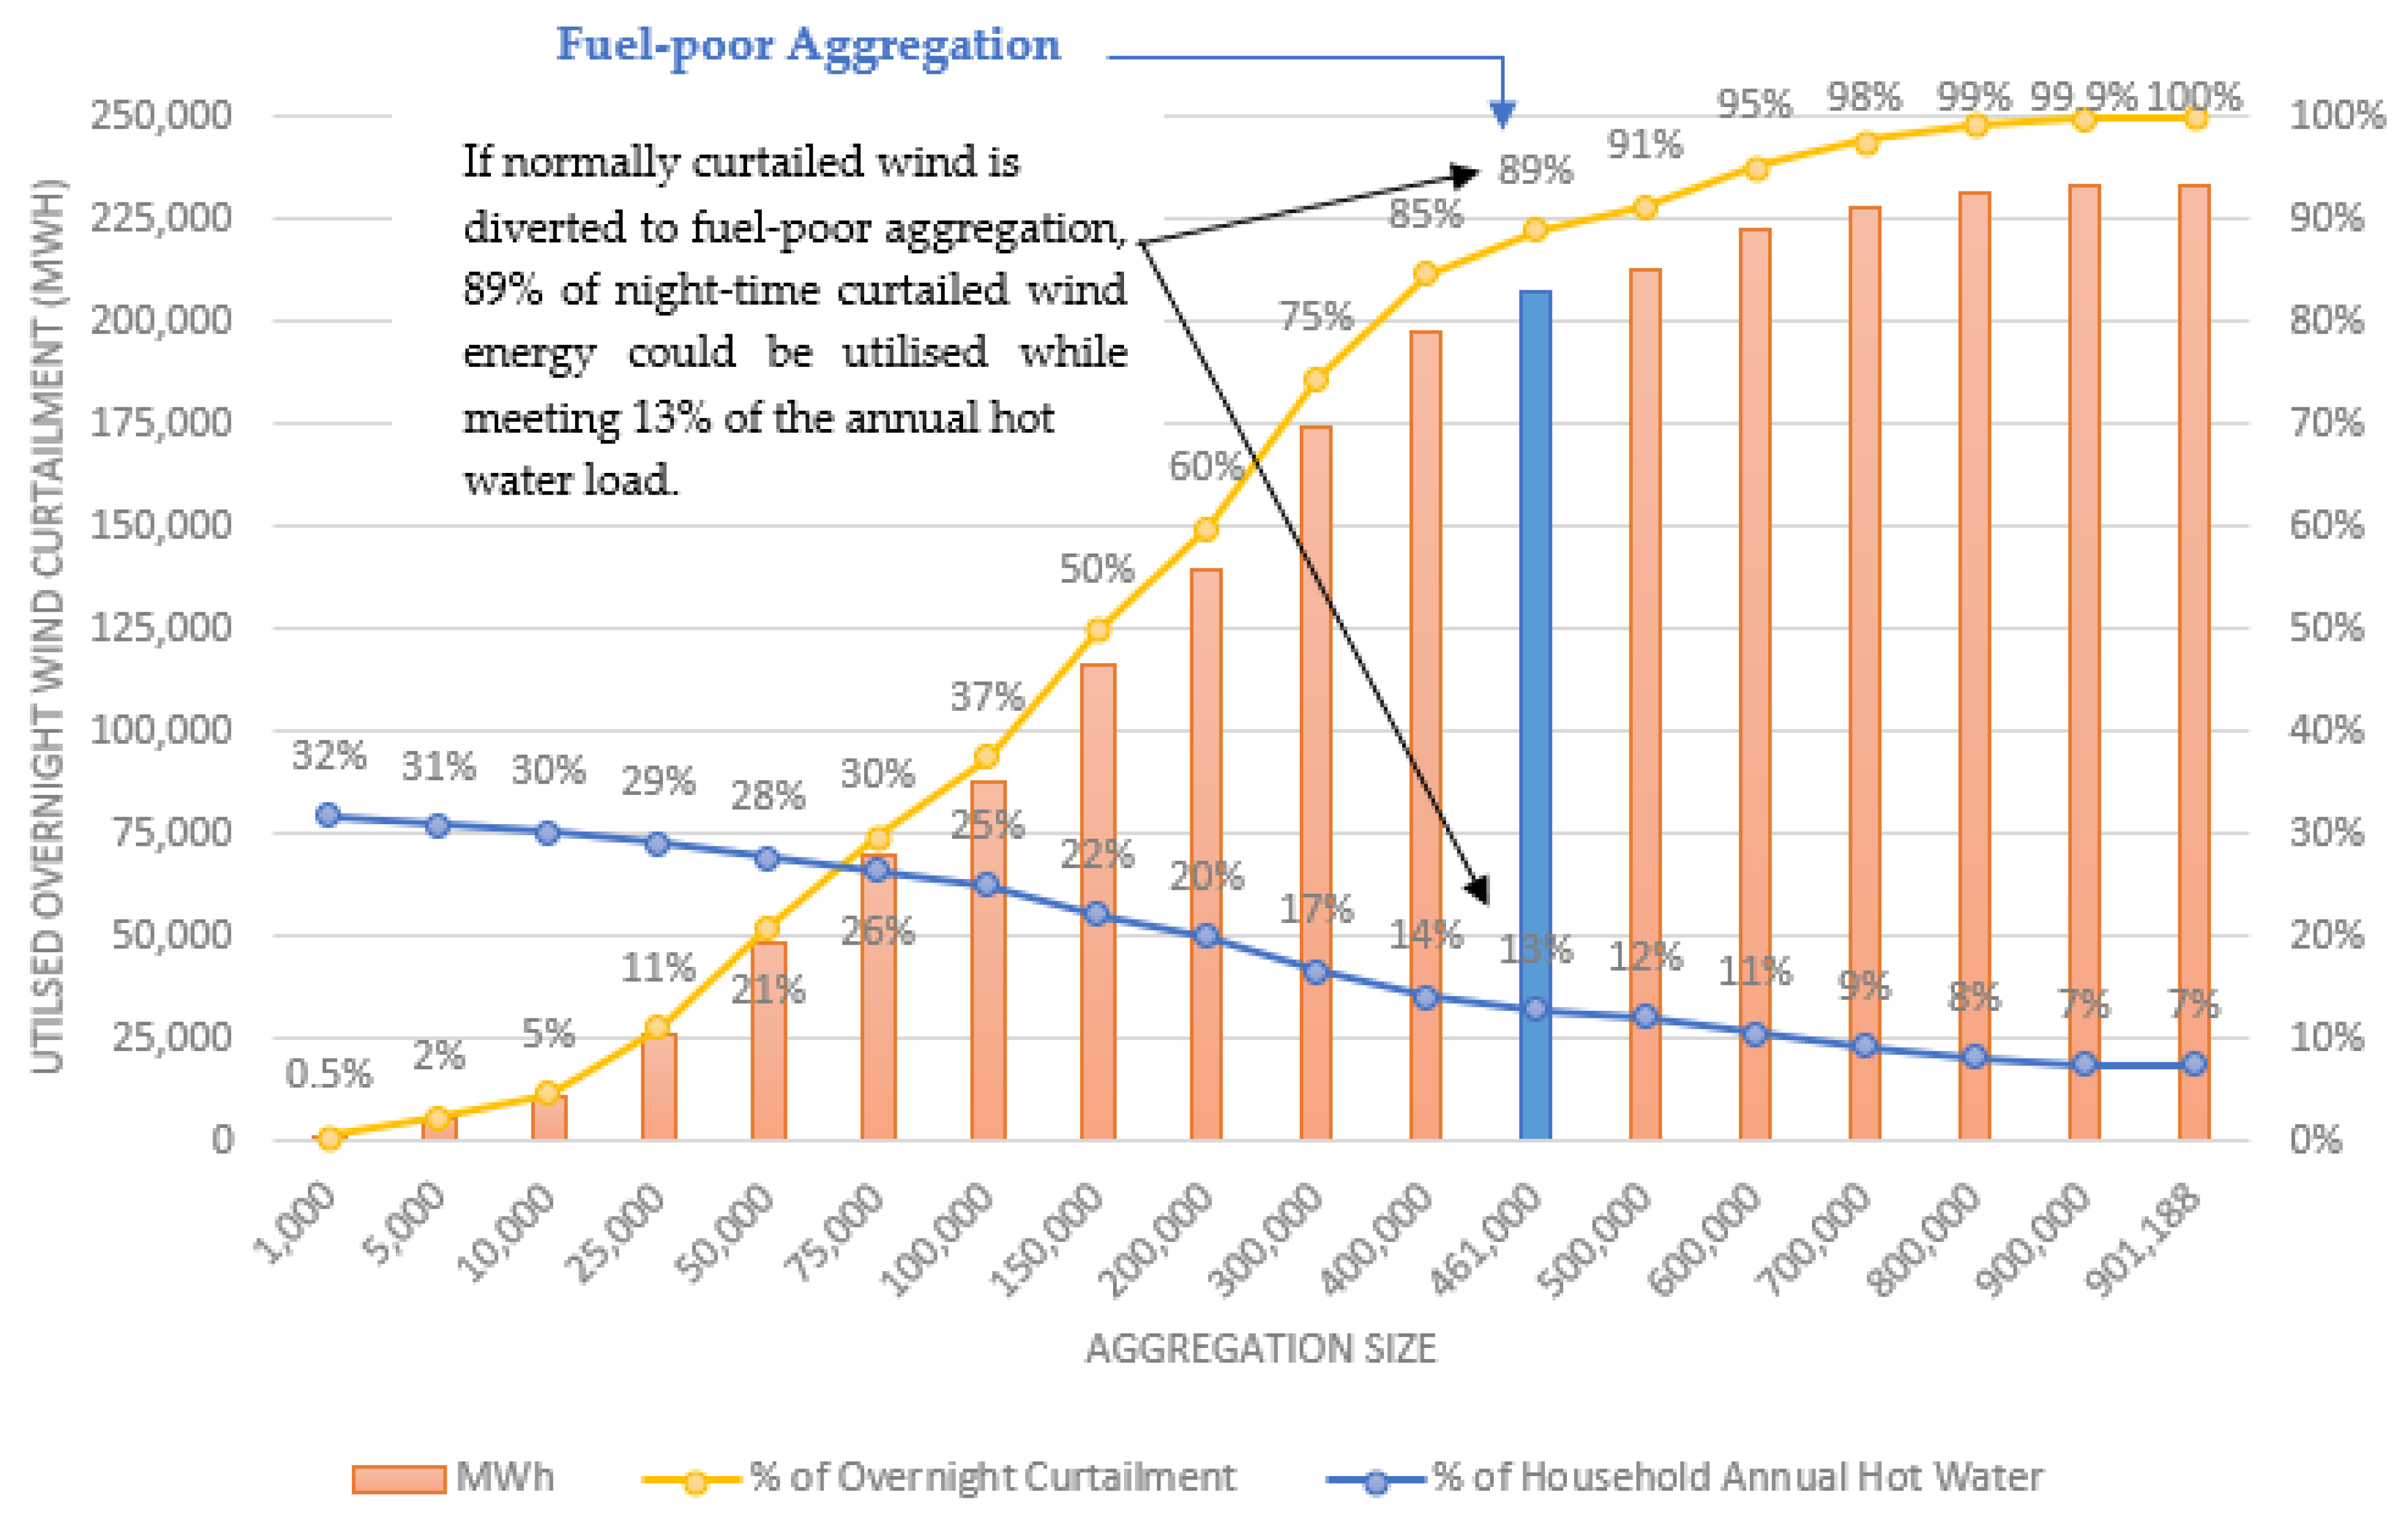
2.3. Aggregation Size

The minimum aggregation was set at 1000 households. Maximum aggregation size is a function of available curtailed wind energy harmonised to DHW demand, quantified in the Results section of this work. Aggregation sizes between the minimum and maximum were tested and results were presented. To assess the benefit to the fuel-poor households, it was necessary to quantify the fuel-poor aggregation size.
An in-depth bottom-up analysis of energy poverty in Ireland [92] found that 1 in 4 (28%) or up to 461,000 households were potentially in fuel poverty in 2015 [93]. At the time of modelling (2021) and while more recent data on fuel poverty, published by the ESRI and available through the Central Statistics Office [94], were available, the calculations are based on the expenditure method. The expenditure method considers a household to be in energy poverty if said household spends more than 10% of overall household income on energy services. This metric can “give an incomplete picture of energy poverty” as households living in deprivation may not be able to afford to spend 10% of their income on energy, thus living in inadequately heated homes and not being captured by the expenditure method; moreover, more affluent households may spend over 10% of their income on energy costs [95]. The objective method for calculating fuel poverty models the level of fuel expenditure required by a typical household to keep their home heated to the levels recommended by the World Health Organisation and compares this to household income in an attempt to calculate exposure to energy poverty, considered in the Government of Ireland’s “Spending Review 2020—Social Impact Assessment—SEAI Programmes Targeting Energy Poverty” [95] to be a more robust assessment of energy poverty and thus the fuel-poor aggregation figure (461,000) used in this research hypothesis.

2.4. Boundary Parameters

Allocation of curtailed wind energy is based on the following boundary parameters:
(1)
Only wind curtailed between 10 p.m. and 7 a.m. overnight is applied; the rationale for targeting overnight curtailed wind initially is as follows:
a.
Over 70% of curtailment happens during night-time hours (see Figure 2).
b.
Night-time use-of-system charges are ¼ of day-time use-of-system charges.
I.
This means any rebate applied to account for the household meter, turning with the application of redeployed electrical energy, relating to SNSP limits and synchronous plant base load costs will be minimised.
II.
For the same reason, if an aggregator focused on fuel-poor householders seeks contributions from energy generators and suppliers, contributions will go further during night-time hours as the electricity price is lower, meaning the aggregator will be able to provide a higher subsidy against night-time tariff rates—this renders the delivered energy free or at a significantly lower than typical retail cost.
III.
Heating water at night shifts DHW load from day to night, thereby flattening the day/night curve, in line with the existing EWHA schemes reviewed.
c.
In favour of day-to-night load shifting, market participants and Ireland’s Commission for Regulation of Utilities (CRU) will be more supportive of schemes targeted for night-time hours initially.
d.
Water consumption profiles are simplified as little draw-off is universally reported across all hot water consumption studies across regions during night-time hours.
(2)
A minimum activation period of 30 min or multiples thereof is applied at each 3 kW immersion to limit excessive relay switching and to coincide with the available data and electricity market trading intervals.
(3)
Each immersion remains energised across multiples of 30 min so that, if possible, only one relay activation and deactivation signal is necessary from the aggregator, while individual households receive as much useful hot water as possible when allocated energy.
(4)
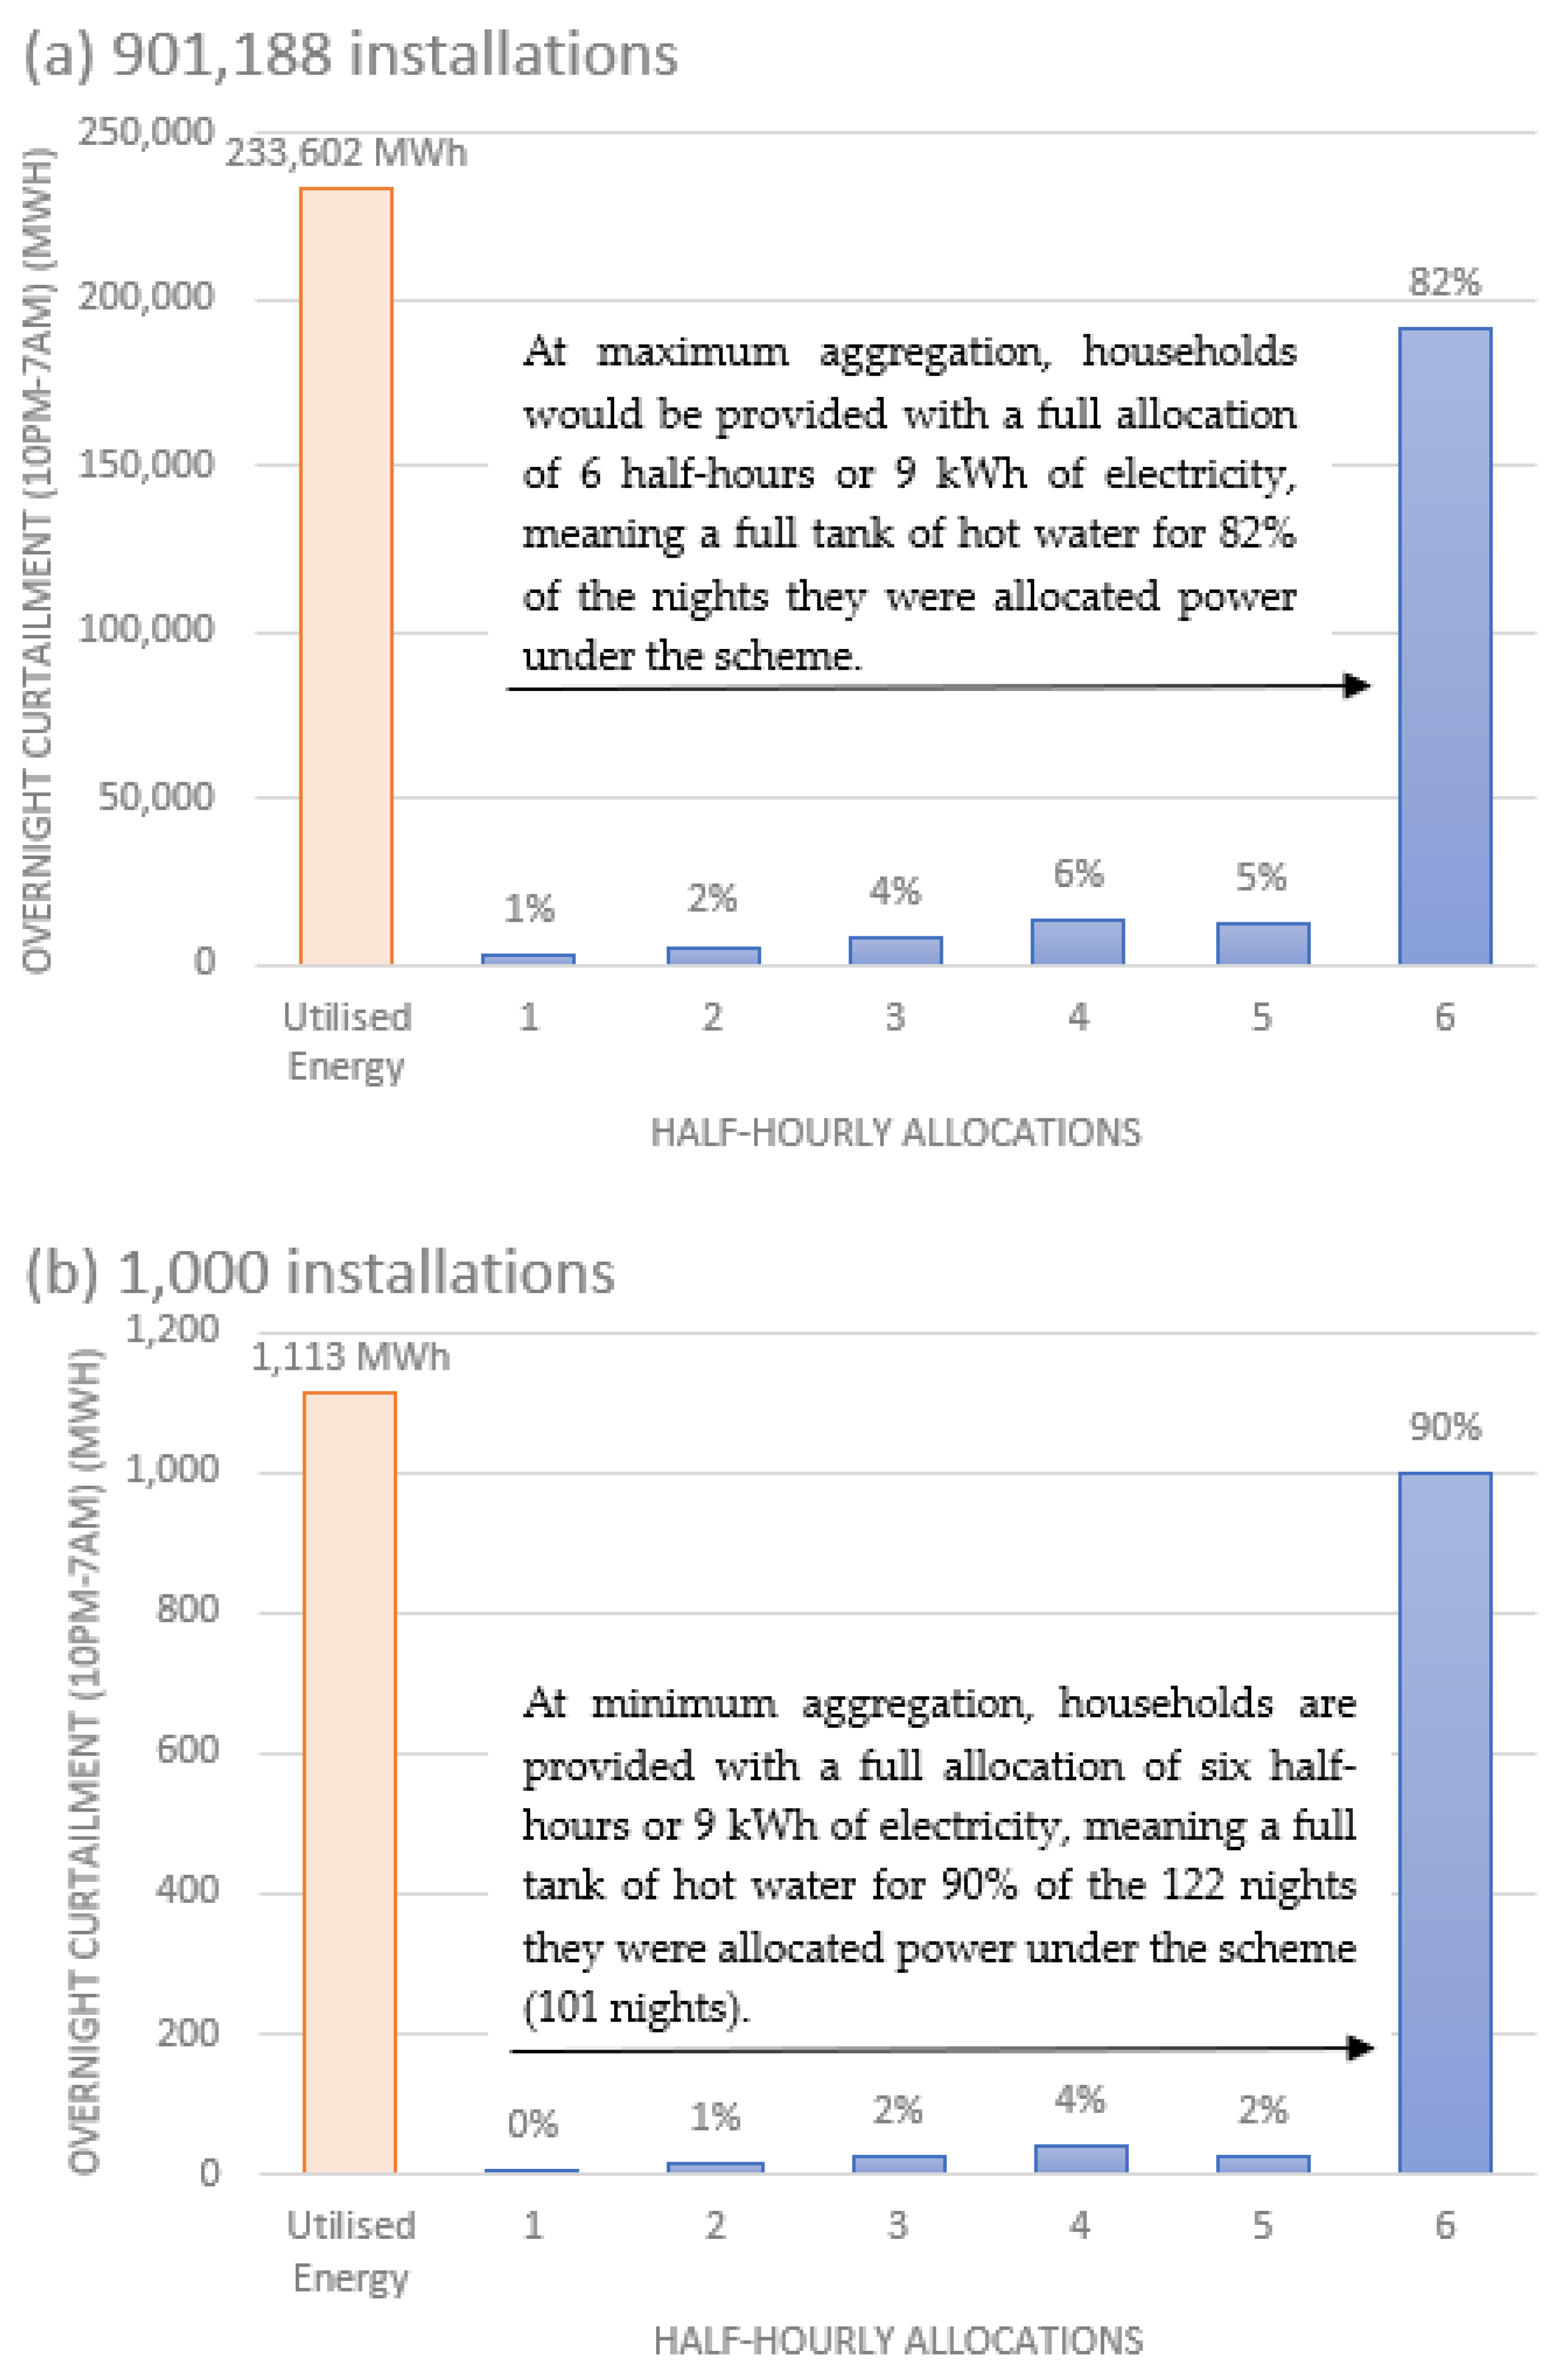
Each household is allocated up to 6 half-hour time periods receiving 9 kWh to almost meet the national daily average hot water consumption figure of 9.63 kWh [91] at 60 °C. The model allocates 1.5 kWh of energy to as many household immersions as possible in a 30 min period, hence prioritising households who have already received an allocation to provide a full tank and hence a useful amount of hot water periodically.
(5)
Step 4 ensures that the tank is heated to 60 °C to reduce the risk of legionella growth.

2.5. Wind-Generated Electricity Model Validation

Outputs from the model are articulated in Table 2 for a randomly selected night of the 12th of January, as shown in Table 3. Table 2 articulates the model outputs described in Table 3. It is seen from Table 3 that more than 200,000 smart hot water cylinders would need to be available to harness the curtailed night-time wind energy available on that night. Conversely, as shown in Table 4, on the night of the 3rd of January 2019, when there was relatively low curtailment, only 24,590 homes received excess wind allocations, with none receiving 6 allocations or 9 kWh equating to a full tank of hot water.

3. Results

To establish the capacity of night-time curtailed wind energy to heat DHW tanks, the redeployment of night-time curtailed wind energy was modelled for various EWHA sizes until all available night-time curtailed wind energy was harnessed. Referring to Figure 4, 901,188 households, representing the maximum aggregation size, would have been required to use 100% of the 233 GWh night-time curtailed energy in 2019, meeting 7% of participating households’ annual hot water load. If the minimum number of 1000 households were in an EWHA scheme, 0.5% of night-time curtailed wind energy would have been harnessed, while 32% of the participating households’ annual DHW load would have been met. This phenomenon arises because curtailed wind is a finite resource, meaning the more households aggregated, the fewer allocations each household receives. If normally curtailed wind is diverted to the fuel-poor aggregation of 416,000 households, 89% of unused wind-generated electricity would be utilised, while 13% of a fuel-poor household’s water demand would be met.

3.1. Nightly Allocation of Curtailed Wind Energy

Figure 5 illustrates how many nights each household in each EWHA aggregation set would receive a full allocation of 9 kWh, finding the following:
  • Between 1 and 1000 households received a full allocation on 122 nights;
  • Between 1001 and 5000 households received a full allocation on 108 nights;
  • Between 5001 and 10,000 households received a full allocation on 104 nights.
Figure 5. Nights with a full allocation (9 kWh) of energy for various population sets.
Sustainability 16 04470 g005
This continues until it is apparent that the larger populations only received a full allocation for a few nights of the year; for example, between 500,001 and 600,000 installations received a full allocation for only 14 nights or 11% of the nights in which wind curtailment was present, while for a population set greater than 900,000 (specifically 901,118), these households received a full allocation for only one night of the year—coinciding with the Christmas holiday period occurring on Sunday, 29 December 2019, when presumably strong winds and less industrial activity led to significant curtailment.
Following from Figure 5, Figure 6a,b illustrate the half-hourly allocation of curtailed wind energy by aggregation size for the nights wherein participating households received an allocation from the scheme. Figure 6a illustrates the results for the maximum aggregation of 901,188, while Figure 6b illustrates the results for a minimum aggregation of 1000 dwellings. When 901,188 are aggregated, households are provided with a full allocation of six half-hours or 9 kWh of electricity for 82% of the nights they are allocated power under the scheme, whereas if 1000 households are aggregated, the households receive a full allocation for 90% of the nights they are allocated power. It can be concluded, therefore, that under an EWHA scheme distributing normally curtailed wind energy as a service, when individual households are allocated energy, they will typically (≥82%) be provided with a full allocation of 9 kWh or a tank of hot water irrespective of the number of households aggregated. This can be attributed to the fact that the model parameters ensure, where possible, that immersions in an individual household remain energised until a full allocation has been received along with the phenomenon that when instances of wind curtailment occur, they typically occur for much of the night (windy nights).

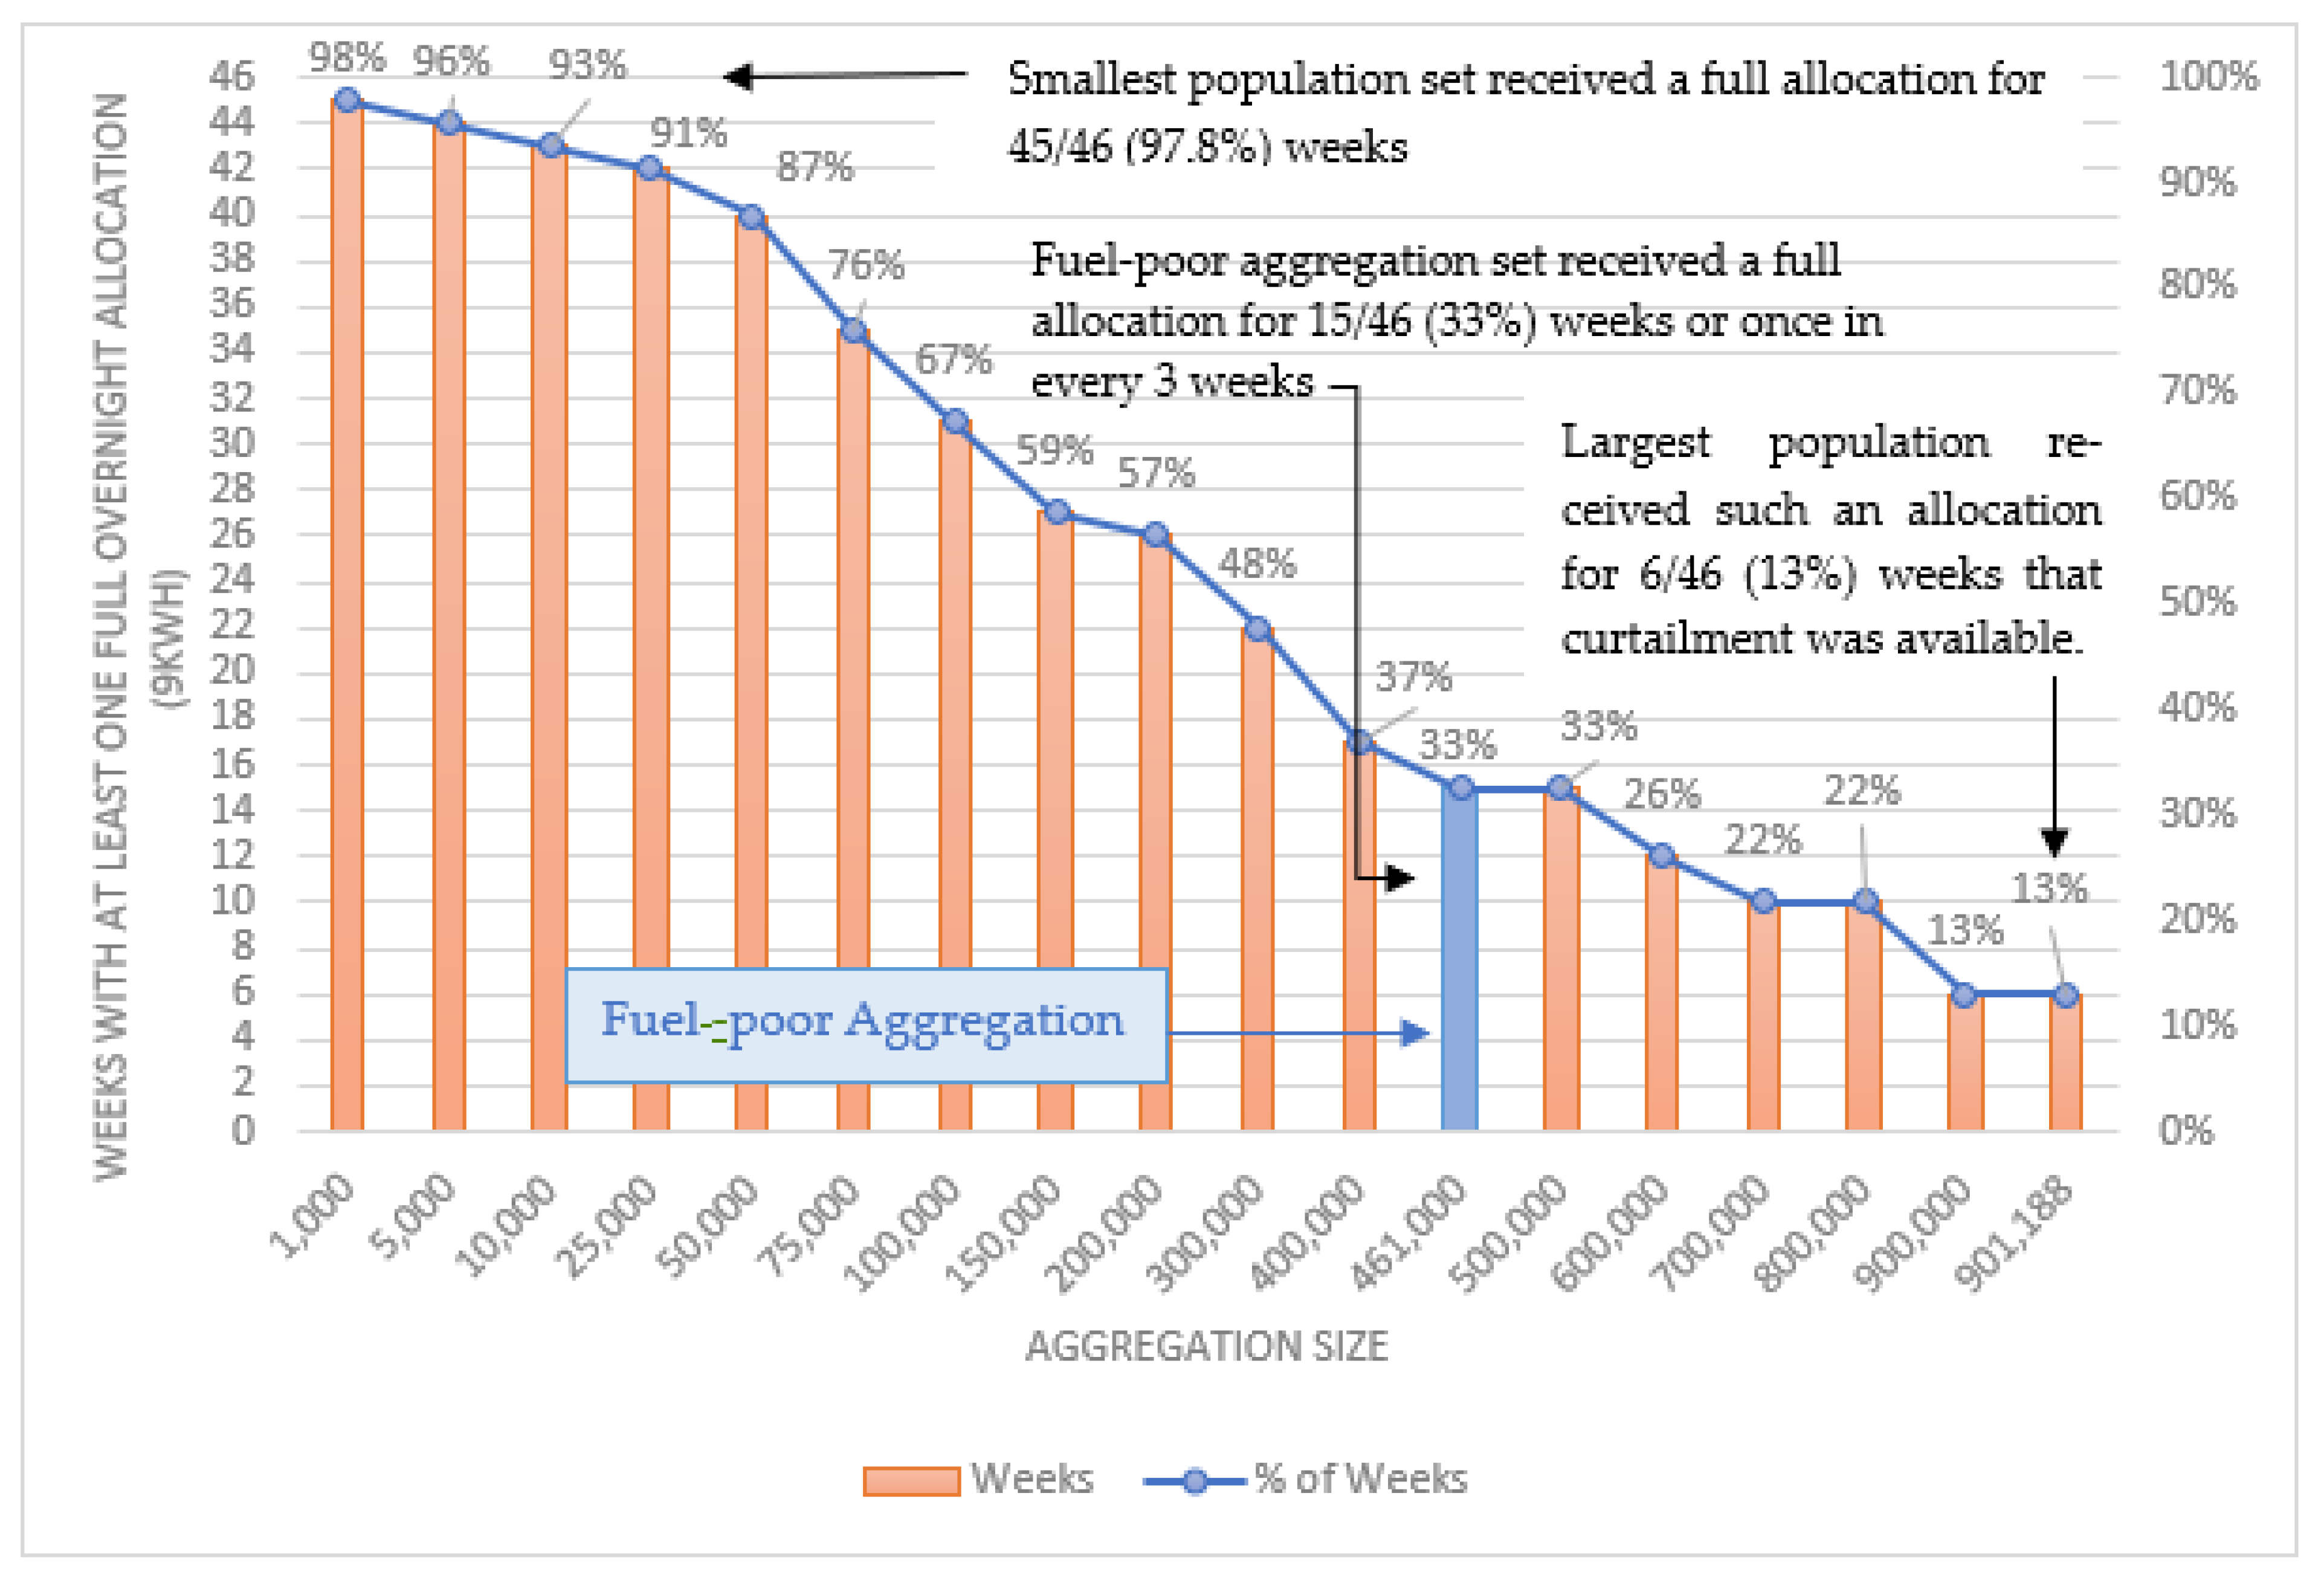
3.2. Weekly Allocation of Curtailed Wind Energy

As this research has a focus on alleviating fuel poverty, the analysis progressed to a pragmatic assessment of the extent to which a full tank of hot water can be provided for at least one night of the week so that important cleaning, bathing, and hygiene tasks within each home can be catered for on a weekly basis. The benefit of this might be much more apparent to fuel-poor households who are known to limit hot water use [96]. The results of the Wind Curtailment Allocation Model are assessed to observe the frequency at which households receive at least one full tank of hot water for the 46 weeks of the year when curtailment was observed (Figure 3b). As shown in Figure 7, it is seen that the smallest (N = 1000) population set received a full allocation for 45/46 (97.8%) weeks, whereas the largest population set (N = 901,188) received such an allocation for 6/46 (13%) weeks that curtailment was available. This latter observation should not be confused with Figure 5, which showed only one night of the year when a full allocation could be delivered to the largest population set, because within a weekly timeframe, there are seven nights in which to provide households with a full allocation of energy on at least one night of the week. For example, in the week beginning the 3rd of February 2019, there was curtailment on six of seven nights with the potential to provide energy to over one million cylinders.
Thus, if a roll-out of an EWHA scheme was considered for larger population sets, from say 500,000 households and beyond, not only would they receive a small proportion of their annual hot water demand (≤12% in Figure 4), but these households would only receive at least one night with a full allocation of energy for less than a third of the 46 weeks in which curtailment occurred (≤32.6% in Figure 7). However, if fewer households, say 5000, were aggregated, they would receive almost a third of the annual hot water demand (31% in Figure 4) and at least one night with a full allocation of energy for 44/46 weeks (95.7% in Figure 7) in which curtailment occurred. Therefore, there is a greater observable effect on hot water provision for individual householders if fewer households are aggregated.

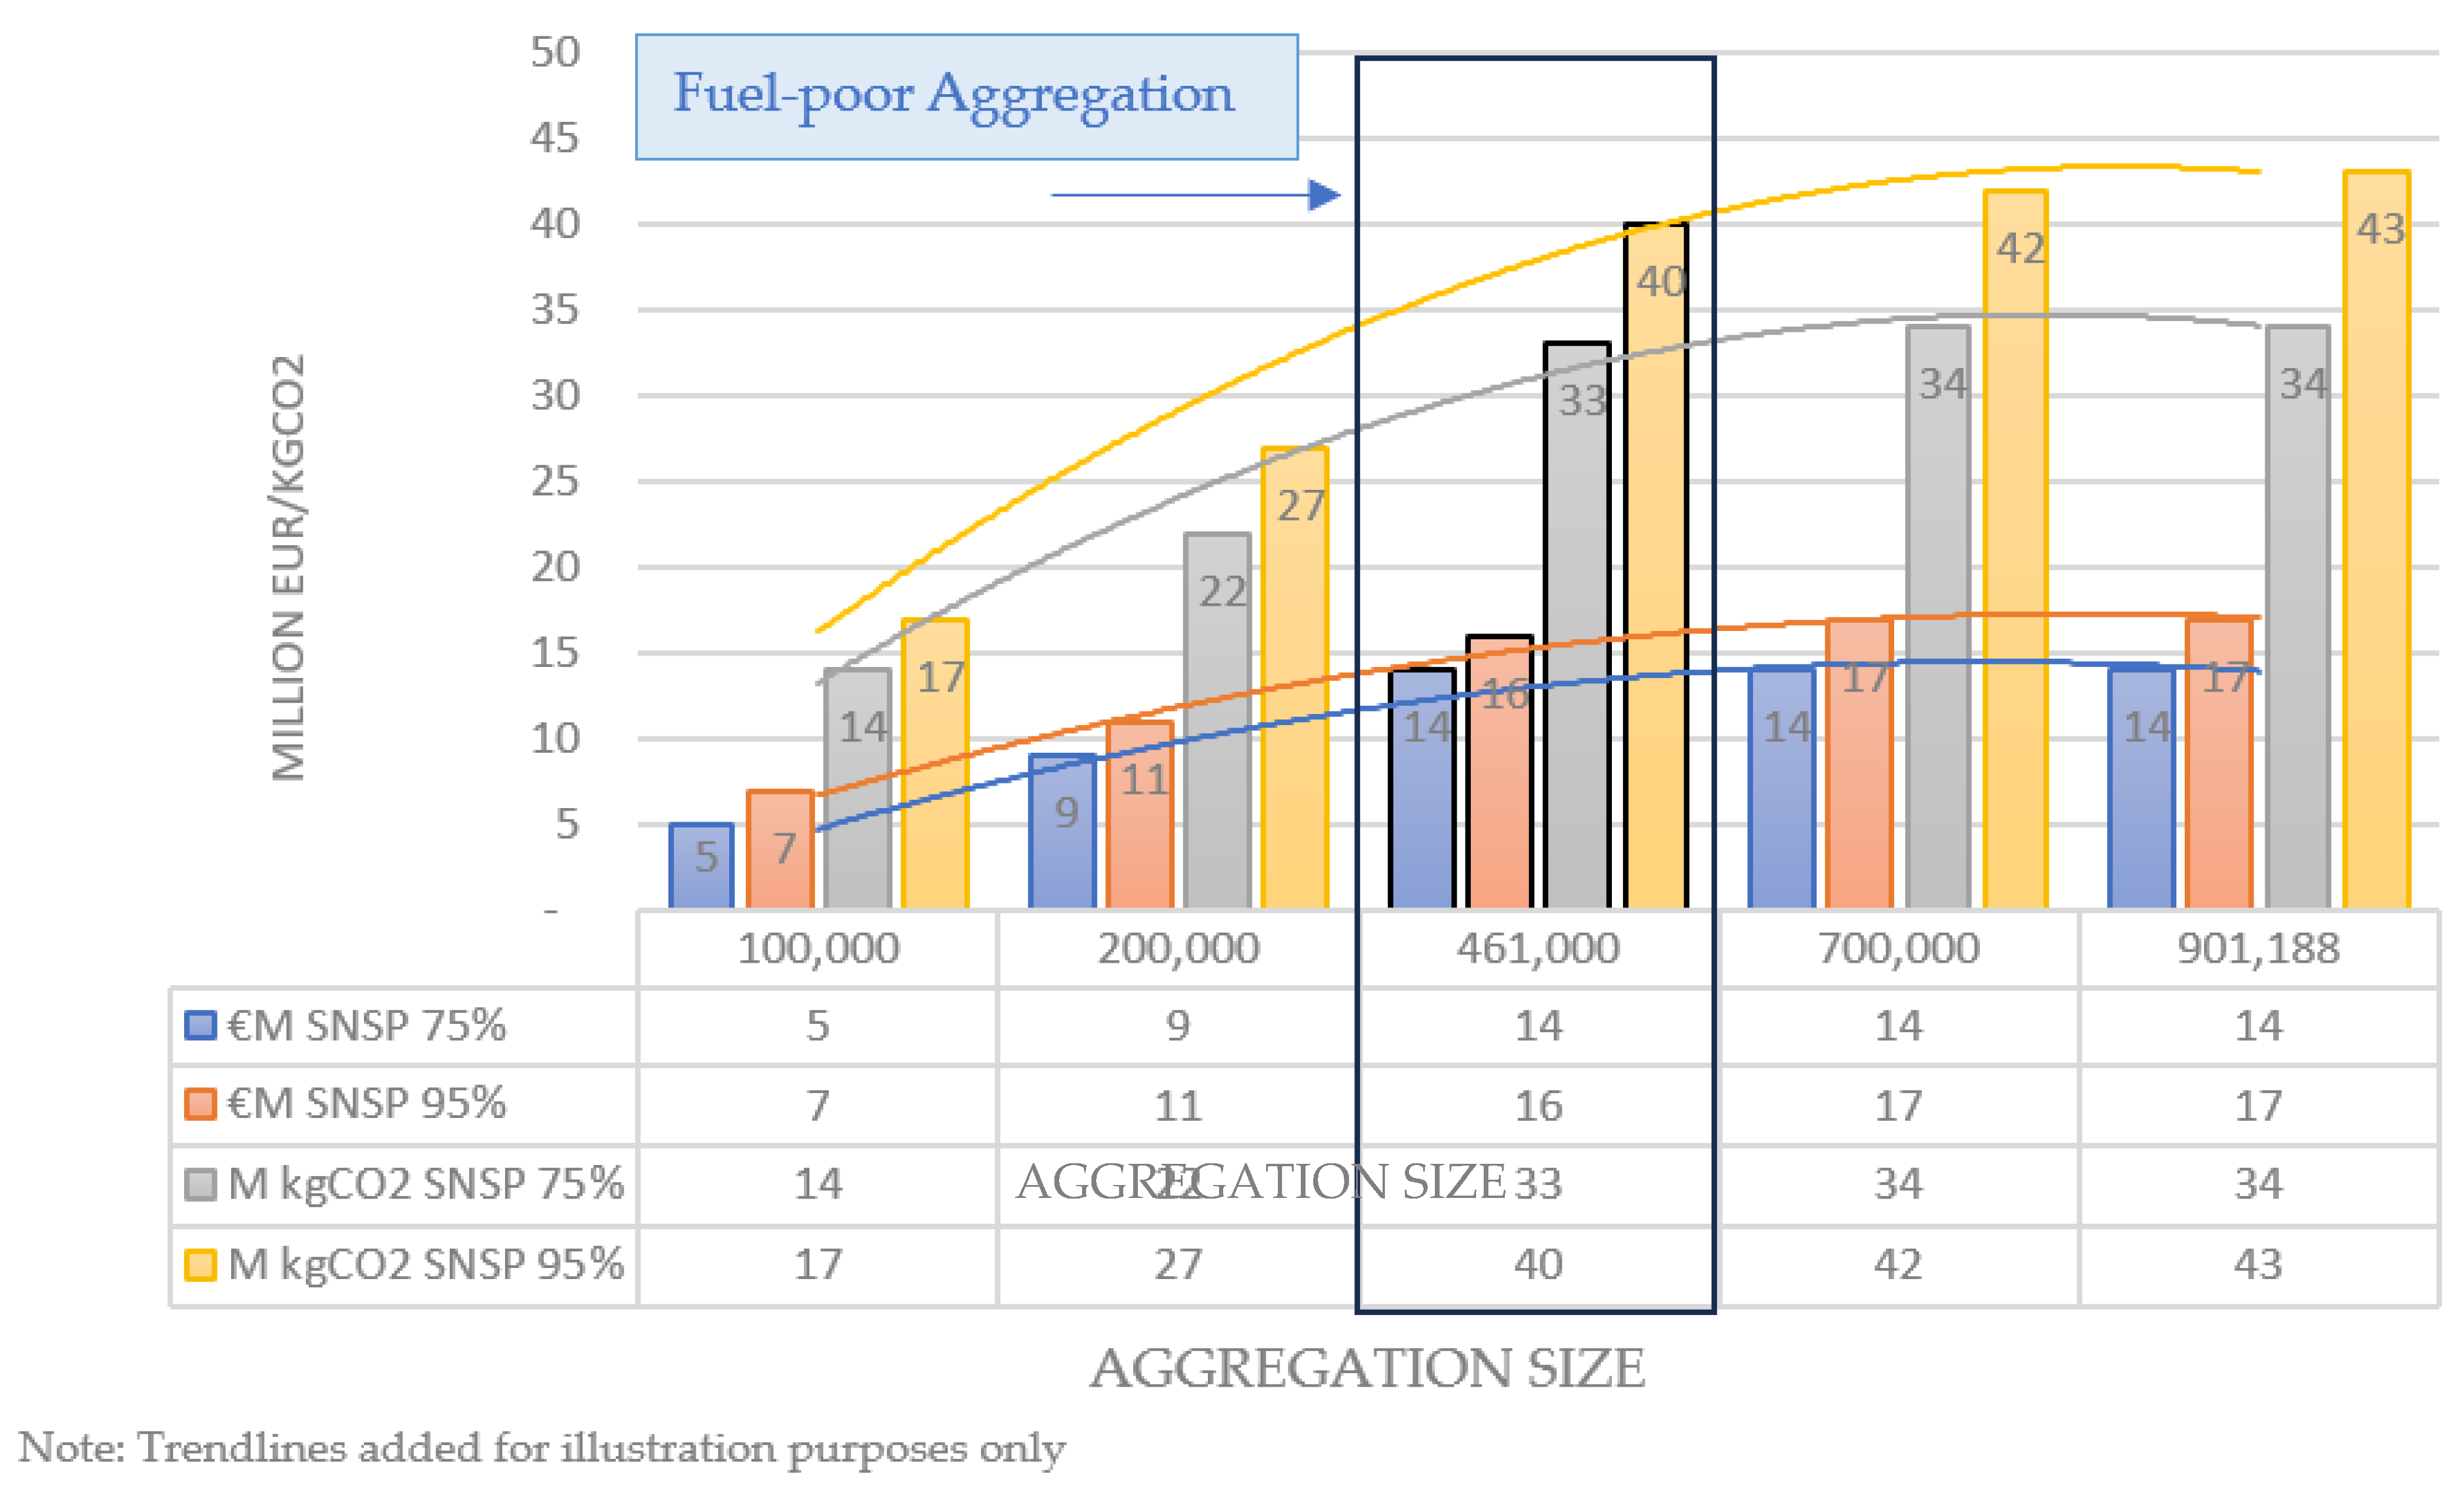
3.3. Economic and Environmental Analysis

The Irish householder is estimated to consume 3515 kWh of energy annually to heat hot water [91]. Referencing Figure 8, this costs an average of EUR 284/household/annum, emitting an average of 702 kg/CO2 depending on the heating system and fuel choice. There were 1.86 M occupied dwellings in Ireland in 2022 [95]; therefore, the total energy cost borne by the citizens of Ireland amounts to EUR 529 M, while the carbon emissions associated amount to 1.3 MtCO2/annum. Figure 8 details, as a function of aggregation size and hence the percentage of hot water load met (cross-referencing Figure 4), DHW fuel costs and resultant carbon emissions per household at the prevailing SNSP of 75%. Referring to Figure 8, it is seen that household cost and CO2 emission savings (from participating in an EWHA scheme) are modest, ranging from 6% or EUR 16/38 kgCO2/annum at the maximum aggregation size of 901,188 dwellings to 20% or EUR 57/136 kgCO2/annum at an aggregation of 100,000 dwellings. This lowers average household DHW bills from EUR 284/annum to EUR 278/annum, at the maximum aggregation, and EUR 284/annum to EUR 227/annum at an aggregation of 100,000 households.
Noting that the model assumes a standardised water load, assuming householders can afford to heat hot water in the first place, it is known that in fuel-poor homes, householders limit the generation of hot water to limit financial outlay; therefore, there might be no savings realised as water is not being heated in the first instance, which is a limitation of this work that will be refined in future research.
While the fuel cost is typically paid for by the householder, the “cost” of associated carbon emissions is borne by the state and the citizen. The shadow price of carbon acknowledges the cost to society that carbon emissions create in the form of climate change, air pollution, and other adverse effects sometimes called “externalities”. The shadow price of carbon is a theoretical or assumed cost per metric tonne of carbon emissions used to better understand the potential impact of CO2 emissions by monetising (costing) the negative impact of environmental emissions [97,98]. Values for the shadow price of carbon are outlined in a public spending code for Ireland [99]. According to this code, the shadow price of carbon should be based on the estimated future price of CO2 equivalent derived from the EU Emission Trading Scheme (EU ETS) [100]; values for produced carbon of EUR 10 per tonne by 2020, EUR 35 per tonne by 2030, and EUR 100 by 2050 were recommended [98]. However, a 2019 review of carbon pricing carried out by the Irish Government found that the EU ETS failed to price carbon optimally from its perspective and consequently proposed an increase in the shadow price to EUR 32 per tonne by 2020, EUR 100 per tonne by 2030, and EUR 265 by 2050 [98]; it is these shadow prices that are used to estimate the “cost” of carbon emissions associated with average annual domestic hot water production in the 1.86 M occupied dwellings in Ireland, which was EUR 42 M in 2022, rising to EUR 131 M in 2030 and EUR 346 M in 2050 (see Figure 8). At an aggregation level of the fuel-poor (461,000), and referring to data in Figure 8, a potential carbon cost saving to the state of EUR 1 M in 2022 [0.033 MtCO2 × EUR 32/tonne at 75% SNSP], rising to EUR 4 M in 2030 [0.4 MtCO2 × EUR 100/tonne at 95% SNSP] and EUR 10.6 M in 2050 [0.4 MtCO2 × EUR 265/tonne at 95% SNSP], might be realised through redeploying unused wind-generated electricity to heat water in vulnerable Irish households.
The economics of using wind curtailment to displace energy and carbon emissions from conventionally fuelled hot water systems, assessed in Figure 8, are depicted in Figure 9 for various sample population sizes at current (75%, 2022) and future (95%, 2030) SNSPs, noting that synchronous power in Ireland is typically met by gas-fuelled generators with an associated emission factor of 0.2 kgCO2/kWh, at an estimated cost of EUR 7 c/kWh (based on wholesale electricity prices in Ireland in 2019 [22]).
It is again seen that as the percentage of hot water load met decreases with increasing aggregation size (due to excess wind being a finite resource), the aggregated household cost and CO2 savings offset through redeploying unused wind-generated electricity to heat hot water tails off at higher to maximum aggregations. For instance, and referring to Figure 8 and Figure 9, at the prevailing (2023) SNSP of 75%, the displaced fuel cost to the householder at an aggregation size of 100,000 households is EUR 5 M, while the carbon offset is estimated at 14 MkgCO2. If the aggregation size is increased circa 5-fold to 461,000, representing the fuel-poor population in Ireland, the displaced fuel cost rises by 280% from EUR 5 M to EUR 14 M, while the amount of carbon displaced rises by 236%, from 14 MkgCO2 to 33 MkgCO2. If the fuel-poor aggregation size is roughly doubled, increasing to 901,188 dwellings, representing an additional 440,188 dwellings to the scheme and matching the amount of wind dispatched down in 2019, the displaced fuel cost would remain at EUR 14 M, while displaced carbon would rise by only 3%, from 33 MkgCO2 to 34 MkgCO2. The explanation for this is that while a larger number of tanks are being heated, they are heated less often, again because unused wind-generated electricity, as a resource, is finite. Therefore, when sustainability matchmaking, there is an optimum aggregation size wherein near-maximum levels of dispatch-down and carbon are offset concurrent with scheme participants receiving the maximum benefit, in this case hot water, from participating in the scheme. This is the key finding of this research.
Optimum aggregation size will alter depending on wind capacity, SNSP limits, and penetration of renewables into the grid. Referring to Table 1, the dispatch-down figure reduced from 1909 GWh in 2020 to 752 GWh in 2021 because 2021 was a less windy year than 2020, while SNSP limits transitioned from 65% to 75% in the same year. Notwithstanding year-to-year variations, it is important to note that dispatch-down due to energy balancing is forecasted to rise significantly in line with greater penetration of wind energy targeted by Ireland’s ambitious climate policy [12,101].
Finally, considering payback on the technology to enable household participation in an EWHA scheme, the cost of installation for the largest aggregation possible in 2019 (901,188), estimated at EUR 222/device, would cost EUR 200 M with a simple payback of 14 years. If the fuel-poor population were aggregated (461,000), the theoretical simple payback would reduce to 6.4 years.

4. Discussion

It was found that while the use of domestic hot water as an energy store at scale could harness all unused wind-generated electricity in 2019, the value proposition in the form of “free” hot water to the householder diminishes as more tanks are aggregated. Notwithstanding the relatively small saving to the individual householder, it is understood that those in fuel poverty limit their use of hot water and, therefore, the receipt of a free tank of hot water weekly may be a significant boon to those who cannot afford to heat water in the first instance. Fuel poverty affects lone parents, women, people of colour, and the elderly the most and can therefore be seen as a consequence of, and contributor to, injustices linked to gender, ethnicity, and age [102]. Lone parents, overwhelmingly women, and their children are at a higher risk of fuel poverty than all other cohorts of society. It is hypothesised that the receipt of a weekly tank of hot water could become “bath night” for these households. It is also hypothesised that there may be meta benefits arising from a provision of “free” hot water such as positive feelings arising from inclusion in green initiatives/aggregation schemes or through relief of having one less challenge to overcome. Furthermore, it may be possible that these citizens become active actors in the energy system; this could be facilitated through push notifications sent to householders when there is a curtailment event. Such notifications could result in a change in behaviour. For example, the householder might wait to receive an alert to have a “bath night”, thereby changing their behaviour to match the supply of renewable energy and, thus, allowing for greater accommodation of VRE and enhanced generation adequacy while creating potential for deferred or avoided network investment. Such outcomes are in line with the ambitions of the EU 2019 Clean Energy Package of using flexibility in grid planning as an alternative to system expansion, simultaneously allowing the effective and non-discriminatory participation of residential customers. Thus, in summary, while, at larger aggregations, the monetary savings from a household perspective are not significant, cumulatively, and as shown in Figure 9, the cost and resultant CO2 savings to and from the residential sector at large are very significant. Therefore, a balance must therefore be struck between alleviating fuel poverty to the greatest extent possible (relatively small aggregation) and the greater carbon benefit realisable by society at large arising for a larger aggregation. Carbon cost savings realised by the state could be rediverted into energy infrastructure. To summarise, as shown in Figure 10, the value proposition of EWH aggregation as a flexible system asset for:
  • The householder or citizen, who must be balanced against the value to;
  • The state, in support of meeting the requirements of Article 32 of the EU Clean Energy Package in enabling householders to become actors in the energy system, while creating a citizen-owned energy system that alleviates fuel poverty, reduces reliance on imported fossil fuels, and lowers costs associated with carbon production, to the;
  • The climate, through facilitating greater penetration of VRE, reducing waste through harnessing unused electricity, and reducing CO2 emissions, and ultimately to;
  • The grid, by offering inter alia frequency control during high-wind conditions along with the creation of new markets while facilitating a higher penetration of VRE through demand response.
Figure 10. Value nexus of a shared, low-cost, flexible system asset capable of eliminating wind wastage.
Sustainability 16 04470 g010
Further research is required to establish, as shown in Figure 10, the nexus between a valuable level of demand and frequency control from, say, the perspective of Ireland’s TSO, to facilitate a greater penetration of VRE and an increase in SNSP limits, along with the resultant carbon that could be potentially offset at grid level, which will likely favour a larger aggregation as more disaggregated demand load is available versus significantly reducing the impact of fuel poverty at a household level, which this study shows to favour a smaller aggregation.
From the perspective of the “state”, favouring a “grid” over a “fuel-poor citizen-first” approach does not, on the face of it, support a just transition as much as taking a “fuel-poor citizen-first” approach might, notwithstanding that the state must balance supporting a just transition and reach the furthest-behind first while, as required by Article 32 of the EU 2019 clean energy package, allowing market access for all, not just fuel-poor, householders to create new markets. The state also seeks to reduce dependence on imported fossil fuel, as well as using demand flexibility to reduce investments required in energy infrastructure. It is evident, thus, that more research is required to establish an optimum solution/aggregation in an Irish but also social context.
Optimum aggregation size will also vary by country; for instance, in South Africa, EWHs contribute up to 40% of a household’s total energy consumption [103], and as the households in South Africa rely almost exclusively on electricity for energy, EWHs constitute 30% to 50% of grid load at peak times, accounting for 7% of the country’s daily energy requirements [82]. Since 88% of the country’s electricity is generated from burning coal, the environmental water heating footprint is substantial [82]. Thus, each country needs to balance a different set of parameters to determine an optimum aggregation size.

Limitations, Recommendations, and Future Research

No metered DHW study has been carried out in the Irish context, it is recommended that a DHW be carried out to characterise DHW consumption patterns for “standard” and fuel-poor households in Ireland. This study should account for daily, weekly, seasonal, and annual patterns as well as occupant behavioural profiles.
This research assumes a standardised water load, assuming householders can afford to heat hot water in the first place; it is known that in fuel-poor homes, householders limit the generation of hot water to limit financial outlay, so there might be no savings realised as water is not being heated in the first instance; this is a limitation of this work that will be refined in future research.
Notwithstanding the simplified modelling approach adopted and understanding that wind- and weather-driven hot water consumption patterns vary year on year, this research provides a theoretical proof of concept that can be validated through a demonstrator EWHA aggregation scheme. As 77% of Irish households already have a DHW immersion, a low-cost retrofit of temperature sensor(s) enabling the accurate measurement of available heat capacity within the cylinder at any time, along with telecommunications to transmit a signal to an aggregator that the cylinder can accept heat input, would be all that would be required to enable a detailed technical and economic feasibility study. This generates an understanding of household (occupancy and system) variations and long-term EWHA scheme viability. A demonstrator project would also enable a comprehensive socio-technical impact analysis of an EWHA initiative, considering inter alia environment and economic benefits as well as the real impact and meta benefits for fuel-poor consumers as well as society at large.

5. Conclusions

Dispatch-down has traditionally been viewed as a “bad” thing, in terms of wasted energy; this research presents a case as to how advantages can be taken of unused wind-generated electricity, an increasing resource, to provide more services benefitting society.
This study finds that all wind energy curtailed currently can be redeployed into electro-thermal hot water storage, concluding that domestic hot water cylinders offer a currently underutilised large-scale, dispersed, and ubiquitous micro-capacitance which can readily provide some of the needed flexibility to electrical grids, facilitating higher levels of VRE, along with ready market access for residential consumers.
It is shown that redeploying all unused wind-generated electricity to heat hot water in homes, through the addition of low-cost controls on pre-existing infrastructure, has the potential to realise an average EUR 256 M saving to the Irish householder at large to offset 633 tCO2 in 2019, realising a potential shadow carbon cost saving to the state of EUR 6M in 2022, rising to EUR 20 M in 2030 and EUR 162 M in 2050.
While the use of domestic hot water as an energy store at scale was capable of utilising all overnight curtailed wind energy (233 GWh) in 2019, the value proposition in the form of “free” hot water to the householder diminishes as more tanks are aggregated; indeed, at the maximum scale of aggregation, households would only realise a 7% saving on their water fuel bill.
A key finding of this research is that when sustainability matchmaking, there is an optimum aggregation size wherein near-maximum levels of dispatch-down and carbon are offset, concurrent with scheme participants receiving the maximum benefit, in this case hot water, from participating in the scheme. Optimum aggregation size will alter depending on wind capacity, SNSP limits, and penetration of renewables into the grid and will therefore vary from country to country.
As this research has a focus on alleviating fuel poverty, the extent to which a full tank of hot water can be provided for at least one night of the week so that important cleaning, bathing, and hygiene tasks within each home can be catered for on a weekly basis, also known as “bath night”, was analysed. It was found that fuel-poor households in Ireland could be provided with a “free” full tank of hot water for 1 in every 3 weeks, capturing almost 90% of overnight curtailed wind energy in 2019, saving a theoretical EUR 29 (10% of their bill) and EUR 14 M across the fuel-poor aggregation, realising a potential carbon cost saving to the state of EUR 327 K in 2022, rising to EUR 1.3 M in 2030 and EUR 10.3 M in 2050, simultaneously alleviating while empowering such households to become electricity market participants.
Considering the primary infrastructure is already in place in most Irish households, secondary enabling infrastructure is a low-cost readily deployable retrofit solution. It is recommended that national policies be put in place to mandate the use of unused wind-generated electricity to provide new services and, in the interest of a just transition, that fuel-poor households be targeted to benefit initially. Due to privacy laws, it is not known publicly which houses are at risk of fuel poverty; therefore, such an initiative would need to be coordinated at the government level to include the Commission for Energy Regulation, the Sustainable Energy Authority of Ireland, the transmission system operator, the distribution system operator, and social housing providers as well as energy suppliers and wind generators.

Author Contributions

Conceptualisation, C.A. and R.O.; methodology, R.O. and C.A.; validation, R.O. and C.A.; formal analysis, R.O.; investigation, R.O.; resources, C.A.; data curation, R.O.; writing—original draft preparation, C.A.; writing—review and editing, C.A., R.O., and B.N.; visualisation, R.O. and C.A.; supervision, C.A.; project administration, C.A.; funding acquisition, C.A. All authors have read and agreed to the published version of the manuscript.

Funding

This research was partially supported by MaREI, the SFI Research Centre for Energy, Climate and Marine [Grant No: 12/RC/2303-P2].

Informed Consent Statement

Desktop study, no humans were involved.

Data Availability Statement

Data are contained within the article.

Conflicts of Interest

The authors declare no conflicts of interest.

References

  1. Bird, L.; Lew, D.; Milligan, M.; Carlini, E.M.; Estanqueiro, A.; Flynn, D.; Gomez-Lazaro, E.; Holttinen, H.; Menemenlis, N.; Orths, A.; et al. Wind and solar energy curtailment: A review of international experience. Renew. Sustain. Energy Rev. 2016, 65, 577–586. [Google Scholar] [CrossRef]
  2. Permien, F.H.; Enevoldsen, P. Socio-technical constraints in German wind power planning: An example of the failed interdisciplinary challenge for academia. Energy Res. Soc. Sci. 2019, 55, 122–133. [Google Scholar] [CrossRef]
  3. Eurostat. Renewable Energy in the EU. Eurostat Newsrelease. 2019. Available online: https://ec.europa.eu/eurostat/documents/2995521/9571695/8-12022019-AP-EN.pdf/b7d237c1-ccea-4adc-a0ba-45e13602b428 (accessed on 19 May 2024).
  4. EEA. Share of Energy Consumption from Renewable Sources in Europe. 2024. Available online: https://www.eea.europa.eu/en/analysis/indicators/share-of-energy-consumption-from?activeAccordion=546a7c35-9188-4d23-94ee-005d97c26f2b (accessed on 19 May 2024).
  5. US Government. The White House, FACT SHEET: President Biden Sets 2030 Greenhouse Gas Pollution Reduction Target Aimed at Creating Good-Paying Union Jobs and Securing U.S. Leadership on Clean Energy Technologies. 2020. Available online: https://www.whitehouse.gov/briefing-room/statements-releases/2021/04/22/fact-sheet-president-biden-sets-2030-greenhouse-gas-pollution-reduction-target-aimed-at-creating-good-paying-union-jobs-and-securing-u-s-leadership-on-clean-energy-technologies/ (accessed on 19 May 2024).
  6. Yang, G.; Zhang, G.; Cao, D.; Zha, D.; Su, B. China’s ambitious low-carbon goals require fostering city-level renewable energy transitions. iScience 2023, 26, 106263. [Google Scholar] [CrossRef] [PubMed]
  7. GWEC. Global Wind Report. 2019. Available online: https://gwec.net/global-wind-report-2019/ (accessed on 4 May 2024).
  8. Fernández, L. Global Cumulative Installed Wind Power Capacity 2001–2023, Statista. 2023. Available online: https://www.statista.com/statistics/268363/installed-wind-power-capacity-worldwide/#:~:text=The%20cumulative%20capacity%20of%20installed,about%20946%20gigawatts%20that%20year (accessed on 3 May 2024).
  9. Fernández, L. Share of Electricity Generation from Wind Energy Sources Worldwide from 2010 to 2022, Statista. 2022. Available online: https://www.statista.com/statistics/1302053/global-wind-energy-share-electricity-mix/#:~:text=Wind%20energy%20sources%20accounted%20for,percent%20share%20a%20year%20earlier (accessed on 15 May 2024).
  10. IEA. ‘IEA Wind TCP Annual Report’, Technology Collaboration Programme. 2019. Available online: https://iea-wind.org/wp-content/uploads/2022/11/Annual-Report-2019.pdf (accessed on 3 May 2024).
  11. Hurtado, M.; Kerci, T.; Tweed, S.; Kennedy, E.; Kamaluddin, N.; Milano, F. Analysis of Wind Energy Curtailment in the Ireland and Northern Ireland Power Systems. In Proceedings of the IEEE Power & Energy Society General Meeting (PESGM), Orlando, FL, USA, 16–20 July 2023. [Google Scholar]
  12. IWEA. Saving Power, 70 by 30 Implementation Plan; Irish Wind Energy Association: Dublin Ireland, 2020; Available online: https://www.energystorageireland.com/wp-content/uploads/2020/08/IWEA-ESI-Saving-Power-Report.pdf (accessed on 15 May 2024).
  13. Xu, T.; Gao, W.; Qian, F.; Li, Y. The implementation limitation of variable renewable energies and its impacts on the public power grid. Energy 2022, 239, 121992. [Google Scholar] [CrossRef]
  14. WindEurope. WindEurope Views on Curtailment of Wind Power and Its Links to Priority Dispatch. 2016. Available online: https://windeurope.org/wp-content/uploads/files/policy/position-papers/WindEurope-Priority-Dispatch-and-Curtailment.pdf (accessed on 5 February 2021).
  15. Eirgrid. Annual Renewable Constraint and Curtailment Report 2019 in, Dublin, Ireland. 2019; Available online: https://www.eirgridgroup.com/site-files/library/EirGrid/Annual-Renewable-Constraint-and-Curtailment-Report-2019-V1.2.pdf (accessed on 15 May 2024).
  16. Eirgrid. Shaping our Electricity Future, in, Dublin, Ireland. 2021; Available online: https://cms.eirgrid.ie/sites/default/files/publications/Shaping-Our-Electricity-Future-Technical-Report-Executive-Summary.pdf (accessed on 15 May 2024).
  17. Newbery, D. National Energy and Climate Plans for the island of Ireland: Wind curtailment, interconnectors and storage. Energy Policy 2021, 158, 112513. [Google Scholar] [CrossRef]
  18. Bashi, M.H.; De Tommasi, L.; Lyons, P. Electricity market integration of utility-scale battery energy storage units in Ireland, the status and future regulatory frameworks. J. Energy Storage 2022, 55, 105442. [Google Scholar] [CrossRef]
  19. Eirgrid. Annual Renewable Energy Constraint and Curtailment Report 2021, in, Dublin, Ireland. 2021. Available online: https://www.eirgrid.ie/site-files/library/EirGrid/Annual-Renewable-Constraint-and-Curtailment-Report-2021-V1.0.pdf (accessed on 5 May 2024).
  20. Eirgrid. Annual Renewable Energy Constraint and Curtailment Report 2018, in, Dublin, Ireland. 2018. Available online: https://www.eirgridgroup.com/site-files/library/EirGrid/Annual-Renewable-Constraint-and-Curtailment-Report-2018-V1.0.pdf (accessed on 5 May 2024).
  21. Eirgrid. Annual Renewable Constraint and Curtailment Report 2022. Available online: https://cms-prd.eirgrid.dept.ie/annual-renewable-constraint-and-curtailment-report-2022 (accessed on 15 May 2024).
  22. SEAI. Fuel Price Comparision, SEAI. 2023. Available online: https://www.seai.ie/data-and-insights/seai-statistics/key-statistics/prices/ (accessed on 5 May 2024).
  23. Chen, H.; Chen, J.; Han, G.; Cui, Q. Winding down the wind power curtailment in China: What made the difference? Renew. Sustain. Energy Rev. 2022, 167, 112725. [Google Scholar] [CrossRef]
  24. Yasuda, Y.; Bird, L.; Carlini, E.M.; Eriksen, P.B.; Estanqueiro, A.; Flynn, D.; Fraile, D.; Lázaro, E.G.; Martín-Martínez, S.; Hayashi, D.; et al. C-E (curtailment-Energy share) map: An objective and quantitative measure to evaluate wind and solar curtailment. Renew. Sustain. Energy Rev. 2022, 160, 112212. [Google Scholar] [CrossRef]
  25. Alkhalidi, A.; Alqarra, K.; Abdelkareem, M.A.; Olabi, A.G. Renewable energy curtailment practices in Jordan and proposed solutions. Int. J. Thermofluids 2022, 16, 100196. [Google Scholar] [CrossRef]
  26. Dumlao, S.M.G.; Ishihara, K.N. Impact assessment of electric vehicles as curtailment mitigating mobile storage in high PV penetration grid. Energy Rep. 2022, 8, 736–744. [Google Scholar] [CrossRef]
  27. Agbonaye, O.; Keatley, P.; Huang, Y.; Bani-Mustafa, M.; Ademulegun, O.O.; Hewitt, N. Value of demand flexibility for providing ancillary services: A case for social housing in the Irish DS3 market. Util. Policy 2020, 67, 101130. [Google Scholar] [CrossRef]
  28. Osunmuyiwa, O.O.; Peacock, A.D. What matters? Unlocking householders’ flexibility towards cooling automation in India. Environ. Innov. Soc. Transit. 2023, 47, 100704. [Google Scholar] [CrossRef]
  29. Niaz, H.; Liu, J.J.; You, F. Can Texas mitigate wind and solar curtailments by leveraging bitcoin mining? J. Clean. Prod. 2022, 364, 132700. [Google Scholar] [CrossRef]
  30. Agbonaye, O.; Keatley, P.; Huang, Y.; Ademulegun, O.O.; Hewitt, N. Mapping demand flexibility: A spatio-temporal assessment of flexibility needs, opportunities and response potential. Appl. Energy 2021, 295, 117015. [Google Scholar] [CrossRef]
  31. Nikolakakis, T.E.; Gutierrez, T.; Fernandez, L.; Kiviluoma, J.; Rissanen, S.; Lindross, T.J. Power System Flexibility for the Energy Transition: Part 2, IRENA FlexTool Methodology. 2018. Available online: https://www.irena.org/-/media/Files/IRENA/Agency/Publication/2018/Nov/IRENA_Power_system_flexibility_2_2018.pdf?la=en&hash=B7028E2E169CF239269EC9695D53276E084A29AE (accessed on 12 October 2022).
  32. Dixon, D. EU-SysFlex Qualification Trial Process for Technology Integration and Trialling of System Services D4.4; Eirgrid: Dublin, Ireland, 2018; Available online: https://eu-sysflex.com/wp-content/uploads/2019/03/D4.4-Qualification-Trial-Process-for-technology-Integration-and-trialling-of-System-Services.pdf (accessed on 10 May 2024).
  33. Ding, K.; Zhi, J. Chapter 6—Wind Power Peak-Valley Regulation and Frequency Control Technology. In Large-Scale Wind Power Grid Integration; Wang, N., Kang, C., Ren, D., Eds.; Academic Press: Oxford, UK, 2016; pp. 211–232. [Google Scholar]
  34. Lee, M.P. Assessment of Demand Response and Advanced Metering, Office of Energy Policy and Innovation, Federal Energy Regulatory Commission. 2012. Available online: https://www.madrionline.org/wp-content/uploads/2013/09/Lee.pdf (accessed on 12 October 2022).
  35. ANON. Market Design for Demand Side Reponse, in, Brussels, Belgium, 2015, European Network of Transviewed May 2024. Available online: https://eepublicdownloads.entsoe.eu/clean-documents/Publications/Position%20papers%20and%20reports/entsoe_pp_dsr_web.pdf (accessed on 5 May 2024).
  36. Bloom, R.; Sugden, L. Status and Opportunities for Flexible Residential E-HVAC; DELTA-EE: Edinburgh, Scotland, 2021. [Google Scholar]
  37. D’Ettorre, F.; Banaei, M.; Ebrahimy, R.; Pourmousavi, S.A.; Blomgren, E.M.V.; Kowalski, J.; Bohdanowicz, Z.; Łopaciuk-Gonczaryk, B.; Biele, C.; Madsen, H. Exploiting demand-side flexibility: State-of-the-art, open issues and social perspective. Renew. Sustain. Energy Rev. 2022, 165, 112605. [Google Scholar] [CrossRef]
  38. Agbonaye, O.; Keatley, P.; Huang, Y.; Odiase, F.O.; Hewitt, N. Value of demand flexibility for managing wind energy constraint and curtailment. Renew. Energy 2022, 190, 487–500. [Google Scholar] [CrossRef]
  39. Slowe, J. Hot Water Tanks Get Smarter, Edinburgh, Scotland; DELTA-EE: Edinburgh, Scotland, 2020.
  40. Kepplinger, P.; Huber, G.; Preißinger, M.; Petrasch, J. State estimation of resistive domestic hot water heaters in arbitrary operation modes for demand side management. Therm. Sci. Eng. Prog. 2019, 9, 94–109. [Google Scholar] [CrossRef]
  41. Arteconi, A.; Hewitt, N.J.; Polonara, F. State of the art of thermal storage for demand-side management. Appl. Energy 2012, 93, 371–389. [Google Scholar] [CrossRef]
  42. Elamari, K.I. Using Electric Water Heaters (EWHs) for Power Balancing and Frequency Control in PV-Diesel Hybrid Mini-Grids. Master’s Thesis, Concordia University, Montreal, QC, Canada, 2011. [Google Scholar]
  43. Cooper, D.; Cronje, W. Autonomous water heater control for load regulation on smart grids. In Proceedings of the IEEE International Energy Conference (ENERGYCON), Leuven, Belgium, 4–8 April 2016; pp. 1–6. [Google Scholar]
  44. Xu, Z.; Diao, R.; Lu, S.; Lian, J.; Zhang, Y. Modeling of electric water heaters for demand response: A baseline PDE model. IEEE Trans. Smart Grid 2014, 5, 2203–2210. [Google Scholar] [CrossRef]
  45. Epiard, X.; Prestat, B. EDF Experience with Storage in EU and US Markets; World Future Energy Summit: Abu Dhabi, UAE, 2017; Available online: www.issuu.com (accessed on 3 May 2024).
  46. Marnell, K.; Eustis, C.; Bass, R.B. Resource study of large-scale electric water heater aggregation. IEEE Open Access J. Power Energy 2020, 7, 82–90. [Google Scholar] [CrossRef]
  47. Government of Oregon. Actively Adapting to the Changing Electricitysector. 2018. Available online: https://www.oregon.gov/puc/utilities/Documents/SB978LegislativeReport-ExecSummary.pdf (accessed on 8 April 2021).
  48. Mabina, P.; Mukoma, P.; Booysen, M.J. Sustainability matchmaking: Linking renewable sources to electric water heating through machine learning. Energy Build. 2021, 246, 111085. [Google Scholar] [CrossRef]
  49. Laurent, J.C.; Desaulniers, G.; Malhamé, R.P.; Soumis, F. A column generation method for optimal load management via control of electric water heaters. IEEE Trans. Power Syst. 1995, 10, 1389–1400. [Google Scholar] [CrossRef]
  50. Sepulveda, A.; Paull, L.; Morsi, W.G.; Li, H.; Diduch, C.P.; Chang, L. A novel demand side management program using water heaters and particle swarm optimization. In Proceedings of the 2010 IEEE Electrical Power & Energy Conference, Halifax, NS, Canada, 25–27 August 2010; pp. 1–5. [Google Scholar]
  51. Kepplinger, P.; Huber, G.; Petrasch, J. Demand Side Management via Autonomous Control-Optimization and Unidirectional Communication with Application to Resistive Hot Water Heaters; ENOVA: Eisenstadt, Austria, 2014; Volume 8. [Google Scholar]
  52. Kara, E.C.; Berges, M.; Krogh, B.; Kar, S. Using smart devices for system-level management and control in the smart grid: A reinforcement learning framework. In Proceedings of the 2012 IEEE Third International Conference on Smart Grid Communications (SmartGridComm), Tainan, Taiwan, 5–8 November 2012; pp. 85–90. [Google Scholar]
  53. Diduch, C.; Shaad, M.; Errouissi, R.; Kaye, M.E.; Meng, J.; Chang, L. Aggregated domestic electric water heater control-building on smart grid infrastructure. In Proceedings of the 7th International Power Electronics and Motion Control Conference, Harbin, China, 2–5 June 2012; pp. 128–135. [Google Scholar]
  54. Al-Jabery, K.; Wunsch, D.C.; Xiong, J.; Shi, Y. A novel grid load management technique using electric water heaters and Q-learning. In Proceedings of the 2014 IEEE International Conference on Smart Grid Communications (SmartGridComm), Venice, Italy, 3–6 November 2014; pp. 776–781. [Google Scholar]
  55. Guo, Y.; Mahdavi, N. Machine learning method for day classification to understand thermostatically controlled load demand. In Proceedings of the 2017 IEEE Innovative Smart Grid Technologies-Asia (ISGT-Asia), Auckland, New Zealand, 4–7 December 2017; pp. 1–5. [Google Scholar]
  56. Lu, N.; Katipamula, S. Control strategies of thermostatically controlled appliances in a competitive electricity market. In Proceedings of the IEEE Power Engineering Society General Meeting, San Francisco, CA, USA, 12–16 June 2005; pp. 202–207. [Google Scholar]
  57. Liu, M.; Shi, Y. Model predictive control of aggregated heterogeneous second-order thermostatically controlled loads for ancillary services. IEEE Trans. Power Syst. 2015, 31, 1963–1971. [Google Scholar] [CrossRef]
  58. Zong, Y.; Böning, G.M.; Santos, R.M.; You, S.; Hu, J.; Han, X. Challenges of implementing economic model predictive control strategy for buildings interacting with smart energy systems. Appl. Therm. Eng. 2017, 114, 1476–1486. [Google Scholar] [CrossRef]
  59. Qu, Z.; Xu, C.; Ma, K.; Jiao, Z. Fuzzy neural network control of thermostatically controlled loads for demand-side frequency regulation. Energies 2019, 12, 2463. [Google Scholar] [CrossRef]
  60. Diao, R.; Lu, S.; Elizondo, M.; Mayhorn, E.; Zhang, Y.; Samaan, N. Electric water heater modeling and control strategies for demand response. In Proceedings of the 2012 IEEE Power and Energy Society General Meeting, San Diego, CA, USA, 22–26 July 2012; pp. 1–8. [Google Scholar]
  61. Gelažanskas, L.; Gamage, K. Distributed Energy Storage Using Residential Hot Water Heaters. Energies 2016, 9, 127. [Google Scholar] [CrossRef]
  62. Nehrir, M.H.; Jia, R.; Pierre, D.A.; Hammerstrom, D.J. Power management of aggregate electric water heater loads by voltage control. In Proceedings of the 2007 IEEE Power Engineering Society General Meeting, Tampa, FL, USA, 24–28 June 2007; pp. 1–6. [Google Scholar]
  63. Kondoh, J.; Lu, N.; Hammerstrom, D.J. An evaluation of the water heater load potential for providing regulation service. In Proceedings of the 2011 IEEE Power and Energy Society General Meeting, Detroit, MI, USA, 24–29 July 2011; pp. 1–8. [Google Scholar]
  64. European Commission. Realising Value from Electricity Markets with Local Smart Electric Thermal Storage Technology, EU Commission. 2018. Available online: https://cordis.europa.eu/article/id/241249-smart-storage-heaters-benefit-households-and-business (accessed on 12 October 2022).
  65. Bloess, A.; Schill, W.-P.; Zerrahn, A. Power-to-heat for renewable energy integration: A review of technologies, modeling approaches, and flexibility potentials. Appl. Energy 2018, 212, 1611–1626. [Google Scholar] [CrossRef]
  66. Andrade, B.B.; Rathie, P.N. Fitting asymmetric bimodal data with selected distributions. J. Stat. Comput. Simul. 2016, 86, 3205–3224. [Google Scholar] [CrossRef]
  67. EirGrid 2016–2018, Power Off and Save, EirGrid. 2021. Available online: http://www.eirgridgroup.com/how-the-grid-works/power-off-save/ (accessed on 6 February 2021).
  68. Ahern, C.; Griffiths, P.; O’Flaherty, M. State of the Irish Housing stock—Modelling the heat losses of Ireland’s existing detached rural housing stock & estimating the benefit of thermal retrofit measures on this stock. Energy Policy 2013, 55, 139–151. [Google Scholar]
  69. Barrett, M.; Farrell, N.; Roantree, B. Energy Poverty and Deprivation in Ireland; Economic & Social Research Institute: Dublin, Ireland, 2022. [Google Scholar]
  70. Energy Savings Trust. Measurement of Domestic Hot Water Consumption in Dwellings. 2008. Available online: https://assets.publishing.service.gov.uk/government/uploads/system/uploads/attachment_data/file/48188/3147-measure-domestic-hot-water-consump.pdf (accessed on 10 January 2023).
  71. López-Rodríguez, M.A.; Santiago, I.; Trillo-Montero, D.; Torriti, J.; Moreno-Munoz, A. Analysis and modeling of active occupancy of the residential sector in Spain: An indicator of residential electricity consumption. Energy Policy 2013, 62, 742–751. [Google Scholar] [CrossRef]
  72. Gerin, O.; Bleys, B.; de Cuyper, K. Seasonal variation of hot and cold water consumption in apartment buildings. 2014. Available online: https://www.irbnet.de/daten/iconda/CIB_DC27564.pdf (accessed on 5 January 2023).
  73. Zhou, S.L.; McMahon, T.A.; Walton, A.; Lewis, J. Forecasting operational demand for an urban water supply zone. J. Hydrol. 2002, 259, 189–202. [Google Scholar] [CrossRef]
  74. Gato, S.; Jayasuriya, N.; Roberts, P. Forecasting Residential Water Demand: Case Study. J. Water Resour. Plan. Manag. 2007, 133, 309–319. [Google Scholar] [CrossRef]
  75. de Santiago, J.; Rodriguez-Villalón, O.; Sicre, B. The generation of domestic hot water load profiles in Swiss residential buildings through statistical predictions. Energy Build. 2017, 141, 341–348. [Google Scholar] [CrossRef]
  76. George, D. Mech 6340 Project High Time-Step Resolution Measured Domestic Hot Water Consumption Profiles of Single Detached Canadian Homes, Dalhousie University, 13 February 2015. Available online: https://dalspace.library.dal.ca/bitstream/handle/10222/72580/George-Dane-MASc-Thesis-MECH-December-2016.pdf?sequence=5 (accessed on 3 May 2024).
  77. Blokker, E.J.M.; Vreeburg, J.H.G.; van Dijk, J.C. Simulating Residential Water Demand with a Stochastic End-Use Model. J. Water Resour. Plan. Manag. 2010, 136, 19–26. [Google Scholar] [CrossRef]
  78. Sborz, J.; Kalbusch, A.; Henning, E. A Review on Domestic Hot Water Consumption in Social Housing. Water 2022, 14, 2699. [Google Scholar] [CrossRef]
  79. Jack, M.W.; Suomalainen, K.; Dew, J.J.W.; Eyers, D. A minimal simulation of the electricity demand of a domestic hot water cylinder for smart control. Appl. Energy 2018, 211, 104–112. [Google Scholar] [CrossRef]
  80. Roux, M.; Booysen, M.J. Use of smart grid technology to compare regions and days of the week in household water heating. In Proceedings of the 2017 International Conference on the Domestic Use of Energy (DUE), Cape Town, South Africa, 4–5 April 2017; pp. 276–283. [Google Scholar]
  81. Fairey, P.; Parker, D. A Review of Hot Water Draw Profiles Used in Performance Analysis of Residential Domestic Hot Water Systems; Florida Solar Energy Center: Cocoa, FL, USA; University of Central Florida: Orange County, FL, USA, 2004. [Google Scholar]
  82. Ritchie, M.J.; Engelbrecht, J.A.A.; Booysen, M.J. A probabilistic hot water usage model and simulator for use in residential energy management. Energy Build. 2021, 235, 110727. [Google Scholar] [CrossRef]
  83. Neu, O.; Oxizidis, S.; Flynn, D.; Finn, D. Utilising time of use surveys to predict domestic hot water consumption and heat demand profiles of residential building stocks. Br. J. Environ. Clim. Change 2016, 6, 77–89. [Google Scholar] [CrossRef]
  84. Jordan, U.; Vajen, K. DHWcalc: Program to generate domestic hot water profiles with statistical means for user defined conditions. In Proceedings of the ISES Solar World Congress, Orlando, FL, USA, 6–12 August 2005. [Google Scholar]
  85. Fischer, D.; Toral, T.R.; Lindberg, K.B.; Wille-Haussmann, B.; Madani, H. Investigation of Thermal Storage Operation Strategies with Heat Pumps in German Multi Family Houses. Energy Procedia 2014, 58, 137–144. [Google Scholar] [CrossRef]
  86. Ferrantelli, A.; Ahmed, K.; Pylsy, P.; Kurnitski, J. Analytical modelling and prediction formulas for domestic hot water consumption in residential Finnish apartments. Energy Build. 2017, 143, 53–60. [Google Scholar] [CrossRef]
  87. Widén, J.; Lundh, M.; Vassileva, I.; Dahlquist, E.; Ellegård, K.; Wäckelgård, E. Constructing load profiles for household electricity and hot water from time-use data—Modelling approach and validation. Energy Build. 2009, 41, 753–768. [Google Scholar] [CrossRef]
  88. Popescu, D.; Serban, E. Simulation of domestic hot-water consumption using time-series models. In Proceedings of the 6th IASME/WSEAS International Conference On Heat Transfer, Thermal Engineering and Environment, Rhodes, Greece, 20–22 August 2008; pp. 20–22. [Google Scholar]
  89. Kepplinger, P.; Huber, G.; Petrasch, J. Field testing of demand side management via autonomous optimal control of a domestic hot water heater. Energy Build. 2016, 127, 730–735. [Google Scholar] [CrossRef]
  90. Kamal, S. Energy Follow Up Survey: Fuel Poverty. 2018. Available online: https://assets.publishing.service.gov.uk/government/uploads/system/uploads/attachment_data/file/1018737/efus-fuel-poverty.pdf (accessed on 10 January 2023).
  91. SEAI. Energy in the Residential Sector—2018 Report. 2018. Available online: https://www.seai.ie/resources/publications/Energy-in-the-Residential-Sector-2018-Final.pdf (accessed on 10 January 2024).
  92. Element Energy. Bottom-up Analysis of Fuel Poverty in Ireland. 2015. Available online: https://assets.gov.ie/76593/331e2543-a5a1-4057-a902-d0e2a8827d50.pdf (accessed on 12 March 2022).
  93. Nestor, R. Social Impact Assessment—SEAI Programmes Targeting Energy Poverty; Department of Public Expenditure and Reform, Ed.; Irish Government Economic and Evaluation Service: Dublin, Ireland, 2020. [Google Scholar]
  94. CSO 2019, Survey on Income and Living Conditions (SILC) 2019, CSO, viewed 29 March 2021 2020. Available online: https://www.cso.ie/en/releasesandpublications/ep/p-silc/surveyonincomeandlivingconditionssilc2019/ (accessed on 4 April 2024).
  95. CSO. Census of Population—Preliminary Results, Central Statistics Office. 2022. Available online: https://www.cso.ie/en/releasesandpublications/ep/p-cpr/censusofpopulation2022-preliminaryresults/housing/#:~:text=A%20total%20of%202%2C124%2C590%20permanent,(%2D9%25)%20to%20166%2C752 (accessed on 24 September 2022).
  96. O’Doherty, C. Families Live in Constant Cold as Energy Poverty Forces Heat Rationing. The Irish Independent, Independent New and Media: Dublin, Ireland, 2021. [Google Scholar]
  97. Gold Standard. Carbon Pricing: Setting an Internal Price on Carbon. 2021. Available online: https://www.goldstandard.org/blog-item/carbon-pricing-setting-internal-price-carbon (accessed on 15 May 2024).
  98. Government of Ireland. An Overview of Carbon Pricing; Parliamentarty Budget Office, Ed.; Houses of the Oireachtas: Dublin, Ireland, 2019; Available online: https://data.oireachtas.ie/ie/oireachtas/parliamentaryBudgetOffice/2019/2019-07-04_an-overview-of-carbon-pricing_en.pdf (accessed on 15 May 2024).
  99. Government of Ireland. Public Spending Code A Guide to Economic Appraisal: Carrying Out a Cost Benefit Analysis. In Public Spending Code, A Guide to Evaluating, Planning and Managing Public Investment; Government of Ireland: Dublin, Ireland, 2019. Available online: https://www.gov.ie/en/publication/public-spending-code/ (accessed on 12 January 2022).
  100. European Commission. EU Emissions Trading System (EU ETS). 2005. Available online: https://ec.europa.eu/clima/policies/ets_en (accessed on 12 January 2021).
  101. Government of Ireland 2023, Climate Action Plan, Department of Environment, Climate and Communications. Available online: https://www.gov.ie/en/publication/7bd8c-climate-action-plan-2023/ (accessed on 15 January 2023).
  102. Lawlor, D.; Visser, A. Energy Poverty in Ireland. 2022. Available online: https://data.oireachtas.ie/ie/oireachtas/libraryResearch/2022/2022-03-04_l-rs-note-energy-poverty-in-ireland_en.pdf (accessed on 15 May 2024).
  103. Hohne, P.A.; Kusakana, K.; Numbi, B.P. A review of water heating technologies: An application to the South African context. Energy Rep. 2019, 5, 1–19. [Google Scholar] [CrossRef]
Figure 1. Share of flexible electric heating capacity currently used in demand response, by asset type (total capacity ~1.4 GW) [33].
Sustainability 16 04470 g001
Figure 2. Average daily curtailment distribution for Ireland in 2019.
Sustainability 16 04470 g002
Figure 3. (a,b) Nightly and weekly instances of curtailment (10 p.m. to 7 a.m.) for Ireland in 2019.
Sustainability 16 04470 g003
Figure 4. Utilised overnight wind curtailment for various “smart” hot water cylinder installations.
Sustainability 16 04470 g004
Figure 6. (a,b) Utilised energy and distribution of half-hourly allocations by aggregation size.
Sustainability 16 04470 g006
Figure 7. Weeks with at least one full overnight allocation of wind curtailment.
Sustainability 16 04470 g007
Figure 8. Energy cost and CO2 emissions associated with delivered and deployed domestic hot water as a function of aggregation size (cross-referencing Figure 7).
Sustainability 16 04470 g008
Figure 9. Potential displaced cost (to Irish householder) and CO2 emissions (in millions) from dispatch-down powered EWHs for various aggregations.
Sustainability 16 04470 g009
Table 1. Average market retail value of unused VRE electricity from 2017 to 2021 [15,19,20,21,22].
20172018201920202021Total
GWh3867071008 1909 752 4762
€/kWh0.220530.226070.232130.23120.2456
€ Total M€ 85 € 160 € 234 € 441 € 185 € 1105
Table 2. Articulation of Wind Allocation Methodology (refers to Table 3).
Time PeriodResult of Model Application
10:00 p.m. to 10:30 p.m.Wind curtailments of 92 MWh occurred, which, divided by 1.5 kWh per immersion, equates to sufficient energy for 61,322 household DHW immersions (92,000 kWh/1.5 kWh).
10:30 p.m. to 11 p.m.Available curtailment is sufficient to deliver 1.5 kWh (1 allocation) of energy to 5488 homes.
11:00 p.m. to 11:30 p.m.No curtailment occurs and thus no energy is allocated.
11:30 p.m. to 12:00 a.m.There is sufficient energy for 77,033 homes; therefore, 55,834 households receive a second allocation, 5489 receive a third allocation, and 15,710 (77,033–61,322) receive an allocation of wind energy for the first time. In Table 3, the following is noted:
Homes identified from 1 to 5488 have used power for three 30 min periods;
Homes identified from 5489 to 61,322 have used power for two 30 min periods;
Homes identified from 61,323 to 77,033 have been supplied with energy for the first time.
12:00 a.m. to 1:30 a.m.Available energy is allocated in a similar manner to previous time periods.
1:30 a.m. to 2:00 a.m.Households identified from 1 to 5488, having received the maximum of 6 allocations, no longer receive energy as noted by the allocation count at the base of Table 3. It is worth noting that even though there is sufficient energy at this time for 212,286 homes, households identified from 5489 to 200,000 (or up to the total households within the identified aggregation) received energy.
2:00 a.m. to 4:00 a.m.:Available energy is allocated to the remaining homes until each is provided with 9 kWh or 6 allocations of 1.5 kWh of renewable electricity.
4:30 a.m. to 6:30 a.m.Even though significant energy is available, this is left unused as the 200,000 homes in the identified aggregation have been provided with their maximum allocation.
Table 3. Potential allocation of curtailment to 200,000 homes overnight on the 12th January 2019.
TimeCurtailment [MWh]Potential Households [-]Household Allocations and Identifiers
22:0092.0 61,32215488548961,322
22:308.2 548815488
23:0000
23:30115.6 77,03315488548961,32261,32377,033
00:00210.5 140,32115488548961,32261,32377,03377,034140,321
00:30259.2 172,79115488548961,32261,32377,03377,034140,321140,322172,791
01:00275.6 183,70015488548961,32261,32377,03377,034140,321140,322172,791172,792183,700
01:30318.4 212,286 548961,32261,32377,03377,034140,321140,322172,791172,792183,700183,701200,000
02:00323.0 215,357 61,32377,03377,034140,321140,322172,791172,792 183,700 183,701 200,000
02:30346.6 231,058 77,034140,321140,322172,791172,792 183,700 183,701 200,000
03:00397.6 265,079 140,322172,791172,792 183,700 183,701 200,000
03:30427.3 284,835 172,792183,700 183,701 200,000
04:00462.1 308,044 183,701200,000
04:30455.1 303,414
05:00447.6 298,430
05:30449.3 299,564
06:00440.3 293,555
06:30460.0 306,668
Allocation Count66666666666666
Table 4. Potential allocation of curtailment to 200,000 homes overnight on the 3rd January 2019.
TimeCurtailment [MWh]Potential Households [-]Household Allocations and Identifiers
22:0000
22:3000
23:0000
23:3000
00:0000
00:3000
01:0000
01:3000
02:0029.319,52414064406519,524
02:3036.924,59014064406519,52419,52524,590
03:006.1406414064
03:3000
04:0000
04:3000
05:0000
05:3000
06:0000
06:3000
Allocation Count332211
Disclaimer/Publisher’s Note: The statements, opinions and data contained in all publications are solely those of the individual author(s) and contributor(s) and not of MDPI and/or the editor(s). MDPI and/or the editor(s) disclaim responsibility for any injury to people or property resulting from any ideas, methods, instructions or products referred to in the content.

