Article

Green Finance Advancement and Its Impact on Urban Haze Pollution in China: Evidence from 283 Cities

1
School of Economics and management, Northwestern University, Xi’an 710100, China
2
School of Humanity and Law, Chengdu University of Technology, Chengdu 610059, China
*
Author to whom correspondence should be addressed.
Sustainability 2024, 16(11), 4455; https://doi.org/10.3390/su16114455
Submission received: 22 April 2024 / Revised: 21 May 2024 / Accepted: 22 May 2024 / Published: 24 May 2024

Abstract

:
This study selects the entropy method to measure the comprehensive index of green finance and 2011–2020 panel data covering 283 cities in China; describes spatial and temporal evolution, the migration of the centre of gravity, and discrete trends in green finance and urban haze pollution; and empirically examines the effect of green finance on urban haze pollution using static and dynamic spatial Durbin models. The study revealed that Chinese urban haze pollution significantly decreased during the sample period and that the hotspot emission area shifted to the northeast. Green finance experienced significant advancement, transitioning from a lower stage to a higher stage and becoming more geographically focused. Green finance mainly suppresses urban haze pollution through spatial spillover effects, and such spatial spillover effects change from positive to negative over time. Regarding regional heterogeneity, the effect on the western region is positive, the effects on the central and eastern regions are negative, and there is a spatial spillover effect “from promotion to inhibition” in the eastern region. Due to the heterogeneity in resource endowments, green finance in nonresource-based cities has a greater impact on haze pollution than does green finance in other cities, and in the long term, it has a significant inhibitory effect on haze pollution. This study reveals the effect of green finance on urban haze pollution from a dynamic perspective and, in doing so, it not only provides a new path for joint governance of haze pollution between cities but also provides more accurate guidance for the government to formulate policies for different regions and regions with different resource endowments.

1. Introduction

Since its reform and opening up, China’s economy has developed rapidly, but its long-standing extensive development has led to serious haze pollution problems. According to a report published by the Chinese Ministry of Ecology and Environment, the PM2.5 concentration in 337 cities and regions in China in 2019 was 36 μg/m2, which represents 46.6% of the total cities surpassing the set air quality standards. This finding indicates that the haze pollution situation, which is caused mainly by PM2.5, is still very serious. In this situation, it is imperative for society to expedite the shift in the approach to development to achieve sustainable and environmentally friendly progress. The modern economy relies heavily on finance, and strong financial support is indispensable for the advancement of green development. The green finance system was initiated in February 2012 when the China Banking Regulatory Commission (CBRC) released the ‘Guidelines on Green Credit’, serving as a programmatic document for green credit in the banking sector. In 2016, the ‘Guiding Opinions on Establishing a Sustainable Financial System’ were issued by the People’s Bank of China (PBoC) and various other ministries and commissions. These opinions provided clear guidelines for the development of a green finance system and outlined the necessary steps to be implemented. Through a sequence of institutional arrangements, China has successfully developed a comprehensive green finance product and market system comprising green loans, green bonds, green funds, and carbon finance products. As of the third quarter of 2022, the size of China’s green indexed investment funds surpassed RMB 130 billion, marking 16% growth compared to the previous year’s corresponding period. China’s green loans surpassed RMB 22 trillion by the conclusion of 2022, constituting approximately 10% of the total loan balance. The size of China’s domestic and international green bond inventory reached approximately RMB 3 trillion, with expectations for further expansion in issuance. China has made remarkable progress in the field of green finance, making positive contributions to promoting green and sustainable development. As the green finance system continues to mature, it has emerged as a crucial instrument and method for fostering sustainable economic growth. Can the development of green finance, as a novel form of environmental governance, mitigate urban haze pollution? What are the temporal and regional differences in this impact mechanism?
In recent years, scholars have conducted extensive research on haze pollution and found that the causes of haze pollution are complex, including natural and human factors. After analysing a large number of haze samples, it was found that human factors such as industrial exhaust emissions and energy consumption are the main causes of urban haze pollution [1,2]. In addition, some studies have specifically pointed out that the combustion source of fossil fuels is also an important source of haze pollution [3]. Interestingly, some scholars have proposed the “green paradox” effect, that is, the announcement of climate policies may promote the extraction and combustion of fossil fuels, which not only fails to improve environmental quality but also leads to the intensification of haze [4]. By analysing the causes of haze pollution, scholars are attempting to explore ways to improve urban haze pollution. Previous research has also indicated that urban innovation has the potential to greatly diminish haze pollution through two channels: energy consumption and industrial agglomeration [5,6]. Furthermore, Fei et al. [7] found an inverted U-shaped relationship between urban innovation efficiency and haze pollution, but currently, China’s urban innovation efficiency has not reached a turning point. In addition, existing research has found that foreign direct investment [8], digital finance [9], manufacturing agglomeration [10], and urban density [11,12], as well as new urbanization construction [13], digital development, environmental regulation, technological innovation, and an advanced industrial structure are all beneficial for improving haze pollution [14,15]. Some scholars also believe that investing in environmentally friendly transportation infrastructure, levying reasonable environmental taxes, establishing an environmental negotiation system with the Ministry of Ecology and Environment, and expanding local government environmental expenditure can also promote the governance of haze pollution [16,17,18].
With the further deepening of research on haze pollution control, “green finance” is gradually emerging. As a new trend in the development of the financial industry, green finance is a product of the combination of traditional finance and green transformation. It introduces environmental factors into financial innovation, which can better achieve the dual goals of economic development and environmental protection while achieving rapid economic development compared to traditional finance. From a macro perspective, green finance can guide internal funds in the financial system to tilt towards the green sector and help attract a large amount of social funds to support the development of the green sector. From a micro perspective, green finance can not only strengthen the supervision and management of fund utilization by financial institutions but also enhance their own environmental responsibility efficiency. Research has shown that green finance does indeed have a promoting effect on ecological environment protection [19,20,21,22]. On the one hand, green finance can promote ecological environment protection through the allocation of financial resources [23,24]. Compared to traditional finance, green finance will restrict the funding supply of high-polluting and energy-consuming enterprises by raising interest rates and other means, increase their pollution costs, force enterprises to undergo green transformation and upgrading, promote heavy-polluting enterprises to reduce industrial emissions, and improve urban haze. On the other hand, according to the theory of externalities, green finance takes into account the negative externalities of the environment, providing credit support for green and low-carbon projects, guiding funds from “three highs” production capacity to green production capacity, solving financing problems for enterprises with significant environmental benefits, encouraging green technological innovation and transformation, and reducing the emissions of haze pollutants from the tail end [25]. The improvement effect of green credit policies on air quality also proves this conclusion [26]. In addition, green finance is also beneficial for improving ecological welfare performance and promoting industrial green transformation and development [27,28]. Research based on the Yangtze River Economic Belt has shown a high degree of coupling and coordination between green finance and industrial green development [29], which provides indirect evidence for green finance to improve urban haze. Furthermore, in terms of promoting environmental protection through green finance, existing research mainly posits that green finance helps to control environmental pollution through the optimized allocation of financial resources, signal transmission [30], industrial structure optimization and upgrading [31], environmental regulation [32], green total factor productivity [33,34], and enterprise green innovation [35].
It can be found that urban haze pollution and the environmental effects of green finance are two major focuses of academic discussion, and their rich research results constitute an indispensable reference for this study. Nonetheless, the studies of urban haze pollution and green finance in academia are predominantly disjointed. Concerning the impact of green finance on urban haze pollution, particularly its potential to mitigate such pollution, numerous studies have presented a plethora of indirect evidence and valuable insights. However, only a limited number of articles have directly addressed this question. In this study, the influence of green finance on urban haze pollution is extensively examined utilizing comprehensive urban panel data from 2011 to 2020. Exploring these issues is not only conducive to enriching the content of research on green finance but also holds practical significance for promoting ecological environment improvements and sustainable development. Compared with existing studies, this study makes two contributions:
(1)
This study clarifies the environmental effects of green finance on urban haze problems. With the continuous deepening and enrichment of research on green finance, there is currently no research indicating the direct effect of green finance on urban haze pollution. This article delves into the research on whether green finance can suppress urban haze pollution, enriching the current research status of green finance and providing a new path for improving urban haze pollution.
(2)
This study enriches the empirical analysis of green finance and urban haze issues. There is no clear and unified standard for the construction of indicators for green finance in existing research. Based on attempts to construct indicators for the green finance system, this article establishes static and dynamic spatial Durbin models to dynamically analyse the impact of green finance on urban haze pollution from the perspective of spatial spillovers. In addition, this article also explores the differences in the impact of green finance on urban haze pollution from the perspective of regional location and resource endowment level. This not only provides a new path for the joint governance of haze pollution between cities but also provides more accurate guidance for the government to formulate policies.
The subsequent sections of this paper are structured as follows: Section 2 provides the theoretical analysis and hypotheses. Section 3 presents the methods, variable selection methods, data sources and descriptive statistics used in this study. The empirical results are analysed in Section 4. In Section 5, the impact of green finance on urban haze pollution is analysed by considering regional variations and differences in resource endowment. Conclusions and policy implications are drawn in Section 6.

2. Theoretical Analysis and Hypotheses

2.1. The Direct Influence of Green Finance on the Haze Pollution Mechanism

As an economic incentive mechanism, green finance policy can not only reduce environmental pollution and promote the improvement of ecological benefits but also provide financial support for the green industry and promote the optimization of industrial structure [36]. As a financial tool, green finance not only meets the financial industry’s requirements for capital allocation but also meets the financial industry’s requirements for economic growth, economic development, employment, and environmental protection. Initially, the allocation of financial resources helps in decreasing haze pollution. Following the adoption of green finance policies, financial institutions show a greater preference for allocating financial resources to projects that promote environmental protection. The environmental protection situation has become an important basis for financial institutions to conduct credit approval and loan disbursement, and energy-saving and environmentally friendly enterprises and projects have lower financing thresholds and credit costs. In contrast, heavily polluting enterprises and projects have greater financing constraints and credit costs [37]. Financial institutions provide differentiated financing to enterprises on the basis of green environmental protection [38]. Furthermore, financial establishments enforce penalizing interest rates and funding restrictions for heavily polluting businesses to curb the unchecked growth of energy-intensive and environmentally harmful enterprises through elevated financing expenses. In the face of high financing costs under green finance policy, enterprises will pay more attention to green production and actively carry out green transformation and upgrading [39]. Resources can flow from “three highs” (high consumption, high emission, and high pollution) production capacity to green production capacity, ultimately reducing haze pollution. Furthermore, the implementation of eco-friendly technology helps decrease haze pollution. Eco-friendly finance offers essential funding for green businesses to conduct technological advancements, thereby enhancing eco-friendly technological innovation [40]. The aim is to decrease the release of haze pollution at its origin. Improvements in green technological innovation also promote environmental protection and green development overall and inhibit urban haze pollution overall. Third, haze pollution is reduced by promoting green consumption. The various green finance-related products launched by financial institutions under the Green Finance Policy have expanded the channels for ordinary residents to allocate green assets, and the assistance of ordinary residents in environmental protection has also been achieved. Moreover, the preferential interest rates and differentiated financing channels implemented by green finance to promote green consumption not only release the intrinsic potential of green consumption but also help to enhance residents’ green consumption concepts and change their consumption preferences [41]. With green consumption improving, the “three highs” industry can become a green industry, promoting changes in the structure of energy consumption and ultimately protecting the ecological environment and reducing urban haze. Therefore, the following hypothesis is proposed in this paper:
Hypothesis 1.
The growth of green finance has a negative effect on urban haze pollution; in other words, the advancement of green finance mitigates the occurrence of urban haze pollution.

2.2. The Spatial Impact of Green Finance on Haze Pollution: Understanding the Mechanism

The analysis above illustrates that the development of green finance suppresses local haze pollution. From the perspective of spatial location, the development of green finance also depends on the interaction of neighbouring regions. Urban haze pollution is dynamic and changing; will green finance have a spatial impact on urban haze pollution? First, green finance affects haze pollution in neighbouring areas by influencing local haze pollution. PM2.5, the primary component of urban haze pollution, affects haze pollution in the air for an extended period due to its minute particle size and high mobility. Due to differences in the concentration of PM2.5, PM2.5 often tends to diffuse from high-concentration areas to low-concentration areas. In addition, coupled with the cross impact of climate and wind direction, the urban haze pollution concentration in high-pollution areas affects surrounding areas. As the haze pollution in a region becomes more severe, the diffusion force to neighbouring regions increases, thereby worsening the haze pollution in those neighbouring regions. Second, green finance affects haze pollution in neighbouring areas by influencing green finance in neighbouring areas. First, financial institutions have more convenient conditions for information exchange, business cooperation, technology, and talent sharing based on their geographical advantages, and they can also share infrastructure to reduce costs. The convenience of a geographic location is conducive to the interaction of green finance in neighbouring regions, and the spatial spillover effect generated by the development of green finance leads to the common development of green finance in a region and neighbouring regions through the “cooperation mechanism”. With the gradual accumulation of green finance resources, the green finance system will gradually improve, and cities with better green finance development will play a leading role as the “head geese”. By means of the ‘trickle-down effect’, the local area’s green finance development mode and infrastructure will extend to surrounding regions, thereby fostering the growth of green finance in adjacent areas. As a result of the “siphon effect”, a mature green finance system in a region will attract talent, technology, and capital from neighbouring regions. The development of a green finance system should be expedited by neighbouring regions for their own progress, thereby promoting the advancement of green finance in neighbouring areas. Therefore, this paper proposes the following hypothesis:
Hypothesis 2.
The spatial spillover effect of green finance on haze pollution means that the growth of green finance affects haze pollution in nearby regions.

2.3. The Diverse Effects of Environmentally Friendly Financing on Air Pollution

Urban haze pollution is generated by a combination of natural and human factors when considering regional influences. First, China possesses an extensive landmass, exhibiting notable variations in geographical locations and topography across its cities. The effect of natural factors on haze pollution varies in each region, and the difficulty of haze pollution control varies. Second, the industrial production of wastewater and gas and other human factors can also cause serious urban haze pollution. Human factors primarily demonstrate the influence of green finance on urban haze. Hence, the impact of urban haze pollution control in highly industrialized eastern and central regions might be more substantial than the impact of pollution caused by natural elements such as the terrain and geography in the western area. From the perspective of resource endowment conditions, resource-based cities with natural resource extraction and processing as the leading industries often face a double resource curse effect involving the economy and the environment [42]. Moreover, resource-based cities have a geographical “lock-in” effect, and as with general manufacturing industries, their leading industries have difficulty promoting the green upgrading of their own industrial structure through direct compression of the industrial scale or industrial transfer [43,44]. The haze reduction effect of green finance may be limited in resource-based cities compared to nonresource-based cities due to their unique characteristics. Therefore, in this paper we propose the following hypotheses:
Hypothesis 3.
The effectiveness of green finance in controlling haze pollution varies across different regions.
Hypothesis 4.
The impact of green finance on haze pollution varies depending on the availability of resources.

3. Methodology

3.1. Elliptical Shape Representing the Standard Deviation

The standard deviational ellipse is a statistical method used to reveal the spatial directional characteristics of economic geographic elements. The aim of this paper is to utilize this approach to depict and investigate the path of the shift and distinct pattern of the focal point of haze pollution and the advancement of green finance throughout the specified duration. The equations are stated as follows:
X ¯ = i = 1 n w i x i i = 1 n w i , Y ¯ = i = 1 n w i y i i = 1 n w i ; S = π σ x σ y
tan θ = i = 1 n w i 2 x i 2 i = 1 n w i 2 y i 2 + i = 1 n w i 2 x i 2 i = 1 n w i 2 y i 2 2 + 4 i = 1 n w i 2 x i y i 2 i = 1 n 2 w i 2 x i y i
σ x = 2 i = 1 n w i x i cos θ w i y i sin θ 2 i = 1 n w i 2 , σ y = 2 i = 1 n w i x i sin θ + w i y i cos θ 2 i = 1 n w i 2
where ( x ¯ , y ¯ ) are the coordinates of the centre of gravity, wi is the weight of city i, x i , y i are the coordinates of the centre of gravity of the city, x ˜ l , y ˜ l represents the difference between x i , y i and the coordinates of the centre of gravity, σ x , σ y are the standard deviations of the major and minor axes of the ellipse, tan θ is the angle of direction of the spatial distribution, and S is the area of the ellipse.

3.2. Benchmark Model

Initially, a preliminary examination was carried out to assess the impact of green finance on pollution control and emission reduction. The construction of a fundamental model is performed in the following manner:
P M it = α 0 + α 1 G F i t + α 2 C V i t + μ i t + υ i t + ε i t
In addition, each sample city is represented by subscript i; time is represented by t; haze pollution is represented by PM; green finance development is represented by GF; a series of control variables that measure the level of economic development, technology investment, population density, human resources, government intervention, and infrastructure are represented by CVs; factors that do not change over time in each city to control for regional fixed effects are denoted by μ; the observed specific time effect independent of the region is denoted by ν; and the error disturbance term is denoted by ε.

3.3. Spatial Econometric Model

Under various coefficient settings, the spatial Durbin model (SDM), a comprehensive model for addressing spatial correlation, can be converted into a spatial autoregressive model (SAR) and a spatial error model (SEM). Furthermore, when conducting panel data analysis, panel models can be classified as fixed-effects (FEs) or random-effects (REs) models based on the presence or absence of correlations between the unobserved individual effects and the error term. The FE model always satisfies the large-sample asymptotic consistency condition, regardless of whether the individual effects are correlated with the error term. To put it differently, the FE model is fitting. In summary, the fixed-effect SDM is better suited for the investigation conducted in this study. Therefore, the SDM was constructed in this paper, as shown in Formula (5):
P M it = α + τ P M i , t 1 + ρ W i j   P M j t + δ W i j   P M j , t 1 + β 1 G F i t + β 2 W i j G F j t + θ X i t + γ W i j   X j t + μ i + ϑ t + ε i t
The equation includes PMit, which represents the urban haze pollution index of city i in period t; PMi,t−1, which represents the urban haze pollution index with a one-period lag; GFit, which represents the green finance index of city i in period t; and Xit, which represents the set of control variables. The intercept term is denoted by, the coefficient for the time lag term is denoted by, the spatial lag term coefficients for each variable are denoted by, the coefficient for the time lag term is denoted by β1 and θ, the coefficients for each variable are denoted by μi, the spatial effect is denoted byμi, the temporal effect is denoted by ϑt, the error term is denoted by εit, and the spatial weight matrix is denoted by Wij. The foundation of this research is the spatial weight matrix that is nested both economically and geographically.

3.4. Spatial Autocorrelation

To analyse the spatial clustering of haze pollution and green finance in Chinese cities, Moran’s I (6) is utilized. The corresponding formulas are as follows:
I = i = 1 n j = 1 n w i j ( x i x ¯ ) ( x j x ¯ ) S 2 i = 1 n j = 1 n w i j
The haze pollution indices of city i and city j are denoted by xi and xj, respectively, in a sample of n areas. The sample variance is represented by S2, and the spatial weight matrix for geographic distance is wij. Moran’s I is in the range of [−1, 1]. A positive correlation in global space is indicated by an index greater than 0, while a negative correlation is indicated by an index less than 0. A random distribution is indicated by an index infinitely close to 0.

3.5. Spatial Weight Matrix

To test the reliability of the results, the spatial econometric model utilizes a binary spatial adjacency matrix along with the inverse distance matrix and the economic distance matrix.
Spatial adjacency matrix:
W i j = 1 , r e g i o n   i   i s   a d j a c e n t   t o   r e g i o n   j 0 , r e g i o n   i   i s   n o t   a d j a c e n t   t o   r e g i o n   j
Inverse distance matrix:
W i j = 1 d i j , r e g i o n   i   i s   a d j a c e n t   t o   r e g i o n   j 0 , r e g i o n   i   i s   n o t   a d j a c e n t   t o   r e g i o n   j   o r   i = j
Matrix nested within an economic and geographic context:
W i j = 1 G D P i G D P j , i j 0 , i = j
The distance between the centroids of cities i and j is represented by dij in the inverse distance matrix. In the economically and geographically nested matrix, GDPi and GDPj are the mean values of GDP for cities i and j in the sample period, respectively.

3.6. Variable Selection

3.6.1. Dependent Variables

Haze pollution (PM), also known as PM2.5, refers to the presence of particulate matter 2.5 microns or less in size that is suspended in the atmosphere and is primarily responsible for the occurrence of haze. PM2.5 is mainly derived from first the direct emission of atmospheric pollutants, such as wastewater and gas discharged from the production of heavy pollutants, energy combustion and other pollutant emissions; second, fine particulate matter is generated from nitrogen oxides, sulphides and other volatile substances that remain in the atmosphere. The haze pollution data utilized in this study were derived from measurements conducted by the Atmospheric Composition Analysis Group, which assesses the worldwide PM2.5 concentration at the Earth’s surface. Raster data are used as the source data in this study, where the data are matched with information on prefecture-level cities in China; this enables the acquisition of annual average haze data for 283 cities in China spanning from 2011 to 2020. In the robustness test, sulphur dioxide (SO2) and nitrogen dioxide (NO2) emissions are used.

3.6.2. Factors That Are Not Influenced by Other Variables

Green Finance (GF): Currently, there is no standardized assessment of green finance. In accordance with the “Guiding Opinions on the Construction of a Green Finance System”, a green finance evaluation system was developed in this paper. Table 1 displays the categorization of green finance into seven indicators. By utilizing the entropy weight technique, the weights of the seven green finance indicators were determined, enabling the calculation of the comprehensive green finance index for 283 Chinese cities spanning from 2011 to 2020.

3.6.3. Control Variables

Level of economic development (Pgdp): Haze pollution is significantly influenced by the level of economic development. The level of economic development is measured by the per capita gross domestic product of every city.
Investment in science and technology (It): Progress in science and technology (S&T) is conducive to improving the efficiency of resource utilization and realizing industrial transformation and upgrading, thus reducing the emission of haze pollution. To gauge the extent of science and technology, the ratio of scientific and technological expenses to the overall budgetary expenses of every city is employed.
Population density (Pd): Urban haze pollution is related to the population density of the city in which it is located; the denser the population is, the greater the potential for pollution. The population density is calculated by dividing the number of individuals at the end of the year by the total land area of the city.
Level of government intervention (Gov): Government intervention plays a role in supporting environmental protection at the macropolicy level, which in turn affects urban haze pollution. Measuring the extent of government intervention involves using the proportion of overall budget spending to regional GDP.
Level of human capital (Hum): Enhancing the level of human capital promotes the growth of enterprises’ total factor productivity, leading to a decrease in pollution emissions. To gauge the extent of human resources, one can assess the ratio of individuals enrolled in tertiary education institutions, including both undergraduate and junior colleges, to the total population after the year.
Greening level (Gl): The greening level of cities is represented by the per capita garden area and green coverage rate of built-up areas, accounting for the positive impact of forest resources on air purification. The specific variable definitions are listed in Table 2.

3.7. Data Sources and Descriptive Statistics

The information regarding haze pollution in the selected urban areas is sourced from the Atmospheric Composition Analysis Group, along with global measurements of PM2.5 concentrations at ground level. The source data are raster data. By matching the source data with data on China’s prefecture-level cities, the average annual haze data for 283 cities in China from 2011 to 2020 were obtained in this paper. The green finance data were sourced from various publications, including the statistical yearbook of each city, the China Environmental Yearbook, the China Insurance Yearbook, and the EPS database. Additional data on control variables were obtained from the statistical yearbooks of China as well as from each city. This paper matches the data provided above using city-time information. Interpolation was used to fill in some of the missing values. However, the Tibet Autonomous Region, which has significant missing data, was excluded from the analysis. This article conducts research on panel data of the aforementioned variables and applies logarithmic processing to some variables to eliminate the influence of heteroscedasticity. Table 3 displays the statistical analysis for every variable.

4. Results and Discussion

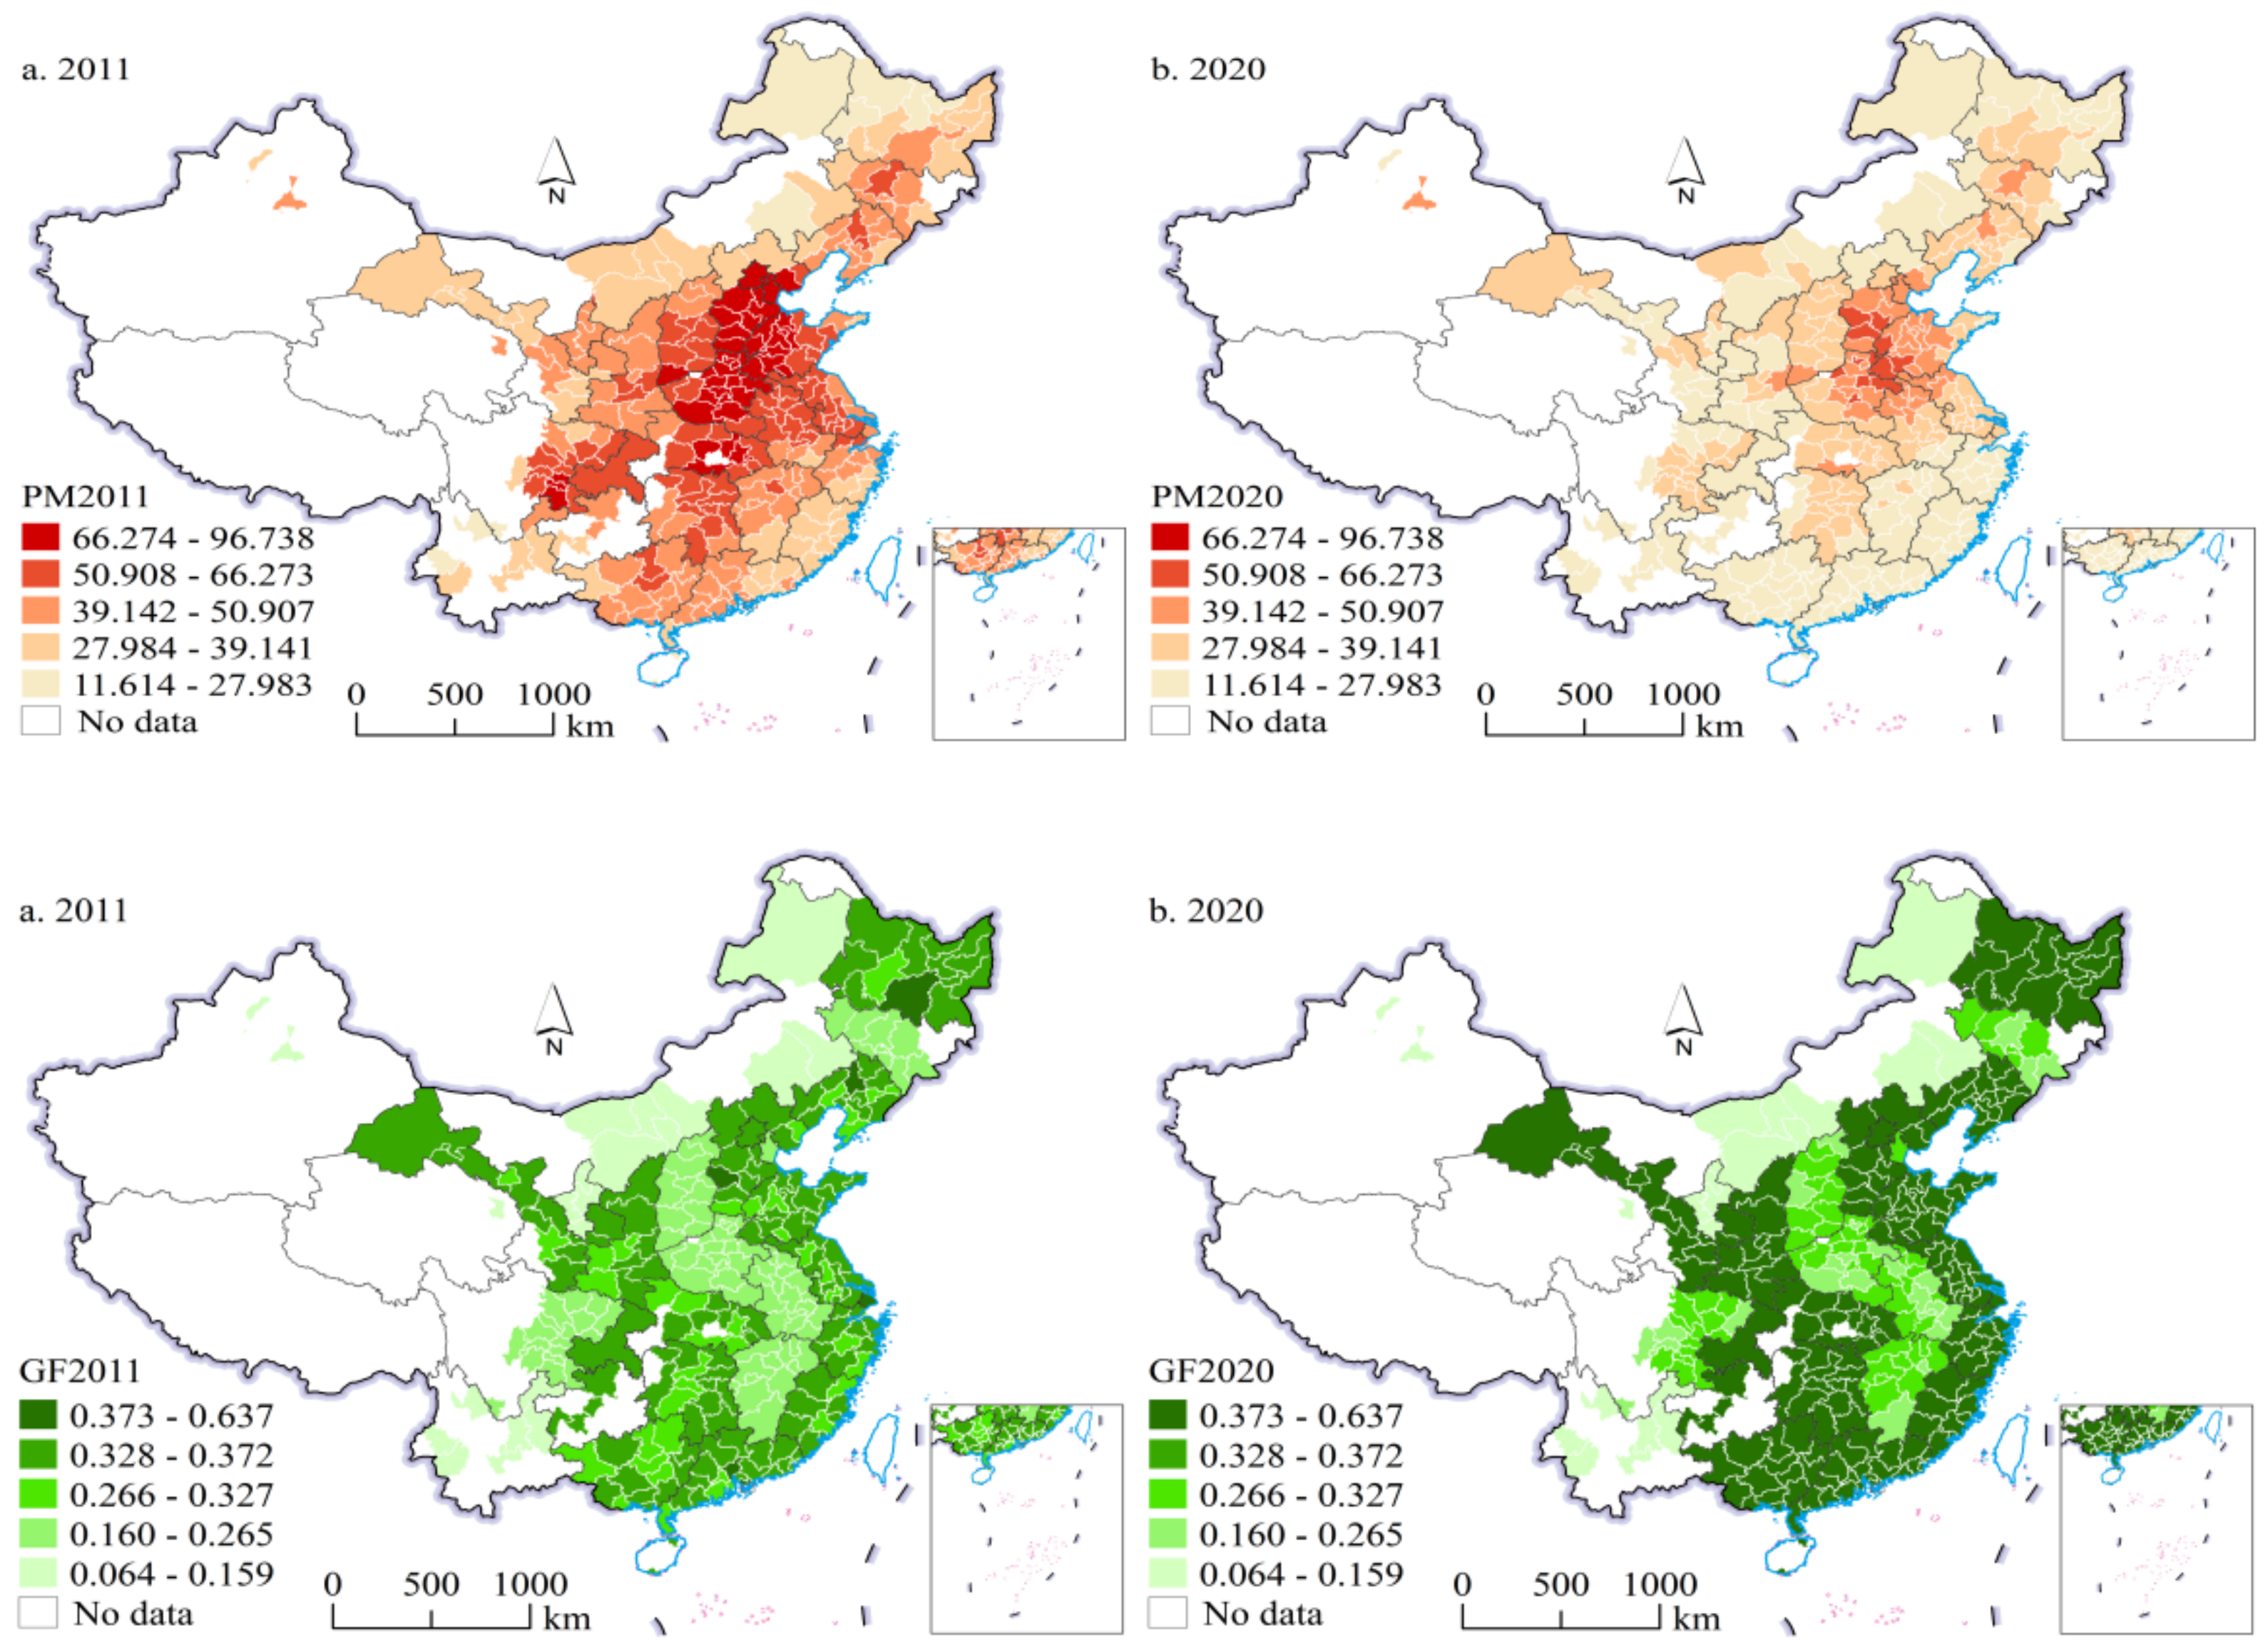
4.1. The Development of Urban Haze Pollution and Green Finance over Time and Space

To depict the variations in regional air pollution and the progress of environmentally friendly financial practices, in this study, ArcGIS software was employed to create a visual representation of urban haze pollution and the extent of green finance in the years 2011 and 2020 (Figure 1). According to Figure 1, the urban haze pollution index increased in 2011, with a concentration of highly polluted cities in the Beijing–Tianjin–Hebei region and certain cities in the central area of the nation. Moreover, the overall haze pollution trended from areas where this pollution was concentrated in the middle to surrounding areas. From 2011 to 2020, the implementation of diverse environmental conservation measures and eco-friendly regulations led to a substantial reduction in haze pollution across multiple cities, with only a handful of cities in the central area experiencing severe haze pollution. According to Figure 1, in 2011, the majority of cities had a green finance level less than 0.373, while only a few cities, including Beijing, Tianjin, and cities in the Yangtze River Delta, exhibited a higher level of green finance. Moreover, green finance development in the eastern seaboard was comparatively superior because China was in the early phase of investigating green finance development. The policy framework and range of available green finance products were still incomplete, and only a few economically advanced cities made slight progress. Since that time, the policy framework for environmentally friendly finance has been consistently enhanced, leading to the gradual establishment of a green finance hub along the coast in 2020. This hub encompasses Beijing, Tianjin, the Yangtze River Delta, and the Pearl River Delta as its central regions. The level of green finance in some cities in the western region was also relatively high, and some cities in the central and northeastern parts of the country were the main distribution areas with low green finance values. During the sample period, the level of green finance showed a dynamic increase from a low to a high level.

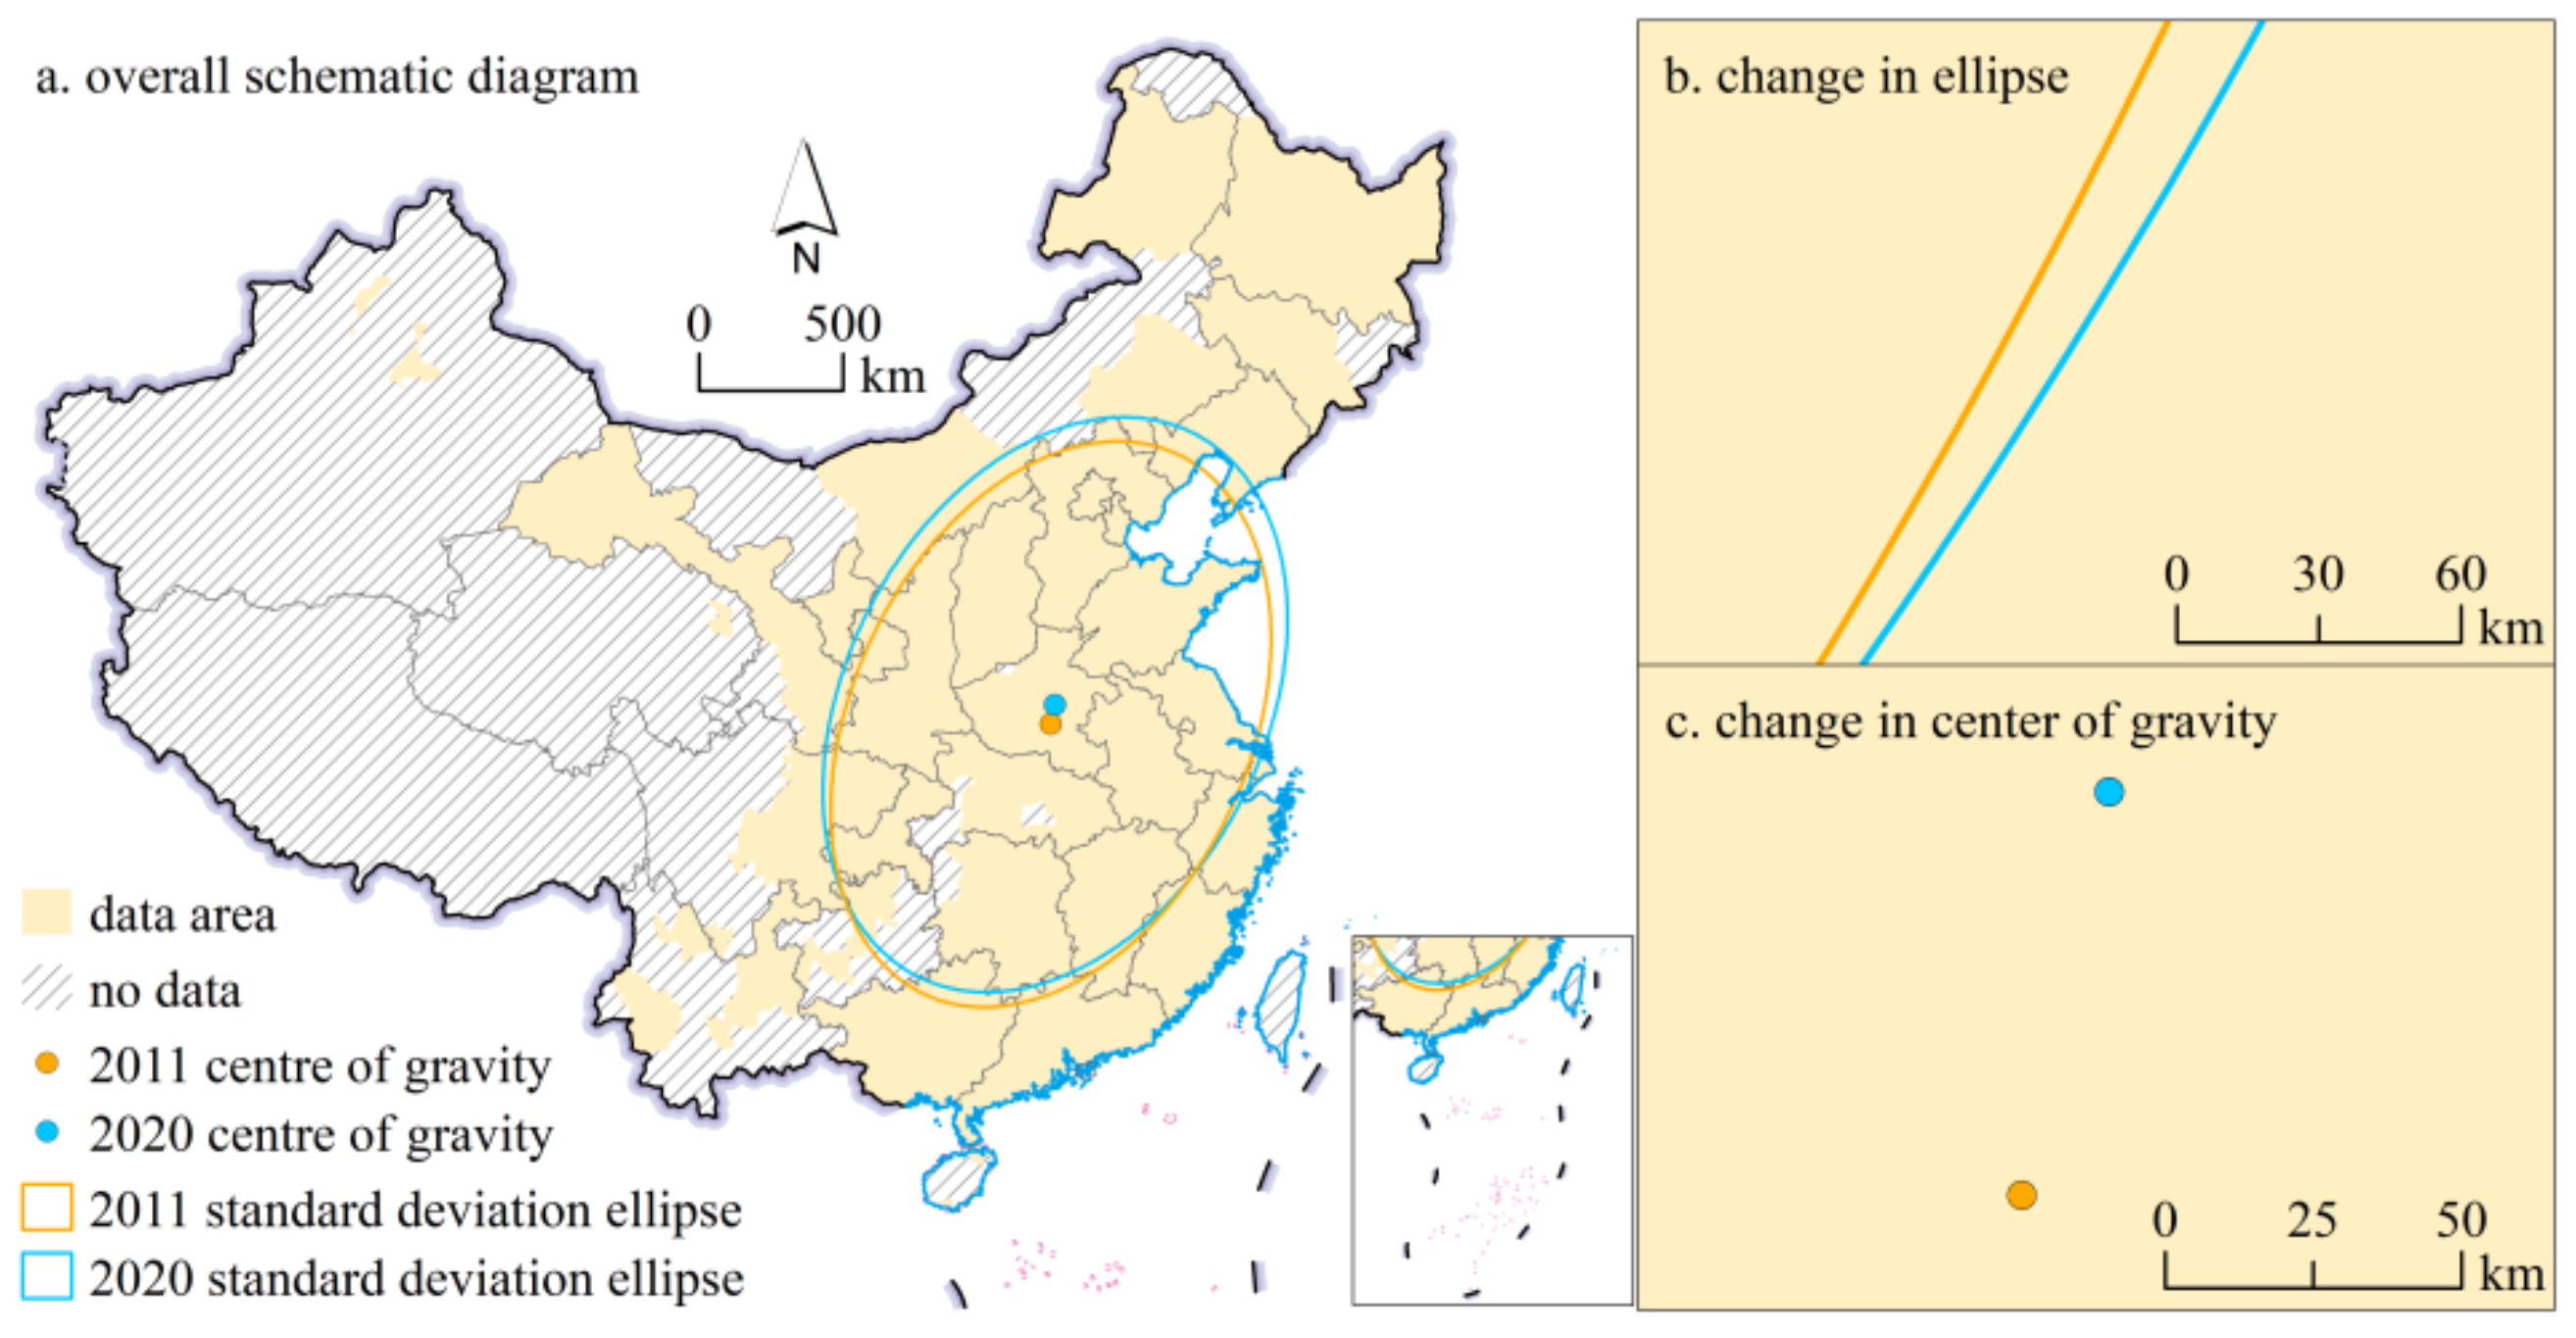
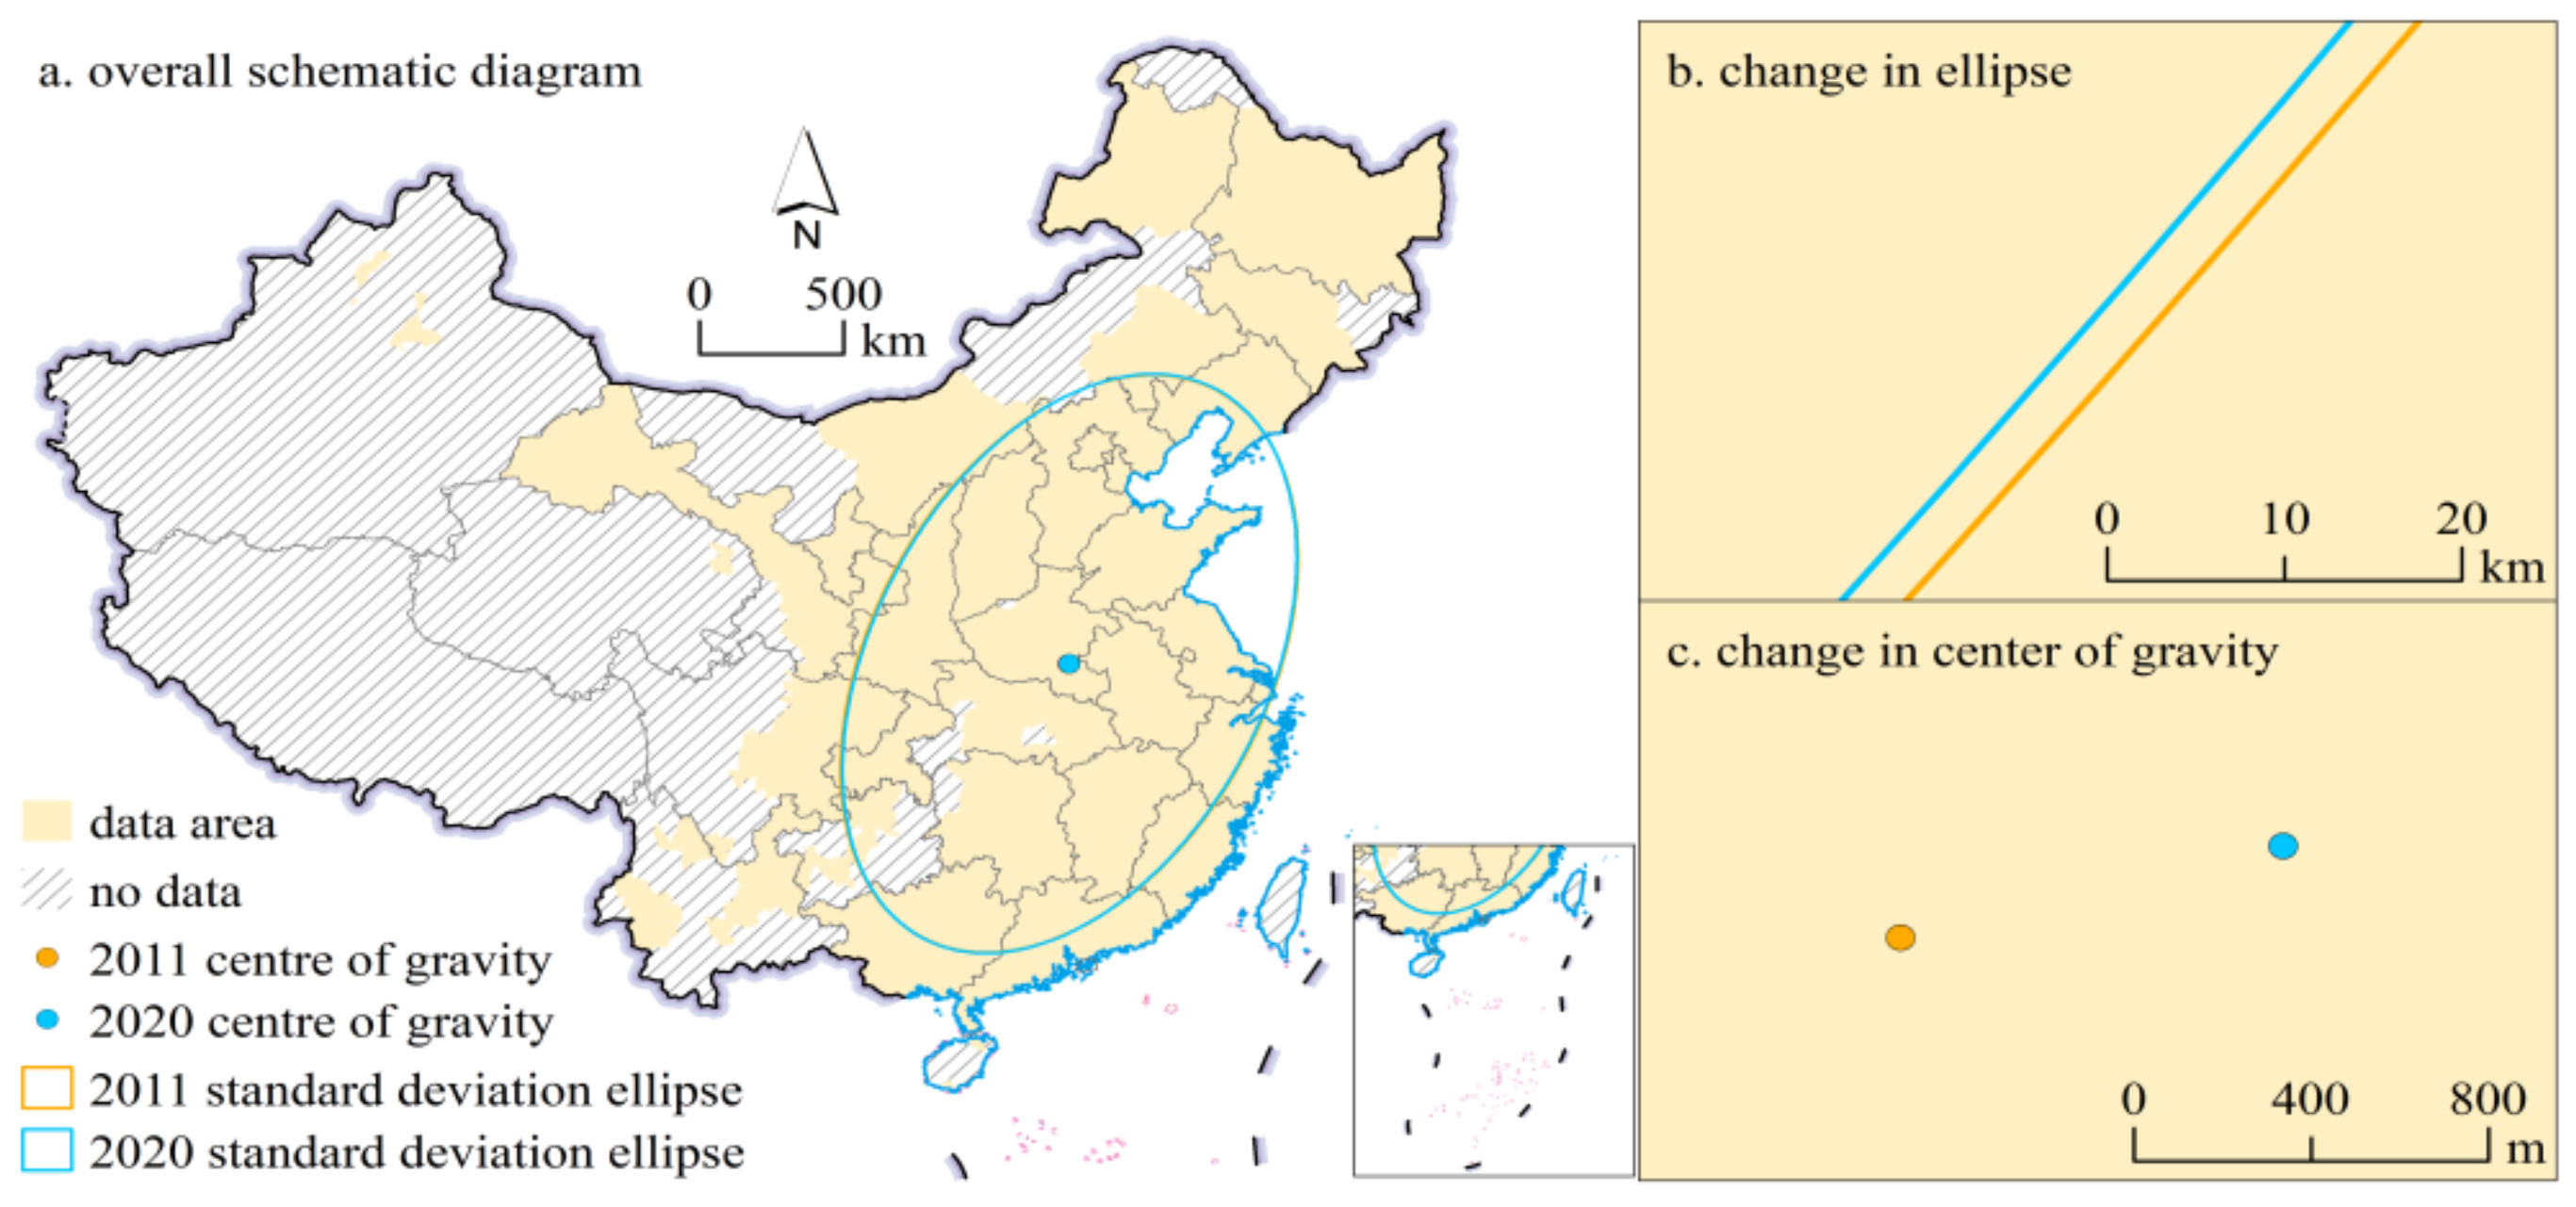
4.2. Migration of the Centre of Gravity and Discrete Trends in Urban Haze Pollution and Green Finance

The position of the centre of mass can indicate the spatial arrangement of urban haze pollution hotspots and areas with high values in green finance, whereas the standard deviational ellipse can illustrate the spatial scattering of haze pollution and green finance. The analysis of the movement and distinct patterns in the urban haze pollution and green finance centres of gravity from 2011 to 2020 was conducted using ArcGIS10.8 software (Figure 2 and Figure 3).
From 2011 to 2020, the centre of gravity of haze pollution moved from 113.919° E, 33.245° N to 114.142° E, 33.843° N and shifted approximately 69.651 km to the northeast, indicating a trend of expansion of haze pollution source areas from the central region to the northeast region. The central region primarily focuses on industries that rely on resources, and the green development system is still incomplete. The inefficient development of high-energy-consuming enterprises has exacerbated haze pollution. From the perspective of the elliptical parameters, from 2011 to 2020, the ranges of change in the major and minor half axes of the ellipse were 1039–1061 km and 693–729 km, respectively, and the ranges of change in the rotation angle ranged from 25° to 27°. The changes in various parameters were relatively small, and the spatial pattern of haze pollution was basically stable, with little change in the hotspots of haze pollution. Compared to that in 2011, the elliptical oblateness in 2020 was greater, indicating that the spatial distribution of urban haze pollution in 2020 was more convergent in the north–south direction, with an east–west dominant spatial distribution.
The change range of the centre of gravity of green finance from 2011 to 2020 was 114.534° E, 32.859° N–114.543° E, and 32.861° N, with a slight shift to the northeast but a very small amplitude. This finding indicates that the spatial pattern of green finance development in China was relatively stable. From the perspective of the ellipse parameters, the ranges of change in the major and minor half axes of the ellipse were 1180–1180 km and 703–697 km, respectively, and the ranges of change in the rotation angle ranged from 23° to 22°. In 2020, the long semiaxis remained the same, while the short semiaxis and the area of the ellipse decreased compared to those in 2011. This finding suggests that the spatial pattern of China’s green finance development exhibited greater stability during 2020. In 2020, China’s green finance development exhibited increased spatial clustering, with the predominant spatial distribution oriented along the north–south axis.

4.3. Baseline Effect Analysis

Table 4 displays the regression results for assessing the impact of green finance on urban haze pollution using the baseline model (2) in the initial test. According to the data presented in column (1) of Table 4, the regression coefficient for the impact of green finance on urban haze pollution is −0.967, which is statistically significant at the 1% level. This finding suggests that the development of green finance plays a role in mitigating urban haze pollution, even without the inclusion of control variables. When control variables are added one by one in columns (2)–(7), the regression coefficient for the impact of green finance on urban haze pollution consistently shows a negative and statistically significant effect at the 1% level. This finding suggests that the development of green finance significantly inhibits urban haze pollution; this could be attributed to the endorsement of green finance policies, which not only support the growth of environmental protection businesses by providing financial resources, broaden avenues for external funding, accelerate green technological advancements, and corporate green conversion but also curb haze pollution emissions by promoting eco-friendly consumption. The regression results for the benchmark demonstrate that green finance effectively reduces urban haze pollution, thereby confirming the first hypothesis proposed in this study.

4.4. Spatial Effect Analysis

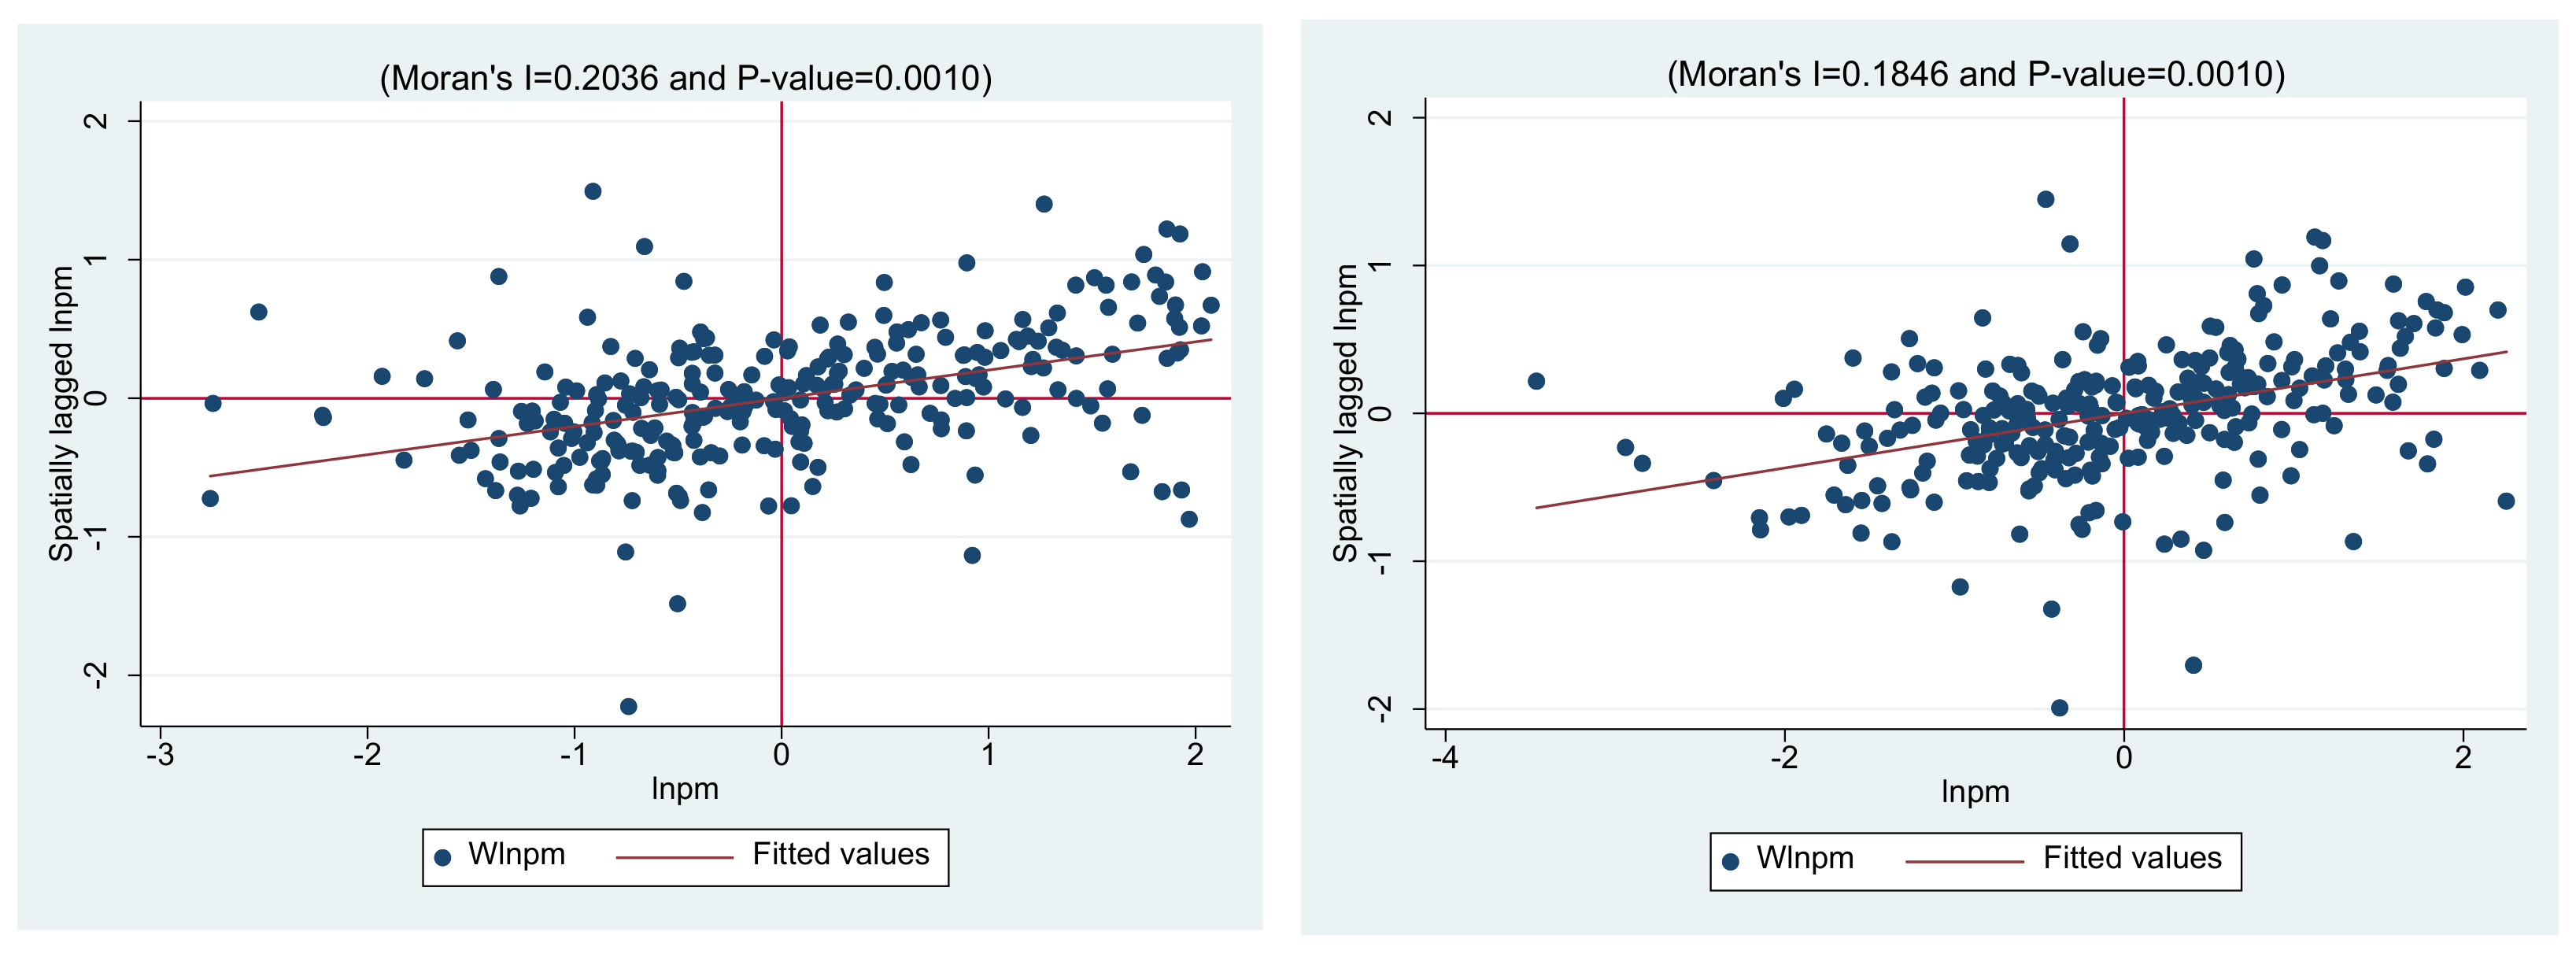
4.4.1. Spatial Autocorrelation Test

Prior to conducting a spatial modelling analysis, it is necessary to perform a spatial autocorrelation test to determine if there is spatial correlation among the variables. Using Stata 15 software, the Chinese urban haze pollution index and green finance index were subjected to the global Moran’s I test based on the nested spatial weight matrix that considers economic and geographical factors. Table 5 displays the findings. During the period of investigation, there was a noticeable positive spatial correlation between urban haze pollution and the green finance indicator Moran’s I in China, as both values exceeded zero. Furthermore, the Moran’s I for haze pollution demonstrated a general upward pattern, suggesting a notable spatial correlation of urban smog in China, which is progressively intensifying.
Through the use of a spatial weight matrix that is nested both economically and geographically, this study delved deeper into examining the spatial clustering features of urban haze pollution; this was accomplished by analysing a scatter plot of local Moran’s I. In this paper, the data on urban haze pollution in 2011 and 2020 were used to construct Moran’s I scatter plots of urban haze pollution via Stata 15 software, as shown in Figure 4. The standardized PM represents the horizontal axis of the scatter plot, and the spatial lagged value of PM represents the vertical axis of the scatter plot. In 2011 (left panel), the first quadrant contained haze concentrations in 89 cities, and the third quadrant contained haze concentrations in 118 cities, accounting for 31.45% and 41% of the total samples, respectively. In 2020 (right panel), the first quadrant contained haze concentrations in 134 cities, and the third quadrant contained haze concentrations in 95 cities, accounting for 47.35% and 33.57% of the total samples. The findings indicate that the levels of haze in the majority of Chinese cities are situated in the first and third quadrants. Haze pollution is distinguished by the clustering of high concentrations and low concentrations, revealing a notable spatial correlation. Therefore, it is imperative to delve deeper into the spatial impact of green finance on haze pollution through the establishment of a spatial econometric model.

4.4.2. Analysis of the Empirical Results of the Spatial Durbin Model

After the spatial correlation test, we needed to identify the spatial measurement model. From the test results in Table 6, the LM test shows the existence of spatial effects, and the selected samples can be estimated using spatial econometric models. The LR test and Wald test showed that the spatial Dubin model was superior to the spatial lag model and the spatial error model, and the Hausman test was used to determine whether the spatial Dubin model should choose a fixed effect or a random effect; the spatial Dubin model chose the fixed-effects model.
In the economically and geographically nested spatial weight matrix, the static SDM represents the spatial effects and spatial spillovers of green finance on haze pollution, which are listed in Table 7. Regarding the independent variables, the negative coefficient of green finance suggests a significant adverse impact on urban haze pollution. Consequently, the development of green finance can effectively curb urban haze pollution, and Hypothesis l is verified. The spatial term coefficient of green finance is highly significant, suggesting that there exists a spatial impact of green finance on urban haze pollution. Hence, there is not only an endogenous time lag effect and spatial interaction effect of urban haze pollution but also an exogenous spatial interaction effect of green finance. Upon breaking down the impact, it is evident that the regression coefficients for the direct effect, spillover effect, and overall effect on urban haze pollution are −0.0264, −0.259, and −0.285, respectively. These coefficients are statistically significant at the 5%, 1%, and 1% levels, respectively. The results suggest that green finance plays a significant role in reducing urban haze pollution. Furthermore, this reduction has a spillover effect in terms of spatial impact, thus providing preliminary evidence for Hypothesis 2. The magnitude of the indirect effect coefficient is significantly greater than that of the direct effect coefficient, indicating that the total effect primarily stems from the indirect effect. This finding suggests that, in the context of the static SDM, the spatial spillover effect of green finance from neighbouring regions is more significant than the spatial spillover effect within a region. Additionally, the primary reason for green finance’s ability to reduce haze pollution is its indirect impact; this could be attributed to the fact that the advancement of regional eco-friendly financing can impede the occurrence of haze pollution in a specific area by enhancing ecological conservation and promoting sustainable growth. Consequently, this effect can extend to adjacent regions and generate spatial spillover effects that restrain haze pollution in neighbouring urban areas. Furthermore, the progress of eco-friendly finance in a particular area can indirectly impede haze pollution in adjacent areas by means of the transfer of monetary assets and resource sharing to stimulate the advancement of eco-friendly finance in nearby regions. Furthermore, the two pathways overlap, surpassing the direct impact of green finance on urban haze pollution and confirming Hypothesis 2.
Table 8 displays the establishment of a dynamic spatial panel model incorporating the first-order lag term of urban haze pollution to account for the temporal inertia of haze pollution. Even with the inclusion of the initial lag variable for urban haze pollution, the spatial correlation among the predictor variables remains statistically significant; nevertheless, each of them exhibits a notably favourable spatial correlation in terms of immediate impact, contradicting the spatial correlation estimation in the static model. The findings suggest that relying solely on a stationary panel for assessing the spatial correlation of urban haze pollution is inadequate. The inclusion of the first-order lag term of the independent variable reveals a significant spatial correlation, suggesting that haze pollution is dynamic and continuous. The fixed model might not completely depict the real scenario, implying the need to create a model that is adaptable.
Table 8 displays the regression results for the dynamic SDM in columns (1)–(2). The spatial lag term coefficient of urban haze pollution shows a significant positive correlation from a spatial standpoint, suggesting that the spatial spillover effect of urban haze pollution becomes more pronounced as geographic distance decreases. Additionally, this discovery confirms the outcomes of the worldwide spatial correlation examination. From the temporal perspective, the time lag coefficient of urban haze pollution is significantly positive, which indicates that there is temporal inertia in urban haze pollution that manifests itself as a snowball effect over time. By utilizing partial differentiation, the dynamic SDM breaks down the spatial impact of green finance on urban haze pollution into three components: a direct effect, a spatial spillover effect, and a total effect. The dynamic SDM divides the influence of green finance on urban haze pollution into long-term and short-term effects over time by incorporating the first-order lag term of urban haze pollution. According to the data in columns (3)–(8) of Table 8, green finance has a highly significant negative impact on urban haze pollution from a long-term standpoint. This negative impact, primarily driven by the spatial spillover effect, shows that the inhibition of haze pollution in a city by green finance is mainly due to the spillover effect of the development of green finance in the surrounding areas, and further confirms the substantial influence of green finance development on reducing urban haze pollution. In the short run, green finance has a positive impact on haze pollution, primarily due to the spatial spillover effect. That is, green finance in a region promotes haze pollution in neighbouring regions in the short term. Over time, the positive spatial spillover effect of green finance diminishes as the total effect coefficient undergoes dynamic change, transforming from a short-term positive effect to a long-term negative effect. This shows that the spatial spillover effect of green finance on urban haze pollution is time-dependent, and only by taking the development of green finance as a long-term strategy can it restrain urban haze pollution in the long term. This observation further supports the validation of Hypothesis 2.

4.5. Robustness and Endogeneity Tests

To guarantee the dependability of the empirical findings, additional tests were performed to assess robustness.
(1)
Replacing the dependent variable: In the benchmark regression, the dependent variable, urban haze pollution, was replaced with urban sulphur dioxide (SO2) emissions or nitrogen dioxide (NO2) emissions for the robustness test. As shown in columns 1 and 2 of Table 9, the robustness test outcomes align with the previous benchmark regression, affirming the reliability of the benchmark regression findings.
(2)
Replacing the test method: The test method replacement results in a time-dependent superposition phenomenon of urban haze pollution, where the pollution in the previous period impacts the pollution in the subsequent period. Hence, in this paper, the benchmark model was examined using the OLS and the system generalized method of moments (GMM) estimation. As shown in column 3 and 4 of Table 9, the findings indicate that green finance exerts a substantial adverse influence on urban haze pollution, thereby confirming the resilience of the benchmark regression outcomes.
(3)
Replacing the spatial weight matrix: By substituting the spatial weight matrix with the spatial adjacency matrix and inverse distance matrix in the spatial model, it is found that green finance has a negative spatial impact. As shown in columns 5 and 6 of Table 9, the robustness test confirms the consistency of the spatial model regression results from the previous section, validating their reliability.
(4)
In general, the lagged one-period explanatory variable is related to the current period explanatory variable, but the unobservable variable is not related to the current perturbation term, therefore, the lagged one-period explanatory variable has the conditions to become a tool variable. In order to avoid the possible endogenous problems, this study selected the green finance lag data to test the spatial Dubin model, and then took the lag variable as the instrumental variable, a two-stage least squares (2SLS) was used for the test and the results are shown in column 7 of Table 9. The results show that the coefficient sign is negative and consistent with the previous study, indicating that green finance can indeed suppress urban smog pollution.
Table 9. Robustness test results.
(1)(2)(3)(4)(5)(6)(7)
SO2NO2OLSSystematic GMMSpatial Adjacency MatrixInverse Geography Matrix2SLS
GF−0.417 ***
(0.0397)
−0.104 **
(0.0275)
−1.712 ***
(0.2697)
−1.034 ***
(0.2147)
−0.176 **
(0.0187)
−0.367 ***
(0.0631)
−0.104 **
(0.0275)
R20.8740.2410.8120.7860.3290.7040.241
Control variableYESYESYESYESYESYESYES
Individual fixationYESYESYESYESYESYESYES
Time fixationYESYESYESYESYESYESYES
LM 154.318 ***
Wald F 481.023 **
Observations2830283028302830283028302830
Note: Robust standard errors are indicated by parentheses, while *, **, and *** represent significance at the 10%, 5%, and 1% levels, respectively.

5. Heterogeneity Analysis

5.1. Analysis of Variations in Different Regions

The findings of this study indicate distinct variations in the concentration of haze pollution across different regions of China through localized spatial examination. Consequently, the selected urban areas were classified into three groups, namely, eastern, central, and western, according to their geographical distribution. Moreover, the regional variations in the influence of green finance on haze pollution were examined. Table 10 displays the test results indicating that the development of green finance in the eastern region has a spatial effect that ranges from the short-term to the long-term, progresses from promotion to suppression, and continues to have a significant inhibitory impact on haze pollution in the long run. The development of green finance in the central region has the greatest suppressive impact on haze pollution, causing substantial adverse effects in both the short and long run. The advancement of eco-friendly finance in the western region contributes to the occurrence of haze pollution in both the immediate and extended periods. Furthermore, upon comparing the magnitude of the absolute value of each effect coefficient, it becomes evident that the intensity of the impact follows a consistent order (from greatest to smallest) across both long-term and short-term perspectives: the eastern region, the central region, and the western region. The reduction in haze caused by the development of green finance in the eastern and central regions is more significant than that caused by green finance development in the other regions, providing further evidence for Hypothesis 3. In other words, the impact of green finance on urban haze pollution varies across regions.
These results may be attributed to the gradual decline in green finance development in China, which moved from the southeast coast toward the interior region. The level of economic development is greater in the eastern and central regions, which have superior infrastructure, supportive policies, and integrity in the industrial chain. Furthermore, the progress of eco-friendly finance relies heavily on the extent of local financial advancement. The eastern and central regions have relatively developed green finance markets; therefore, the development of green finance has a more significant inhibitory effect on haze pollution. The western area experiences significant financial exclusion and has a delicate ecological environment, which leads to the delayed release of the adverse spatial spillover impact of green finance on haze pollution. Nevertheless, as green finance continues to spread and permeate throughout the western area, it will gradually start to curb haze pollution in nearby regions.

5.2. Analysis of Resource Endowment Heterogeneity

The preceding section revealed that the occurrence of haze pollution is intricately linked to the energy usage and resource allocation of urban areas; hence, the impact of eco-friendly financing on haze pollution might also vary. Based on the National Sustainable Development Plan for Resource-based Cities (2013–2020), the 156 cities included in the study were divided into resource-based and nonresource-based cities. Table 10 indicates that the progress of green finance in nonresource-based cities has a significant influence on haze pollution, and over time, it will increasingly hinder haze pollution. This impact primarily stems from the spatial spillover effect of nearby areas, providing further evidence for Hypothesis 3. The presence of green finance has an effect on urban haze pollution because of the diversity in resource allocations. The majority of cities in the eastern part of China are cities that do not rely on natural resources, and the test findings align with the spatial impact of transitioning from growth to suppression in the eastern region. The reason for this could be that the growth of cities that do not rely on resource consumption is not as reliant on high-energy resources. Additionally, these cities have a stronger foundation for green, low-carbon development, and the impact of green finance on reducing pollution and emissions is more pronounced. In the short term, the growth of eco-friendly finance in resource-dependent cities helps reduce haze pollution. However, as time passes, the positive impact on nearby areas diminishes, and in the long term, the expansion of eco-friendly finance in resource-dependent cities can worsen haze pollution. The presence of abundant resources in resource-based cities may contribute to the reliance on green finance for development. However, the phenomenon known as the “resource curse” diminishes the ability of green finance to effectively reduce haze pollution, thereby hindering the potential benefits of green finance development.

6. Conclusions and Recommendations

In this work, an index system was constructed to measure the green finance indices of 283 prefecture-level cities from 2011 to 2020. The analysis focused on spatial and temporal changes, the movement of the centre of mass, and the distinct patterns of urban air pollution and environmentally friendly financing. By constructing static and dynamic SDMs, the spatial impact of green finance on urban haze pollution was empirically examined. Regional heterogeneity and resource endowment heterogeneity were further studied for comparative analysis. The key findings of this study can be summarized as follows: (1) Haze pollution in urban areas of China has significantly decreased, with the general trend of urban haze pollution spreading from central haze pollution hubs to neighbouring regions, and the primary emission hotspot has relocated to the northwest. (2) The progress of green finance development has greatly increased, with an eastern > western > central gradient distribution, and it has exhibited a greater spatial distribution concentration. (3) Green finance has a significant negative effect on urban haze pollution, including negative direct and spatial spillover effects, and this negative inhibitory effect weakens over time. (4) According to the analysis of diversity, the impact of green finance on urban haze pollution is more pronounced in the eastern and central regions than in the underdeveloped areas in the western region. Green finance progress in cities not reliant on natural resources has a more significant influence on the occurrence of urban haze pollution. Over time, there is a spatial phenomenon known as the “promotion to inhibition” effect, which is observed from the short term to the long term. Conversely, resource-based cities exhibit the opposite impact. The above research forms the basis for the policy recommendations presented in this paper.
First, the spatial spillover effect of green finance on urban haze pollution is time-dependent, and it is imperative for authorities to insist on the development of green finance as a long-term strategy. Studies have demonstrated that green finance has a restraining impact on urban haze pollution in the eastern and central parts of China, while it does not have the same effect on the western region. For this reason, localities should implement the “coordination and green” development concept, actively develop green finance, and comply with existing environmental regulations. Increasing the proportion of interest rate reductions and loan subsidies in green finance can enhance the effectiveness of such financing. Additionally, integrating green finance practices with environmental regulations is crucial. Violations of environmental regulations should be curbed and penalized by considering investment and financing levels. Implementing these recommendations will contribute to the synergistic effects of green finance and urban haze pollution and enhance the environmental governance level of green finance.
Second, the government should establish an urban spatial linkage mechanism for the efficient allocation of green finance resources. Every area must make use of the spatial overflow impact of eco-friendly financing and create a spatial connection mechanism for cities focused on eco-friendly financing. The extent of green finance advancement differs among different cities. Along with cities in the Yangtze River Delta and the Pearl River Delta, metropolitan areas such as Beijing and Tianjin should enhance their spatial spillover impacts. They should distribute their top-notch green finance expertise, technological goods, and other infrastructure and software facilities to nearby areas, thus propelling the growth of green finance in neighbouring regions. Regions that were developing green finance late should also take the initiative to strengthen their business cooperation, information exchange, technology, and talent sharing with neighbouring regions to efficiently allocate green finance resources and reduce urban haze pollution.
Third, for green finance to effectively contribute to reducing haze, it is crucial for the government to enforce distinct green finance measures. The impact of green finance on haze reduction can vary, depending on factors such as the level of economic growth, characteristics of the industrial structure, geographical location, and available resources in different regions. The government should thoroughly consider the unique features of each region, develop and execute eco-friendly financial strategies according to variations, and enforce accurate eco-friendly financial service policies in collaboration with the resource allocation and geographical attributes of diverse cities.
Furthermore, the environmental information disclosure mechanism should be improved, aligning it with advanced international standards. The UK is the first country in the world to enforce climate disclosure, and environmental disclosure is expected to be mandatory for all non-financial sectors by 2025. South Korea has launched a number of online specialized platforms, including an environmental information disclosure system and a green finance information portal, to popularize green finance-related policy knowledge and share environmental information. China should study and formulate standards, contents, and forms of environmental information disclosure in the context of the overall planning and deployment of green development so as to enhance the adequacy and effectiveness of information disclosure, and we will strengthen cooperation with world-class green finance trading platforms and data and information platforms.

Author Contributions

Y.Q.: writing—original draft, software, investigation, resources. Y.T.: methodology, conceptualization, data curation. C.W.: supervision, funding acquisition. All authors commented on previous versions of the manuscript. All authors have read and agreed to the published version of the manuscript.

Funding

This work was supported by Open Foundation of the Research Center for Human Geography of Tibetan Plateau and Its Eastern Slope (Chengdu University of Technology).

Institutional Review Board Statement

Not applicable. No consent was required. Publication consent is not applicable.

Informed Consent Statement

Not applicable.

Data Availability Statement

All data generated or analysed during this study are included in this published article. More detailed data are available from the corresponding author upon reasonable request.

Conflicts of Interest

The authors declare no conflict of interest.

References

  1. Lv, B.; Zhang, B.; Bai, Y. A systematic analysis of PM 2.5 in Beijing and its sources from 2000 to 2012. J. Atmos. Environ. 2016, 124, 98–108. [Google Scholar] [CrossRef]
  2. Zhang, J.; Li, J.; Su, Y.; Chen, C.; Chen, L.; Huang, X.; Wang, F.; Huang, Y.; Wang, G. Interannual evolution of the chemical composition, sources and processes of PM2.5 in Chengdu, China: Insights from observations in four winters. J. Environ. Sci. 2024, 138, 32–45. [Google Scholar] [CrossRef] [PubMed]
  3. Zhang, L.; Hu, X.; Chen, S.; Chen, Y.; Lian, H.-Z. Characterization and source apportionment of oxidative potential of ambient PM2.5 in Nanjing, a megacity of Eastern China. J. Environ. Pollut. Bioavailab. 2023, 35, 2175728. [Google Scholar] [CrossRef]
  4. Jensen, J.; Mohlin, K.; Pittel, K.; Sterner, T. An introduction to the green paradox: The unintended consequences of climate policies. J. Rev. Environ. Econ. Policy 2015, 9, 246–265. [Google Scholar] [CrossRef]
  5. He, L.; Yuan, E.; Yang, K.; Tao, D. Does technology innovation reduce haze pollution? An empirical study based on urban innovation index in China. J. Environ. Sci. Pollut. Res. Int. 2021, 29, 24063–24076. [Google Scholar] [CrossRef] [PubMed]
  6. Li, J.; Li, F.; Li, J. Does new-type urbanization help reduce haze pollution damage? Evidence from China’s county-level panel data. J. Environ. Sci. Pollut. Res. Int. 2022, 29, 47123–47136. [Google Scholar] [CrossRef]
  7. Fan, F.; Cao, D.; Ma, N. Is Improvement of Innovation Efficiency Conducive to Haze Governance? Empirical Evidence from 283 Chinese Cities. Int. J. Environ. Res. Public Health 2020, 17, 6095. [Google Scholar] [CrossRef] [PubMed]
  8. Yanbo, L.; Mingshun, G. The impact of FDI on haze pollution: “Pollution paradise” or “pollution halo?”-Spatial analysis of PM2.5 concentration raster data in 283 cities. Front. Environ. Sci. 2023, 11, 33178. [Google Scholar] [CrossRef]
  9. Wang, C.; Qiao, G.; Ahmad, M.; Ahmed, Z. The Role of the Government in Green Finance, Foreign Direct Investment, Technological Innovation, and Industrial Structure Upgrading: Evidence from China. Sustainability 2023, 15, 14069. [Google Scholar] [CrossRef]
  10. Fang, Y.; Shao, Z. How does green finance affect cleaner industrial production and end-of-pipe treatment performance? Evidence from China. Environ. Sci. Pollut. Res. 2023, 30, 33485–33503. [Google Scholar] [CrossRef]
  11. Xiang, W.; Qi, Q.; Gan, L. Non-linear effects of green finance on air quality in China: New evidence from a panel threshold model. Front. Ecol. Evol. 2023, 11, 1162137. [Google Scholar] [CrossRef]
  12. Liu, X. Effects of urban density and city size on haze pollution in China: Spatial regression analysis based on 253 prefecture-level Cities PM2.5 data. Discret. Dyn. Nat. Soc. 2019, 17, 6754704. [Google Scholar] [CrossRef]
  13. Yang, J.; Song, D.; Fang, D.L.; Wu, F. Drivers of consumption-based PM2.5 emission of Beijing: A structural decomposition analysis. J. Clean. Prod. 2019, 219, 734–742. [Google Scholar] [CrossRef]
  14. Shi, K.; Wu, Y.Z.; Li, L.Y. Quantifying and evaluating the effect of urban expansion on the fine particulate matter (PM2.5) emissions from fossil fuel combustion in China. Ecol. Indic. 2021, 125, 107541. [Google Scholar] [CrossRef]
  15. Wang, R.; Feng, Y.J.; Tong, X.H.; Zhao, J.; Zhai, S. Impacts of spatial scale on the delineation of spatiotemporal urban expansion. Ecol. Indic. 2021, 129, 107896. [Google Scholar] [CrossRef]
  16. Luo, Y.S.; Salman, M.; Lu, Z. Heterogeneous impacts of environmental regulations and foreign direct investment on green innovation across different regions in China. Sci. Total Environ. 2021, 759, 143744. [Google Scholar] [CrossRef] [PubMed]
  17. Peng, X. Strategic interaction of environmental regulation and green productivity growth in China: Green innovation or pollution refuge? Sci. Total Environ. 2020, 732, 139200. [Google Scholar] [CrossRef] [PubMed]
  18. Lin, Y.M.; Li, M.L.; Lin, R.F. Can urban rail transit reduce haze pollution? A spatial difference-in-differences approach. Environ. Sci. Pollut. Res. 2022, 29, 81430–81440. [Google Scholar] [CrossRef]
  19. Chen, J.; Wu, Y.; Wan, Y.; Cai, Z. The impact of green credit on economicd evelopment quality: The mediating effect of enterprise innovation. Environ. Sci. Pollut. Res. 2023, 31, 5928–5943. [Google Scholar] [CrossRef]
  20. Ma, X.; Xue, Y. How does carbon emission trading scheme affect enterprise green technology innovation: Evidence from China’s A-share non-financial listed companies. Environ. Sci. Pollut. Res. 2023, 30, 35588–35601. [Google Scholar] [CrossRef]
  21. Kaššaj, M.; Peráček, T. Synergies and Potential of Industry 4.0 and Automated Vehicles in Smart City Infrastructure. Appl. Sci. 2024, 14, 3575. [Google Scholar] [CrossRef]
  22. Zhang, H.; Wang, Y.; Li, R.; Si, H.; Liu, W. Can green finance promote urban green development? Evidence from green finance reform and innovation pilot zone in China. Environ. Sci. Pollut. Res. 2022, 30, 12041–12058. [Google Scholar] [CrossRef] [PubMed]
  23. Chen, X.; Chen, Z. Can Green Finance Development Reduce Carbon Emissions? Empirical Evidence from 30 Chinese Provinces. Sustainability 2021, 13, 12137. [Google Scholar] [CrossRef]
  24. Zhang, L.; Mei, Z. Green finance and industrial pollution: Empirical research based on spatial perspective. Front. Environ. Sci. 2022, 10, 1003327. [Google Scholar] [CrossRef]
  25. Zhang, F.; Wang, F.; Yao, S.J. High-speed rail accessibility and haze pollution in China: A spatial econometrics perspective. Transp. Res. Part D Transp. Environ. 2021, 94, 102802. [Google Scholar] [CrossRef]
  26. Zhou, W.; Wu, X.; Zhou, D. Does green finance reduce environmental pollution?—A study based on China’s provincial panel data. Environ. Sci. Pollut. Res. 2023, 30, 123862–123881. [Google Scholar] [CrossRef]
  27. Wu, G. Research on the spatial impact and coupling coordination of green finance on the ecological development of China’s economy. Econ. Change Restruct. 2023, 56, 3353–3381. [Google Scholar] [CrossRef]
  28. Wei, J.; Ye, Y.; Yu, H. Manufacturing agglomeration, urban form, and haze pollution. Environ. Sci. Pollut. Res. 2022, 30, 18921–18936. [Google Scholar] [CrossRef] [PubMed]
  29. Tang, D.; Zhong, H.; Zhang, J.; Dai, Y.; Boamah, V. The Effect of Green Finance on the Ecological and Environmental Quality of the Yangtze River Economic Belt. Int. J. Environ. Res. Public Health 2022, 19, 12492. [Google Scholar] [CrossRef]
  30. He, L.Y.; Liu, L. Stand by or follow? Responsibility diffusion effects and green credit. Emerg. Mark. Financ. Trade 2018, 54, 1740–1760. [Google Scholar] [CrossRef]
  31. Su, C.-W.; Li, W.; Umar, M.; Lobonţ, O.-R. Can green credit reduce the emissions of pollutants? Econ. Anal. Policy 2022, 74, 205–219. [Google Scholar] [CrossRef]
  32. Du, J.; Shen, Z.; Song, M.; Vardanyan, M. The role of green financing in facilitating renewable energy transition in China: Perspectives from energy governance, environmental regulation, and market reforms. Energy Econ. 2023, 120, 106595. [Google Scholar] [CrossRef]
  33. Li, H.; Chen, C.; Umair, M. Green Finance, Enterprise Energy Efficiency, and Green Total Factor Productivity: Evidence from China. Sustainability 2023, 15, 11065. [Google Scholar] [CrossRef]
  34. Kong, G.; Wang, S.; Wang, Y. Fostering firm productivity through green finance: Evidence from a quasi-natural experiment in China. Econ. Model. 2022, 115, 105979. [Google Scholar] [CrossRef]
  35. Xia, Y.; Luo, L.; Ji, K.; Huang, C.; Wan, F.; Wang, Z. The impact of green finance and local regulations on industrial green innovation efficiency in China. Environ. Sci. Pollut. Res. 2023, 31, 1980–1994. [Google Scholar] [CrossRef] [PubMed]
  36. Bei, J.; Wang, C. Renewable energy resources and sustainable development goals: Evidence based on green finance, clean energy and environmentally friendly investment. Resour. Policy 2023, 80, 103194. [Google Scholar] [CrossRef]
  37. Zhang, M.; Zhang, X.; Song, Y.; Zhu, J. Exploring the impact of green credit policies on corporate financing costs based on the data of Chinese A-share listed companies from 2008 to 2019. J. Clean. Prod. 2022, 375, 134012. [Google Scholar] [CrossRef]
  38. Lin, B.; Pan, T. Financing decision of heavy pollution enterprises under green credit policy: Based on the perspective of signal transmission and supply chain transmission. J. Clean. Prod. 2023, 412, 137454. [Google Scholar] [CrossRef]
  39. Lin, B.; Pan, T. The impact of green credit on green transformation of heavily polluting enterprises: Reverse forcing or forward pushing? Energy Policy 2024, 184, 113901. [Google Scholar] [CrossRef]
  40. Yue, H.; Zhou, Z.; Liu, H. How does green finance influence industrial green total factor productivity? Empirical research from China. Energy Rep. 2024, 11, 914–924. [Google Scholar] [CrossRef]
  41. Liu, Z.R.; Zhang, W.J.; Si, C.N. The Development of Green Finance and the Release of Consumer Potential of Residents: An Empirical Analysis Based on Panel Data at the Provincial Level in China from 2014 to 2020. J. Xinjiang Univ. Financ. Econ. 2023, 4, 28–40. (In Chinese) [Google Scholar] [CrossRef]
  42. Lu, C.; Wang, D.; Meng, P.; Yang, J.; Pang, M.; Wang, L. Research on Resource Curse Effect of Resource-Dependent Cities: Case Study of Qingyang, Jinchang and Baiyin in China. Sustainability 2018, 11, 91. [Google Scholar] [CrossRef]
  43. Guo, W.; Yang, B.; Ji, J.; Liu, X. Abundance of natural resources, government scale and green economic growth: An empirical study on urban resource curse. Resour. Policy 2023, 87, 104303. [Google Scholar] [CrossRef]
  44. Popa Tache, C.E. The EU-China road to the Comprehensive Agreement on Investment. Jurid. Trib. 2022, 12, 476–494. [Google Scholar] [CrossRef]
Figure 1. The progression of urban haze pollution and green finance over space and time. Note: Images are based on standard maps downloaded from the Ministry of Natural Resources Standard Map Service website (Review No.GS (2023)2762), without any alterations to the original map.
Sustainability 16 04455 g001
Figure 2. The variation in haze across Chinese cities can be represented by the standard deviation ellipse and the shift in the centre of gravity.
Sustainability 16 04455 g002
Figure 3. Green finance experiences changes in both the standard deviation ellipse and the centre of gravity.
Sustainability 16 04455 g003
Figure 4. A Moran scatter plot depicting the presence of haze pollution in several years across 283 cities in China.
Sustainability 16 04455 g004
Table 1. Green finance measurement index system.
Level 1 IndicatorsCharacterization of IndicatorsVariable Measurement
Green CreditPercentage of credits for environmental projectsTotal amount of credits for environmental projects in the city/total amount of citywide credits
Green InvestmentInvestment in environmental pollution control as a share of GDPInvestment in environmental pollution control/GDP
Green InsuranceExtent of the promotion of environmental pollution liability insuranceEnvironmental pollution liability insurance income/total premium income
Green BondExtent of green bond developmentTotal green bond issuance/total all bond issuance
Green SupportPercentage of fiscal expenditure on environmental protectionFiscal environmental protection expenditures/fiscal general budget expenditures
Green FundPercentage of green fundsTotal market capitalization of green funds/total market capitalization of all funds
Green BenefitsGreen equity development depthTotal amount of carbon trading, energy rights trading, and emissions trading/total amount of equity market transaction
Table 2. Meaning and explanation of variables.
Variable TypeIndicator SelectionSymbolVariable Measurement
Dependent VariableHaze PollutionPMMatching the source data from the atmospheric composition analysis group with data on prefecture-level cities in China
Independent VariableGreen FinanceGFThe entropy weight method is used to measure the comprehensive index of green finance
Control VariableLevel of Economic DevelopmentPgdpGDP per capita in RMB (log)
Investment in Science and TechnologyItFiscal expenditure on science and technology (billion yuan)/general budget expenditure (billion yuan)
Population DensityPdPopulation at the end of the year (10,000)/land area of the administrative region (square kilometers)
Level of Government InterventionGovGeneral budget expenditure (billion yuan)/gross regional GDP (billion yuan)
Level of Human CapitalHumNumber of students enrolled in general undergraduate and junior colleges (persons)/population at the end of the year (10,000 persons)
Greening LevelGlPer capita garden area and green space coverage in built-up areas
Table 3. Descriptive statistics.
VarsObservationsMeanSDMinMax
GF28300.3280.1020.0640.637
PM283042.30015.12011.61108.5
Pgdp283053,81634,7896457467,749
It28300.0160.0174.70 × 10−50.207
Pd2830440.800349.65.0932927
Gov28300.2030.1030.0440.916
Hum28300.0190.0255.90 × 10−50.193
Gl283017.6907.3671.37060.070
Table 4. Benchmark regression results.
Vars(1)(2)(3)(4)(5)(6)(7)
GF−0.967 ***
(0.0247)
−0.576 ***
(0.0248)
−0.530 ***
(0.0248)
−0.528 ***
(0.0247)
−0.328 ***
(0.0244)
−0.315 ***
(0.0241)
−0.299 ***
(0.0239)
Pgdp−2.539 ***
(0.0293)
−0.428 ***
(0.160)
−0.478 ***
(0.157)
−0.477 ***
(0.156)
−0.419 ***
(0.143)
−0.411 ***
(0.141)
−0.392 ***
(0.140)
Pgdp2 0.0270
(0.0797)
0.0480
(0.0782)
0.0489
(0.0780)
0.0114
(0.0714)
0.0195
(0.0705)
0.0221
(0.0698)
It 0.0454 ***
(0.00449)
0.0473 ***
(0.00451)
0.0272 ***
(0.00423)
0.0229 ***
(0.00420)
0.0206 ***
(0.00417)
Pd −0.137 ***
(0.0350)
−0.157 ***
(0.0321)
−0.220 ***
(0.0325)
−0.225 ***
(0.0322)
Gov −0.343 ***
(0.0155)
−0.326 ***
(0.0154)
−0.312 ***
(0.0153)
Hum −0.0733 ***
(0.00874)
−0.0666 ***
(0.00871)
Gl −0.0821 ***
(0.0114)
Constant2.539 ***
(0.0293)
7.014 ***
(0.150)
7.356 ***
(0.151)
8.129 ***
(0.248)
7.988 ***
(0.227)
7.781 ***
(0.226)
7.846 ***
(0.224)
Observations2830283028302830283028302830
Number of id283283283283283283283
R-squared0.3760.5410.5580.5610.6320.6420.649
Note: Robust standard errors are indicated by parentheses, while *, **, and *** represent significance at the 10%, 5%, and 1% levels, correspondingly.
Table 5. Evaluation outcomes for Moran’s I coefficient.
YearPMGF
20110.185 ***0.496 ***
20120.181 ***0.542 ***
20130.188 ***0.535 ***
20140.171 ***0.579 ***
20150.218 ***0.586 ***
20160.216 ***0.550 ***
20170.185 ***0.553 ***
20180.201 ***0.543 ***
20190.203 ***0.531 ***
20200.204 ***0.542 ***
Note: *** denotes significance at the 1% level.
Table 6. Estimation results from the spatial Dubin model.
Test TypeNull HypothesisStatistics
LM testSEM97.85 ***SDM
Robust SEM32.87 ***
SAR74.21 ***
Robust SAR7.13 **
Hausman testRandom effect43.50 ***Fixed effect
Wald testSDM can be simplified to SEM or SAR14.54 **SDM
LR test SDM can be simplified to SEM or SAR10.89 *SDM
11.23 *
Note: *, **, and *** represent significance at the 10%, 5%, and 1% levels, respectively.
Table 7. Estimation results for the spatial Dubin model.
(1)(2)(3)(4)(5)
VarsMainWxDirect EffectSpillover EffectAggregate Effect
GF−0.0144 *−0.120 ***−0.0264 **−0.259 ***−0.285 ***
(0.0112)(0.0345)(0.0119)(0.0673)(0.0712)
Pgdp0.310−1.0200.214−1.502−1.288
(0.592)(1.577)(0.626)(3.219)(3.556)
Pgdp2−0.1690.467−0.1240.6500.526
(0.296)(0.788)(0.313)(1.608)(1.777)
It−0.0236 ***−0.0343 **−0.0284 ***−0.0955 ***−0.124 ***
(0.00611)(0.0141)(0.00605)(0.0280)(0.0302)
Pd0.183 ***−0.0877 ***0.184 ***0.01930.203 ***
(0.00613)(0.0140)(0.00613)(0.0280)(0.0303)
Gov−0.138 ***−0.115 ***−0.154 ***−0.376 ***−0.530 ***
(0.0182)(0.0399)(0.0189)(0.0756)(0.0821)
Gl0.110 ***−0.109 ***0.105 ***−0.101 *0.00425
(0.0106)(0.0281)(0.0118)(0.0568)(0.0621)
Rho0.528 ***0.528 ***0.528 ***0.528 ***0.528 ***
(0.0270)(0.0270)(0.0270)(0.0270)(0.0270)
Sigma2_e0.0489 ***0.0489 ***0.0489 ***0.0489 ***0.0489 ***
(0.00133)(0.00133)(0.00133)(0.00133)(0.00133)
Observations28302830283028302830
R-squared0.4630.4630.4630.4630.463
Number of id283283283283283
Note: Robust standard errors are indicated by parentheses, while *, **, and *** represent significance at the 10%, 5%, and 1% levels, correspondingly.
Table 8. Dynamic Durbin model estimation results.
Vars(1)(2)(3)(4)(5)(6)(7)(8)
MainWxShort-Term EffectLong-Term Effect
Direct EffectSpillover EffectAggregate EffectDirect EffectSpillover EffectAggregate Effect
L.WPM1.013 ***
(0.013)
L.PM1.205 ***
(0.008)
GF0.008 *
(0.005)
0.153 ***
(0.014)
0.029 ***
(0.005)
0.416 ***
(0.041)
0.445 ***
(0.043)
−0.033
(1.894)
−0.162
(1.896)
−0.194 ***
(0.016)
Control variableYESYESYESYESYESYESYESYES
Rho0.632 ***0.632 ***0.632 ***0.632 ***0.632 ***0.632 ***0.632 ***0.632 ***
(0.016)(0.016)(0.016)(0.016)(0.016)(0.016)(0.016)(0.016)
Sigma2_e0.008 ***0.008 ***0.008 ***0.008 ***0.008 ***0.008 ***0.008 ***0.008 ***
(0.001)(0.001)(0.001)(0.001)(0.001)(0.001)(0.001)(0.001)
Observations25472547254725472547254725472547
R-squared0.7010.7010.7010.7010.7010.7010.7010.701
Number of IDs283283283283283283283283
Note: Robust standard errors are indicated by parentheses, while *, **, and *** represent significance at the 10%, 5%, and 1% levels correspondingly.
Table 10. Heterogeneity analysis results.
VarsShort-Term EffectLong-Term Effect
Direct EffectSpillover EffectAggregate
Effect
Direct EffectSpillover EffectAggregate Effect
Regional
heterogeneity
EastGF0.118 ***0.1040.222 **−1.8580.205−1.652 **
(0.032)(0.079)(0.087)(2.224)(2.376)(0.760)
CentralGF0.135−0.323−0.188 ***−0.111 ***−0.036 ***−0.147 ***
(0.211)(0.211)(0.003)(0.012)(0.0116)(0.002)
WestGF−0.01880.163 **0.144 ***0.316−0.2470.0690 ***
(0.083)(0.081)(0.013)(4.723)(4.723)(0.006)
Resource endowment heterogeneityResource-based cityGF−0.0124−0.158 *−0.170 **0.05310.0001380.0533 **
(0.008)(0.082)(0.087)(1.042)(1.041)(0.026)
Nonresource-based cityGF−0.003160.133 ***0.130 ***0.107 **−0.622 ***−0.515 ***
(0.006)(0.020)(0.020)(0.050)(0.0912)(0.079)
Note: Robust standard errors are indicated by parentheses, while *, **, and *** represent significance at the 10%, 5%, and 1% levels, correspondingly.
Disclaimer/Publisher’s Note: The statements, opinions and data contained in all publications are solely those of the individual author(s) and contributor(s) and not of MDPI and/or the editor(s). MDPI and/or the editor(s) disclaim responsibility for any injury to people or property resulting from any ideas, methods, instructions or products referred to in the content.

