Abstract
Corporate sustainability is a key concern in today’s world. This research examines the relationship between managerial myopic behavior and corporate sustainability performance in Chinese A-share listed companies from 2013 to 2022. Based on behavioral finance theory and time orientation theory, our research provides novel insights into how time preference in managerial decisions significantly affects corporate sustainable development. We also investigate how myopic behavior by managers can adversely affect a company’s sustainable development performance. Using a robust dataset, we describe the mechanisms by which managers’ myopic behavior affects sustainability performance, especially in two aspects: financialization of assets and green innovation capability. The results of our research show the following: (1) managers’ myopic behavior adversely affects corporate sustainability performance; (2) asset financialization and green innovation capability play mediating roles; and (3) unlike the findings of the existing research, this study found that the linear moderating effect of media attention plays a significant “inverted U-shaped” moderating role in the relationship between the two influences.
1. Introduction
Currently, global warming and environmental pollution are increasingly prominent issues [1,2]. The United Nations World Commission on Environment and Development (WCED) proposed that enterprise development should follow the macro-concept of sustainable development. The concept of “sustainable development” has since been applied at an enterprise level by many scholars [3,4]. Sustainable enterprise development entails the ability to satisfy its own continuous profit growth while simultaneously and rationally utilizing its resources and reducing the negative environmental impacts of its production activities, to gain the long-term support of its internal and external stakeholders [1]. The current indicator for measuring corporate sustainability levels is the combined output of economic, environmental, and social performance (TBL) [1], where economic performance refers to the efficiency evaluation of economic and resource allocation and resource use. Environmental performance reflects the ecologically beneficial relationship between enterprises and stakeholders. It mainly examines how enterprises impact and contribute to the ecosystem by protecting the environment and conserving resources within a given period. Social performance refers to the results and effectiveness of a company’s social responsibility and social management activities. The current literature claims that companies can and should balance these three objectives one at a time rather than limiting their consideration to one or the other [5]. However, given the complexity and multifaceted nature of corporate sustainability, pursuing all three goals simultaneously is fraught with trade-offs and tensions [3]. Therefore, sustainable development has become a significant challenge for companies.
Considering the importance and difficulty of corporate sustainability, its influencing factors such as executive teams, corporate governance, IT capabilities, and even ESG score gaps have been studied and discussed by scholars [6,7]. Regarding the impact of executive teams on corporate sustainability development performance, scholars mainly focus on demographic characteristics, internal psychological characteristics, external background characteristics of the executive team, etc. For example, from the perspective of demographic characteristics, Encinas Bartos et al. and Hambrick et al. [8,9] believe that differences in age, educational background, and work experience can impact enterprise sustainable development performance differently. Regarding internal psychological characteristics, Hui et al. [10] found that managers’ overconfidence can lead to overinvestment and hinder enterprises’ long-term development. Agarwal et al. and Long-sheng et al. [11,12] found that executives’ environmental awareness and ambidexterity can significantly improve enterprises’ sustainable development capabilities by promoting green innovation. From the perspective of external background characteristics, Hui et al. [10] found that the “crowding out effect” of innovation resources caused by political connections can negatively impact the long-term performance of enterprises. Henry et al. [1] studied 22 energy companies in the top 100 sustainable development companies worldwide and found that diversity and heterogeneity in executive teams result in higher sustainable development performance for enterprises.
However, despite valuable research on the factors impacting a company’s sustainable development performance, some deficiencies remain. Firstly, among numerous studies on the dimensions of managerial psychological and behavioral traits, most focus on aspects such as managerial overconfidence and personal cognition. Few scholars focus on the characteristics of managerial time preferences. Consequently, there is a lack of research on the impact of managerial time preferences on a company’s sustainable development. Secondly, due to reasons such as compensation design, managers’ myopic behavior is a common long-term phenomenon in many companies. Research on this topic mainly focuses on the influencing factors and harm to companies, mostly analyzing how managerial myopic behavior affects a company’s investment and financing decisions, innovation, and information disclosure from the perspective of the upper-echelon theory. However, there is less discussion of managerial myopic behavior and its impact on sustainable development performance, indicating a research gap. Thirdly, the existing research on managerial myopia mostly focuses on the channels of action, with less attention paid to external factors’ moderating role. For example, similar articles to ours do not analyze the moderating effect of external influencing factors. This article fills this gap by analyzing the unique role played by media attention among external factors. Therefore, this article seeks to explore the following questions: What kind of impact does managerial myopic behavior have on a company’s sustainable development performance? What is the relationship between the two, and through what channels and mechanisms do they interact? What unique role do external factors play?
Therefore, non-financial listed companies on the Shanghai and Shenzhen stock exchanges from 2013 to 2022 were selected as the sample for this study. Based on behavioral finance theory and time orientation theory, this study examined the impact of managerial myopia on a company’s sustainable development performance using a large panel dataset. Further research showed that financialization and green innovation capability play a mediating role in this relationship, and media attention acts as a moderating variable. This conclusion was supported by a series of models. It is worth noting that, according to a scientific analysis of large datasets, media attention does not have a single linear moderating effect in this relationship; rather, it has a dual impact with a “U-shaped” moderating effect.
The main contributions of this study can be summarized as follows: Firstly, it incorporates the time orientation theory into research on corporate sustainable development performance and analyzes the channels and mechanisms through which managers’ myopic behavior affects sustainable development. Secondly, in examining the moderating effect of media attention, this study emphasizes the dual impact of information overload and, unlike the previous literature, finds that media attention has a “U-shaped” effect supported by the scientific analysis of large datasets. Thirdly, this study emphasizes critical thinking and provides a dialectical analysis of issues such as managerial power and information overload represented by media attention, expanding the discourse on these research topics and having practical implications for managers and companies.
2. Theoretical Analysis and Research Hypothesis
2.1. Managerial Myopia Behavior and Enterprise Sustainability Performance
According to high-level management theory, managers’ dominant position allows them to play a crucial role in corporate decision making. Corporate managers’ power involves position-related power and personal power, and the topic of limited liability company executive power and obligations has always been debated [13,14]. Some scholars have emphasized the importance of legislative foundations in defining the rights and obligations of limited liability company managers. In addition, they have assessed their own knowledge and skills [15]. This legal framework provides clear regulations and boundaries for managers’ actions, ensuring they comply with legal requirements in fulfilling their duties and exercising their power. Other scholars have suggested that, due to agency problems, the contractual basis of business and law between limited liability companies and managers may have different consequences depending on the purpose of the contract [16]. Due to the special power and obligations of upper management in companies, we must critically and deeply discuss the personal power of top managers. We should also analyze managerial myopia as an inherent trait of their personal power. These issues will be discussed in further detail.
According to the time orientation theory, managers generally have two subjective time preferences in strategic decision making: long-term orientation and short-term orientation [17]. Myopic behavior is a major manifestation of short-term orientation, which is characterized by managers becoming overly concerned with short-term performance and benefits, ignoring the company’s long-term sustainable development [18]. Since the global financial crisis in 2008, the issue of managerial myopia among listed companies has received widespread attention from scholars at home and abroad. Literature on factors influencing managerial myopia mainly focuses on economic factors such as compensation, reputation, and self-position maintenance [6,19]. Some scholars have found that external pressures such as common institutional investors [20], analyst tracking, and frequency of financial disclosure also affect managerial myopia. The consequences of managerial myopia have also been explored from different perspectives. In terms of corporate investment, Hu Nan [21] noted that managerial myopia can inhibit long-term investment and fundamentally impact corporate investment decisions. Managers who pursue short-term benefits tend to suppress exploratory innovation and green innovation output due to the long cycles and uncertainty of corporate innovation [22,23]. In terms of information disclosure, myopic management increases the likelihood of the company concealing major defects [7]. In addition, scholars have explored ways to alleviate managerial myopia, such as improving corporate governance and increasing the number of analysts.
Corporate sustainability requires an effective balance of economic, environmental, and social dimensions [5]. Managerial time preferences limit the effective resource allocation in both the short and long term [18,22]. Influenced by factors such as compensation design, myopic behavior driven by self-interest can significantly impact a company’s economic, environmental, and social performance. Therefore, based on behavioral finance theories, this study investigates how myopic behavior, which reflects managerial psychology and cognition, can affect a company’s sustainable development performance according to three aspects.
Firstly, in terms of economic performance, it can be argued that managerial myopic behavior prioritizes short-term economic benefits over long-term economic sustainability. According to the prospect theory in behavioral finance, managers may be overly optimistic in their pursuit of short-term performance, leading them to overestimate the returns of short-term projects and overlook the potential value of long-term projects to achieve immediate financial gains. This behavior can significantly impact enterprises’ long-term economic sustainability. For example, some scholars have found that myopic managers may choose to cut research and development expenses, delay necessary equipment maintenance, or reduce employee training to reduce costs and increase short-term profits [21]. However, these actions may result in decreased product quality, outdated technology, and employee turnover, ultimately affecting enterprises’ long-term competitiveness and sustainable development.
Secondly, in terms of environmental performance, it can be argued that managerial myopic behavior neglects environmental protection and the importance of sustainable operations. Driven by cognitive biases such as immediate gratification and loss aversion, myopic managers may choose to adopt low-cost production methods with a significant environmental impact or disregard environmental regulations and standards [7], leading to resource waste, environmental pollution, and ecological damage. In addition, although these actions may save costs in the short term, they can have long-term impacts such as environmental lawsuits, public dissatisfaction, and damage to brand reputation [24], negatively affecting enterprises’ sustainable development.
Finally, in terms of social performance, managerial myopic behavior may tend to neglect social responsibility and stakeholder interests [24]. In their pursuit of short-term profit maximization, long-term investments such as corporate social responsibility and employee welfare may be viewed as “extra costs” by myopic managers, thus neglecting the importance of employee welfare, customer rights, and community relations. This behavior can lead to low employee morale, customer dissatisfaction, and community resistance, ultimately damaging enterprises’ reputations and long-term interests [7]. Furthermore, consumers and investors are paying more attention to a company’s social responsibility performance as social expectations for enterprises rise. Managerial myopic behavior may lead to loss of market shares, investor trust, and partnerships [20], negatively impacting enterprises’ sustainable development.
Therefore, based on the above analysis, this study concludes that managerial myopia behavior has a significant impact on a company’s sustainable development performance, including economic, environmental, and social performance. Myopic managers only pursue short-term gains and ignore long-term planning for the company, which has a negative impact on investment, environmental protection, green innovation, and social responsibility, ultimately hindering the company’s sustainable development capability.
Our first hypothesis is formally stated as follows:
H1.
Managerial myopic behavior has a significant negative effect on the sustainable development performance of enterprises.
2.2. Channel Analysis of the Role of Managers’ Myopic Behavior in the Sustainability Performance of Companies
Based on the theoretical framework, this study examines the negative impact of managers’ myopic behavior on enterprises’ sustainable development performance. If H1 is supported, this study will explore asset financialization and green innovation capabilities as two mediating channels in this cause-and-effect relationship. The subsequent research stage involved the development of theoretical analyses and corresponding research hypotheses centered on these channels of action.
2.2.1. Assets Financialization
Sustainable business development is a highly complex process. Asset allocation plays a crucial role in business management, making it a core aspect of decision making and operations [25]. Myopic managers’ decision making perspective is often limited, as seen in their preference for projects with quick returns and the tendency to choose short, flat, and fast investments [18]. Compared to physical assets, financial assets are mainly in the form of financial products and debt investments, with high liquidity and quick maturation. “Market arbitrage” involves financial assets that are highly attractive to myopic managers with limited funds. Furthermore, according to the precautionary savings theory, financial assets have a lower cost of capital than cash and better liquidity than fixed assets. To alleviate financing constraints and prevent financial crises, companies often allocate more funds to financial assets. Additionally, managers often pursue short-term results because of principal–agent theory, and financialization is a convenient way to manage earnings and adjust book profits. Through earnings’ management, managers can manipulate book profits to improve short-term corporate performance [26]. Therefore, myopic managers may prioritize protecting their personal reputations, being rewarded through earnings’ management to avoid losses or increase profits, and resulting in the company’s investment in financial assets, also known as corporate financialization [17,18,19].
Resource dependence theory suggests that companies must obtain resources from their surrounding environment and implement socially responsible measures to increase long-term returns rather than short-term profits [1]. Currently, financialization research is mainly divided into the “reservoir” and “crowding out” effects. In the short term, financialization can alleviate financing constraints, reserve funds, and have a “reservoir” effect. However, in the long run, it can crowd out innovation output and physical investment, leading to a shortage of funds for long-term investments and hindering investment in profitable long-term projects such as research and development and market expansion. Consequently, problems such as capital misallocation, which are not conducive to sustainable company development, may occur. At the same time, asset financialization will exacerbate a company’s overall financing constraints, especially during economic upturns. Companies’ excessive reliance on the financial market contributes to asset bubble formation, leading to higher financing costs and conditions that will further intensify financing constraints. Meanwhile, research has confirmed the damaging influence of financialization on future core performance, including stagnant or fragile company growth and poor sustainable development performance [27,28,29]. Based on the short-term benefits of asset financialization, if it follows a “allocate financial assets–obtain returns–allocate financial assets” cycle, the company will be unable to ease its financing constraints during investment activities. Consequently, not only will the company’s main business investments (especially in research and development activities) shrink, but the company will be gradually “hollowed out” as well. In this scenario, the magnitude of the “crowding out” effect of financialization is larger than that of the “reservoir” effect, ultimately distorting the company’s investment plans and causing capital mismatches [29]. Therefore, in the long run, this type of financialization may lead to problems such as capital misallocation and intensified financing constraints. These events cause companies to gradually become “hollowed out”, hindering sustainable development performance improvements.
2.2.2. Green Innovation Capacity
Green innovation has the dual attributes of “innovation” and “green”, with “innovation” able to significantly improve production efficiency and generate economic effects, while “green” reflects efforts to improve the environment and has positive externalities. Green innovation is increasingly recognized as a crucial strategy for companies to gain a sustainable competitive advantage in new arenas [30]. However, due to the uncertainty and long-term nature of green innovation results, it often has a “crowding out effect” in the early stages [31]. On the one hand, enterprises must continuously invest in human and financial resources, which increases current costs and depreciation and amortization expenses, causing earnings to decline. On the other hand, before green innovation results can be translated into economic benefits, high R&D expenses may raise product prices, leading to decreased sales and increased business risk for the company. Therefore, companies face two major disadvantages to green innovation: Firstly, it cannot generate significant economic effects in the short term and may even lead to a decrease in current profits; secondly, green innovation activities involve considerable risks and require continuous resource investment, with a high degree of uncertainty in cost recovery cycles. In this situation, myopic managers only see the negative impact of green innovation on short-term profits while ignoring its ability to create long-term profits through effective resource use, resulting in low green innovation investment and damage to the company’s sustainable development. Consequently, myopic managers may use their control of resources and personal authority to hinder green innovation activities.
As a strategic tool to address environmental challenges, green innovation positively impacts a company’s ability to gain a competitive advantage and improve sustainable development performance. Based on the existing research, green innovation can be divided into green process innovation and green product innovation [32]. Firstly, through green process innovation, companies can use new or improved production processes, environmentally friendly energy sources, and renewable energy to save resource costs and alleviate resource constraints. At the same time, gaining a technological advantage through cutting-edge technology can increase production capacity, improve input–output ratio, and significantly improve economic performance [30]. A second benefit of green product innovation is that it can reduce product energy consumption using environmentally friendly materials and constructing a more complete recycling and disposal system. Furthermore, companies can establish an environmentally friendly image in the eyes of the public, gain more support and recognition for green initiatives, and build a good social reputation. Not only can companies gain environmental premiums and new profit points, but also they can differentiate themselves from competitors, helping the company achieve better market performance. In summary, green innovation strategies can increase production capacity, reduce environmental threats, establish an image of environmental responsibility, and increase stakeholders’ trust in the company. However, myopic managers often overlook the importance of green innovation, leading to missed development opportunities and a decrease in sustainable company development.
Building upon the analytical framework presented above, this study proposes two research hypotheses, namely, H2a and H2b.
H2a.
Managerial myopia behavior may result in the financialization of companies’ assets, which could have a detrimental effect on the companies’ sustainable development performance.
H2b.
Managerial myopia behavior may hinder companies from engaging in green innovation activities, thereby hindering the company’s sustainable development performance.
2.3. Mechanism Analysis of Managerial Myopia Behavior on Company’s Sustainable Development Performance
The impact of managers’ myopic behavior on sustainable development performance varies depending on the external environment. If research hypothesis H1 is confirmed through statistical tests, this study will further explore the impact of managerial myopia on a company’s sustainable development performance under external attention conditions.
The information era has had an increasingly significant impact on individual decision making. On the one hand, information provides market insight and competitive intelligence, which can help enterprises better understand the market and make reasonable consumer strategies. The proliferation of information overload and false information, on the other hand, makes it difficult for consumers and enterprises to judge the authenticity of information, leading to erroneous decisions. Studies have shown that the level and quality of information disclosure can significantly affect a company’s value or performance. Considering behavioral finance, limited attention, salience, and information presentation, they can also impact investment activities differently [33]. In addition, information monopolies can lead to information asymmetry, which makes rational decision making difficult for consumers and enterprises. In summary, information is becoming increasingly important for individual and corporate decision making.
The media is an important channel for enterprise information dissemination and a crucial part of capital market governance mechanisms. It maintains a dual role of information dissemination and social public awareness, serving as an essential channel for public understanding of enterprises [34]. In addition to internal governance systems such as board systems and equity incentives, external forces such as the media and government play an increasingly important role in corporate governance. However, an increasing body of research suggests that media attention has a complex, two-way effect [35]. On the one hand, based on effective regulation and market pressure hypotheses, media attention can improve corporate governance and promote business development. For example, scholars have found that media attention can bring external supervision to business operations, enhance information transparency, and increase earnings’ management due to market pressure. Thus, media attention plays a governance role in corporate performance [34]. Regarding corporate innovation, others have found that media attention promotes green technology innovation for heavily polluting enterprises [36]. However, market pressure brought by media attention can also lead to “greenwashing” behavior in heavily polluting companies [37]. On the other hand, some media may deliberately cater to the needs of listed companies due to personal interests, causing a ripple effect in behaviors that contravene investors’ interests. For example, the independent media watchdog organization “Fairness and Accuracy in Reporting” in the United States recently published a report that specifically emphasizes conflicts of interest in media companies. The report asserted at least three conflict of interest aspects that affect media impartiality. Currently, there is no consensus on the mechanism of media influence. This article argues that media attention plays an “inverted U” moderating role in managerial myopia’s impact on a company’s sustainable development performance. Specifically, when media reports are low, the market pays less attention to companies. Consequently, there is a large information asymmetry, and the number and quality of media reports are relatively low. At this time, the media guides public opinion [35]. Myopic managers, however, have short-term preferences and cater to some mainstream media opinions that lack depth and accuracy. They often make decisions based on emotions expressed by the media to maintain their short-term reputation and image, exacerbating the negative impact of myopic behavior on sustainable development.
However, when media reports are high, the market pays more attention to these companies, and the media, as a public information platform, significantly increases the number and quality of reports. Although managers still have subjective, short-term time preferences, information collection costs are reduced, and information transparency is improved [38], helping them make wiser choices. In addition, media reports can impact the reputation of managers and the board of directors. Consequently, high levels of media attention expose their reputation to both shareholders and the general public. Reputation determines salary and promotion opportunities, which alert top management to fraudulent activities [38]. High media attention can compel companies to fulfill their social responsibilities, improve effective resource allocation, and mitigate the negative impact of managers’ myopic behavior on a company’s sustainable development.
Therefore, it can be seen that media attention has a moderating effect on the relationship between myopic behavior by managers and a company’s sustainable development performance, and this moderating effect is not one-sided, but has two sides.
This leads to the further research hypothesis H3.
H3.
Media attention has an “inverted U” moderating effect on the relationship between myopic behavior by managers and a company’s sustainable development performance.
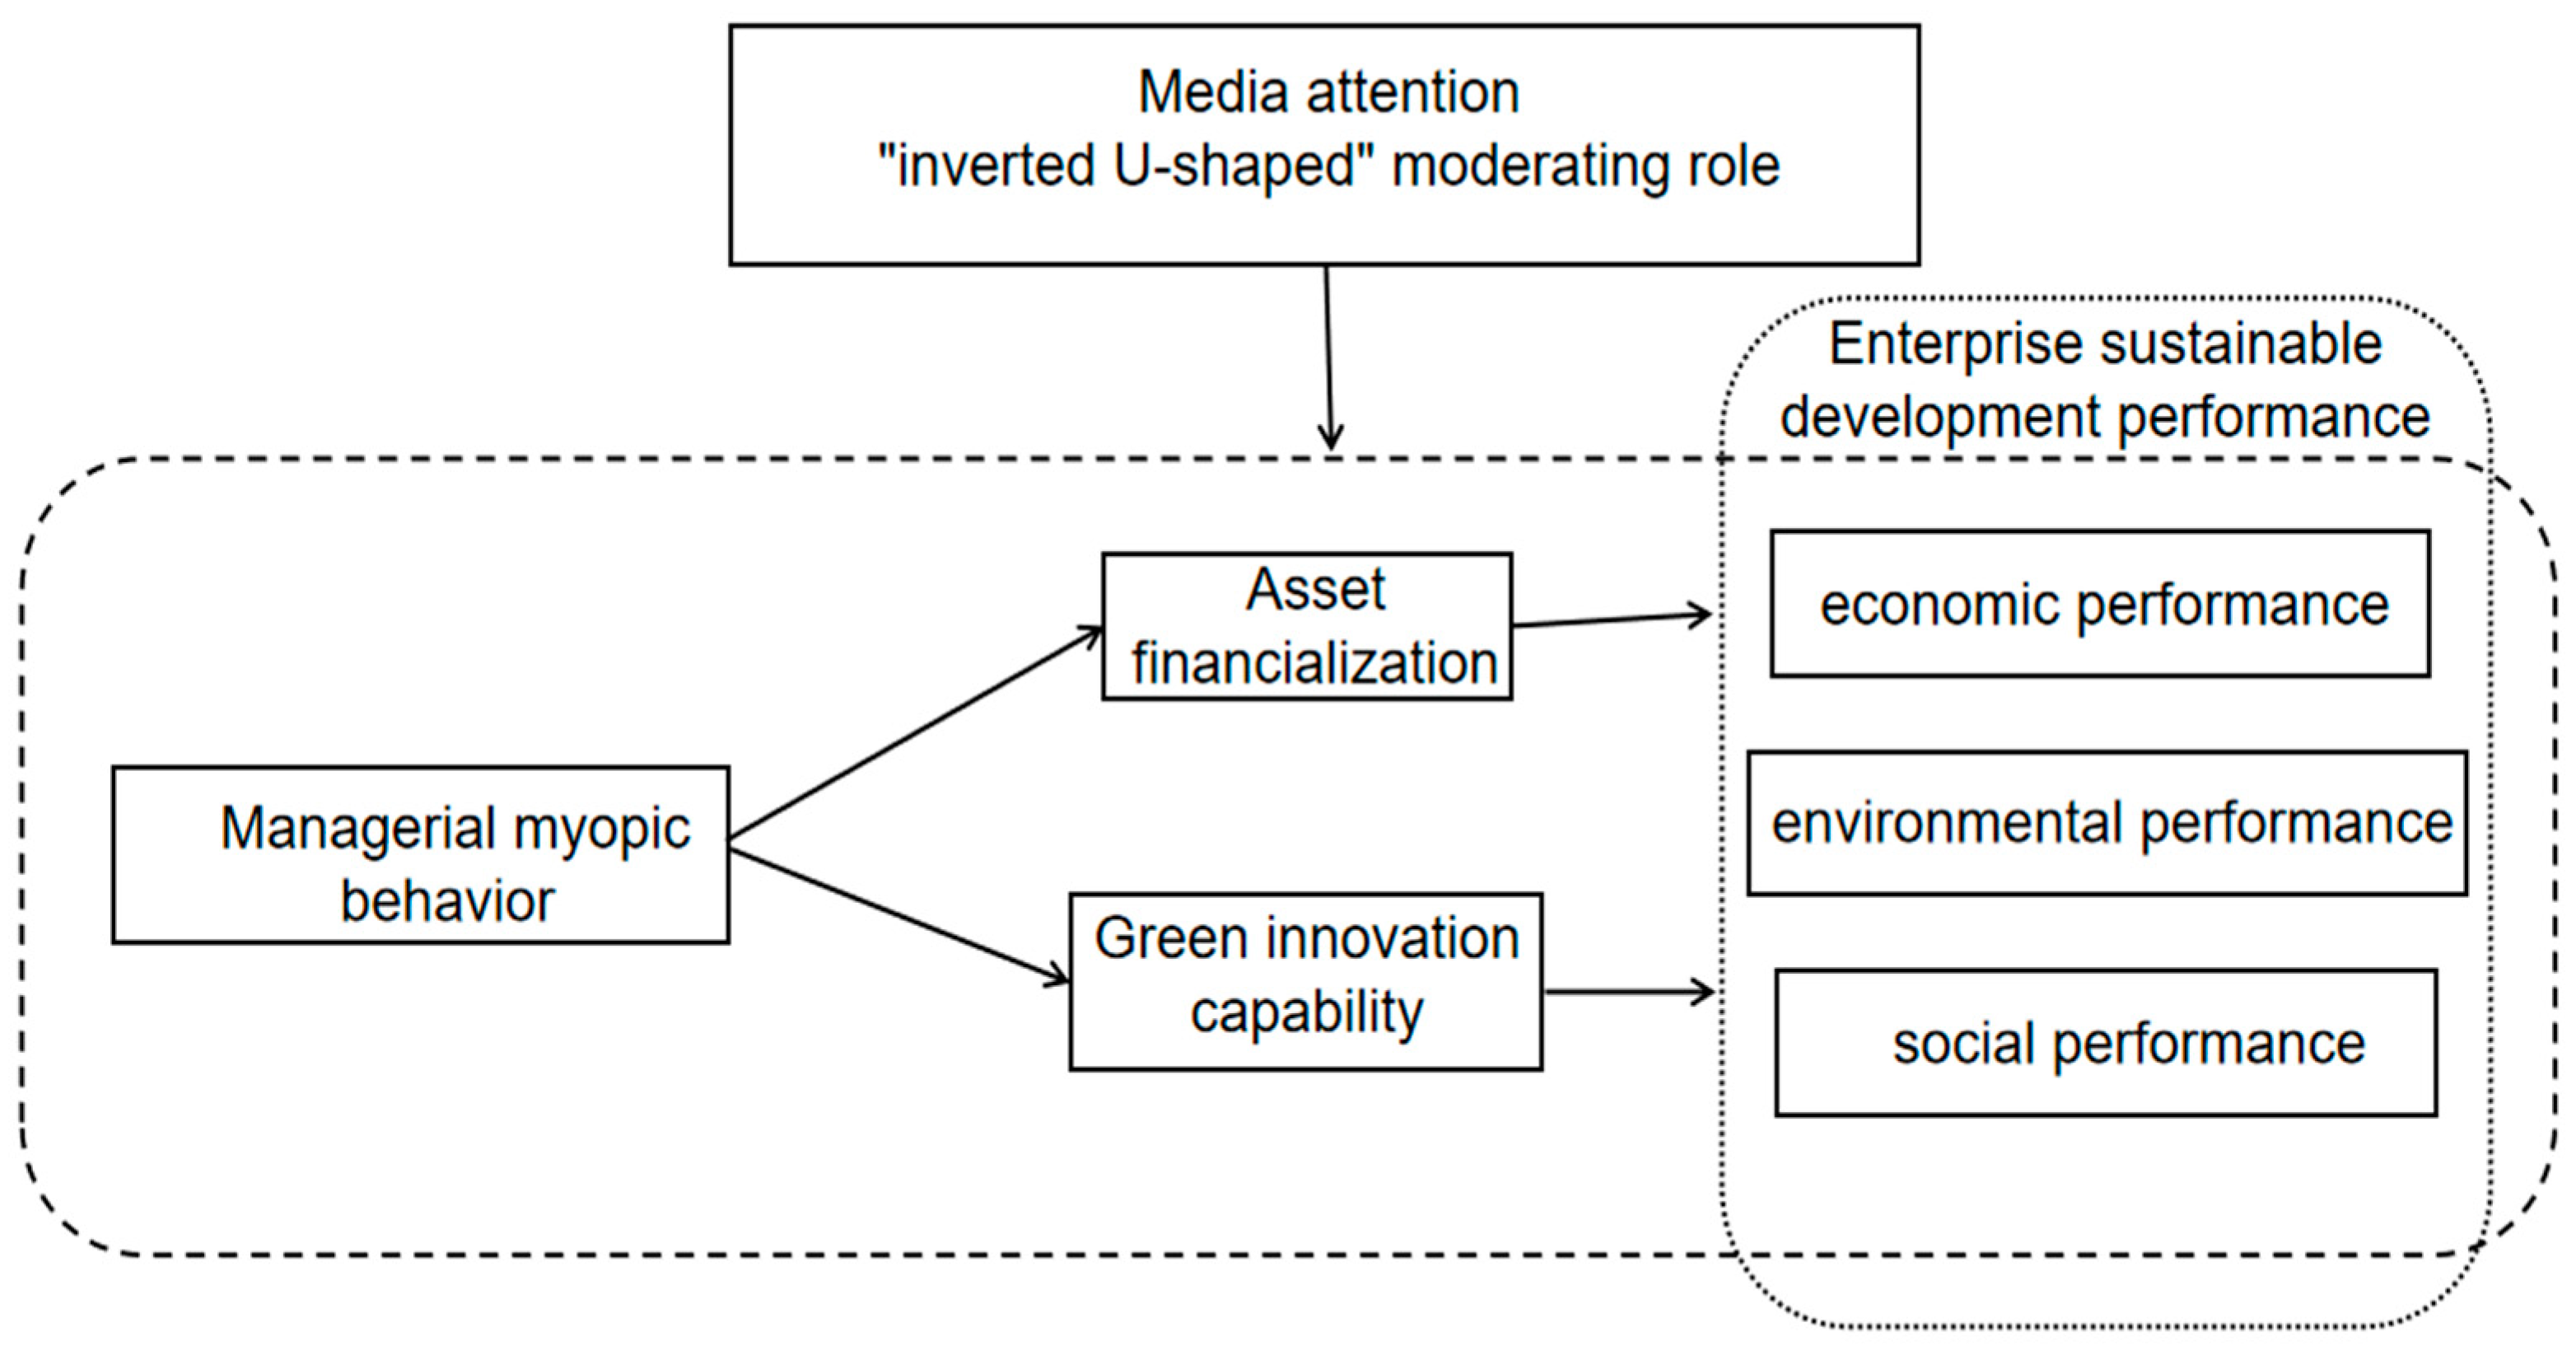
Based on the theoretical analysis above, the theoretical framework of this study is shown in Figure 1.
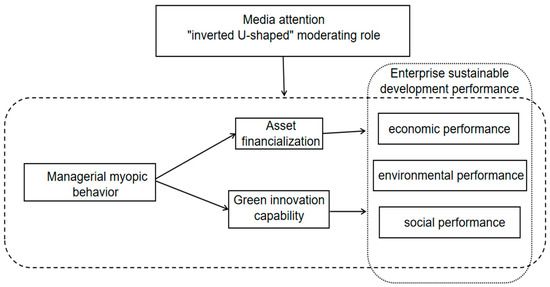
Figure 1.
Schematic diagram of the theoretical framework.
3. Methodology
3.1. Sample Selection and Data Sources
Given the availability of data, this study uses 2013–2022 Chinese A-share listed companies as the research sample and conducts the following data processing: (1) deleting ST and *ST company samples; (2) deleting financial company samples; and (3) deleting samples with missing major variables, resulting in a final sample of 4035 companies and 19,238 data points. The annual financial report files of listed companies are obtained from the WIND database, and other research data are obtained from the CSMAR and WIND databases. To eliminate the influence of outliers, this study applies a 1% winsorization method to all continuous variables.
3.2. Panel Regression Model
In this paper, we refer to the existing study [21], and the baseline regression Model (1) is used to test the research hypothesis H1.
In Model (1), the dependent variable is sustainable development performance (SDP), the independent variable is managerial myopia behavior (Myopia), and the other variables are control variables. If hypothesis H1 is supported, the coefficient of Myopia will be significantly negative, indicating a negative correlation between the level of managerial myopia and a company’s sustainable development performance. The other hypotheses will be examined in subgroups based on Model (1) and will not be discussed in detail here.
This study controls time and industry fixed effects, with industries classified according to the China Securities Regulatory Commission’s 2012 industry classification standard. For industries other than manufacturing, only the category dimension is used. To control heteroskedasticity and time series correlation in the error term, robust standard errors are used.
3.3. Variables’ Explanation
3.3.1. Explained Variables
Looking at the existing sustainable development indicator system, there is no unified consensus on the evaluation system for sustainable development performance both domestically and internationally. Mainstream evaluation systems can be divided into two categories: financial indicators, such as single [39] or multiple financial indicators [40], and comprehensive indicators, such as the triple performance indicator system [1], evaluation systems constructed based on expert scoring and AHP methods, and evaluation systems using factor analysis methods [41]. This study follows the mainstream evaluation method and triple performance indicator system [42], which not only covers the economic, social, and environmental aspects of evaluating a company’s sustainable development but also compensates for the shortcomings of single and multiple financial indicators. This method allows for a relatively comprehensive and objective assessment of a company’s sustainable development status, including both static and dynamic analyses.
To measure sustainable development of companies, this study refers to the existing literature and establishes a three-dimensional index system from the economic, environmental, and social perspectives [1]. For economic performance, return on assets (ROA) is used as a measure of a company’s performance and growth potential, based on previous research. Environmental and social performance are represented by a company’s environmental and social scores from its corporate social responsibility ratings. The specific indicators for sustainable development performance are shown in Table 1. The entropy method is then used to calculate weights to measure the sustainable development performance of each company.

Table 1.
The sustainable development of enterprise performance indicators.
3.3.2. Explanatory Variable
The current literature uses survey rating methods to measure managerial myopia [43]. However, this method has issues, such as low response rates and subjective biases. Some scholars rely on financial indicators such as the proportion of short-term investments as proxies for myopia; however, these variables only capture observable post-behavior rather than managers’ actual cognition, resulting in high noise levels. Other scholars use social psychology to analyze the language used by experimental subjects to explain their traits. This study draws on Hu Nan et al.’s method (2021) [21]. We first analyzed “myopic perspective” expressions in the English and Chinese lexicons. Words and phrases such as “as soon as possible”, “immediately”, “pressure”, and “opportunity” were considered as directly or indirectly expressing managerial myopia. Then, we used Word2Vec machine learning technology to train the annual financial report corpus. Based on the dictionary method, we compared the total word frequency representing managerial myopia with the total word frequency in the MD&A section, multiplying it by 100 to obtain an index for managerial myopia. Compared to other methods, this approach considers both dynamic and static aspects of managers’ myopic behavior. The higher the value of this variable, the more likely managers are to maintain short-term perspectives.
3.3.3. Control Variables
Referring to the existing research literature, this paper selects control variables from three aspects: firms, managers and others [7,22]. These variables include company size, company growth, leverage ratio, number of overseas-educated individuals, book-to-market ratio, proportion of independent directors, manager ownership ratio, controlling shareholder’s fund occupation, and manager compensation. Table 2 shows the symbols and definitions of each variable.
Table 2.
Variable definition table.
3.4. Empirical Analysis
3.4.1. Descriptive Statistics and Correlation Analysis
Table 3 reports the descriptive statistics of each variable. From the results in the table, there is a large difference in the maximum and minimum values of sustainable development performance and its components (economic performance, environmental performance, and social performance), indicating a significant variation in the level of sustainable development performance among different companies. The maximum value for managerial myopia is 0.446, the minimum value is 0, and the mean is 0.082, with a standard deviation of 0.071. It is evident that there is a considerable variation in managerial myopia among different companies, and it is a common long-term phenomenon among management teams in listed companies. Additionally, by comparing our data with the existing literature, we found that all of our data fall within reasonable ranges, indicating the reliability and authenticity of our data.
Table 3.
Descriptive statistics.
Correlation analysis for the variables is shown in Table 4. The low correlation coefficients between the various indicators indicate that there is individual heterogeneity in the green development of the sample manufacturing companies in China, and there is no high degree of consistency. However, low multicollinearity is precisely beneficial for econometric research.
Table 4.
Pearson correlation coefficient matrix.
3.4.2. Benchmark Regression Analysis
In this section, Model (1) is used to explore the impact of managerial myopia behavior on corporate sustainable development performance. The first and second columns examine the current and lagged effects of managerial myopia behavior on corporate sustainable development performance while controlling for necessary company characteristics. The baseline regression results can be seen in Table 5. From Table 5, it can be seen that the coefficient of the independent variable in the current period is −0.0175 with a t-value of −2.15, which is significant at the 5% level; the coefficient of the lagged period is −0.0169 with a t-value of −1.92, which is significant at the 10% level.
Table 5.
Baseline regression results.
The results show that, under the control of relevant variables, managerial myopia behavior has a significant negative impact on corporate sustainable development performance in both the current and lagged periods. The more severe the managerial myopia behavior, the greater the harm to corporate sustainable development performance. To reduce the impact of endogeneity, the lagged period still has a significant effect, indicating the robustness of our conclusion. Therefore, it is confirmed that managerial myopia behavior does indeed have a negative impact on corporate sustainable development performance, thus verifying hypothesis H1.
3.4.3. Robustness Tests
- 1.
- Substitution of explanatory variables
Inspired by Lundstrum [44] and Cao et al. [45], the ratio of R&D expenditure to current operating income is used as an alternative indicator of managerial myopia (represented by Myopia1). A larger Myopia1 value indicates a higher level of managerial myopia. The regression results using this alternative indicator are shown in column (1) and column (2) of Table 6, with a coefficient of −0.0008, significant at the 1% level, consistent with the previous test results.
Table 6.
Robustness test.
- 2.
- Replacement regression models
As the values for sustainable development performance, calculated using the entropy method, fall between 0 and 1, a panel Tobit model is used for robustness testing. It can more accurately estimate the influence of variables and avoid bias caused by truncated data. Column (3) in Table 6 presents the regression results, with a coefficient of −0.0203 for Myopia, which is significant at the 5% level, indicating that the negative impact of managerial myopia behavior on corporate sustainable development performance still holds true and has good robustness.
3.4.4. Endogeneity Test: Instrumental Variable Approach
In order to verify the impact of managerial myopia behavior on corporate sustainable development performance, an instrumental variable approach is used to address any potential endogeneity issues. Following the previous research [46], the industry average of managerial myopia is used as the instrumental variable. The industry average level is considered to be an external factor that is relatively independent of individual company characteristics, representing the overall level or trend of the industry. By comparing individual company’s managerial myopia behavior with the industry average level, this paper can provide an external reference standard, thereby eliminating differences between individual companies and more accurately assessing the independent impact of managerial myopia behavior on corporate sustainable development performance. To be a suitable instrumental variable, it needs to meet the criteria of relevance and exogeneity. First, we need to verify its relevance. Based on the regression results in the first stage of Table 7, it can be seen that the average myopic behavior of managers in an industry is correlated with the myopic behavior of individual managers. In the first-stage regression, the F-statistic is 170.5, well above the threshold of 10, indicating a strong correlation between the industry average and individual myopic behavior. Secondly, we further verify the exogeneity by eliminating potential influencing mechanisms one by one. The industry average level of managerial myopia behavior may directly affect corporate sustainable development performance or indirectly impact it through green innovation. Therefore, we regressed the industry average level of managerial myopia behavior with both corporate sustainable development performance and green innovation, and the results showed no significant correlation. This satisfies the requirement for exogeneity.
Table 7.
Results of the instrumental variable tests.
Therefore, the industry average satisfies the basic requirements for an instrumental variable. The 2SLS regression using the industry average of managerial myopia as the instrumental variable yields significant results, and in addition, we conducted a Hausman test to compare the regression coefficients between the 2SLS method and the original regression. The results of this test showed a significant difference between the two methods, indicating that there is no obvious endogeneity issue.
The results of the instrumental variable tests are shown in Table 7.
4. Further Analysis
4.1. Role Channel Testing
As discussed in the previous section, the proposed mediating variables form dimensions of sustainable development performance and have a theoretical and intuitive connection with the explanatory variable. Given the limitations of stepwise approach [47], this study is consistent with Jiang Ting’s (2022) [48] view on mediation effects in causal inference empirical research. Firstly, this study is shifted to improving the credibility of identifying the causal relationship between the core explanatory variable X and the accepted variable Y. Secondly, according to the economic theory, one or more mediating variables M that reflect the channels through which the mediating variables affect the explained variable should be identified. The impact of M on Y should be direct and evident, and the same method that is used in the first step should be used to identify the causal relationship between D and M.
4.1.1. Assets’ Financialization
This study empirically tests hypothesis H2a by specifying Model (2). Following the previous research and taking inspiration from Demir et al. [46] and Song Jun and Lu Yang (2015), the proportion of financial assets held by a company is used to represent the level of financialization. Based on a company’s balance sheet, the calculation formula for financialization (Finance) is as follows: Finance = (trading financial assets + derivative financial assets + net amount of loans and advances given + net amount of available-for-sale financial assets + net amount of held-to-maturity investments + net amount of other equity investments)/total assets.
The results of the mediation regression analysis for Model (2) are shown in Table 8. Column (1) shows that, without adding control variables, managerial myopia behavior promotes financialization in companies at a significant level of 10%. Column (2) shows that, with the addition of control variables, managerial myopia behavior still significantly promotes financialization at a level of 5%. These data indicate that, when managers are myopic, they tend to invest more of their capital in financial assets, with a higher level of myopia leading to a higher level of financialization in companies. The analysis approach of “managerial myopia behavior-corporate financialization-inhibition of corporate sustainable development performance” in the theoretical analysis has been supported by data analysis. Therefore, hypothesis H2a is supported.
Table 8.
Results of the action channel test.
4.1.2. Green Innovation Capacity
To test hypothesis H2b and examine whether green innovation plays a mediating role, Model (3) was constructed. Following the previous research [7], the number of green patents was used as a measure of a company’s green innovation capability, represented by Greeninnovation. A higher value indicates a stronger green innovation capability.
The results of the mediation regression analysis for Model (3) are shown in Table 8. Column (3) shows that, without adding control variables, managerial myopia behavior inhibits a company’s innovation capability at a significant level of 5%. Column (4) shows that, with the addition of control variables, managerial myopia behavior still significantly inhibits a company’s innovation capability at a level of 10%. These data indicate that, when managers are myopic, they tend to avoid risky and long-term green innovation investments, thereby inhibiting a company’s innovation capability. The analytical approach of “managerial myopia behavior - inhibition of company green innovation - inhibition of corporate sustainable development performance” in the theoretical analysis has been supported by data analysis. Therefore, hypothesis H2b is supported.
4.2. Mechanisms of Action Test: Media Attention
The selection of media attention was based on scholars such as Subin et al. and Jinwen et al. [35,49] and mainly included the coverage of online and print media. The calculation method is the sum of the number of news articles mentioning the company in media and newspapers, divided by 1000. The higher the value of this variable, the stronger the media attention. First, we test the direct impact of managerial myopia on a company’s sustainable development.
In order to explore the possible moderating effect of media attention, this paper refers to the study by [35], and first constructs Model (4) and introduces a first-order moderator of media attention, Myopia∗Media in the regression model, which is used to test whether Media has a significant linear moderating effect on the relationship between the negative impact of managers’ myopia on firms’ sustainable development performance. Secondly, Model (5) is constructed to introduce the second-order moderator of media attention, Myopia∗Media2, to test whether media attention has a significant “inverted U-shaped” moderating effect on the negative impact of managers’ myopic behavior on corporate sustainability performance.
The regression results show that, after introducing the first-order moderating term Media, the R2 of the model remains unchanged, and the negative relationship between managerial myopia (Myopia) and a company’s sustainable development performance is still significant (β = −0.018, t = −2.16). However, the first-order moderating term media is not significant (β = 0.0194, t = 0.21), indicating that the linear moderating effect of media attention on the negative relationship between managerial myopia and a company’s sustainable development performance is not significant, as shown in Model (2) in Table 9. After introducing the second-order moderating term Myopia∗Media2, the R2 of the model increases to 0.0581, indicating an improvement in the overall explanatory power of the model, as shown in Model (3) in Table 9. The negative relationship between managerial myopia and a company’s sustainable development performance remains significant (β = −0.0174, t = −2.09), the sign of the first-order moderating term Media is negative, and the second-order moderating term Media2 is significant and positive (β = 0.2671, t = 1.68), confirming that media attention has a significant “inverted U-shaped” moderating effect on the negative relationship between managerial myopia and a company’s sustainable development performance, supporting hypothesis H3.
Table 9.
Results of the mechanism of action test.
5. Conclusions
As a long-term investment and strategic choice for companies, sustainable development not only promotes high-quality economic development but also achieves the harmonious coexistence of resources. Through theoretical analysis and empirical research, this study explores the impact of managerial myopia on a company’s sustainable development performance. Our results show the following: (1) managerial myopia negatively impacts a company’s sustainable development performance, with asset securitization and green innovation capability playing mediating roles and (2) media attention can moderate this causal relationship, but contrary to previous research findings, this study found that media attention has a significant “inverted U-shaped” moderating effect instead of a linear moderating effect on the relationship between managerial myopia and a company’s sustainable development performance.
The theoretical contribution of this paper is as follows: Firstly, based on the behavioral finance theory, the study incorporates managers’ time preference traits into the research on corporate sustainable development. This not only expands the factors influencing the performance of sustainable development at the individual level, but also enriches the literature on the economic consequences of managerial traits. Secondly, the study discovers a significant “inverted U” effect of media attention, further demonstrating the complex impact of information on individual decision making and expanding the discussion on media attention in the existing literature.
This research has practical implications: Firstly, our results provide novel insights into selecting and appointing senior management personnel in companies. Senior management personnel who hold long-term development philosophies are crucial to promoting green innovation at the micro level and achieving high-quality economic development. In addition to demographic characteristics such as age and education level, companies should also consider the cognitive characteristics of senior management personnel, such as time orientation. Efforts should also be made to develop and improve the market for “professional managers” and establish a continuous learning mechanism within the company, such as management knowledge exchange meetings and sustainable development seminars. This strategy would enrich managers’ knowledge reserves, help them make more accurate long-term decisions, and prevent irrational decisions based on personal short-term preferences. Secondly, when making investment decisions, managers should focus on long-term investments, avoid the excessive securitization of assets, and reasonably allocate funds to avoid over-reliance on the financial market. At the same time, efforts to improve the company’s green innovation capabilities, increase investment in green innovation research and development, and effectively formulate sustainable development strategies using green process and product innovation to obtain environmental premiums, reduce resource constraints, and improve output efficiency should be made. Thirdly, managers should consider the impact of external attention and respond to external pressures rationally. The dual nature of media governance increases the negative impact of myopic managers on corporate sustainable development while improving information disclosure levels, enhancing corporate governance capabilities, and weakening myopic behavior’s negative impact on corporate sustainable development. Therefore, companies should not only use the media’s supervisory role to improve the quality of information disclosure and compensate for any potential shortcomings but also make reasonable judgments about the information overload brought about by media attention. Furthermore, they should cater blindly to mainstream media views that may be detrimental to sustainable development.
Furthermore, we should take a dialectical view of managers’ power and obligations and strengthen individual power balances and restraints. When individual power is too great, myopic managers often make decisions that harm the long-term interests of the company to maximize their interests, which are not conducive to long-term development. Therefore, companies should strengthen the balance and restraint of managerial power and use legislation to establish a sound internal control mechanism, strengthen the supervision and restraint functions of major shareholders, regulate company information disclosure, continuously optimize the internal control environment, strengthen long-term incentives for managers, and comprehensively improve corporate governance capabilities.
Author Contributions
Conceptualization, Y.C. and S.Z.; Methodology, Y.C.; Software, Y.C.; Validation, Y.C.; Formal analysis, Y.C.; Resources, Y.C.; Data curation, Y.C.; Writing—original draft, Y.C.; Supervision, S.Z.; Project administration, S.Z.; Funding acquisition, S.Z. All authors have read and agreed to the published version of the manuscript.
Funding
This research received no external funding.
Institutional Review Board Statement
Not applicable.
Informed Consent Statement
Not applicable.
Data Availability Statement
All date in the text were drawn by the author. The data used to support the findings of this study are available from the corresponding author upon request.
Conflicts of Interest
The authors declare no conflict of interest.
References
- Henry, L.A.; Buyl, T.; Jansen, R.J.G. Leading corporate sustainability: The role of top management team composition for triple bottom line performance. Bus. Strategy Environ. 2019, 28, 173–184. [Google Scholar] [CrossRef]
- Ma, X. On Corporate Environment and Corporate Sustainability. J. Manag. World 2010, 4, 1–4. [Google Scholar] [CrossRef]
- Hahn, T.; Figge, F.; Pinkse, J.; Preuss, L. Trade-offs in corporate sustainability: You can’t have your cake and eat it. Bus. Strategy Environ. 2010, 19, 217–229. [Google Scholar] [CrossRef]
- Li, R.; Peng, C.; Yang, X. Dual Innovation and Corporate Sustainable Development: The Mediating Role ofShort-Term Financial Performance and Long-Term Competitive Advantage. Sci. Technol. Prog. Policy 2019, 36, 81–89. [Google Scholar]
- Chowdhury, S.; Dey, P.K.; Rodríguez-Espíndola, O.; Parkes, G.; Tuyet, N.T.A.; Long, D.D.; Ha, T.P. Impact of Organisational Factors on the Circular Economy Practices and Sustainable Performance of Small and Medium-sized Enterprises in Vietnam. J. Bus. Res. 2022, 147, 362–378. [Google Scholar] [CrossRef]
- Bai, X.; Ma, X.; Yue, D. Can the Relative ESG Gap Reduce Managerial Myopia? A Study Based on the “Tunnel Effect”. Sustainability 2024, 16, 3170. [Google Scholar] [CrossRef]
- Lu, Z.; Liang, Y.; Hu, Y.; Liu, Y. Is managerial myopia detrimental to corporate ESG performance? Int. Rev. Econ. Financ. 2024, 92, 998–1015. [Google Scholar] [CrossRef]
- Encinas Bartos, K.; Schwarzkopf, J.; Mueller, M. The role of trainings in improving supplier sustainability performance. World Dev. 2024, 175, 106482. [Google Scholar] [CrossRef]
- Hambrick, D.C.; Mason, P.A. Upper echelons: The organization as a reflection of its top managers. Acad. Manag. Rev. 1984, 9, 193–206. [Google Scholar] [CrossRef]
- Hui, S.; Jiao, Z. Managerial Overconfidence, Political Connection and Corporate Innovation Performance—A Study on the Mediating Role of Innovation Investment. East China Econ. Manag. 2018, 32, 124–132. [Google Scholar]
- Agarwal, V.; Vashishtha, R.; Venkatachalam, M. Mutual fund transparency and corporate myopia. Rev. Financ. Stud. 2018, 31, 1966–2003. [Google Scholar] [CrossRef]
- Xi, L.; Zhao, H. Senior Executive Dual Environmental Cognition, Green Innovation and Enterprise Sustainable Development Performance. Bus. Manag. J. 2022, 44, 139–158. [Google Scholar]
- Ke, D.; Li, L. Managerial power and R&D investment intensity of enterprise: The inhibitory effect of legal environment. Sci. Res. Manag. 2020, 41, 244–253. [Google Scholar]
- Shen, K. Can the roles of overseer and manager be merged: The fundamental question of administrative law system transformation. China Leg. Sci. 2016, 105–125. [Google Scholar] [CrossRef]
- Peráček, T.; Kaššaj, M. A Critical Analysis of the Rights and Obligations of the Manager of a Limited Liability Company: Managerial Legislative Basis. Laws 2023, 12, 56. [Google Scholar] [CrossRef]
- Matějková, J.; Pavelek, O. The Protective Purpose of the Contract and the Liability of an Expert Towards a Third Party in Czech, Austrian, and German Private Law. Balt. J. Law 2019, 12, 163–185. [Google Scholar] [CrossRef]
- Bluedorn, A.C.; Martin, G. The time frames of entrepreneurs. J. Bus. Ventur. 2008, 23, 1–20. [Google Scholar] [CrossRef]
- Stein, J.C. Efficient Capital Markets, Inefficient Firms: A Model of Myopic Corporate Behavior. Q. J. Econ. 1989, 104, 655–669. [Google Scholar] [CrossRef]
- Narayanan, M.P. Managerial Incentives for Short-term Results. J. Financ. 2012, 40, 1469–1484. [Google Scholar]
- Wahal, S.; McConnell, J.J. Do institutional investors exacerbate managerial myopia? J. Corp. Financ. 2000, 6, 307–329. [Google Scholar] [CrossRef]
- Hu, N.; Xue, F.; Wang, H. Does managerial managerial myopia affect long-term corporate investment?—Based on text analysis and machine learning. Manag. World 2021, 37, 139–156+11+19–21. [Google Scholar]
- Sheng, X.; Guo, S.; Chang, X. Managerial myopia and firm productivity: Evidence from China. Financ. Res. Lett. 2022, 49, 103083. [Google Scholar] [CrossRef]
- Guo, X.; Chen, F. The Impact of Managers’ Short-sightedness on Enterprises’ Green Innovation Output: The Intermediary Role of Earnings Management and R&D Investment. Soft Sci. 2023, 37, 122–128. [Google Scholar]
- Ding, H.; Jiang, F.; Zhang, S.; Zhang, Z. Managerial myopia and corporate social responsibility: Evidence from the textual analysis of Chinese earnings communication conferences. J. Behav. Exp. Financ. 2024, 41, 100886. [Google Scholar] [CrossRef]
- Yang, T.; Liu, X.; Wang, Y. Corporate financialization, management background, and corporate innovation investment. Macroeconomics 2024, 33–47. [Google Scholar] [CrossRef]
- Barton, J. Does the Use of Financial Derivatives Affect Earnings Management Decisions. Account. Rev. 2001, 76, 1–26. [Google Scholar] [CrossRef]
- Tori, D.; Onaran, O. The Effects of Financialisation and Financial Development on Investment: Evidence from Firm-Level Data in Europe. 2017. Available online: https://gala.gre.ac.uk/id/eprint/16089/7/16089%20Tori%20and%20Onaran_effect%20of%20financialization%20and%20financial%20development%20on%20investment%20FEPS%20REPORT%2061216.pdf (accessed on 3 May 2024).
- Seo, H.-J.; Kim, H.S.; Kim, Y.C. Financialization and the Slowdown in Korean Firms’ R&D Investment. Asian Econ. Pap. 2012, 11, 35–49. [Google Scholar]
- Du, Y.; Zhang, H.; Chen, J. The Impact of Financialization on Future Development of Real Enterprises’ Core Business: Promotion or Inhibition. China Ind. Econ. 2017, 113–131. [Google Scholar] [CrossRef]
- Xie, X.; Zhu, Q. How Can Green Innovation Solve the Dilemmas of “Harmonious Coexistence”. J. Manag. World 2021, 37, 128–149+9. [Google Scholar]
- Fang, X.; Na, J. Stock Market Reaction to Green Innovation:Evidence from GEM Firms. Econ. Res. J. 2020, 55, 106–123. [Google Scholar]
- Singh, S.K.; Giudice, M.D.; Chierici, R.; Graziano, D.J.T.F.; Change, S. Green innovation and environmental performance: The role of green transformational leadership and green human resource management. Technol. Forecast. Soc. Change 2019, 150, 119762. [Google Scholar] [CrossRef]
- Mugerman, Y.; Steinberg, N.; Wiener, Z. The exclamation mark of Cain: Risk salience and mutual fund flows. J. Bank. Financ. 2022, 134, 106332. [Google Scholar] [CrossRef]
- Dyck, A.; Volchkova, N.; Zingales, L. The Corporate Governance Role of the Media: Evidence from Russia. J. Financ. 2008, 63, 1093–1135. [Google Scholar] [CrossRef]
- Wen, S.; Zhou, L. The Influencing Mechanism of Carbon Disclosure on Financial Performance—“Inverted U-shaped” Moderating Role of Media Governance. Manag. Rev. 2017, 29, 183–195. [Google Scholar]
- Zhang, Y.; Xing, C.; Zhang, Y. The Impact of Media Coverage on Green Technology Innovation of High-Polluting Enterprises. Chin. J. Manag. 2021, 18, 557–568. [Google Scholar]
- Huang, R.; Chu, F. The Central Supervision of Eco-environmental Protection, Pressure of Economic Performance Appraisal, and Corporate Greenwashing. J. China Univ. Geosci. (Soc. Sci. Ed.) 2023, 23, 70–86. [Google Scholar]
- Bloomfield, R.J.; Wilks, T.J. Disclosure Effects in the Laboratory: Liquidity, Depth, and the Cost Of Capital. Account. Rev. 2000, 75, 13–41. [Google Scholar] [CrossRef]
- Zhou, S.; Chen, R. Research on the Sustainable Development of Chinese Public Companies. China Soft Sci. 2000, 6, 46–49. [Google Scholar]
- Xu, G.; Tan, X.; Hu, S. Comprehensive evaluation of the operational performance of listed companies and its empirical research. Stat. Res. 2000, 44–51. [Google Scholar] [CrossRef]
- Gao, B.; Qin, X. The evaluation system and methods for the sustainable development capacity of small and medium-sized enterprises. Stat. Decis. 2017, 8, 178–181. [Google Scholar] [CrossRef]
- Krajnc, D.; Glavič, P. A model for integrated assessment of sustainable development. Resour. Conserv. Recycl. 2005, 43, 189–208. [Google Scholar] [CrossRef]
- Marginson, D.; McAulay, L. Exploring the debate on short-termism: A theoretical and empirical analysis. Strateg. Manag. J. 2008, 29, 273–292. [Google Scholar] [CrossRef]
- Lundstrum, L.L. Corporate investment myopia: A horserace of the theories. J. Corp. Financ. 2002, 8, 353–371. [Google Scholar] [CrossRef]
- Cao, G.; Yang, J.; Lin, C. CEO reputation and investment myopia behavior. J. Ind. Eng. Eng. Manag. 2017, 31, 45–51. [Google Scholar]
- Yu, H. Enterprises Financialization: The Reasons from the Viewof Manager’s Myopia. Bus. Manag. J. 2022, 44, 55–71. [Google Scholar]
- Wen, Z.; Chang, L.; Hau, K.-T.; Liu, H.Y. Testing and Application of the Mediating Effects. Acta Psychol. Sin. 2004, 36, 614–620. [Google Scholar]
- Jiang, T. Mediating Effects and Moderating Effects in Causal Inference. China Ind. Econ. 2022, 5, 100–120. [Google Scholar] [CrossRef]
- Ou, J.; Chen, Y.; Lin, Z. Media Attention of Charitable Donations and Enterprise Innovation. Foreign Econ. Manag. 2021, 43, 111–122. [Google Scholar]
Disclaimer/Publisher’s Note: The statements, opinions and data contained in all publications are solely those of the individual author(s) and contributor(s) and not of MDPI and/or the editor(s). MDPI and/or the editor(s) disclaim responsibility for any injury to people or property resulting from any ideas, methods, instructions or products referred to in the content. |
© 2024 by the authors. Licensee MDPI, Basel, Switzerland. This article is an open access article distributed under the terms and conditions of the Creative Commons Attribution (CC BY) license (https://creativecommons.org/licenses/by/4.0/).