Abstract
Turkey is attempting to achieve carbon neutrality targets by implementing environmentally friendly techniques. This study aims to assess the short- and long-term relationships between Turkey’s annual carbon emissions and economic growth, as well as annual electricity generation from renewable fossil fuels. Data for this study were obtained from the World Bank and the official website of the Turkish Statistical Institute (TURKSTAT) from 1986 to 2020. The Autoregressive Distributed Lag Bound Test (ARDL) technique was used to estimate variable cointegration. The cointegration test shows a long-run relationship between the selected variables. A 1% increase in the GDP, COAL, and PTRLGZ variables increases CO2 emissions by 0.65%, 33%, and 7%, respectively. The RE variable was found to have a negative effect on CO2 emissions. The effect of the RE variable on CO2 emissions is −0.10. This result indicates that a 1% increase in the RE variable reduces CO2 emissions by 0.10%. Looking at the short-term data, the error correction coefficient (CointEq (−1)) was found to be negative (−0.832) and significant. Based on the error correction variable, it is expected that the short-run deviations from equilibrium will be corrected and that a long-run equilibrium will be reached in less than one year. The long-run results also suggest that the factors used in the model have a statistically significant effect on the dependent variable. While this effect is negative for annual electricity production from renewable energy sources, it is positive for annual electricity production from fossil fuels and gross domestic product (GDP).
1. Introduction
At the global level, the primary objectives for a sustainable future are to optimize energy use, enhance energy efficiency, and reduce greenhouse gas emissions [1,2]. A low-carbon economy, which is a crucial method for achieving these objectives, is inextricably linked to the concept of an economy based on renewable green energy. An economy that is low-carbon provides a framework for achieving economic development goals by using sustainable energy resources. This framework includes the use of energy sources that are reusable and have lower carbon outputs, such as water, wind, and ocean currents [3]. It is well documented that the production of energy, particularly from fossil fuels, results in an increase in carbon dioxide (CO2) levels in the atmosphere [4,5,6,7] and contributes to climate change [8,9,10]. The substitution of clean and renewable energy sources for fossil fuels is a necessary condition for sustainable growth [11,12]. However, it is also a critical factor in reducing global carbon emissions [7]. In this context, the transition to an economy with lower carbon emissions is of paramount importance, particularly for developing countries, which rely heavily on fossil fuels and contribute significantly to global greenhouse gas emissions [13].
This study examines the long-run and short-run relationships between Turkey’s annual carbon emissions and economic growth and total annual electricity production from renewable and fossil resources between 1986 and 2020. The study used the ARDL bounds test to assess long-run cointegration. The study also used the Granger causality test to identify causal relationships between the variables. This study makes a significant contribution to the existing literature on Turkey’s green energy economy, low carbon economy, and sustainable development policy by analyzing the evolution of electricity production by energy source over a 34-year period and its relationship with carbon emissions.
In previous studies that have examined the relationship between the variables of energy use, economic growth, and the environment, it can be seen that research has been conducted in the context of environmental indicators (carbon emissions, ecological footprint), production indicators by energy source (renewable energy production, fossil fuel energy production, nuclear energy production), and economic indicators (economic growth, trade openness). These studies are summarized in Table 1.

Table 1.
Previous literature that used similar variables and models.
Looking at similar studies on the topic, it can be seen that many comprehensive studies have been conducted on the relationship between carbon emissions as the dependent variable and economic development, renewable energy, and non-renewable energy sources. However, most studies examining the relationship between carbon emissions and energy focus on energy consumption [9,14,16,21,27], and very few studies [22] examined the impact of the type of energy generation (renewable and non-renewable) on carbon emissions.
Among these studies, Udeagha and Ngepah [9] examined the factors affecting CO2 emissions, with the ARDL simulation model in South Africa. This study estimated that the effect of hydropower consumption, nuclear energy consumption, and technical effect variables on CO2 emissions is negative, while scale effect, oil, coal, and natural gas consumption, along with the trade openness have a positive effect. In the study conducted by Mehmood [24], the relationship between the dependent variable (carbon emissions) and the independent variables, which are foreign direct investments, government effectiveness, GDP, and renewable energy use in South Asian countries, were investigated with the help of the Westerlund panel cointegration test along with the CS-ARDL model. While the Westerlund panel cointegration test revealed a strong relationship between the variables, the long-run estimation of the model results indicated that renewable energy and government activity had a negative effect on carbon emissions, and a positive relationship was found between GDP and FDI.
Noureen et al. [27] studied the relationship between macroeconomic policies and the quality of the environment in terms of monetary and fiscal policies. This study used ARDL, CCEMG, AMG, Westerlund cointegration, and Granger causality tests. Results of the study, in the long run, reveal that increasing energy use produced by renewable sources will cause a reduction in carbon emission levels. In contrary to this, increasing GDP will cause an increase in carbon emission levels. The Dumitrescu and Hurlin causality test results showed a unidirectional causality between energy from renewable sources and carbon emissions, specifically from renewable energy to carbon emissions. In Kartal [23], the relationship between fossil fuel energy, energy production from renewable resources, nuclear energy, and the carbon emissions caused by energy consumption has been investigated using the DYARDL model. In the long run, both ARDL and DYNARDL model results have shown consistency, revealing that energy production from fossil resources and energy produced by nuclear power plants causes an increase in carbon emissions from energy consumption. In contrast, renewable energy production has a decreasing effect. Jahanger et al. [22], in their study, estimated the relationship between carbon emissions and hydroelectricity production, economic growth, and urbanization using QARDL and Granger causality. The long-run cointegration parameter estimated that carbon emissions are affected positively by economic growth. The results of this study state that this relationship was found to be insignificant at lower carbon emission levels but significant at higher levels. The results showed that hydroelectric production decreased carbon emissions only at high quantile levels, while urbanization contributed significantly to carbon emissions. Granger causality test results between carbon emissions and hydroelectric production showed a two-way causality. In this context, existing studies provide evidence that electricity produced and consumed predominantly using fossil resources increases CO2 emissions while reporting that using renewable energy sources is effective in reducing carbon emissions.
Turkey is in the middle of this difficult transformation process as energy demand is rapidly increasing and energy production is dominated by fossil fuels. In Turkey, power plants dominate overall electricity production and account for more than 69% of total electricity production. According to the Ministry of Energy and Natural Resources of the Republic of Turkey [29], it was estimated that Turkey’s electricity consumption will increase by 8.74% to 332.9 billion kWh in 2021 compared to 2020 and electricity generation will increase by 9.14% to 334.7 billion kWh compared to 2020. According to TURKSTAT greenhouse gas emission statistics, the largest share of greenhouse gas emissions in CO2 equivalents in 2020 was caused by energy-related emissions, namely 70.2%. Emissions from the energy sector were calculated at 367.6 million tons of CO2 eq. for 2020, which corresponds to an increase of 163.3% compared to 1990 and an increase of 0.6% compared to 2019. The year 2020 also shows that 85.4% of Turkey’s CO2 emissions in 2020 will be caused by the energy sector, 31.6% of which will be caused by electricity and heat generation [30]. According to the forecasts of the Turkey Electric Energy Demand Projection Report [31], electricity consumption in the period 2020–2040 is estimated at 370 TWh in 2025 and 591 TWh in 2040. Considering the fossil fuel-based electricity generation in Turkey, it is of key importance to limit the negative effects of this situation and to use the generated electricity in a more efficient and environmentally friendly way.
In this study, the effect of annual electricity production amount according to energy source on Turkey’s annual carbon emissions between 1986 and 2020 is evaluated. For this purpose, the total amount of carbon emissions (million tons), GDP per capita (constant 2015 US$), the amount of electricity production produced by coal consumption (GWh), the total electricity production produced by oil and natural gas consumption (GWh), and the total amount of electricity production (GWh) from renewable energy sources (GWh) variables have been used. The aim was to determine the long-run and causality relationships between these variables.
2. Materials and Methods
Within the range of the study, the model presented in Equation (1) was created to analyze the association between carbon emissions and electricity production according to energy sources in Turkey. While creating the model, using past studies, the variables that have been empirically demonstrated to have an impact on carbon emissions in past studies and variables that affect carbon emissions were included along with variables that have the possibility of causing similar effects. The GDP per capita variable, whose effect on CO2 has been demonstrated by numerous studies [19,23,27], was used in the model as a control variable. Also, electricity production amounts from different sources (coal, oil, natural gas, and renewable) have been included in the model.
In the equation, CO2 is the total carbon emission amount (million tons); GDP is the gross domestic product per capita (constant 2015 US$); COAL is the total amount of electricity that was produced by using coal (GWh); PTRLGZ is the total amount of electricity that was produced by oil and natural gas amount (GWh); RE indicates the total electricity production amount (GWh) from renewable energy sources (including hydraulic, geothermal, wind, solid biomass, solar, biogas, and waste resources); and εt indicates the error terms. Annual data for Turkey were used in the study for the 1986–2020 period. Natural logarithms of all variables were taken to examine the elasticity of the relationships between variables.
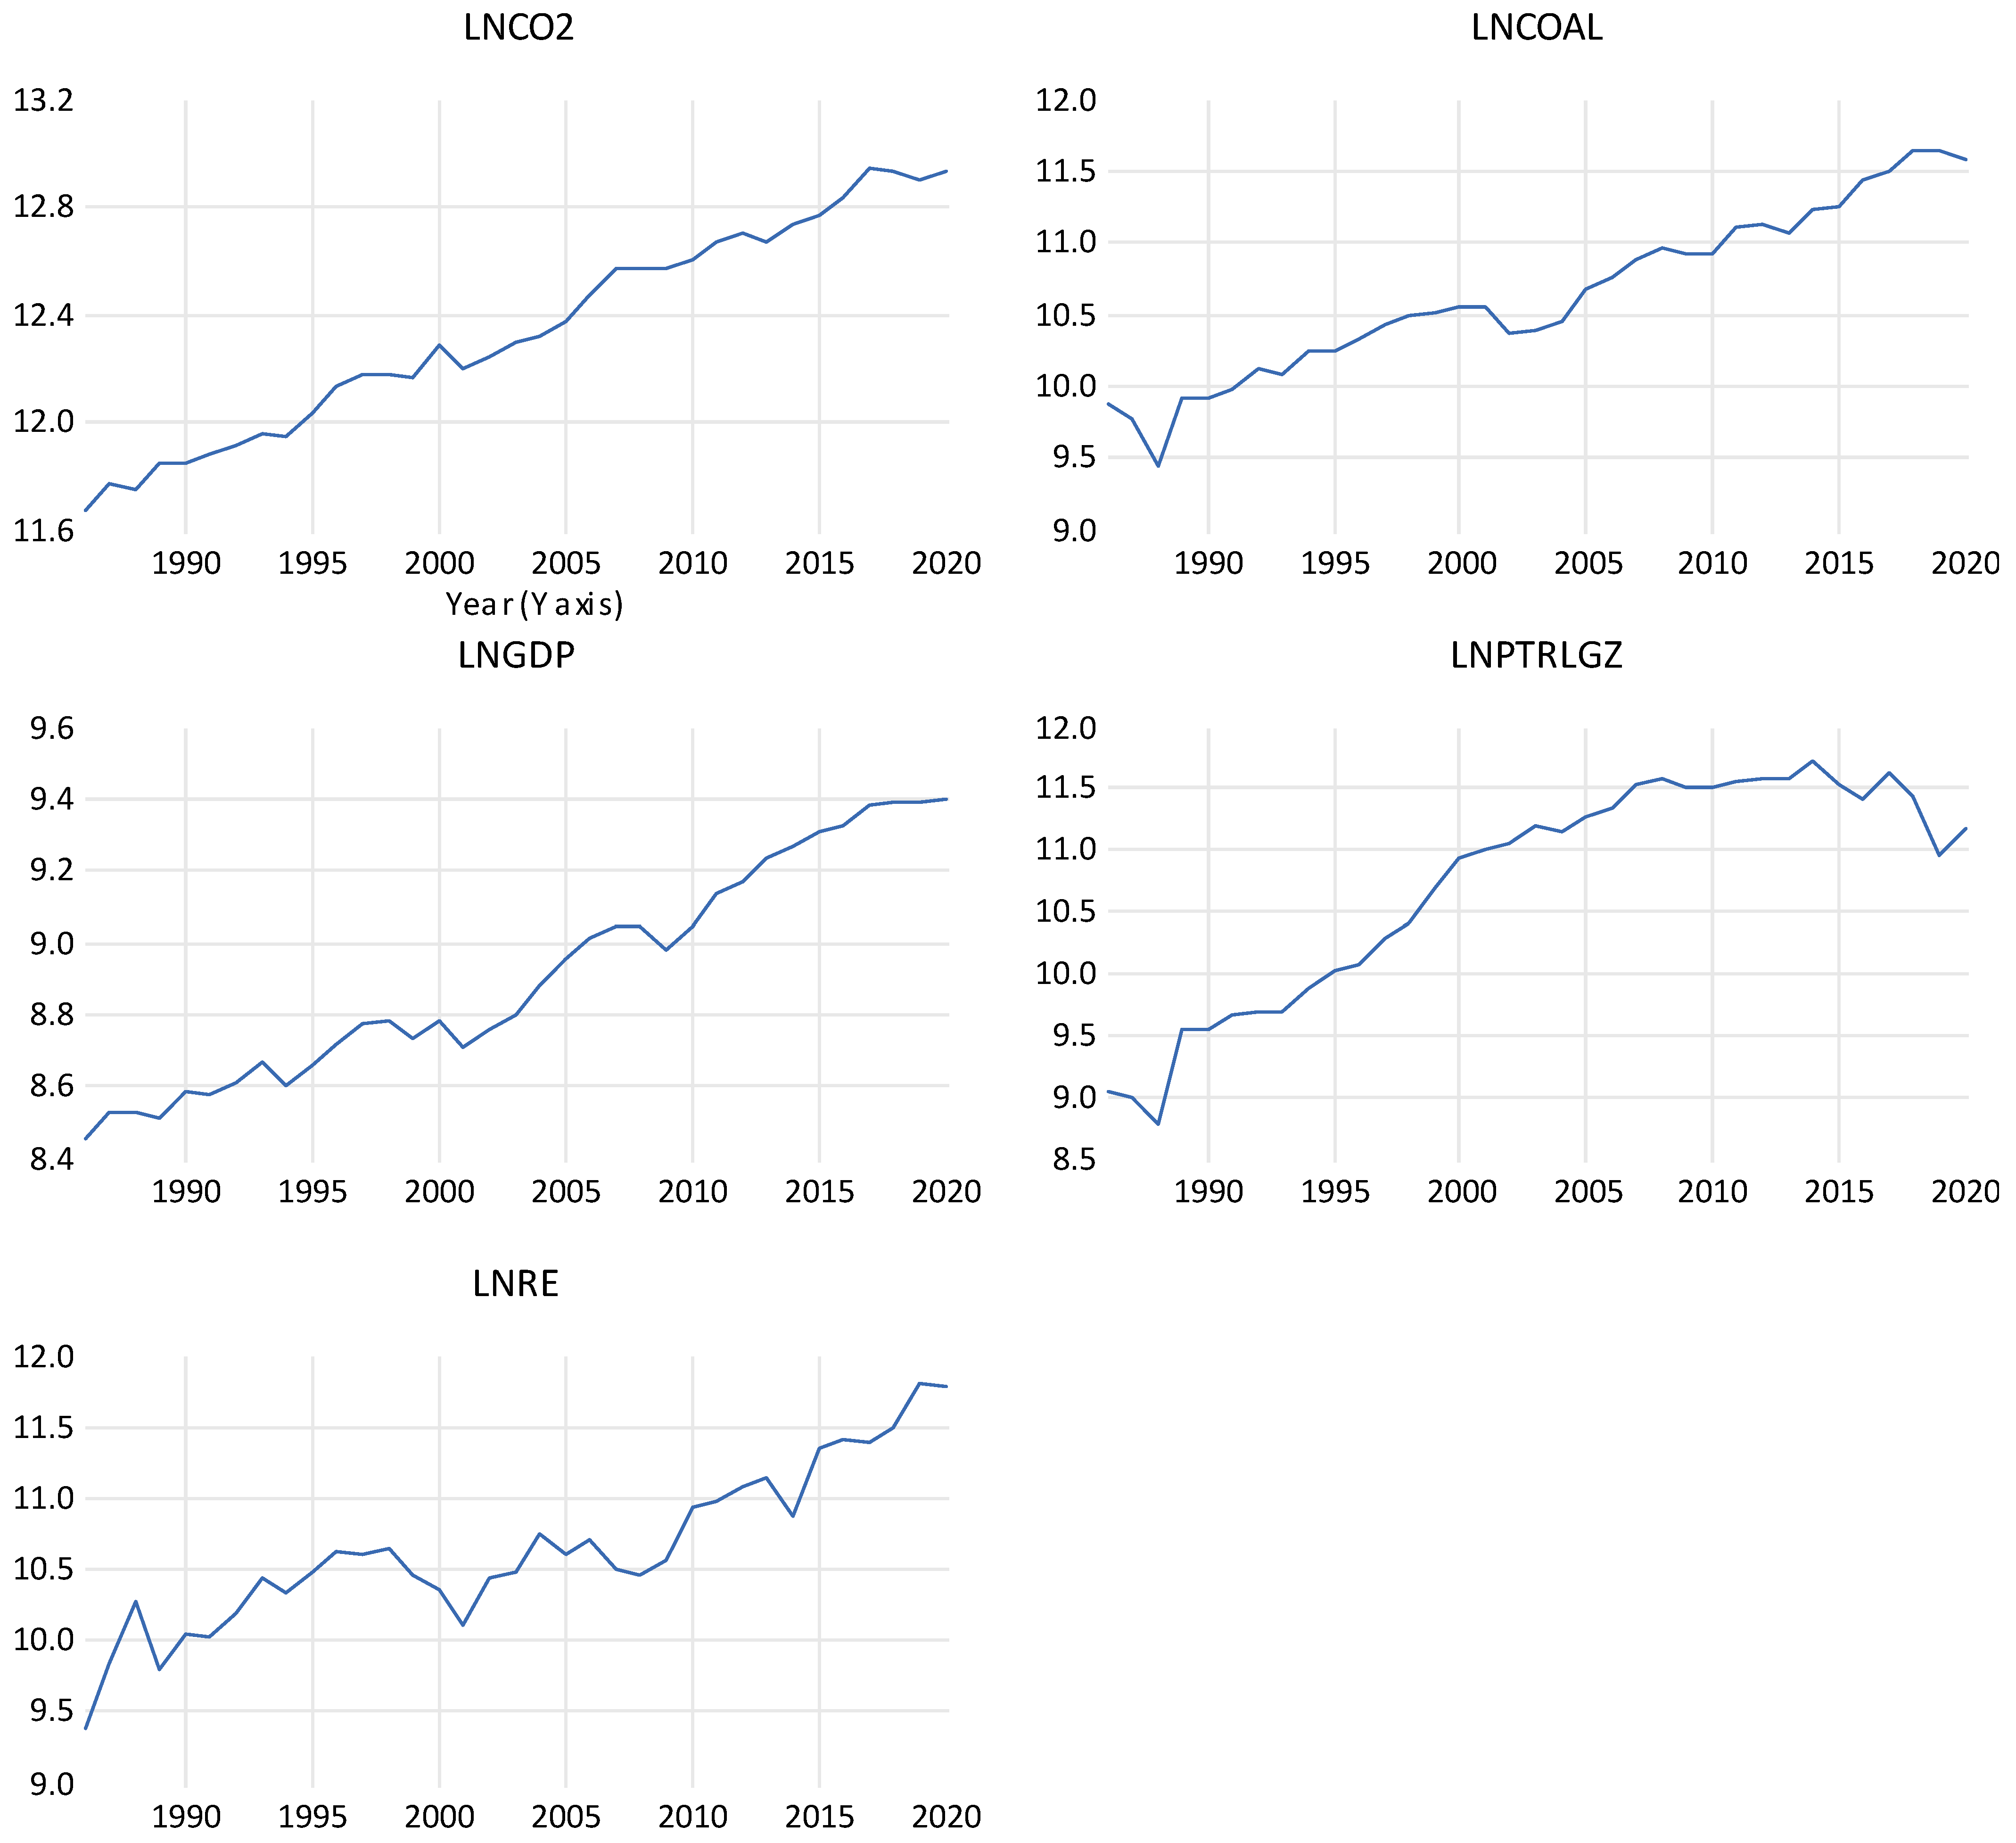
Details about the variables used and the expected effect of the independent variables that were included in the model on the dependent variable are given in Table 2. Accordingly, all sources except electricity produced by renewable energy sources are expected to cause a statistically significant and positive effect on emissions. Current studies in the literature justify the expected directions. Descriptive statistics about the variables are presented in Table 3, and the graphs of the variables are given in Figure 1.
Table 2.
Details about the variables.
Table 3.
Descriptive statistics about the variables.
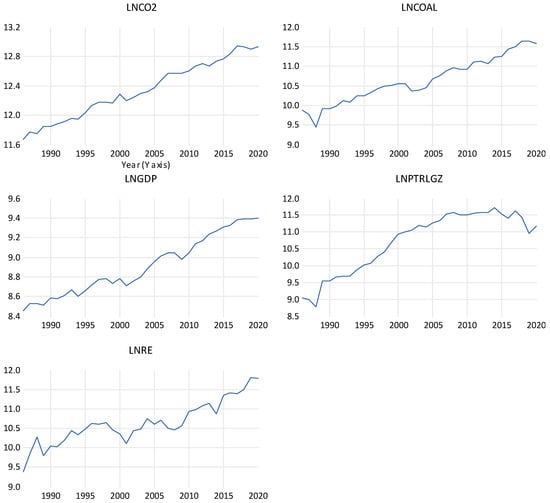
Figure 1.
Graphical representation of the variables in the model.
2.1. Unit Root Tests
The ARDL bound test approach and the Granger causality test, widely used in the literature for time series analysis, were used to investigate the relationship between electricity production and carbon emissions by energy source. Unit root tests are included because they are one of the first steps of both methods. These tests are used to estimate the degree of stationarity of variables, and the approach to be used in both cointegration and causality analysis is decided according to the results obtained. Augmented Dickey–Fuller (ADF) [33] and Phillips and Perron (PP) [34] tests were used, which are generally accepted unit root tests. The null hypothesis in both tests is that the variable under consideration has a unit root.
2.2. ARDL Bound Test
Looking at the literature, there are many cointegration tests to reveal the long-run relationships in time series. The first of these was developed by Engle and Granger [35], after which many alternative cointegration tests have been developed, most notably the multi-equation approach proposed by Johansen [36] and Johansen and Juselius [37]. These approaches, which are suitable for cointegration analysis for time series and possible economic situations, are not suitable for cointegration tests for equations with “I(0)” series that are stationary in the level state, due to the restrictions they have regarding stationarity. This constraint has been removed by the ARDL bounds test developed by Pesaran et al. [38]. Because of the ARDL bounds test approach, cointegration tests can be performed regardless of whether the stationarity levels of the series are I(0) or I(1). It should be noted, however, that the method can only be applied to I(0) and I(1) series, and the corresponding test cannot be applied to series that become stationary at I(2) or higher levels. Another important advantage of the ARDL bounds test is that it can produce successful results even with small samples. Narayan and Narayan [39] observed that the results obtained with the ARDL bounds test are more effective and unbiased compared to other cointegration tests and give more consistent results in small samples. Given these advantages, the analysis is carried out using the ARDL approach. In the study by Peseran et al. [38], alternative conditional error correction models were proposed that differ in the way the constant and trend terms are included in the model in the ARDL model equation. In this study, Case III, one of the conditional error correction models that includes the unrestricted constant and no trend, was used, and according to the corresponding model, the model presented in Equation (1) was formulated as follows (Equation (2)):
Equation (2) F-Bounds Test has been used to test the cointegration between the variables. The null hypothesis for this test states that no long-term relationship between the variables exists, “”. A long-run relationship between variables can be accepted if the resulting F-statistics is larger than the critical value H0 [40]. For the critical values utilized in the F-Bounds Test, reliance is placed on the values computed by Narayan [41]. The basic reason for using this choice is that the values by Narayan [41] can reach robust results even in small samples.
This approach uses the error correction model to understand the short-run relationships between variables. The error correction model for the equation created within the scope of the study (Equation (1)) can be formulated as follows (Equation (3)):
In this formula, ECT represents the error correction term that shows whether deviations from the equilibrium in the short-run will converge to the long-run equilibrium. The system can be expected to converge to long-run equilibrium by correcting deviations if the error correction term’s coefficient is found to be both negative and statistically significant.
2.3. Causality Test
The Granger causality test is a method of investigation widely preferred to determine the flow of information between time series [42]. The Granger causality test, developed by Granger [43], enables the investigation of causal relationships between two variables and the detection of feedback relationships. The Granger causality relationship between a variable Y and X is determined by estimating the models presented below (Equations (4) and (5)).
As the analysis is only possible with stationary data, differencing is applied until the variables become stationary. The Wald test is employed to ascertain the causal relationship between variables. If it is determined that both variables are Granger causes of each other, it can be inferred that a feedback link exists between the variables.
3. Results
3.1. Results of the Unit Root Test
To ascertain the stationarity of the variables to be analyzed, the Augmented Dickey–Fuller test (ADF) and Phillips and Perron unit root tests (PP) have been selected as the most appropriate statistical tools. The results are presented in Table 4. The ADF and PP tests indicate that all variables included in the model with constant terms can be considered stationary at the first difference [I(1)]. Since the ARDL bounds testing approach permits the variables to be stationary at I(0) or I(1), the data set has been confirmed to be suitable for the model.
Table 4.
Results of the ADF and PP unit root tests (constant).
3.2. ARDL Bound Test
To estimate the ARDL model, it is necessary to determine the most appropriate lag length among the available alternatives. Given the relatively limited number of observations in the study, 4 was identified as the maximum lag length. The most appropriate model was selected based on diagnostic tests and stability by reducing the lag numbers to 3, 2, and 1. The ARDL bound test results (1, 0, 1, 1, 2) are given in Table 5.
Table 5.
ARDL bound test.
As indicated in Table 5, the F-statistic value exceeds the critical value at a 1% level of significance. In this instance, the null hypothesis, H0 = β1 = β2 = β3 = β4 = β5 = 0, can be rejected. Consequently, the alternative hypothesis (H1), which posits the cointegration of the variables, must be accepted. As an unconstrained conditional error correction model (Case III) was employed in the study, the T-Bounds Test was also conducted in addition to the F-Bounds Test. The results demonstrated the existence of a cointegration relationship between the variables, with the T-Bounds Test indicating a statistically significant result at the 1% significance level. Once the cointegration relationship had been confirmed, the short- and long-run coefficients of the variables were estimated. The estimation results are presented in Table 6.
Table 6.
ARDL cointegration long- and short-run coefficients.
Upon examination of the short-run estimations presented in Table 6, it was found that the error correction coefficient (CointEq (−1)) was both negative and statistically significant. According to the model, deviations from equilibrium in the short run will be corrected, and the system will converge to long-run equilibrium. Again, in Table 6, where the long-run estimation results can be observed, all the independent variables that have been utilized in the model have a statistically significant effect on the dependent variable in the long run. The relationship between the total annual electricity production from renewable sources and energy sources is negative, whereas that between the electricity produced from fossil fuels and the same variables is positive. Furthermore, this relationship is positive for economic growth.
3.3. Diagnostic Tests for the Model
To ascertain whether the model is functional or not, diagnostic tests are performed. Table 7 presents the results of the diagnostic tests, which indicate that the test statistics for the automatic association, normality, varying variance, and modeling error tests are within an acceptable range for the predicted model in this study.
Table 7.
ARDL diagnostic test results.
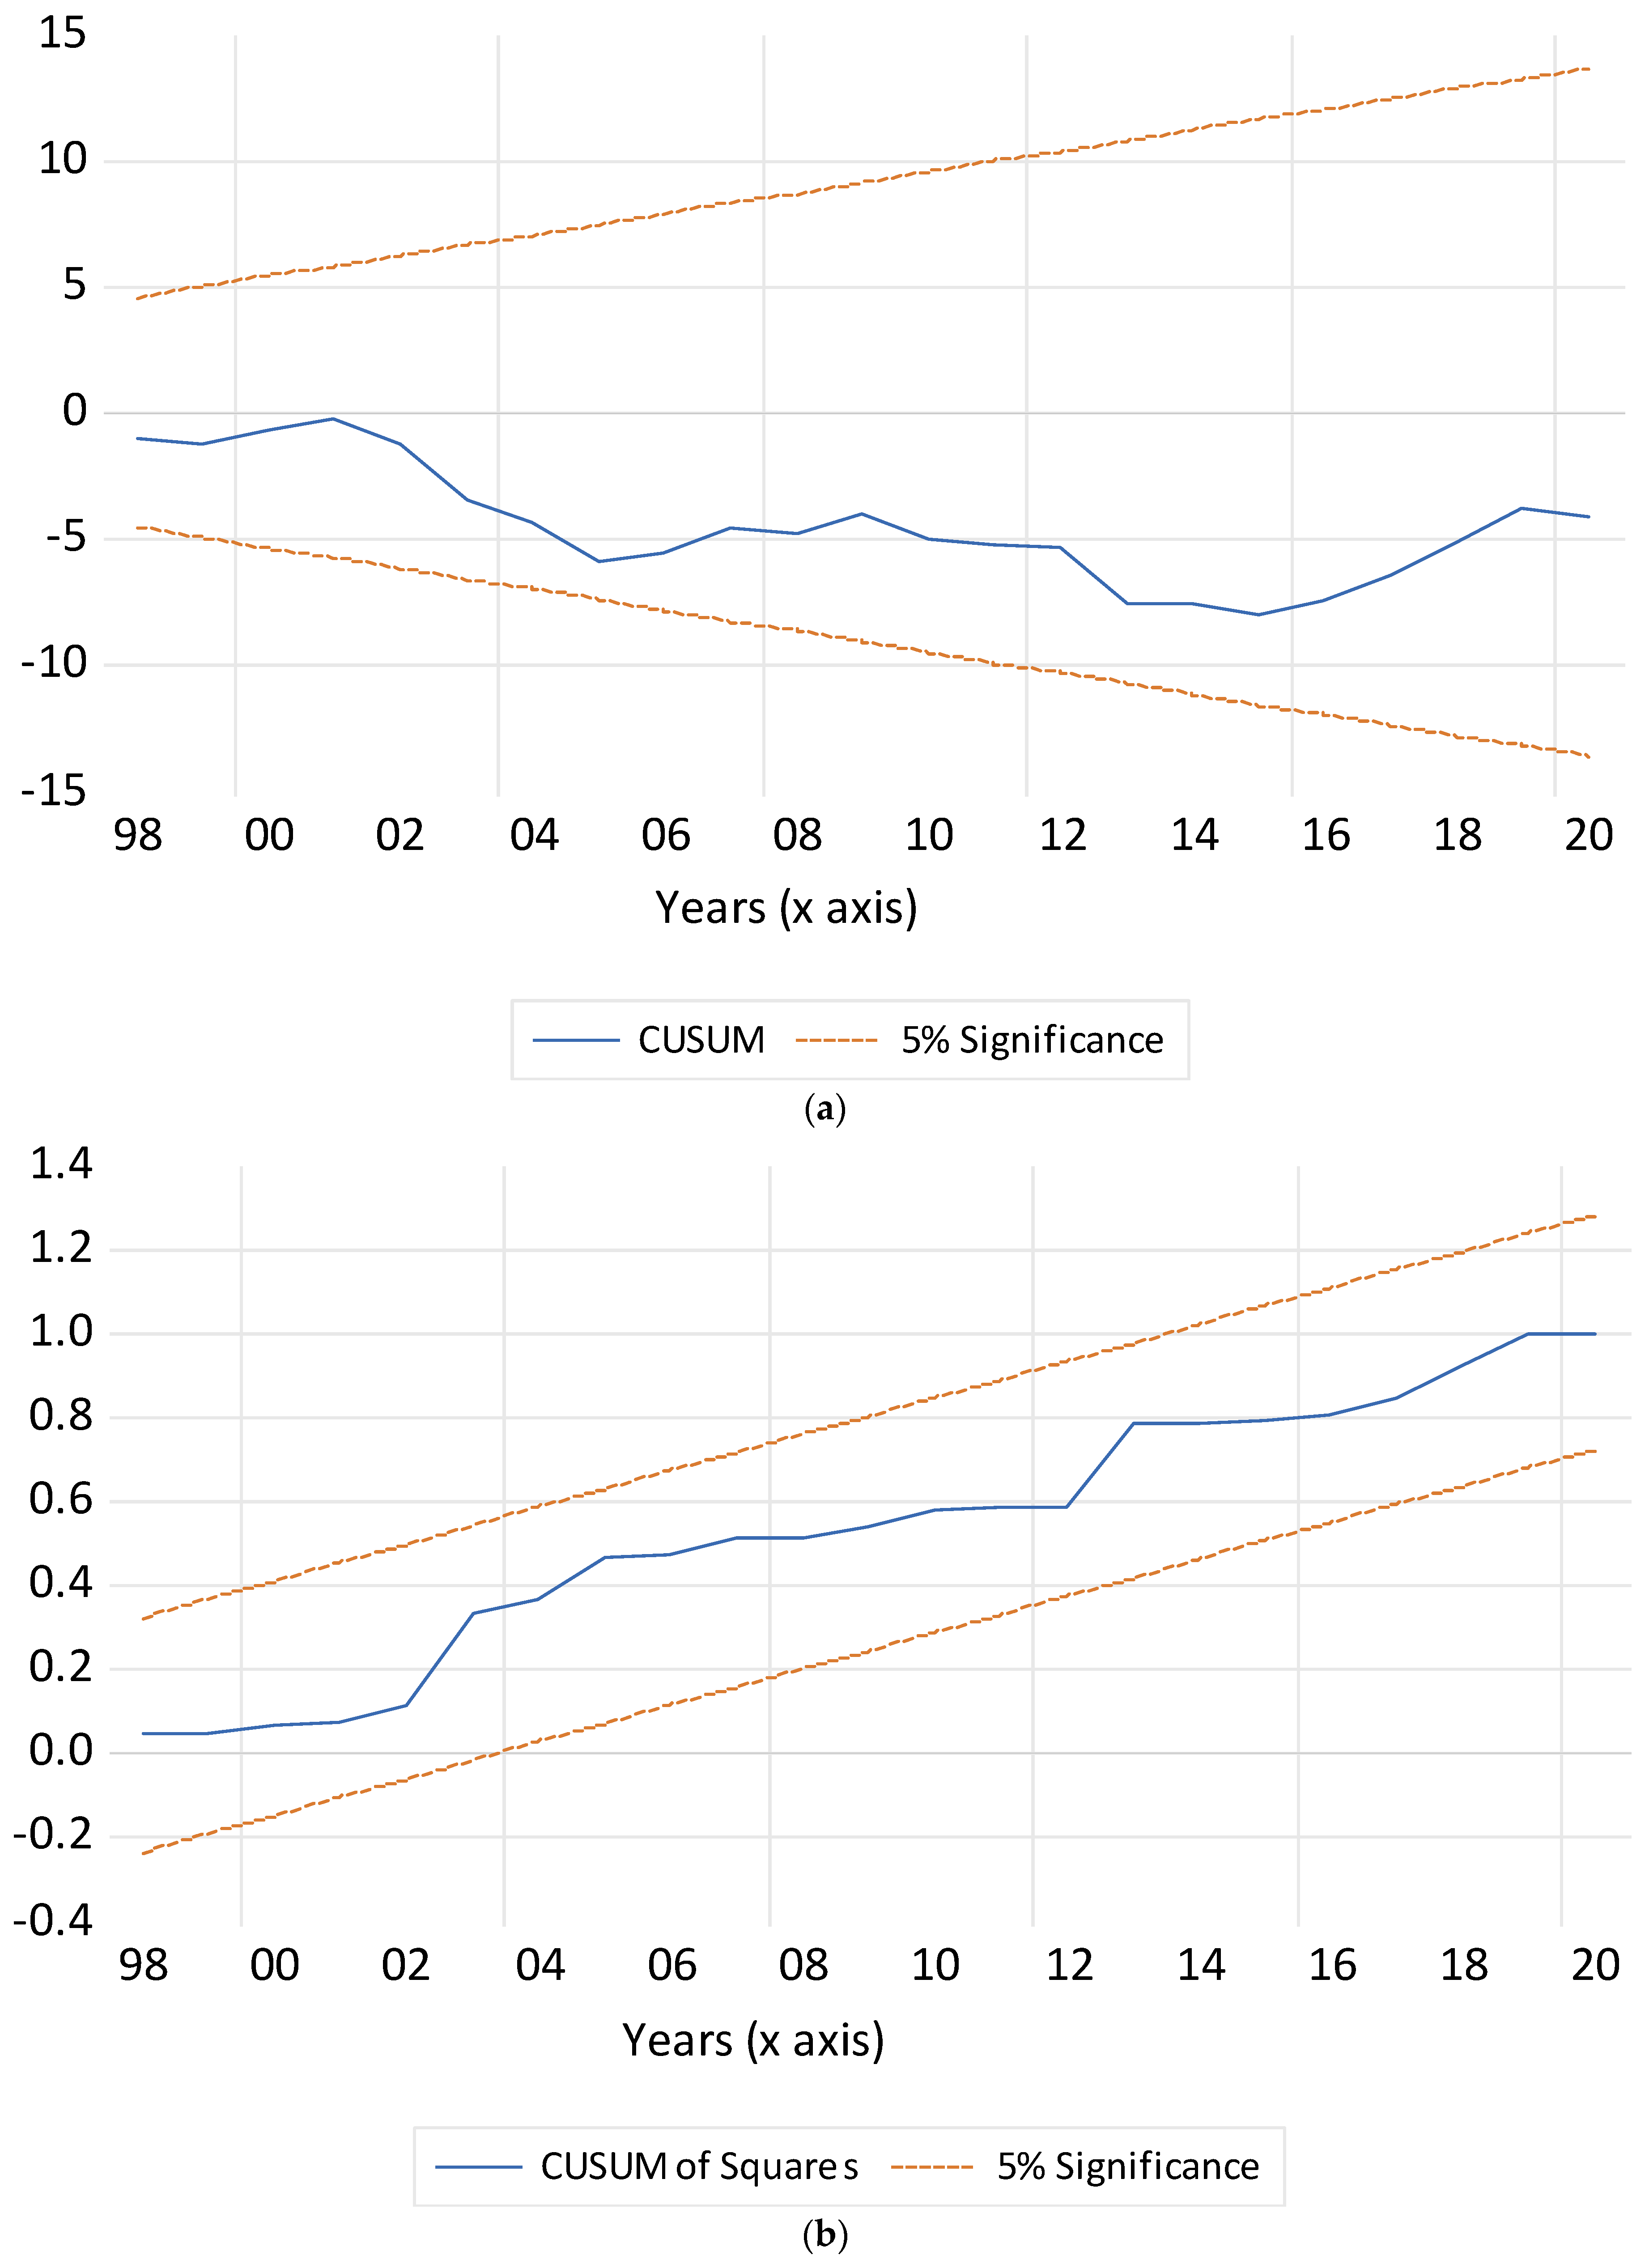
To test the stability of the model, CUSUM and CUSUMSQ tests were also conducted for the structural stability in the estimated long-run model. Figure 2a shows the ARDL model’s CUSUM test plots, and Figure 2b shows the model’s CUSUMSQ test plots. Since the test statistics for CUSUM and CUSUMQ are within the 5% critical value range, it can be said that the coefficients are stable in the long run, and in the long run, the model does not have a break.
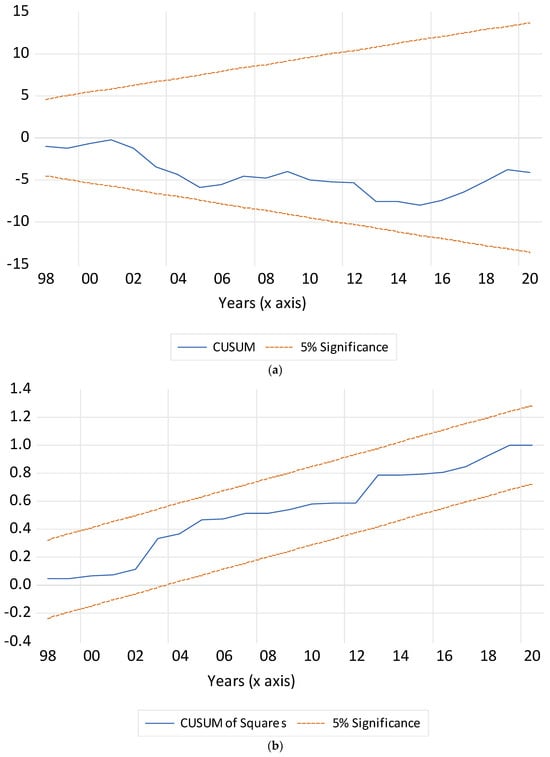
Figure 2.
(a) CUSUM stability test and (b) CUSUMSQ stability test.
3.4. FMOLS Test
The robustness and accuracy of the ARDL bounds test results were analyzed with the help of the FMOLS test as an alternative model. Table 8 includes FMOLS test results. And FMOLS test results are similar to ARDL test results.
Table 8.
FMOLS cointegration test results.
3.5. Granger Causality Test
To ascertain whether a causal relationship exists between the variables in question, a causality test developed by Granger was employed to analyze the data. The results of this test are presented in Table 9. The results indicate that there is a unidirectional causal relationship between carbon emissions and LNGDP per capita and LNCOAL. A feedback relationship has been identified between LNRE and LNCOAL. Additionally, a unidirectional causality relationship was identified between the LNRE and LNCOAL variables and the LNPTRLGZ variables.
Table 9.
Granger causality analysis.
4. Discussion
In the context of this study, the ARDL model was employed to estimate the elements that exert a long-run effect on carbon emissions, while the Granger causality test was utilized to ascertain the existence of a causal relationship between the variables. The estimated long-run results for the model were evaluated and found to be largely consistent with existing literature. A total of 69.31% of the electricity produced in Turkey between 1986 and 2020 was generated using fossil fuels, with coal-based electricity accounting for 30.87%, oil-based electricity for 4.5%, and natural gas-based electricity for 35.3%. Given that fossil fuel resources are used more intensively in electricity production, it can be expected that variables in the model, which are the annual electricity production amount produced by coal consumption (lnCOAL) and the annual total electricity production amount produced by oil and natural gas consumption (lnPTRLGZ), will have a positive effect on carbon emissions. Furthermore, studies demonstrating that the consumption of fossil fuels (non-renewable energy sources) has a positive effect on carbon emissions in the long term also support this view [9,16,23,27].
Renewable energy sources represent another category of energy utilized in the production of electricity. Approximately 30.69% of the electricity produced in Turkey between 1986 and 2020 was obtained from renewable energy sources, with hydraulic sources accounting for 26.09% and other renewable sources contributing 4.59%. Upon examination of the estimated results, it can be observed that there is a negative correlation between renewable energy sources and carbon emissions. Previous studies that have yielded comparable outcomes lend support to this perspective [14,16,21,23,24,25,27,44]. These findings indicate that the development of sustainable green energy sources (renewable energy sources) should be prioritized over the use of fossil fuels to reduce CO2 emissions.
Energy, which is the fundamental input for the production of goods and services that societies require, has a significant impact on the environment during the production, transformation, transfer, and consumption stages. Upon examination of these effects, the sustainability of non-renewable resources becomes a matter of significant importance. The extraction of a clean energy source from nature and its subsequent utilization as an input in the economic system have the potential to mitigate the pollution problem caused by the return of harmful wastes and emissions to the ecological system during the production and consumption of energy. The relationship between the economy, energy usage, and the environment cannot be denied. The increasing consumption opportunities of rapidly developing societies in many areas, coupled with economic development, have led to a significant increase in energy demand. The harmful wastes resulting from obtaining and consuming most of this energy demand from fossil fuels have the potential to seriously threaten human health and the ecosystem. The search for new energy sources has intensified in response to the changing environmental impact and increasing energy needs, which depend on the source and technology of energy production and consumption. Energy is derived from non-renewable sources, including oil, coal, natural gas, and nuclear materials.
Additionally, renewable resources, such as water, wind, and fusion, have been explored as potential alternatives in recent years. Nevertheless, the utilization of non-renewable energy sources does have an impact on the environment, with the emission of sulfur dioxide (SO2), nitrogen oxides (N2O4, N2O3, NO2, NO), methane (CH4), and carbon monoxide (SO2 and nitrogen oxides (N2O4, N2O3, NO2, NO)) all contributing to the formation of severe air pollution. Concurrently, these noxious gases give rise to global environmental issues attributable to the greenhouse gas effect, which continues to elevate global health to perilous levels and precipitate extreme weather conditions on a global scale. The development of energy resources as alternatives to fossil fuels may also have a negative impact on the environment. In addition to hydroelectric power plants, the construction of dams and reservoirs for the generation of electricity from water has resulted in the destruction of plant and animal communities beneath them, as well as the forced migration of local populations due to the disruption of their traditional habitats. While nuclear power plants, which have reached significant numbers in developed countries, are subject to intense debate regarding their reliability, the ability to store and dispose of nuclear waste without harming the entire ecosystem and people is viewed with suspicion.
In Turkey, which relies on fossil fuels as its primary source of energy (80%) and still exhibits a high level of dependence on fossil fuels, these carbon-based fuels have constituted a significant obstacle to green growth over the past 50 years. The growth of renewable energy sources is widely accepted as a clean energy solution. Furthermore, the beneficial impact on public health is also applicable to Turkey. Consequently, to achieve a complete transformation towards green growth in the country, it is essential to change the energy sources from a mix of fossil fuels to renewable energy. Although achieving this transformation in the short term is not straightforward, it may be possible to accelerate it with the implementation of certain policy measures. Among these are policies such as reducing foreign dependency on renewable energy technology, encouraging the private sector by shifting subsidies given to fossil fuel resources (especially coal) to renewable energy sources, introducing a mandatory carbon tax on businesses using fossil fuel energy, and increasing efficiency in energy use. In this manner, long-term measures can be implemented in the country to achieve green growth, combat climate change, and simultaneously achieve sustainable development goals.
It can be demonstrated that economic growth and development have a significant impact on CO2 emissions [45]. In general, during an economic recession, there is an increase in the unemployment rate, a decrease in purchasing power, a decrease in aggregate demand, an increase in interest rates, and an increase in inflation. Furthermore, businesses operating in such an environment encounter difficulty in investing in green energy sources. During these periods, governments often choose to relax environmental rules and regulations in order to increase the confidence of investors and economic activity. This encourages firms to use non-renewable or cheap energy sources, which in turn results in higher greenhouse gas emissions [44]. The ARDL model’s long-run estimation results indicate that GDP has a positive effect on carbon emissions. These estimations are consistent with those of other studies [9,20,22,24,26,28], which demonstrate a positive correlation between carbon emissions across various geographical regions.
5. Conclusions
The global population continues to grow, accompanied by an increase in per capita production. While expectations of underdeveloped countries to raise their living standards to the level of developed countries and the efforts of developed countries to have more of the world’s resources fuel the excessive consumption of raw materials, energy resources, and all kinds of natural resources, polluting economic activities, which are the source of harmful wastes and emissions released into the environment, continue to increase. The potential to prevent environmental harm is being continuously developed in response to new moral standards and emerging technologies. This process is driven by increasing environmental awareness and sensitivity, particularly in the context of environmental problems. Consequently, it seems inevitable that the issue of how to combat environmental problems in the context of growing economies and how to harmonize the priority of economic growth with the need to protect the environment will continue to be one of the most discussed problems of today and in the coming years. It is of great importance to gain an understanding of the factors that influence CO2 emissions to inform decision-making processes regarding climate change. Turkey has set a target of reducing carbon emissions by 21% by 2030. Nevertheless, the Climate Action Tracker has identified inconsistencies in Turkey’s approach to the Paris Agreement, describing the country’s commitment as “critically inadequate”. Despite Turkey’s commitment to reducing carbon emissions per the Paris Agreement, the country’s efforts to achieve a sustainable economy have not yielded the desired results. Turkey exhibits a high level of vulnerability concerning the majority of the climate vulnerability dimensions selected by the World Bank. This situation provides a compelling rationale for reducing carbon emissions in Turkey. In terms of environmental impact, the empirical results indicate that the generation of electricity in Turkey using both renewable and non-renewable resources has the following consequences: (i) The utilization of renewable energy sources in the generation of electricity results in a reduction in CO2 emissions. (ii) The consumption of fossil fuels for the generation of electricity has the effect of increasing CO2 emissions over the long term. This demonstrates that the generation of electricity using renewable energy sources results in a reduction in CO2 emissions compared to the use of fossil fuels (oil, coal, and natural gas).
For Turkey, which aims to achieve net-zero greenhouse gas emissions by 2053, the problem of dependence on fossil fuels for electricity generation needs to be addressed. According to the projection published by the Turkey Electric Energy Demand Projection Report [31], which forecasts energy consumption for the period 2020–2040, electricity consumption is estimated to be 370 TWh in 2025. In 2040, it will be 591 TWh. In 2022, electricity generation for Turkey will be from coal (34.6%), natural gas (22.2%), hydro (20.6%), wind (10.8%), solar (4.7%), geothermal (3.3%), and other sources (3.7%) [29].
Turkey is unable to fully exploit the potential of wind and solar energy, which is a significant advantage of its geographical location. To achieve its target of reducing greenhouse gas emissions to net zero by 2053, Turkey must first aim for an absolute emission reduction of at least 35% by 2030. In this context, policymakers should strive to achieve the technological innovation required to transition to renewable energy sources (such as wind, nuclear, biomass, solar, and hydroelectricity) instead of fossil fuels in electricity generation. Increasing renewable energy is possible with investment in green technologies. Given the high upfront costs associated with renewable energy projects and the necessity of government subsidies for both public and private sectors, it is recommended that Turkey strive to produce at least 75% of its electricity from renewable resources by 2030. This can be achieved by encouraging greater investment in the sector. In particular, the government should facilitate the gradual reduction in coal-based electricity generation. To attract investment, the government should provide incentives in the form of loans on favorable terms. Investment in green technologies will improve ecological quality by increasing renewable energy. The principal reason for the increase in greenhouse gas emissions is the consumption of fossil fuels, which causes immense environmental damage.
Turkey’s high dependence on non-renewable energy sources will pose an energy security problem for the economy in the future. Moving towards cleaner and renewable energy sources is also expected to reduce the risk of energy security. It is essential for the Turkish economy, which is largely dependent on imports for its energy needs, especially for non-renewable energy resources, and where foreign trade and current account deficits are increasing due to the import of such energy resources and where foreign exchange shortages are high, to increase the use of renewable energy in electricity generation and other areas.
The circular economy is attracting a lot of attention from researchers, policymakers, and entrepreneurs because of its importance in the process of achieving a balance between the economy, the environment, and society, contributing to the reduction in emissions and waste through more efficient reuse of resources and its expected impact on sustainability. With the understanding of sustainable development, the functioning of the linear economy has begun to be criticized. The idea that the circular economy, developed as a substitute for the linear economy, can effectively achieve sustainable development goals is gaining ground. Green growth is also seen as a practical stage in the realization of sustainable development.
Some fiscal measures are necessary to achieve the objectives of the above-mentioned policies. Budgetary policy instruments can therefore also be used to achieve climate and environmental objectives. A green budgeting system can be a useful tool to link budgetary policies with environmental objectives. The green budgeting system identifies the environmental impacts of budget elements and policies and assesses them based on certain performance indicators.
In this context, road tax for diesel and petrol vehicles must be based on their emission levels. Investments in renewable energy (wind, solar, etc.) and electric vehicles should be encouraged. Electricity should be generated from renewable sources and not from fossil fuels. To make efficient use of the energy generated by investments in renewable energy and to develop new ideas to increase productivity, it is necessary to promote R&D services.
The Turkish economy tends to grow, but this growth trend appears to be largely dependent on energy consumption. Increased electricity production is needed to meet the growing energy demand. As the increasing electricity demand is being met by increasing amounts of fossil (non-renewable) resources, environmental pollution is also increasing. This situation leads to climate change and drought in the long term and negatively affects agricultural production and human health. Agricultural development should be a priority agenda for Turkey, as the agricultural sector can be considered less energy-intensive than the industrial sector. The transition to a green economy is crucial for achieving sustainable development in Turkey. For this reason, preferential loans should be provided for investments in the agricultural sector that promote sustainability in energy use. Consequently, future research could benefit from extending the study, and better studies can be achieved if sub-sectors of renewable energy resources can be developed.
Author Contributions
The idea for the study has been proposed and guided by I.B.G. who also conducted the manuscript writing. I.K. was responsible for data collection and the writing of the manuscript. I.K. and I.B.G. designed methodology. The manuscript has been reviewed and edited by I.B.G., while I.K. carried out data collection and data interpretation. I.B.G. also provided help in the analysis of the data. All authors have read and agreed to the published version of the manuscript.
Funding
This research received no external funding.
Institutional Review Board Statement
Not applicable.
Informed Consent Statement
Not applicable.
Data Availability Statement
The data presented in this study are available on request from the corresponding author.
Conflicts of Interest
The authors have no conflicts of interest to declare that are relevant to the content of this article.
References
- Pan, J.; Zhuang, G.; Zheng, Y.; Zhu, S.; Xie, Q. Clarification of the concept of a low-carbon economy and the analysis of its core elements. In Political Economy of China’s Climate Policy; Research Series on the Chinese Dream and China’s Development Path; Li, Y., Li, P., Eds.; Springer: Singapore, 2022; p. 179. [Google Scholar] [CrossRef]
- Kapitonov, I.A. Development of the low-carbon economy as the base of sustainable improvement of energy security. Environ. Dev. Sustain. 2021, 23, 3077–3096. [Google Scholar] [CrossRef]
- Hu, J.L.; Chen, Y.C.; Yang, Y.P. The Development and Issues of Energy-ICT: A Review of Literature with Economic and Managerial Viewpoints. Energies 2022, 15, 594. [Google Scholar] [CrossRef]
- Ozturk, I.; Acaravci, A. CO2 emissions, energy consumption and economic growth in Turkey. Renew. Sustain. Energy Rev. 2010, 14, 3220–3225. [Google Scholar] [CrossRef]
- Balsalobre-Lorente, D.; Shahbaz, M.; Roubaud, D.; Farhani, S. How do economic growth, renewable electricity and natural resources contribute to CO2 emissions? Energy Policy 2018, 113, 356–367. [Google Scholar] [CrossRef]
- Caglar, A.E.; Zafar, M.W.; Bekun, F.V.; Mert, M. Determinants of CO2 emissions in the BRICS economies: The role of partnerships investment in energy and economic complexity. Sustain. Energy Technol. Assess. 2022, 51, 101907. [Google Scholar] [CrossRef]
- Mostafaeipour, A.; Bidokhti, A.; Fakhrzad, M.B.; Sadegheih, A.; Mehrjerdi, Y.Z. A new model for the use of renewable electricity to reduce carbon dioxide emissions. Energy 2022, 238, 121602. [Google Scholar] [CrossRef]
- Omer, A.M. Energy, environment and sustainable development. Renew. Sustain. Energy Rev. 2008, 12, 2265–2300. [Google Scholar] [CrossRef]
- Udeagha, M.C.; Ngepah, N. Disaggregating the environmental effects of renewable and non-renewable energy consumption in South Africa: Fresh evidence from the novel dynamic ARDL simulations approach. Econ. Chang. Restruct. 2022, 55, 1767–1814. [Google Scholar] [CrossRef]
- Pao, H.T.; Chen, H.A.; Li, Y.Y. Competitive dynamics of energy, environment, and economy in the US. Energy 2015, 89, 449–460. [Google Scholar] [CrossRef]
- Shakib, M.; Yumei, H.; Rauf, A.; Alam, M.; Murshed, M.; Mahmood, H. Revisiting the energy-economy-environment relationships for attaining environmental sustainability: Evidence from Belt and Road Initiative countries. Environ. Sci. Pollut. Res. 2022, 29, 3808–3825. [Google Scholar] [CrossRef]
- Mahmood, H.; Adow, A.H.; Abbas, M.; Iqbal, A.; Murshed, M.; Furqan, M. The Fiscal and Monetary Policies and Environment in GCC Countries: Analysis of Territory and Consumption-Based CO2 Emissions. Sustainability 2022, 14, 1225. [Google Scholar] [CrossRef]
- Murshed, M.; Ahmed, Z.; Alam, M.; Mahmood, H.; Rehman, A.; Dagar, V. Reinvigorating the role of clean energy transition for achieving a low-carbon economy: Evidence from Bangladesh. Environ. Sci. Pollut. Res. 2021, 28, 67689–67710. [Google Scholar] [CrossRef] [PubMed]
- Adebayo, T.S.; Rjoub, H.; Akinsola, G.D.; Oladipupo, S.D. The asymmetric effects of renewable energy consumption and trade openness on carbon emissions in Sweden: New evidence from quantile-on-quantile regression approach. Environ. Sci. Pollut. Res. 2022, 29, 1875–1886. [Google Scholar] [CrossRef]
- Alam, M.S. Is trade, energy consumption and economic growth threat to environmental quality in Bahrain–evidence from VECM and ARDL bound test approach. Int. J. Emerg. Serv. 2022, 11, 396–408. [Google Scholar] [CrossRef]
- Ali, U.; Guo, Q.; Kartal, M.T.; Nurgazina, Z.; Khan, Z.A.; Sharif, A. The impact of renewable and non-renewable energy consumption on carbon emission intensity in China: Fresh evidence from novel dynamic ARDL simulations. J. Environ. Manag. 2022, 320, 115782. [Google Scholar] [CrossRef]
- Bouznit, M.; Pablo-Romero, M.P.; Sánchez-Braza, A. Residential electricity consumption and economic growth in Alge-ria. Energies 2018, 11, 1656. [Google Scholar] [CrossRef]
- Karadag-Albayrak, Ö.; Topal, S.; Çamkaya, S. The impact of economic growth, renewable energy, non-renewable energy, and trade openness on the ecological footprint and forecasting in Turkiye: A case of the ARDL and NMGM forecasting model. Alphanumeric J. 2022, 10, 139–154. [Google Scholar] [CrossRef]
- Hassan, T.; Song, H.; Khan, Y.; Kirikkaleli, D. Energy efficiency a source of low carbon energy sources? Evidence from 16 high-income OECD economies. Energy 2022, 243, 123063. [Google Scholar] [CrossRef]
- Hossain, M.E.; Rej, S.; Saha, S.M.; Onwe, J.C.; Nwulu, N.; Bekun, F.V.; Taha, A. Can energy efficiency help in achieving carbon-neutrality pledges? a developing country perspective using dynamic ARDL simulations. Sustainability 2022, 14, 7537. [Google Scholar] [CrossRef]
- Idris, M.F.; Seraj, M.; Özdeşer, H. Renewable energy consumption, CO2 emissions and trade balance nexus in OECD countries: Evidence from ARDL bounds approach. Int. J. Energy Sect. Manag. 2022, 18, 645–660. [Google Scholar] [CrossRef]
- Jahanger, A.; Yu, Y.; Awan, A.; Chishti, M.Z.; Radulescu, M.; Balsalobre-Lorente, D. The impact of hydropower energy in Malaysia under the EKC hypothesis: Evidence from quantile ARDL approach. Sage Open 2022, 12, 1–19. [Google Scholar] [CrossRef]
- Kartal, M.T. Production-based disaggregated analysis of energy consumption and CO2 emission nexus: Evidence from the USA by novel dynamic ARDL simulation approach. Environ. Sci. Pollut. Res. 2022, 30, 6864–6874. [Google Scholar] [CrossRef] [PubMed]
- Mehmood, U. Renewable energy and foreign direct investment: Does governance matter for CO2 emissions? Application of CS-ARDL. Environ. Sci. Pollut. Res. 2022, 29, 19816–19822. [Google Scholar] [CrossRef] [PubMed]
- Mehmood, U. Investigating the linkages of female employer, education expenditures, renewable energy, and CO2 emissions: Application of CS-ARDL. Environ. Sci. Pollut. Res. 2022, 29, 61277–61282. [Google Scholar] [CrossRef] [PubMed]
- Mehmood, U.; Agyekum, E.B.; Uhunamure, S.E.; Shale, K.; Mariam, A. Evaluating the influences of natural resources and ageing people on CO2 emissions in G-11 nations: Application of CS-ARDL approach. Int. J. Environ. Res. Public Health 2022, 19, 1449. [Google Scholar] [CrossRef]
- Noureen, S.; Iqbal, J.; Chishti, M.Z. Exploring the dynamic effects of shocks in monetary and fiscal policies on the environment of developing economies: Evidence from the CS-ARDL approach. Environ. Sci. Pollut. Res. 2022, 29, 45665–45682. [Google Scholar] [CrossRef]
- Wen, M.; Li, M.; Erum, N.; Hussain, A.; Xie, H.; ud din Khan, H.S. Revisiting environmental Kuznets curve in relation to economic development and energy carbon emission efficiency: Evidence from Suzhou, China. Energies 2022, 15, 62. [Google Scholar] [CrossRef]
- Republic of Türkiye Ministry of Energy and Natural Resources. 2022. Available online: https://enerji.gov.tr/infobank-energy-electricity (accessed on 3 January 2024).
- TURKSTAT. Greenhouse Gaz Emission Statistics. 2023. Available online: https://data.tuik.gov.tr/Bulten/Index?p=Sera-Gazi-Emisyon-Istatistikleri-1990-2020-45862 (accessed on 3 January 2024).
- Turkey Electrical Energy Demand Projection Report. 2022. Available online: https://enerji.gov.tr//Media/Dizin/EIGM/tr/Raporlar/ENTAP/114176-turkiye_elektrik_enerjisi_talep_projeksiyonu_raporu.pdf (accessed on 14 February 2024).
- Martins, T.; Barreto, A.C.; Souza, F.M.; Souza, A.M. Fossil fuels consumption and carbon dioxide emissions in G7 countries: Empirical evidence from ARDL bounds testing approach. Environ. Pollut. 2021, 291, 118093. [Google Scholar] [CrossRef]
- Dickey, D.A.; Fuller, W.A. Likelihood ratio statistics for autoregressive time series with a unit root. Econometrica 1981, 49, 1057–1072. [Google Scholar] [CrossRef]
- Phillips, P.C.; Perron, P. Testing for a unit root in time series regression. Biometrika 1988, 75, 335–346. [Google Scholar] [CrossRef]
- Engle, R.F.; Granger, C.W.J. Cointegration and error correction: Representation, estimation, and testing. Econometrica 1987, 55, 251–276. [Google Scholar] [CrossRef]
- Johansen, S. Statistical Analysis of Cointegration Vectors. J. Econ. Dyn. Control 1988, 12, 231–254. Available online: https://ideas.repec.org/a/eee/dyncon/v12y1988i2-3p231-254.html (accessed on 1 March 2024). [CrossRef]
- Johansen, S.; Juselius, K. Maximum Likelihood Estimation and Inference on Cointegration with Applications to the Demand for Money. Oxf. Bull. Econ. Stat. 1990, 52, 169–210. Available online: https://econpapers.repec.org/arti-cle/blaobuest/v_3a52_3ay_3a1990_3ai_3a2_3ap_3a169-210.htm (accessed on 1 March 2024). [CrossRef]
- Pesaran, M.H.; Shin, Y.; Smith, R.J. Bounds testing approaches to the analysis of level relationships. J. Appl. Econ. 2001, 16, 289–326. [Google Scholar] [CrossRef]
- Narayan, S.; Narayan, P.K. An empirical analysis of Fiji’s import demand function. J. Econ. Stud. 2005, 32, 158–168. [Google Scholar] [CrossRef]
- Anh, D.L.T.; Anh, N.T.; Chandio, A.A. Climate change and its impacts on Vietnam agriculture: A macroeconomic perspective. Ecol. Inform. 2023, 74, 101960. [Google Scholar] [CrossRef]
- Narayan, P.K. The saving and investment nexus for China: Evidence from cointegration tests. Appl. Econ. 2005, 37, 1979–1990. [Google Scholar] [CrossRef]
- Stokes, P.A.; Purdon, P.L. A study of problems encountered in Granger causality analysis from a neuroscience perspective. Proc. Natl. Acad. Sci. USA 2017, 114, E7063–E7072. [Google Scholar] [CrossRef] [PubMed]
- Granger, C.W. Investigating causal relations by econometric models and cross-spectral methods. Econometrica 1969, 37, 424–438. [Google Scholar] [CrossRef]
- Ahmad, M.; Khan, Z.; Rahman, Z.U.; Khattak, S.I.; Khan, Z.U. Can innovation shocks determine CO2 emissions (CO2e) in the OECD economies? A new perspective. Econ. Innov. New Technol. 2021, 30, 89–109. [Google Scholar] [CrossRef]
- Mughal, N.; Arif, A.; Jain, V.; Chupradit, S.; Shabbir, M.S.; Ramos-Meza, C.S.; Zhanbayev, R. The role of technological innovation in environmental pollution, energy consumption, and sustainable economic growth: Evidence from South Asian economies. Energy Strategy Rev. 2022, 39, 100745. [Google Scholar] [CrossRef]
Disclaimer/Publisher’s Note: The statements, opinions and data contained in all publications are solely those of the individual author(s) and contributor(s) and not of MDPI and/or the editor(s). MDPI and/or the editor(s) disclaim responsibility for any injury to people or property resulting from any ideas, methods, instructions or products referred to in the content. |
© 2024 by the authors. Licensee MDPI, Basel, Switzerland. This article is an open access article distributed under the terms and conditions of the Creative Commons Attribution (CC BY) license (https://creativecommons.org/licenses/by/4.0/).