Article

Impacts of China’s Main Grain-Producing Areas on Agricultural Carbon Emissions: A Sustainable Development Perspective

School of Economics and Management, Beijing Forestry University, Beijing 100083, China
*
Author to whom correspondence should be addressed.
Sustainability 2024, 16(11), 4607; https://doi.org/10.3390/su16114607
Submission received: 29 March 2024 / Revised: 26 May 2024 / Accepted: 27 May 2024 / Published: 29 May 2024
(This article belongs to the Section Sustainable Agriculture)

Abstract

:
A path of green, low-carbon development in agriculture is to be explored in the face of global warming, which promotes sustainable development. Taking the policy of the main grain-producing area (MGPA) as a special background, this study shows the impact of the MGPA on reducing agricultural carbon emissions (ACEs). In the empirical analysis, a difference-in-differences (DID) model was constructed using panel data from 1999 to 2020 across 31 provinces in China to examine the impact of the MGPA on agricultural carbon emission reduction (ACER). The findings indicate the following: (1) The ACER is significantly promoted after the implementation of the MGPA policy. The results passed robustness and endogeneity tests. (2) The mechanism test reveals that the policy can achieve said reduction by advancing the level of planting specialization. (3) An analysis of the heterogeneity reveals that the implementation of this policy leads to a substantial decrease in ACE in regions characterized by lower economic development and imbalances in the structure of factors involved in agricultural production. Furthermore, in areas where small-scale farming prevails, the policy demonstrates enhanced effectiveness in ACER. The outcomes of this study not only elucidate the link between the MGPA and ACE but also serve as a valuable roadmap for achieving ACER and sustainable development. Additionally, they contribute to expanding the notion of environmentally friendly, low-carbon agriculture in the context of small-scale farming.

1. Introduction

The excessive release of greenhouse gases is a crucial factor responsible for global warming, which is detrimental to sustainable development. Carbon dioxide is widely recognized as the primary driver of this phenomenon [1]. It is essential to realize the substantial carbon emissions from agriculture, the cornerstone of the national economy, during its production and operations. About 10–20% of anthropogenic carbon emissions is attributed to the ACE [2,3].
China’s ACE accounts for 11–17% of its total carbon emissions [4], which make up around 11–12% of global ACE [5]. China manages to sustain 18% of the global population with only 8% of the world’s arable land. This situation has been worsened by China’s pursuit of a localized food supply, influenced by the Chinese proverb, “Food in hand, no panic in heart”. China must choose yield-maximizing agricultural production methods, which involve maintaining high yields of agricultural products using chemicals, energy, and other inputs. However, these methods also result in substantial carbon dioxide emissions [6]. Stepping into the 21st century, China hastened its economic development. The “de-farming” phenomenon of Chinese arable land increasingly worsened due to the bad performance of the agricultural economy. By 2003, the nationwide sown area for grain was less than 80% of that in 1998. This further exacerbated the pressure on China’s agricultural supply and further increases ACE.
To reverse this situation, and ensure a localized food supply, China identified 13 key provinces for grain production in 2004, known as the main grain-producing areas (MGPAs) policy. The China Statistical Yearbook reports that China’s MGPA increased from 99.4 million hectares in 2003 to 116.8 million hectares in 2020. Within this, MGPA’s grain sown area has risen from 68.5 million hectares to 88.1 million hectares, and its share of grain sown area has risen from 68.9% to 75.4%. Additionally, MGPA’s annual grain production increased from 305.8 million tons to 525.9 million tons in 2020, with its share of grain production increasing from 70.9% to 78.5%. A study also found a significant increase in agricultural productivity in MGPA [7,8]. The MGPA has fulfilled its original purpose.
In 2020, China committed to achieving its carbon emission reduction target, known as the 3060-target, peaking carbon emissions in 2030 and neutralizing them by 2060. ACER is a vital step toward achieving this goal [2,9]. Under the 3060-target, the MGPA policy, as a significant agricultural intervention policy, not only bears the responsibility of agricultural production but also warrants attention for its role in the process of ACE. This affects, to a large extent, both the realization of green and low-carbon development in agriculture and the achievement of the 3060-target on schedule. Therefore, investigating the impact of MGPA designation on ACE is essential. The findings could provide references to develop ACER-related policies scientifically and optimize the MGPA policy.
Scholars researching agricultural policy have found that relevant policies have had a positive impact on achieving ACER [4,10]. These agricultural policies, whose initial goal is about ACER, have positively impacted ACER realization, which is expected considering the intention of such policies. In addition, some policies aimed at ACER were ineffective [11]. But what about agriculture policies whose initial goals are not about ACER? Does the MGPA policy have an impact on ACER despite not being implemented for the purpose of ACE?
It has been found that MGPA’s agricultural production practices contribute to the realization of ACER [3,12]. Compared to non-MGPA, MGPA demonstrates excellent performance in achieving ACER [13]. Further research is needed to determine if MGPA’s excellent performance in ACER is due to the establishment of MGPA and to identify its potential impact mechanisms. It is also important to investigate if there are any differences in impacts under different conditions. If the implementation of the MGPA policy can realize ACER, this would be an unexpected policy outcome. The research results can serve as a reference for the scientific formulation of ACER-related policies and the optimization of MGPA.
The contributions of this study are as follows: Firstly, it treats the MGPA designation as a policy intervention, directly examines its impact on ACE in China, and analyzes the mechanism of the impact. Secondly, it considers the various manifestations of MGPA’s impact on ACE under different agricultural development conditions.

2. Materials and Methods

2.1. Theoretical Analysis

2.1.1. Impact of Policies in MGPA on the ACER

The MGPA policy includes a range of incentive policies for the entire crop production cycle. First, to ensure its food production, the Chinese government has intensified the comprehensive development of arable land in MGPA by improving agricultural infrastructure whilst optimizing farmers’ production coordination. This has influenced decision making in small-scale farming and helped with agricultural carbon emission reduction (ACER). Small-scale farming is the predominant Chinese practice. Smallholders have limited incentives to improve the quality of arable land [14]. They tend to increase their usage of fertilizers and pesticides [15]. The quantity of fertilizers per unit of farmland area in China is 3–4-times higher than the global average [16]. As the arable land quality improves, farmers’ decisions will be adjusted to account for operating costs and long-term sustainability regarding agrochemical inputs. This adjustment will cause a gradual reduction in agrochemical input intensity, which will lead to ACER [4,17]. Organizational improvement enhanced agricultural productivity in small-scale farming and improved resource efficiency and ACER [18].
Secondly, the Chinese government directly subsidizes MGPA farmers to support agricultural production activities, including subsidy for acquiring farming equipment and insurance. These measures improve the quality of agricultural production factors, minimize risks in agricultural production and management, and guarantee the realization of ACER. For instance, the subsidy for agricultural machinery purchasing increased energy-efficient and eco-friendly farming equipment ownership. This eco-equipment is characterized by better fuel efficiency and better performance in decreasing carbon emissions [19]. The promotion of agricultural insurance enhances farmers’ understanding of ecologically friendly production techniques and optimizes production choices, ultimately contributing to the achievement of ACER [20].
Finally, other agricultural participants are motivated by the Chinese government’s incentives. For example, the Government of China provides tax rebates and financial subsidies to local governments of MGPAs as well as tax reductions and exemptions for agricultural service enterprises. This has encouraged local governments, agricultural associations, and agricultural service enterprises to actively promote advanced agricultural technologies, enhance agricultural production efficiency, and realize ACER [21]. Assisted by professional agricultural cooperatives, associations, and other commercial entities, agriculturally comprehensive services are provided to smallhold farmers with standard and efficient field management methods, enhancing agricultural productivity and realizing ACER in such a small-scale farming mode [22,23]. The impact of MGPA on ACER and the pathways are shown in Figure 1. Given this, this study proposes the following hypotheses:
H1. 
The implementation of the MGPA policy can aid in realizing ACER.
Figure 1. Theoretical analysis framework.
Sustainability 16 04607 g001

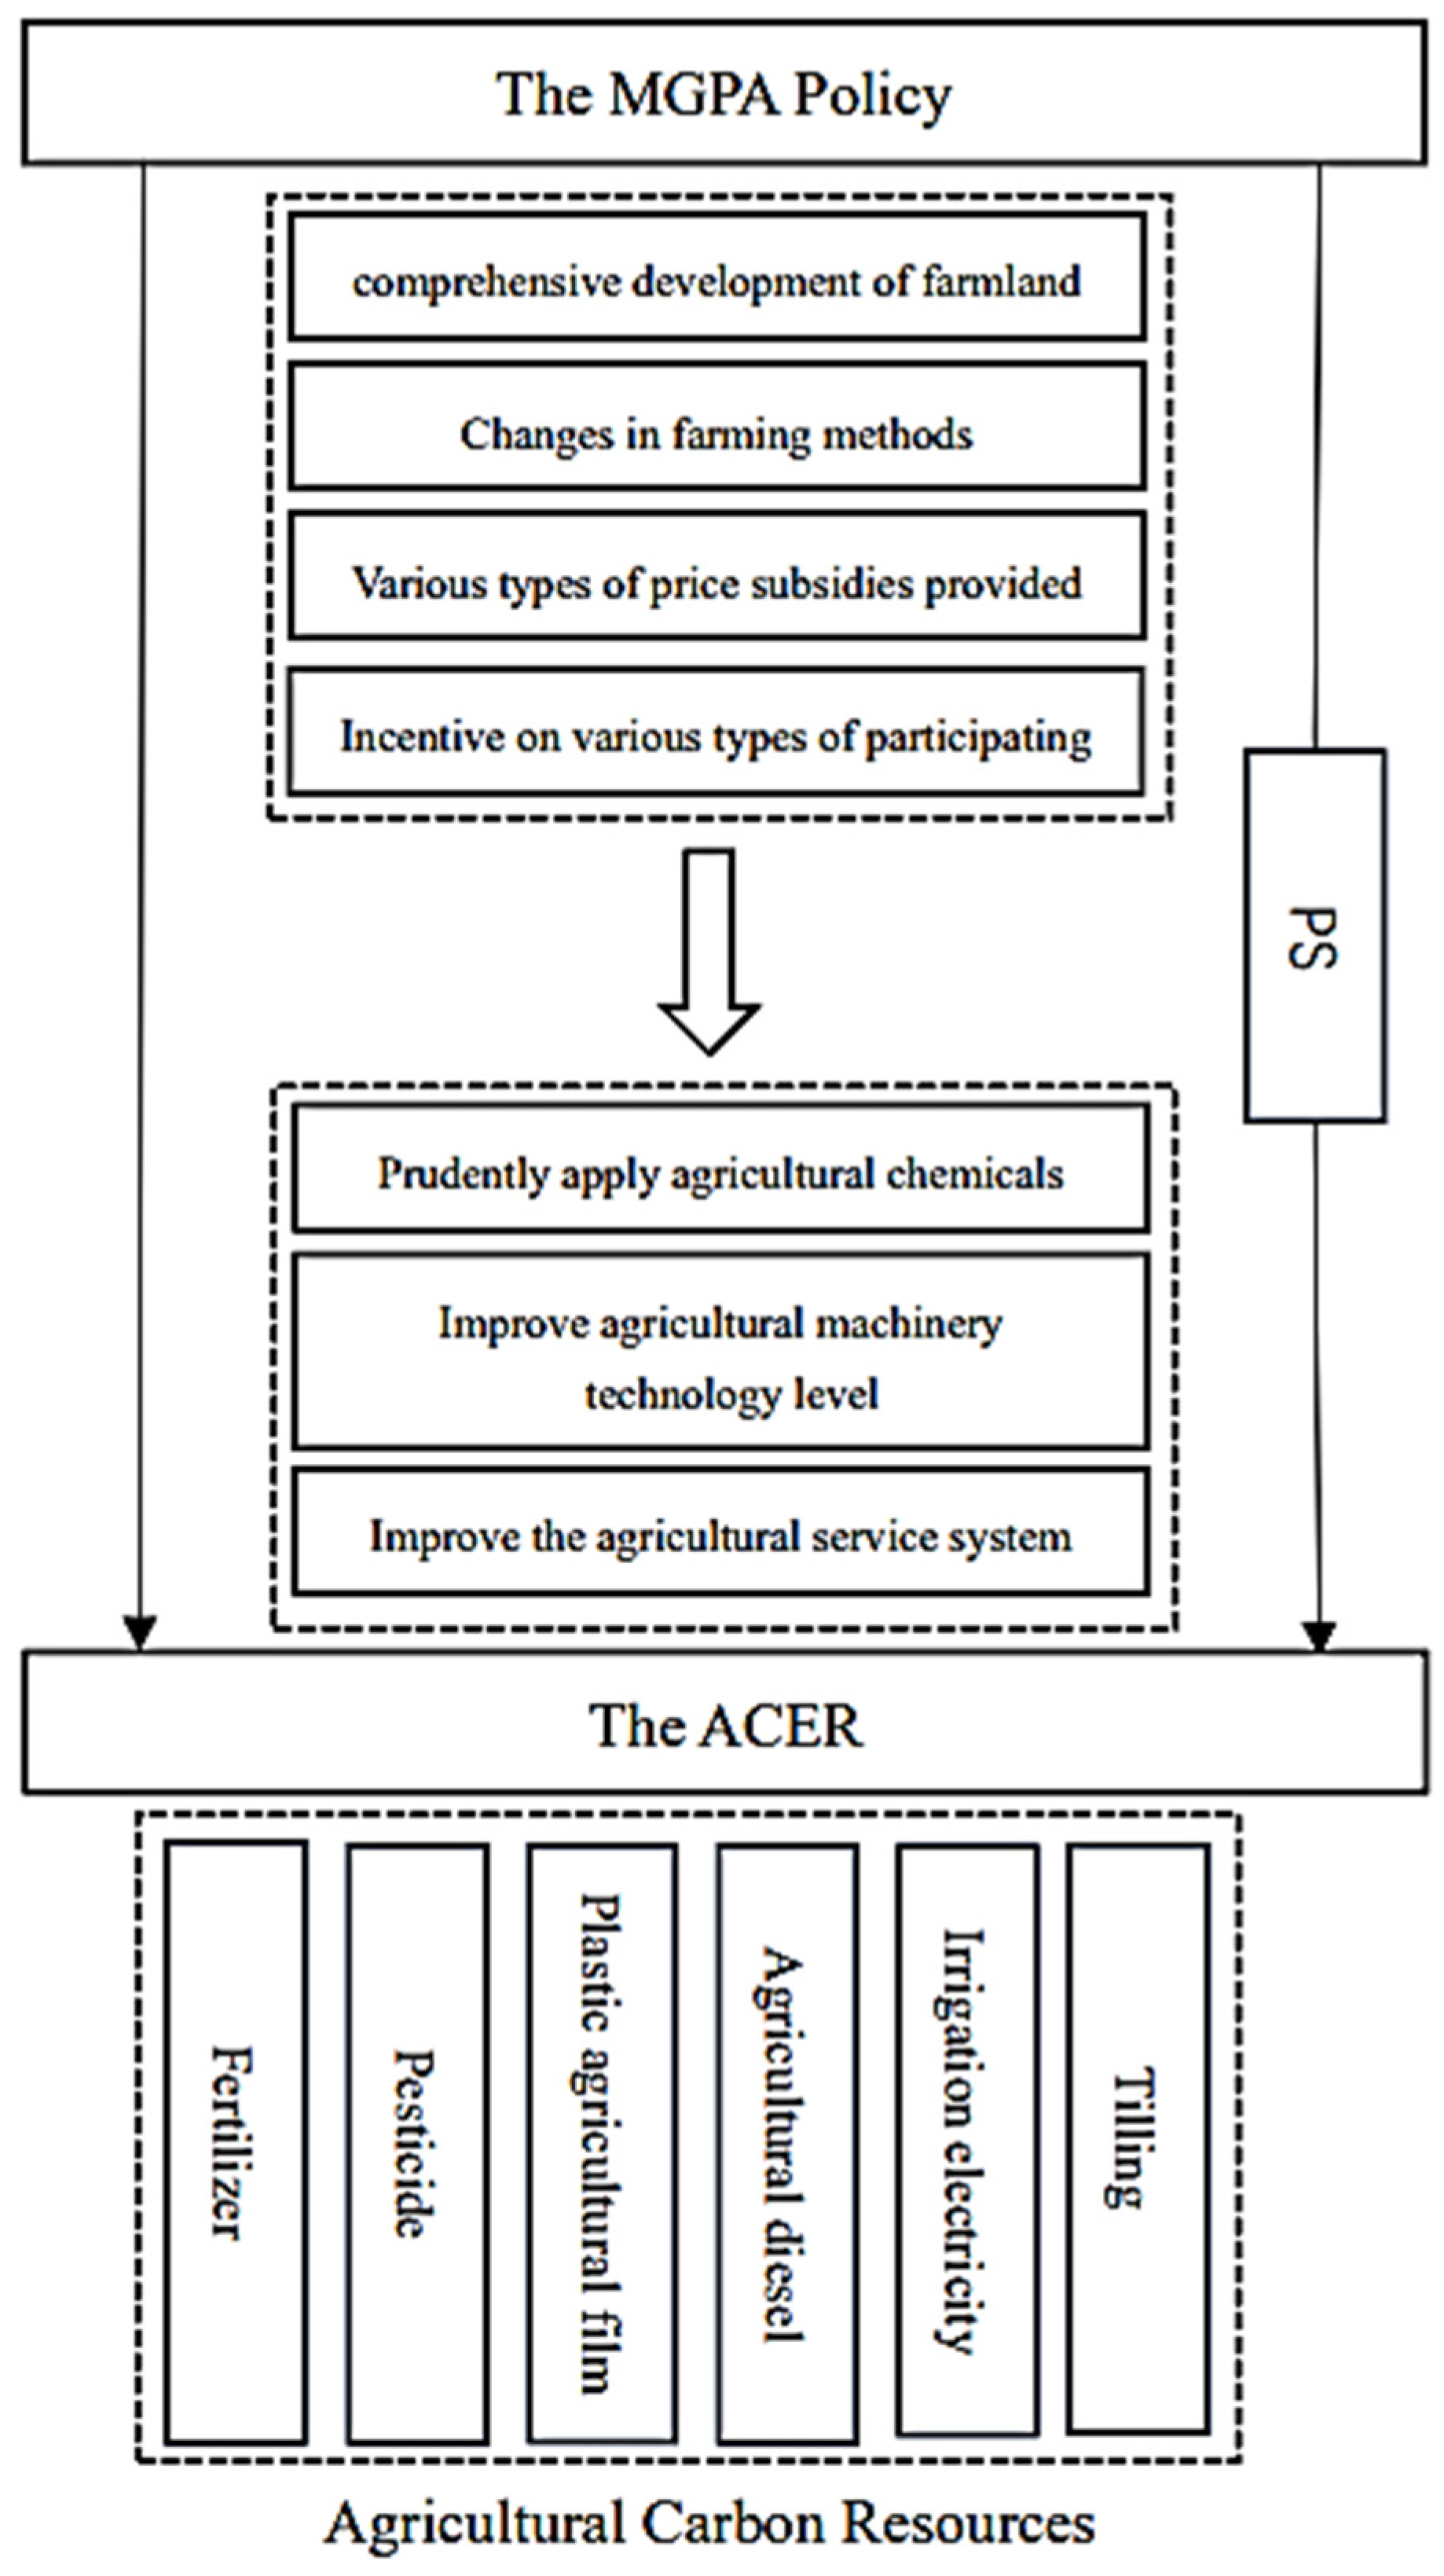
2.1.2. Mechanisms for the MGPA’s Impact on the ACER

The MGPA’s purpose is to encourage grain production and to guide farmers in MGPA to grow more grain in their production and management process, which objectively promotes the degree of planting specialization (PS) in MGPA. If the implementation has an impact on ACE, the most likely mechanism is PS. Specialization promotes the production process [24], but views on the impact of specialization on carbon emissions are different in different fields.
In the industrial and urban sectors, specialization increases carbon emissions [25], and it helps attain reductions in carbon emissions [26]. Additionally, the relationship between specialization and carbon emissions is nonlinear [27].
Similarly, in agriculture, investigations into the effects of PS on ACE produce mixed results. For instance, the encouragement of crop specialization in Europe has led to rapid growth in agricultural productivity. However, it has also resulted in rising carbon emissions, environmental pollution, and loss of biodiversity [28]. Additionally, specialization in specific regions has led to compromised carbon sequestration [29]. Some argue that the substantial enlargement of farmland operations associated with the PS upgrades in the aforementioned regions does not necessarily result in increased carbon emissions due to planting specialization during production [30]. Furthermore, certain studies have discovered that the harmful impacts of planting specialization are largely contingent on the spatial scale. For example, some of the farms in the village have some benefits of specialization through agricultural specialization, but the ecological cost is low if the crop diversity of the whole village is still high [29]. Snapp [31] found that ACE from crop cultivation depends more on farm management status than just on PS. Considering the differences in research perspectives and contents, these scholars have not reached a unanimous conclusion on whether PS increases or decreases carbon emissions. To determine the impact of PS on ACE within the context of small-scale farming, further analysis is needed.
In the traditional state of intensive farming, small-scale farming will take into account the actual needs of crop growth, combined with land conditions, climate, and other factors, to carry out precise farmland management. This not only brings higher yield per unit of land for agricultural products but also keeps carbon dioxide emissions at a lower level, to a certain extent [32]. With the booming Chinese urban economy, many Chinese laborers outside the city have poured in for job opportunities. Even for those farmers who are still engaged in agricultural production, their part-time job behavior is increasing. The share of wage income in the disposable income of rural residents increases year by year. From 1999 to 2012, the ratio of wage income to net income for rural residents rose from 28.51% to 43.54%, on average, nationwide. Even though the proportion of wage income declined in 2013 due to the change in the statistical caliber from net income to disposable income, the proportion has tended to increase year by year in subsequent years. The rapid loss of rural labor has led to the mass introduction of chemical fertilizers, pesticides, and agricultural machinery as alternative production factors into agricultural production, and the situation of the irrational structure of agricultural factors is worsening. Consequently, the level of ACE increases significantly because of this [33].
To avoid the impact of natural disasters on agricultural harvests and household income, smallholder farmers prefer to diversify their crops. Diversified cultivation is, to some extent, consistent with the viewpoint of multifunctional agriculture theory and is considered to be one of the effective means to protect the ecology and reduce carbon emissions. However, in China, the imbalance of agricultural input factors and the small scale and fragmentation of agricultural land have aggravated ACE instead [34]. Diversified and fragmented cultivation also leads to an unreasonable mismatch between crop types and the actual condition of the land, increasing the use of pesticides and fertilizers and reducing the efficiency of agricultural machinery [12,35].
PS brings about the sharing of technology and management mode, which optimizes the agricultural production factor composition and enhances production efficiency, thus bringing about a good impact on the ACER. Therefore, compared with diversified planting, PS is more suitable for China’s small-scale farming, enhancing agricultural efficiency and reducing ACE. Given this, the following hypothesis is proposed:
H2. 
The MGPA policy promotes an increase in the PS level, and carbon emission reductions are achieved through the mechanism of PS.

2.1.3. Heterogeneity in the MGPA on the ACER

China is a vast country. The economic development levels and agricultural operational statuses vary significantly across different regions, so the carbon-reducing effects of the MGPA vary among different types of regions and individuals. Specifically, a clear gap in economic strength lies among different regions in China, and economic development level determines the amount of funds invested in scientific research, significantly influencing the level of scientific research and innovation [36], including in agriculture. Economic development differences impact agricultural production factor composition. In economically less-developed regions, the rapid outflow of labor leads to an imbalance in agricultural production factor composition, resulting in higher ACE intensity [33]. In regions characterized by better economic development, the structure of agricultural factors is more reasonable, and green low-carbon agriculture develops well. Hence, in regions characterized by a high degree of regional economic advancement and robust scientific research capabilities, and a high level of green low-carbon agriculture, the ACER effect brought about by the MGPA policy is not obvious, while in regions with a lower level of economic development and serious imbalances in agricultural factors, improvements in local agricultural green and low-carbon development conditions require support for the MGPA policy.
In addition, significant differences in resource endowment can be found among farmers under different scales of agricultural land management. In China, achieving the ACER is less favorable under the conditions of small-scale farming [34]. The primary reason for this is the prevalent situation of small-scale and fragmented farming in China [10]. However, there are notable disparities in farmland management across various regions of China. In regions like northeast and northwest China, there is a considerable proportion of farmers with larger-scale land management, who possess advantages in terms of modernized agricultural equipment, proficiency in agricultural management techniques, and efficiency in utilizing agricultural production factors. Therefore, in regions where small-scale farming predominates and lacks scalability in agricultural land management, the MGPA policy can achieve more effective carbon reduction. Building upon these, this study proposes the following hypotheses:
H3. 
The MGPA policy can help promote the ACER in areas characterized by lower economic development and serious factor imbalances in agriculture.
H4. 
The MGPA policy helps promote agricultural carbon reduction when farmers operate with a higher degree of small-scale farming.

2.2. Variable Selection

2.2.1. Explained Variable

This study focuses on agriculture, where ACE mainly comes from the hidden carbon sources of agricultural chemical inputs, including chemical fertilizers, pesticides, and agricultural films, as well as the carbon sources from farming, including agricultural diesel fuel, electricity used for agricultural irrigation, and agricultural land tilling [4]. Since the total sown area in cultivation varies greatly among Chinese provinces, simply considering the total amount of ACE will result in a large distortion situation, so the explanatory variables in this study mainly consider the carbon intensity, i.e., carbon emission amount per unit sown area. Referring to Du [4] and Wang [37], the ACE intensity measurement formula is as follows:
A C E = ( C j × T j )
where C j represents the carbon emission coefficients from the carbon source j type in the category, which are 0.8956 kg/kg of fertilizer, 4.9341 kg/kg of pesticide, 5.18 kg/kg of plastic film, 0.5927 kg/kg of agricultural diesel, 19.8575 kg/km2 of electricity used for irrigation, and 312.6 kg/km2 of land tilling. T j denotes absolute consumption of j type carbon source. C j × T j denotes ACE total amount. T A C E i denotes the total amount of ACE in area i . a r e a i denotes the total sown area of crops in area i . A A C E i ( = T A C E i / a r e a i ) denotes the ACE per unit area in area i .

2.2.2. Explanatory Variable

The classification of the MGPA is shown in Figure 2. Further, 13 provinces, including Hebei, Inner Mongolia, Liaoning, Jilin, Heilongjiang, Jiangsu, Anhui, Jiangxi, Shandong, Henan, Hubei, Hunan, and Sichuan, are designated as the MGPA and are considered as the experimental group in this study. The Chinese government selected these provinces to become MGPAs because they have a relatively high proportion of grain cultivation and there is less policy resistance to raising the proportion of grain cultivation. According to the China Statistical Yearbook, the average proportion of grain cultivation in MGPA areas was 72.8 percent from 1999 to 2003, in comparison to 71.1 percent in non-MGPA areas. Concurrently, MGPA provinces accounted for 68.2% of the national grain cultivation area during this period, which is of great significance in guaranteeing food security, which is the main purpose of establishing MGPA. Moreover, the prevalence of plains in these provinces is conducive to the promotion of mechanized production, which is of paramount importance in the context of agricultural mechanization. The remaining 18 provinces in mainland China serve as the control group.

2.2.3. Measurement of the Level of PS

Herfindahl–Hirschman Index (HHI) is used to find the degree of specialization measurement. Wang [30] chose HHI as a measure of PS. HHI is measured as follows:
H H I i = j = 1 n ( a i j n ) 2
where a i j is the proportion of crop j in the aggregate sowing area of crops in region i .   n   represents the number of crop species, taking into account cultivation situation and data availability. In this study, crops are categorized into seven groups according to the rules of the China Statistical Yearbook: grain crops (including Oryza sativa, Triticum aestivum, Zea mays, etc.), oil-bearing crops (including Arachis hypogaea, Brassica napus, etc.), vegetable crops (including Lycopersicon esculentum, Brassica oleracea var. botrytis, etc.), fruit crops (including Malus sylvestris, Musa paradisiaca, etc.), fiber crops (including Gossypium spp., Corchorus spp., etc.), forage crops (including Medicago sativa, Zea mays, etc.), and drinking and medicinal crops (including Camellia sinensis, Panax ginseng, etc.); thus,   n = 7 . When the planting types are more average, the index is smaller; when only one type of crop is planted, the index is 1. The higher the HHI, the higher the specialization level.
In this study, Zeng’s [38] approach to measuring the degree of specialization was used as a robustness test. It is measured as follows:
P C P i = ( 1 + P i j × l n P i j ln n )
where P i j is the proportion of crops j in the total sown area of crops in region i . If only one crop is grown, the index is 1 , and if all crops are grown equally, the index is 0 .

2.2.4. Control Variables

Referring to Yang [39], Zhong [40], and Farooq [41], the control variables include indicators of agricultural development and economic development.
The levels of agricultural irrigation (AI), agricultural human capital, and financial support for agriculture depict agricultural development. The level of AI is represented by the proportion of effective irrigation area to the total sown area [39]. Agricultural human capital (AHC) is characterized by the labor force’s average education years. The specific calculation method involves assigning five different education levels to 0, 6, 9, 12, and 15 years and then calculating the weighted average number of education years of the rural labor force. The agriculture financial support (FSA) intensity is defined as the financial expenditure per capita of the agricultural labor force [41]. The urban–rural income gap (URIG) and industrial structure (IS) are taken as measures to depict economic development. The URIG’s measurement type is referenced in Zhong [40]. The IS’s measurement method is referenced in Yang [39]. This study takes 1999 as the base year and uses the consumer price index for urban and rural residents for deflationary treatment.

2.2.5. Other Variables

The main agricultural chemical inputs are fertilizers, pesticides, and agricultural plastic film. Fertilizer application intensity (FA) is represented by the application of pure fertilizer per unit of planted area. Pesticide application intensity (PA) is the amount of pesticide used per unit of cultivated land in agriculture. The intensity of plastic film usage (PFU) is characterized by calculating the quantity of agricultural plastic film used in relation to the planted area [42].
Because the statistics do not distinguish the energy-saving and environmental protection level of agricultural machinery, considering that large agricultural machinery is generally produced by highly advanced-technology-level factories, large agricultural machinery (LAM) can represent more advanced production tools, and, thus, LAM is used to represent energy-saving and environmentally friendly agricultural machinery [43]. The calculation method involves the power of LAM demanded per unit of the sown area of crop cultivation, replacing with the number of agricultural workers as a robustness test.
The relationship between the output value of agricultural services and the overall agricultural production value shows the progress of the agricultural service sector (AS). Due to the available statistical data only encompassing the production value of the agriculture, forestry, animal husbandry, and fishery services sectors, this study calculates the agricultural service industry’s output value by using the proportion of agriculture in the total sector output value [44].

2.3. Model Building

In this study, the establishment of MGPA serves as a quasi-natural experiment, 31 provincial administrative divisions in Mainland China are divided into two groups, and a double-difference model is constructed by using panel data from 1999 to 2020:
l n A C E i t = β 0 + β 1 ( t r e a t i × p o s t t ) + β 2 C o n t r o l i t + δ i + τ t + ε i t
where A C E i t denotes the carbon emissions of the cultivated area in region i in the year t . t r e a t i × p o s t t is the interaction term for the policy, indicating the implementation in region i in year t . The interaction term is 1 or 0, p o s t t and t r e a t i takes the value of 1 or 0. The variable t r e a t i is 1 when the region is an MGPA, and 0 otherwise. The variable p o s t t is 1 when the region starts to become an MGPA, and 0 otherwise. Since the MGPA policy started to be practiced in 13 main producing areas at the same time in 2004, when the t 2004 , p o s t t in MGPA takes the value of 1. C o n t r o l i t denotes a series of control variables. β denotes the parameter to be estimated. δ i denotes province-fixed effects, the τ t denotes time-fixed effects, and ε i t denotes a randomized disturbance term.
Policies in MGPA lead to the ACER through farmers’ specialization in growing certain crops. The degree of PS in this section is measured using the Herfindahl index, and robustness tests are conducted using the measured index used by Zeng [38]. Referring to Baron [45], a three-stage mediation model combination was applied to test this mechanism:
l n H H I i t = α 1 + β ( t r e a t i × p o s t t ) + β 3 C o n t r o l i t + δ i + τ t + ε i t
l n A C E i t = α 2 + β ( t r e a t i × p o s t t ) + γ l n H H I i t + β 4 C o n t r o l i t + δ i + τ t + ε i t  
where H H I is the level of PS, and P C P is used as a robustness measure of PS level to replace H H I . γ is the estimated coefficients of the mediating variables. β and γ denote the mediating influence, and β is the direct effect; the mechanism’s explanatory power method is measured as β × γ β .

2.4. Data Sources and Descriptive Analysis

This study utilizes the panel data of 31 provincial-level administrative regions in China, excluding Hong Kong, Macao, and Taiwan from the China Statistical Yearbook and the China Rural Statistical Yearbook for 1999–2020. The descriptive statistical analysis is shown in Table 1.

3. Results

3.1. Baseline Regression Results

This study uses the DID model, controlling both province-fixed effects and time-fixed effects, to check the policy’s effectiveness in promoting the ACER, as shown in Table 2.
Regressions 1 and 2 in Table 2 show that MGPA has no effect on TACE, regardless of the inclusion of control variables. According to the results, the establishment of the MGPA did not increase TACE in the case of an increase in the total seeded area. Additionally, the establishment of MGPA did not significantly increase ACE. Regressions 3 and 4 show that the MGPA policy is always significant at the 1% significance level, which initially shows that the MGPA policy reduces the ACE. The results preliminarily confirm Hypothesis H1, as shown in Table 2. Since the establishment of MGPA had no effect on TACE, only AACE was considered in subsequent analyses.

3.2. Robustness Check

3.2.1. Parallel Trends Check

Based on 2004 as the benchmark lever, considering that the MGPA policy started in 2004, this study sets the time dummy variables to carry out the parallel trends test. In Figure 3, the p-value of the coefficient β before the policy implementation (1999–2003) is not significantly different from 0, indicating that no violation of the parallel trends hypothesis was found between MGPA and non-MGPA before the MGPA policy was implemented. The coefficient β after the MGPA policy’s implementation (2005–2020) overall shows a decreasing trend, and it is different from zero, indicating that the MGPA policy significantly suppresses ACE.

3.2.2. Excluding the Impact of Other Policies

An improvement in agricultural production technology and a decrease in ACE were achieved after China joined the WTO [46] through international trade and technology exchange. However, it is important to consider that the ACER achieved under the influence of WTO accession may be mistakenly identified as MGPA. To avoid any interference caused by identifying MGPA’s impact on ACE, this study introduces the variable dWTO and removes the effects of WTO accession after 2001 on ACE. The results in Table 3 indicate that, after removing the influence of dWTO, the establishment of MGPA still significantly promotes ACER, although its impact on ACE decreases to some extent.

3.2.3. Placebo Test

This study uses Monte Carlo simulation 1000 times to randomly generate 13 provinces of the MGPA to eliminate the effect of unobserved factors. The simulated regression coefficient β for 1000 times t statistic distribution of the simulated regression coefficient β for 1000 times is shown in Figure 4, and the results show that the simulated t statistic basically conforms to the normal distribution, with a mean value of 0, while the actual t statistic is significantly different than zero. The enforcement of the MGPA policy substantially enhances the ACER.

3.2.4. Data Truncation Filtering

To prevent extreme values from affecting the benchmark regression results, this study re-regresses Equation (4) after truncating ACE by 1% and 5%. The estimation results indicate that the coefficient estimates of MGPA pass the significance test after excluding extreme values, which is consistent with the benchmark estimation results, as shown in Table 4.

3.3. Addressing Endogenous Issues

Although ACE is unlikely to impact the establishment of MGPA, which significantly mitigates the issue of reverse causality, this study employs the IV-2SLS and PSM-DID methods to address potential endogeneity problems in the model. In the IV-2SLS approach, as described by Nunn [47], this study uses the interaction term (land) between the average of the grain sown area and the time trend for 1996–1998 as the IV over time. The magnitude of the grain sown area, as historical data prior to the establishment of the MGPA, is likely to influence whether or not it becomes an MGPA while not having an impact on the ACE within the model, thus satisfying the requirements underlying the IV. The Regression 1 results in Table 5 show that the larger the area sown with grain, the more likely it is to be an MGPA. The Regression 2 results indicate that the KP rk LM test rejects H0, with an LM P value of 0.002, suggesting no non-identifiability problem. The value of the C-D wald F is 168. The value of K-P rk wald F is 21.713, which is greater than the S-Y 10% threshold of 16.38, indicating that there is no weak instrumental variable problem. Additionally, MGPA passed the 5% significance test. In the PSM-DID method, this study refers to the method of Wang [48], and Regressions 3 and 4 use the nearest-neighbor matching method and kernel matching method, respectively, and the MGPA passes the 1% significance level. The above methods show that the establishment of MGPA still helps to realize ACER after considering the endogeneity problem.

3.4. Testing of ACER Mechanisms of MGPA

According to Equations (5) and (6), this study examines whether the MGPA policy achieves the ACER through PS. Regressions 1 and 2 in Table 6 are the specialization level measured by the Herfindahl index, and Regressions 3 and 4 are the robustness test. PS was improved due to the MGPA policy at the 1% significance level known in Regression 1, and PS promoted the ACER at the 1% significance level known from Regression 2. Referring to Heckman [49], this study quantifies the ACER effect of this mechanism. The ratio of estimated parameters β × γ to β is calculated, representing the PS’s effect on ACE. The calculations show that 44.1% of the ACER effect of the MGPA policy can be attributed to PS. Regression results 3 and 4 are similarly significant, with 32.8% of the emission reduction effect explained by PS.
Thus, the implementation of MGPA achieves ACER by improving PS. Hypothesis H2 is verified.

3.5. Heterogeneous Analysis of the ACER Effects of the MGPA Policy

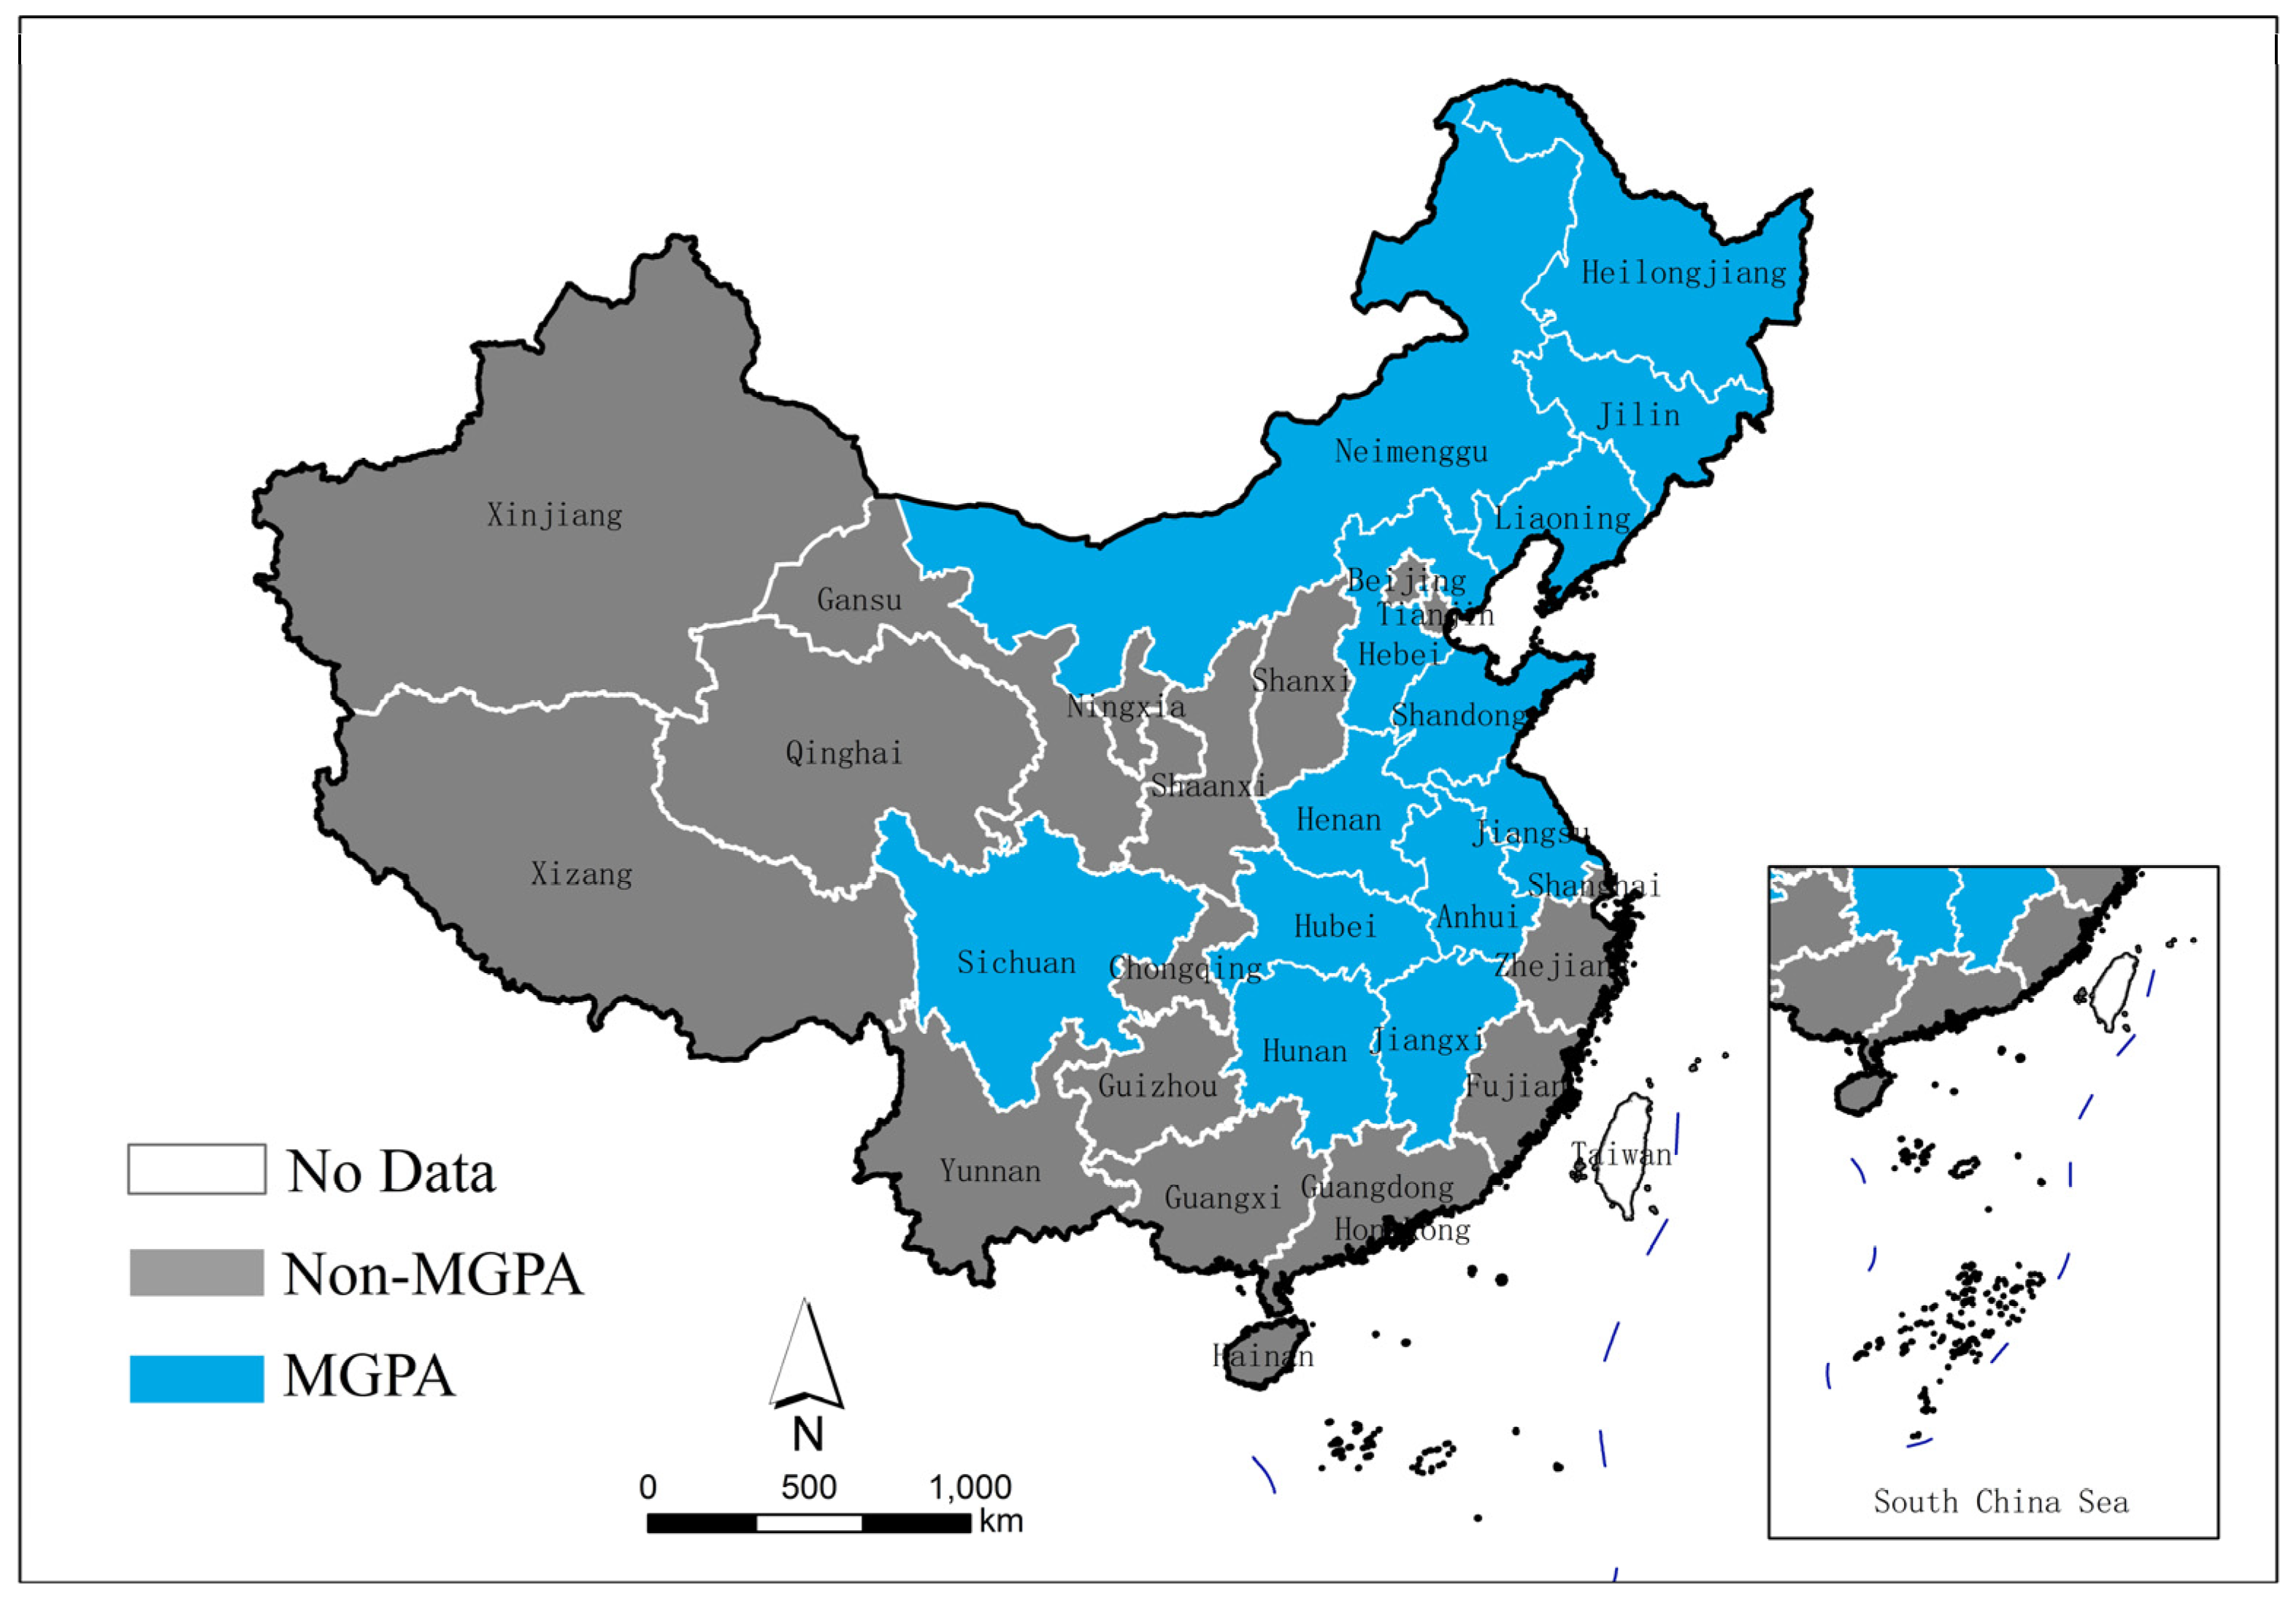
3.5.1. Regional Heterogeneity

As shown in Table 7, the MGPA policy’s intervention on the ACER gradually strengthens from east to west and from south to north. The policy’s implementation significantly promotes The ACER in non-coastal areas. This result is not difficult to understand. Firstly, considering the agricultural production factor structure, a substantial influx of rural laborers from the central, western, and non-coastal regions migrate to the eastern and coastal regions for non-agricultural activities, leading to an imbalance in the agricultural production factor structure. Agricultural chemicals and fossil energy are used extensively as alternative factors. The relationship between agricultural production factors tends to be more rational in these regions because of the MGPA policy, resulting in a greater impact on the ACER. The imbalance in the agricultural production factor structure is more severe in the western regions. Secondly, considering the land distribution, the southern regions have interlaced hills and dense river networks, while the agricultural land in the northern regions is relatively flat and less fragmented, making it easier to promote agricultural mechanization and scale-based services. Finally, considering the economic and technological conditions, the eastern and coastal regions are better suited to having strong technological capabilities and higher investment in research and development in the field of agriculture. Therefore, the ACER effect is relatively weaker here. Hypothesis H3 is verified.

3.5.2. Heterogeneity in Farm Household Size

The MGPA policy impacts upon farmers of different business sizes differently. There are large differences in the scale of operation of farm households among provincial regions in China, and large gaps also exist in the scale of farm household operation within each provincial region. This study takes the average value of the national per capita total sown area in the examination period as the cut-off point and categorizes regions as either having a deeper small-scale farming orientation or a more scaled farm operation based on their deviation from the national average per capita total sown area; we conduct regressions separately. The MGPA policy’s promotion of the ACER in areas below the national average per capita total sown area is significant, and this promotes the ACER in areas above the average, but not significantly. This result reflects that, in areas dominated by small-scale farming orientation, the MGPA policy strongly promotes the ACER.
For results that are not significant in areas with a certain scale, one likely reason is that there is still is a proportion of smallholder farmers. While the MGPA policy may have the potential to promote the ACER in these regions, it could be hindered by the non-small-scale farmer portion. Therefore, overall, the MGPA policy’s influence in driving the ACER in these regions may be limited. Hypothesis H4 is verified.

4. Discussion

4.1. The MGPA Policy and the ACER

ACER is a long-term, systematic process that involves ACER from various sources and the optimization of related industrial systems [50]. Among them, Yu [16] believes that the excessive input of agricultural chemicals contributes to the main source of ACE in China. Cai [44] believes that new eco-machinery is the most important production tool in modern agriculture, and its increased use will help achieve ACER. In the context of fierce market competition, agricultural service providers will offer lower costs, more efficient management methods, and more advanced agricultural production technologies to drive agricultural activities to achieve ACER [22,23,44].
From the perspective of MGPA policy implementation, this study demonstrates that MGPA’s superior performance in achieving ACER stems from this policy. The MGPA policy consists of a series of policies, such as comprehensive development of farmland, agricultural production price subsidies, and incentives for social participation, which have been demonstrated by a number of studies to contribute to the realization of ACER. Firstly, the comprehensive development of farmland, especially for mid- to low-productivity farmland, directly leads to improvements in farmers’ production methods. It has especially improved the behavior of continuously exceeding the excessive increase in agricultural chemical inputs driven by the goal of maximizing product output. Studies have found that China’s fertilizer input intensity is, on average, 3–4-times higher than the world average [16]. The improvement in the use of agricultural chemical inputs leads to the ACER [4,17]. Secondly, under a series of price subsidies, the ownership of new efficient and energy-saving agricultural machinery and equipment in China continues to increase, improving agricultural fossil energy use efficiency and realizing the ACER [19]. Finally, through policy guidance such as tax incentives, it promotes the development of agricultural service entities. Agricultural service providers use advanced agricultural production technologies with a rational agricultural element structure to achieve the ACER [22,23].
Therefore, in order to compare with related research results, this study separately considers whether the implementation of MGPA realizes ACER by reducing the intensity of agricultural chemical input use, increasing the intensity of large agricultural machinery use, and promoting the development of the agricultural service industry.
Regressions 1 and 2 in Table 8 show that FA and PFU are significantly reduced after the policy’s implementation. As part of the MGPA policy, improving the basic conditions of farmland and enhancing the management practices of farmers are aimed at ensuring the stability of grain production in the long run. However, the improvements in basic farmland conditions, especially soil fertility, significantly reduce FA to maximize agricultural productivity [17]. Green agricultural production enhances PFU recycling and reuse by farmers, thereby reducing the intensity of agricultural plastic film usage [4]. But Regression 3 shows that the reduction in PA is not significant. While MGPA’s effect reduces the intensity of pesticide use, the homogenization of crop varieties may lead to a decrease in ecological stability in agricultural production. To mitigate these negative effects, farmers may opt to increase the input of pesticides [51], which offsets part of the MGPA policy’s effect and, thus, is not significant. Regression 4 indicates that the MGPA policy significantly promotes the popularization of large-scale agricultural machinery, while Regression 5 shows that it significantly develops the agricultural service industry. This result is not difficult to understand: The planting area of the selected crop will increase through PS, making it possible to manage collaborative planting in different areas. Land management is enhanced through PS. The subsidies for agricultural machinery purchase and tax reductions for agricultural service enterprises promote LAM equipment. The agricultural service industry is also motivated, owing to economies of scale in crop planting and price incentives.

4.2. The Planting Specialization (PS) and the ACER

The MGPA policy significantly enhances PS within these regions. Driven by the goal of increasing grain production and ensuring food security, in addition to increasing investment in agricultural research funds, local governments vigorously promote the expansion of grain planting areas in MGPA, trading off grain production for grain area. The direct result of this behavior is an enhancement of PS in MGPA.
More importantly, this study finds that the MGPA policy increases the degree of PS to achieve ACER. This result is the same as the findings of Veysset [52] and Huang [53]. Diversified crop planting makes it difficult for farmers to effectively manage multiple crops simultaneously. Moreover, due to other important non-agricultural activities taking up farmers’ energy, they do not have extra time and energy to precisely manage multiple crops. Additionally, Chinese farmers generally aim to maximize agricultural product yield. During diversified crop planting, excessive agricultural chemicals do not align with the actual needs of crops. Meanwhile, the relatively small scale of land operation in China inherently hampers the operational efficiency of large-scale advanced agricultural machinery. On this basis, diversified crop planting further fragments the operational land for agricultural machinery, reducing its operational efficiency furtherly. The substantial input of agricultural chemicals combined with the low efficiency of mechanized production results in a significant generation of CO2 in agricultural production activities.

5. Conclusions

Based on a sustainable development perspective, taking the MGPA policy’s implementation in 2004 as a turning point, this study first explored the policy’s influence on ACER. We empirically examined the data from provincial panels, spanning from 1999 to 2020, using a double-difference model. The research findings are as follows:
The agricultural carbon emission reduction (ACER) is effectively promoted after launching the MGPA policy. Elevating the level of PS is how the MGPA policy helps with the ACER. Two different measurements of PS indicate that 44.1% and 32.8% of the “carbon reduction” effect attributable to the policy can be attributed to this mechanism, and its decarbonization effect is significant. Heterogeneity tests demonstrate that the MGPA policy’s impact on the ACER varies among different regions, with a gradual strengthening of the effect from east to west and from south to north. The ACER is more effective in a higher proportion of small-scale farming.
Considering that countries in East Asia, including China, predominantly rely on small-scale farming in agricultural cultivation [54], countries with similar farming patterns can also draw on China’s MGPA policy to ensure agricultural yields while promoting low-carbon agriculture through specialized planting.
This study has some limitations, including the measurement of ACE. There are more agricultural carbon sources than the indicators used in this study. The growth process of crops also brings about certain carbon emissions and carbon sinks, which were not calculated due to data limitations. Secondly, there is a data scale issue. This study used provincial-level data rather than smaller administrative units. If administrative units such as counties and villages were used, this study might have yielded more scientific and precise results. Additionally, this study did not provide a detailed breakdown of factors such as farm size and household characteristics, which may influence how different farmers respond to the MGPA policy. Future research could delve into these aspects in more detail.

Author Contributions

Conceptualization and design, S.W. and F.C.; methodology and software, S.W. and M.J.; data collection, L.L.; writing—original draft, S.W.; writing—review and editing, F.C. and S.W.; supervision, S.W. and L.L. All authors have read and agreed to the published version of the manuscript.

Funding

This research was funded by the Beijing Forestry University Hotspot Tracking Project (grant no. 2018BLRD01).

Institutional Review Board Statement

Not applicable.

Informed Consent Statement

Informed consent was obtained from all subjects involved in the study.

Data Availability Statement

The original contributions presented in the study are included in the article, further inquiries can be directed to the corresponding author/s.

Conflicts of Interest

The authors declare no conflicts of interest.

References

  1. IPCC Climate Change. Mitigation of Climate Change. In Contribution of Working Group III to the Fifth Assessment Report of the Intergovernmental Panel on Climate Change; Cambridge University Press: Cambridge, UK; New York, NY, USA, 2014. [Google Scholar]
  2. Bennetzen, E.H.; Smith, P.; Porter, J.R. Decoupling of greenhouse gas emissions from global agricultural production: 1970–2050. Glob. Chang. Biol. 2016, 2, 763–781. [Google Scholar] [CrossRef] [PubMed]
  3. Zhang, L.; Pang, J.; Chen, X.; Lu, Z. Carbon emissions, energy consumption and economic growth: Evidence from the agricultural sector of China’s main grain-producing areas. Sci. Total Environ. 2019, 665, 1017–1025. [Google Scholar] [CrossRef] [PubMed]
  4. Du, Y.; Liu, H.; Huang, H.; Li, X. The carbon emission reduction effect of agricultural policy—Evidence from China. J. Clean. Prod. 2023, 406, 137005. [Google Scholar] [CrossRef]
  5. Bai, Y.; Deng, X.; Jiang, S.; Zhao, Z.; Miao, Y. Relationship between climate change and low-carbon agricultural production: A case study in Hebei Province, China. Ecol. Indic. 2019, 105, 438–447. [Google Scholar] [CrossRef]
  6. Zheng, W.; Luo, B.; Hu, X. The determinants of farmers’ fertilizers and pesticides use behavior in China: An explanation based on label effect. J. Clean. Prod. 2020, 272, 123054. [Google Scholar] [CrossRef]
  7. Ma, L.; Wang, S.; Wästfelt, A. The Poverty of Farmers in a Main Grain-Producing Area in Northeast China. Land 2022, 5, 594. [Google Scholar] [CrossRef]
  8. Cheng, K.; He, K.; Sun, N.; Fu, Q. Comprehensive evaluation of eco-environmental resources in the main grain-producing areas of China. Ecol. Inform. 2023, 75, 102059. [Google Scholar] [CrossRef]
  9. Cui, X.; Cai, T.; Deng, W.; Zheng, R.; Jiang, Y.; Bao, H. Indicators for evaluating high-quality agricultural development: Empirical study from Yangtze River Economic Belt, China. Soc. Indic. Res. 2022, 3, 1101–1127. [Google Scholar] [CrossRef]
  10. Gao, J.; Gai, Q.; Liu, B.; Shi, Q. Farm size and pesticide use: Evidence from agricultural production in China. China Agric. Econ. Rev. 2021, 4, 912–929. [Google Scholar] [CrossRef]
  11. Carauta, M.; Troost, C.; Guzman-Bustamante, I.; Hampf, A.; Libera, A.; Meurer, K.; Berger, T. Climate-related land use policies in Brazil: How much has been achieved with economic incentives in agriculture? Land Use Policy 2021, 109, 105618. [Google Scholar] [CrossRef]
  12. Xie, H.; Zhang, Y.; Choi, Y. Measuring the cultivated land use efficiency of the main grain-producing areas in China under the constraints of carbon emissions and agricultural nonpoint source pollution. Sustainability 2018, 6, 1932. [Google Scholar] [CrossRef]
  13. Zhang, Y.; Feng, M.; Fang, Z.; Yi, F.; Liu, Z. Impact of Digital Village Construction on Agricultural Carbon Emissions: Evidence from Mainland China. Int. J. Environ. Res. Public Health 2023, 5, 4189. [Google Scholar] [CrossRef] [PubMed]
  14. Deaton, B.J.; Lawley, C.; Nadella, K. Renters, landlords, and farmland stewardship. Agric. Econ. 2018, 4, 521–531. [Google Scholar] [CrossRef]
  15. Hayami, Y.; Ruttan, V.W. Agricultural Development: An International Perspective; The Johns Hopkins Press: Baltimore, MD, USA; London, UK, 1971. [Google Scholar]
  16. Yu, Z.; Liu, J.; Kattel, G. Historical nitrogen fertilizer use in China from 1952 to 2018. Earth Syst. Sci. Data Discuss. 2022, 11, 5179–5194. [Google Scholar] [CrossRef]
  17. Zhao, Y.; Wang, L.; Lei, X.; Wang, B.; Cui, J.; Xu, Y.; Sui, P. Reducing carbon footprint without compromising grain security through relaxing cropping rotation system in the North China Plain. J. Clean. Prod. 2021, 318, 128465. [Google Scholar] [CrossRef]
  18. Lin, B.; Wang, X.; Jin, S.; Yang, W.; Li, H. Impacts of cooperative membership on rice productivity: Evidence from China. World Dev. 2022, 150, 105669. [Google Scholar] [CrossRef]
  19. Xiong, C.; Yang, D.; Xia, F.; Huo, J. Changes in agricultural carbon emissions and factors that influence agricultural carbon emissions based on different stages in Xinjiang, China. Sci. Rep. 2016, 1, 36912. [Google Scholar] [CrossRef] [PubMed]
  20. Mu, L.; Wang, Y.; Mao, H. Does Agricultural Insurance Drive Variations in Carbon Emissions in China? Evidence from a Quasi-Experiment. Pol. J. Environ. Stud. 2023, 32, 1. [Google Scholar] [CrossRef] [PubMed]
  21. He, P.; Zhang, J.; Li, W. The role of agricultural green production technologies in improving low-carbon efficiency in China: Necessary but not effective. J. Environ. Manag. 2021, 293, 112837. [Google Scholar] [CrossRef]
  22. Wang, Y.; Zhu, Y.; Zhang, S.; Wang, Y. What could promote farmers to replace chemical fertilizers with organic fertilizers? J. Clean. Prod. 2018, 199, 882–890. [Google Scholar] [CrossRef]
  23. Xu, Q.; Zhu, P.; Tang, L. Agricultural services: Another way of farmland utilization and its effect on agricultural green total factor productivity in China. Land 2022, 8, 1170. [Google Scholar] [CrossRef]
  24. Badr, K.; Rizk, R.; Zaki, C. Firm productivity and agglomeration economies: Evidence from Egyptian data. Appl. Econ. 2019, 51, 5528–5544. [Google Scholar] [CrossRef]
  25. Lan, F.; Sun, L.; Pu, W. Research on the influence of manufacturing agglomeration modes on regional carbon emission and spatial effect in China. Econ. Model. 2021, 96, 346–352. [Google Scholar] [CrossRef]
  26. Han, F.; Xie, R.; Fang, J.; Liu, Y. The effects of urban agglomeration economies on carbon emissions: Evidence from Chinese cities. J. Clean. Prod. 2018, 172, 1096–1110. [Google Scholar] [CrossRef]
  27. Sun, W.; Huang, C. How does urbanization affect carbon emission efficiency? Evidence from China. J. Clean. Prod. 2020, 272, 122828. [Google Scholar] [CrossRef]
  28. Campi, M.; Dueñas, M.; Fagiolo, G. Specialization in food production affects global food security and food systems sustainability. World Dev. 2021, 141, 105411. [Google Scholar] [CrossRef]
  29. Klasen, S.; Meyer, K.M.; Dislich, C.; Euler, M.; Faust, H.; Gatto, M.; Wiegand, K. Economic and ecological trade-offs of agricultural specialization at different spatial scales. Ecol. Econ. 2016, 122, 111–120. [Google Scholar] [CrossRef]
  30. Wang, R.; Zhang, Y.; Zou, C. How does agricultural specialization affect carbon emissions in China? J. Clean. Prod. 2022, 370, 133463. [Google Scholar] [CrossRef]
  31. Snapp, S.S.; Gentry, L.E.; Harwood, R. Management intensity–not biodiversity–the driver of ecosystem services in a long-term row crop experiment. Agric. Ecosyst. Environ. 2010, 3, 242–248. [Google Scholar] [CrossRef]
  32. Bizimana, C.; Nieuwoudt, W.L.; Ferrer, S.R. Farm size, land fragmentation and economic efficiency in southern Rwanda. Agrekon 2004, 2, 244–262. [Google Scholar] [CrossRef]
  33. Mohammadi, A.; Rafiee, S.; Jafari, A.; Keyhani, A.; Mousavi-Avval, S.H.; Nonhebel, S. Energy use efficiency and greenhouse gas emissions of farming systems in north Iran. Renew. Sustain. Energy Rev. 2014, 30, 724–733. [Google Scholar] [CrossRef]
  34. Wang, R.; Chen, J.; Li, Z.; Bai, W.; Deng, X. Factors analysis for the decoupling of grain production and carbon emissions from crop planting in China: A discussion on the regulating effects of planting scale and technological progress. Environ. Impact Assess. 2023, 103, 107249. [Google Scholar] [CrossRef]
  35. Ertunç, E. The Effect of Land Consolidation Projects on Carbon Footprint. Land 2023, 2, 507. [Google Scholar] [CrossRef]
  36. Xu, Y.; Ge, W.; Liu, G.; Su, X.; Zhu, J.; Yang, C.; Ran, Q. The impact of local government competition and green technology innovation on economic low-carbon transition: New insights from China. Environ. Sci. Pollut. Res. 2023, 9, 23714–23735. [Google Scholar] [CrossRef] [PubMed]
  37. Wei, M.; Yan, T.; Luo, S. The impacts of scale management and technological progress on green and low-carbon development of agriculture: A quasi-natural experiment based on the establishment of major grain-producing areas. Chin. Rural Econ. 2023, 2, 41–65. (In Chinese) [Google Scholar]
  38. Zeng, L.; Li, X.; Sun, Q. The impact of crop specialization on agricultural eco-efficiency. Chin. J. Agric. Resour. Reg. Plan. 2022, 8, 10–21. (In Chinese) [Google Scholar]
  39. Yang, G.; Li, S.; Wang, H.; Wang, L. Study on agricultural cultivation development layout based on the matching characteristic of water and land resources in North China Plain. Agric. Water Manag. 2022, 259, 107272. [Google Scholar] [CrossRef]
  40. Zhong, S.; Wang, M.; Zhu, Y.; Chen, Z.; Huang, X. Urban expansion and the urban–rural income gap: Empirical evidence from China. Cities 2022, 129, 103831. [Google Scholar] [CrossRef]
  41. Farooq, U.; Gang, F.; Guan, Z.; Rauf, A.; Chandio, A.A.; Ahsan, F. Exploring the long-run relationship between financial inclusion and agricultural growth: Evidence from Pakistan. Int. J. Emerg. Mark. 2023, 7, 1677–1696. [Google Scholar] [CrossRef]
  42. Zhan, X.; Shao, C.; He, R.; Shi, R. Evolution and efficiency assessment of pesticide and fertiliser inputs to cultivated land in China. Int. J. Environ. Res. Public Health 2021, 7, 3771. [Google Scholar] [CrossRef]
  43. Chi, Y.; Zhou, W.; Wang, Z.; Hu, Y.; Han, X. The influence paths of agricultural mechanization on green agricultural development. Sustainability 2021, 23, 12984. [Google Scholar] [CrossRef]
  44. Cai, B.; Shi, F.; Huang, Y.; Abatechanie, M. The impact of agricultural socialized services to promote the farmland scale management behavior of smallholder farmers: Empirical evidence from the rice-growing region of southern China. Sustainability 2022, 1, 316. [Google Scholar] [CrossRef]
  45. Baron, R.M.; Kenny, D.A. The moderator–mediator variable distinction in social psychological research: Conceptual, strategic, and statistical considerations. J. Personal. Soc. Psychol. 1986, 6, 1173. [Google Scholar] [CrossRef]
  46. Vennemo, H.; Aunan, K.; He, J.; Hu, T.; Li, S.; Rypd3al, K. Environmental impacts of China’s WTO-accession. Ecol. Econ. 2008, 4, 893–911. [Google Scholar] [CrossRef]
  47. Nunn, N.; Qian, N. US food aid and civil conflict. Am. Econ. Rev. 2014, 6, 1630–1666. [Google Scholar] [CrossRef]
  48. Wang, F.; Ge, X. Can Low-carbon Transition Impact Employment: Empirical Evidence from Low-carbon City Pilot Policy. China Ind. Econ. 2022, 5, 81–99. (In Chinese) [Google Scholar]
  49. Heckman, J.; Pinto, R.; Savelyev, P. Understanding the mechanisms through which an influential early childhood program boosted adult outcomes. Am. Econ. Rev. 2013, 6, 2052–2086. [Google Scholar] [CrossRef]
  50. Sah, D.; Devakumar, A.S. The carbon footprint of agricultural crop cultivation in India. Carbon Manag. 2018, 3, 213–225. [Google Scholar] [CrossRef]
  51. Li, Q.; Wang, J.; Wu, J.; Zhai, Q. The dual impacts of specialized agricultural services on pesticide application intensity: Evidence from China. Pest Manag. Sci. 2023, 1, 76–87. [Google Scholar] [CrossRef]
  52. Veysset, P.; Lherm, M.; Bébin, D.; Roulenc, M.; Benoit, M. Variability in greenhouse gas emissions, fossil energy consumption and farm economics in suckler beef production in 59 French farms. Agric. Ecosyst. Environ. 2014, 188, 180–191. [Google Scholar] [CrossRef]
  53. Huang, C.; Wang, J.W.; Wang, C.M.; Cheng, J.H.; Dai, J. Does tourism industry agglomeration reduce carbon emissions? Environ. Sci. Pollut. Res. 2021, 28, 30278–30293. [Google Scholar] [CrossRef] [PubMed]
  54. Rigg, J.; Salamanca, A.; Thompson, E.C. The puzzle of East and Southeast Asia’s persistent smallholder. J. Rural Stud. 2016, 43, 118–133. [Google Scholar] [CrossRef]
Figure 2. China’s MGPA and non-MGPA. Note: The map is based on the standard map with review number GS(2023)2767, which was downloaded from the standard map service website of the Ministry of Natural Resources of China.
Sustainability 16 04607 g002
Figure 3. Parallel trends tests and trends in the impact of policy dynamics. (a) Control variables not included; (b) inclusion of control variables. Note: (i) Vertical dashed lines indicate 90% confidence intervals for the parameters; (ii) 2004 is the year of policy implementation, used as the base group, so there is no year 2004 on the horizontal axis.
Sustainability 16 04607 g003
Figure 4. Distribution of t-statistic values of the MGPA through 1000 random simulations. Note: The horizontal axis represents the simulated t -statistic value, and the vertical axis represents the number of occurrences of the simulated t-statistic; the curve is a normal distribution with mean being 0; the vertical line is the actual t-statistic value −2.77.
Sustainability 16 04607 g004
Table 1. Descriptive statistics of variables.
SymbolsVariableObs.MeanSDMinimumMaximum
Explained variables
lnTACETotal amount of agricultural carbon emissions68214.8061.12511.56916.404
lnAACEPer unit area of agricultural carbon emissions682−0.2040.272−0.7820.564
Explanatory variable
MGPAMain grain-producing areas6820.3240.46801
Mediation variables
lnHHIHerfindahl–Hirschman Index682−0.6450.228−1.205−0.046
lnPCPProfessional level of crop planting682−0.6720.217−1.288−0.077
Control variables
lnAIThe level of agricultural irrigation6823.6560.4022.6324.814
lnISIndustrial structure6823.7460.1933.3534.429
lnFSAThe financial support of agriculture6827.7191.6764.06712.075
lnURIGThe urban–rural income gap6828.4170.6327.1779.967
lnAHCAgricultural human capital6821.9590.181−0.4412.276
Other variables
lnFAThe intensity of fertilizer application6825.7360.3844.5676.683
lnPAThe intensity of pesticide application 6824.4010.7652.6716.336
lnPFUThe intensity of plastic film usage6824.7830.7961.0566.767
lnLAMLarge agricultural machinery6822.7241.135−2.5995.853
lnASAgricultural service sector6820.9760.683−1.1902.405
Table 2. Impact of MGPA on ACE.
Variable NamelnTACElnAACE
Reg. 1Reg. 2Reg. 3Reg. 4
MGPA0.048
(0.068)
0.018
(0.057)
−0.088 ***
(0.031)
−0.071 ***
(0.023)
Cons_14.790 ***
(0.987)
8.099 ***
(2.324)
−0.176 ***
(0.010)
−1.055
(1.148)
Control variableNoYesNoYes
Province fixedYesYesYesYes
Time fixedYesYesYesYes
Obs.682682682682
R 2 0.9870.9900.9360.950
Note: (i) *** denote 1% significance levels, respectively; (ii) standard errors are robust standard errors.
Table 3. Regression results excluding the effect of WTO accession.
Variable NamelnAACE
Reg. 1Reg. 2
MGPA−0.07 **
(0.028)
−0.059 **
(0.024)
dWTO−0.044 ***
(0.016)
−0.032 **
(0.016)
Cons_−0.165 ***
(0.013)
−1.020
(1.155)
Control variableNoYes
Province fixedYesYes
Time fixedYesYes
Obs682682
R 2 0.9360.950
Note: (i) *** and ** denote 1% and 5% significance levels, respectively; (ii) standard errors are robust standard errors.
Table 4. Regression results of truncated test.
Variable NamelnAACE
Reg. 1Reg. 2Reg. 3Reg. 4
MGPA−0.86 **
(0.032)
−0. 075 ***
(0.025)
−0.076 ***
(0.026)
−0.073 ***
(0.023)
Cons_−0.178 ***
(0.011)
−1.457
(1.073)
−0.184 ***
(0.010)
−2.014 **
(0.918)
Control variableNoYesNoYes
Province fixedYesYesYesYes
Time fixedYesYesYesYes
Obs.670670614614
R 2 0.9370.9480.9300.941
Note: (i) *** and ** denote 1% and 5% significance levels, respectively; (ii) standard errors are robust standard errors.
Table 5. Regression results of endogeneity test.
Variable NamelnAACE
IV-2SLSPSM-DID
Reg. 1Reg. 2Reg. 3Reg. 4
Land0.299 ***
(0.064)
------
MGPA--−0.377 **
(0.181)
−0.094 ***
(0.026)
−0.091 ***
(0.025)
Cons_−5.078 ***
(1.741)
−4.709 ***
(0.394)
−1.480
(1.219)
−1.472
(1.252)
Control variableYesYesYesYes
Province fixedYesYesYesYes
Time fixedYesYesYesYes
Obs 682682682
R 2 0.9900.9510.955
KP rk LM 9.400 ***
LM P value 0.002
C-D wald F 168.118
K-P rk wald F 21.713
Note: (i) *** and ** denote 1% and 5% significance levels, respectively; (ii) standard errors are robust standard errors.
Table 6. Regression results of carbon reduction mechanism of PS.
Variable NamelnHHI
Reg. 1
lnAACE
Reg. 2
lnPCP
Reg. 3
lnAACE
Reg. 4
The MGPA policy0.131 ***
(0.043)
−0.040 *
(0.022)
0.120 ***
(0.043)
−0.048 **
(0.023)
lnHHI--−0.239 ***
(0.071)
----
lnPCP------−0.194 ***
(0.066)
Cons_2.431 ***
(2.080)
−0.475
(1.108)
1.820
(2.106)
−0.703
(1.162)
Control variableYesYesYesYes
Province fixedYesYesYesYes
Time fixedYesYesYesYes
Obs.682682682682
R 2 0.8670.9560.8390.954
Note: (i) ***, ** and * denote 1%, 5% and 10% significance levels, respectively; (ii) standard errors are robust standard errors.
Table 7. Heterogeneity analysis.
Variable NamelnAACE
Eastern
Region
Central
Region
Western
Region
Southern
Region
Northern
Region
Below the
National Average
Above the National
Average
MGPA−0.063
(0.050)
−0.035 **
(0.054)
−0.104 ***
(0.054)
−0.036
(0.023)
−0.087 **
(0.032)
−0.109 ***
(0.034)
−0.026
(0.028)
Cons_−0.535
(1.574)
−1.124
(0.739)
0.122
(1.649)
0.851
(2.143)
0.416
(2.164)
1.311
(1.889)
−0.547 ***
(0.869)
Control
variable
YesYesYesYesYesYesYes
Province fixedYesYesYesYesYesYesYes
Time fixedYesYesYesYesYesYesYes
Obs242198242352330352330
R 2 0.9060.9540.9560.9060.9560.9420.939
Note: (i) *** and ** denote 1% and 5% significance levels, respectively; (ii) standard errors are robust standard errors.
Table 8. Results of further regressions.
Variable NamelnFA
Reg. 1
lnPFU
Reg. 2
lnPA
Reg. 3
lnLAM
Reg. 4
lnAS
Reg. 5
MGPA−0.081 *
(0.048)
−0.340 ***
(0.120)
−0.020
(0.087)
0.423 *
(0.232)
0.360 *
(0.206)
Cons_3.028
(1.976)
6.310
(4.567)
3.542
(3.366)
−10.970
(8.371)
5.187
(8.808)
Control variableYesYesYesYesYes
Province fixedYesYesYesYesYes
Time fixedYesYesYesYesYes
Obs.682682682682682
R 2 0.9410.8880.9470.8560.724
Note: (i) *** and * denote 1% and 10% significance levels, respectively; (ii) standard errors are robust standard errors.
Disclaimer/Publisher’s Note: The statements, opinions and data contained in all publications are solely those of the individual author(s) and contributor(s) and not of MDPI and/or the editor(s). MDPI and/or the editor(s) disclaim responsibility for any injury to people or property resulting from any ideas, methods, instructions or products referred to in the content.

