Review

Towards a Sustainable Urban Future: A Comprehensive Review of Urban Heat Island Research Technologies and Machine Learning Approaches

by
Siavash Ghorbany
1,*,
Ming Hu
2,
Siyuan Yao
3 and
Chaoli Wang
3
1
Department of Civil and Environmental Engineering and Earth Sciences, College of Engineering, University of Notre Dame, Notre Dame, IN 46556, USA
2
School of Architecture, Walsh Family Hall of Architecture, University of Notre Dame, Notre Dame, IN 46556, USA
3
Department of Computer Science and Engineering, College of Engineering, University of Notre Dame, Notre Dame, IN 46556, USA
*
Author to whom correspondence should be addressed.
Sustainability 2024, 16(11), 4609; https://doi.org/10.3390/su16114609
Submission received: 10 April 2024 / Revised: 9 May 2024 / Accepted: 27 May 2024 / Published: 29 May 2024
(This article belongs to the Section Sustainable Urban and Rural Development)

Abstract

:
The urban heat island (UHI) is a crucial factor in developing sustainable cities and societies. Appropriate data collection, analysis, and prediction are essential first steps in studying the effects of the UHI. This research systematically reviewed the papers related to the UHI that have used on-site data collection in the United States and Canada and the papers related to predicting and analyzing this effect in these regions. To achieve this goal, this study extracted 330 articles from Scopus and Web of Science and, after selecting the papers, reviewed 30 papers in detail from 1998 to 2023. The findings of this paper indicated a methodological shift from traditional sensors and data loggers towards more innovative and customized technologies. Concurrently, this research reveals a growing trend in using machine learning, moving from supportive to direct predictive roles and using techniques like neural networks and Bayesian networks. Despite the maturation of UHI research due to these developments, they also present challenges in technology complexity and data integration. The review emphasizes the need for future research to focus on accessible, accurate technologies. Moreover, interdisciplinary approaches are crucial for addressing UHI challenges in an era of climate change.

1. Introduction

The urban heat island (UHI) is a critical issue in modern urban planning, significantly impacting various societal aspects such as physical and mental health [1,2], city resident’ work efficiency level [3], energy usage and burden [4], and climate change [4,5]. Defined as the phenomenon of higher temperatures in urban areas compared to their surroundings, UHI is exacerbated by factors like increased artificial surfaces, reduced vegetation, and heat emissions from human activities [5]. Furthermore, UHI is intensified by transforming natural surfaces into impermeable ones, leading to reduced evapotranspiration and increased solar radiation absorption in urban environments [6].
Amidst climate change and urbanization, UHI studies have become increasingly vital [7,8]. These studies are crucial for effective urban planning, as UHI affects both socio-economic and environmental aspects, thereby influencing urban livability [9,10,11]. The first step in addressing UHI involves appropriate data collection and processing. However, challenges persist in selecting suitable methods for data collection and analysis. Despite the advancements in satellite imagery and remote sensing, which aid in overcoming these challenges, they present limitations in spatial and temporal resolution [12], limited data capture, and inconsistency in the captured data location [12,13,14]. Consequently, despite the difficulty of field data collection and the fact that it usually proposes a slower process, which relies highly on human resources, and albeit the fact that it is lacking in comprehensive guidelines, on-site data collection remains the most accurate. Following accurate data collection and data analysis, predicting the UHI is of the utmost importance and needs an in-depth understanding of useful methods in this field. Herein, the machine learning (ML) approaches are the most effective methods in handling multi-aspect complex problems and can be helpful in solving multidisciplinary built-environment-related problems [15,16]. Furthermore, the UHI concept has received comparatively less attention in the United States and Canada than in Asia and Europe.
This research conducts a systematic literature review on the UHI measurement and its predictions in North America, focusing on the United States and Canada. The objectives are to (1) describe the significance of UHIs in urban planning, public health, and environmental sustainability; (2) explore technologies used for the data collection and data visualization, and (3) examine data analyses and prediction methods, including machine learning. By presenting methodologies, analyzing findings, and discussing common themes and future research direction, this paper aims to help researchers assess various methods for UHI identification and analysis and identify current gaps in this field.

2. Methodology

The PRISMA method was used in this research to perform a systematic literature review on UHI measurement and the UHI prediction methods in North America [17,18]. The research was executed using a combination of keywords in the field of UHI to find the articles on Scopus and Web of Science as the two main resources for article extraction. The areas of the search were limited to Environmental Science, Engineering, Energy, Computer Science, and Multidisciplinary areas. The region was also limited to the United States and Canada. In this research, the urban heat island was defined as high temperatures in urban areas compared to their surroundings in the same area [19,20,21]. The keywords used in this research were divided into two sets of keywords, one for the UHI-effect measurement methods and another for the combination of computer-based prediction methods of UHI. For the first category, the combination of the Urban Heat Island and UHI with “Data Collect”, “Data Collection”, “Data Collecting”, “Map”, “Visualization”, “Sensor”, “Data Logger”, “Data Logging”, “Data Gathering”, “on-site measurement”, and “on field measurement” were used. The second set of keywords used was the combination of Urban Heat Island and UHI with “Forecast”, “Forecasting”, “Machine Learning”, “Data mining”, “Predict”, “Prediction”, and “Predicting”. The search was conducted in the Abstract, Title, and Keywords fields. As a result of this search, the sum of 330 papers were found, of which 139 were related to the first group and 191 to the second group of the search. After deleting the duplicates, a total of 217 articles remained for the screening phase. In the paper-screening phase, the authors went through the abstract of the papers to determine their suitability for the criteria in this research according to the PRISMA methodology. The criteria were defined as follows:
For UHI and Sensor/Data Collection/Visualization papers:
(1)
Primary data: the data collected from the field using sensors, data loggers, etc. (not satellite, remove remote sensing-related papers).
(2)
Data collected over multiple days.
(3)
Data being used for urban heat island identification purposes.
(4)
Collected at least two data types (e.g., temperature and humidity)
(5)
Outcome: include heatmaps and visualization of the data.
(6)
Restricted US and Canada; make sure the paper is related to one of the urban areas in Canada or the United States.
(7)
Conclusion: related to Smart Technologies.
For UHI and Machine Learning/Prediction papers:
(1)
Primary data: the data collected from the field using sensors, data loggers, etc. (not satellite, remove remote sensing-related papers).
(2)
Using at least one of the machine-learning or deep-learning algorithms
(3)
Restricted to US and Canada; make sure the paper is related to one of the urban areas in Canada or the United States.
(4)
Prediction: concentrated on the urban heat island prediction (temperature, humidity).
(5)
Outcome: include heatmaps and visualization of the data.
The review articles and books were excluded from this search. As a result of this search, a total of 35 articles were selected. After a thorough review of these articles 33 papers, 19 articles in the field of UHI data collection and 14 in the Machine Learning and Prediction combination with UHI, were selected, from which 3 more were excluded due to lack of contribution to UHI-related applications. The flowchart of the paper selection has been demonstrated in Figure 1.

3. Overview Findings

3.1. Data Collection Technologies

Our systematic review, which emphasizes on-site data collection, organizes UHI research into two subcategories; one uses off-shelf data loggers as the traditional method of data collection, whilst the other category uses more innovative and customized sensors and devices (refer to Table 1).
The papers related to using more traditional ways of data collection started in 1998, using medical syringes to collect the CO2 data and basic thermometers [22], and continued until 2022, when most of the research was using HOBO data loggers like those by studies [23,24].
In the second category, the researchers tried to build some custom devices to reduce the bias in the data collection or add more capabilities to the current devices by combining them. For instance, researchers [25] made a wearable helmet using 3D printing to combine a GPS sensor, visible camera, infrared camera, and weather stations for data collection, while other researchers used a golf cart to build a device that captures the surface and air temperature at the same time [26].

3.1.1. Off-Shelf Sensors and Data Loggers

Table 2 demonstrates the timeline for each of the studied papers. As can be seen, the primary trend of working on UHI data collection started in 2014 in the United States and Canada. Moreover, out of 12 papers using the conventional data loggers, 7 of them were using HOBO instruments while most of the others were still using the equivalent devices from other companies.
The traditional type of devices used for UHI studies started in 1998 in Phoenix, Arizona, where the researchers utilized very basic tools, including medical syringes, to collect the CO2 data and interpret it using an ADC-225-MK3 infrared gas analyzer [22]. It also used the Campbell Scientific Temperature and Relative Humidity Probe, model number CS500, to capture the temperature and relative humidity data. CO2 concentrations in Phoenix’s urban CO2 dome were found to be 555 ppmv in the city center and 370 ppmv outside. Subsequent to this research, after a 10-year gap, another research study in 2008 used a combination of HOBOs samplers and Landsat-5/TM satellite data to explain the indoor temperature variability based on the UHI data in Montreal, QC, Canada [23]. The data related to this study was collected in July 2005 with a 10 min data collection interval. This research found that an increase of 1 °C in external temperature causes an increase of 0.05 °C indoors and that the average temperature over the previous 24 h has a big impact on interior temperatures [23].
Another study in Manhattan achieved a high spatial resolution of temperature and humidity data, although mobile sensor data proved to be sporadic [27]. The study highlighted the complex interplay of humidity, temperature, and urban design in UHI. This research divided the data collection into mobile and fixed sensors, using HOBO instruments (fixed) every 3 min and Vernier instruments (mobile) with 10 s intervals through late June to August of 2012 and mid-July to early October of 2013. The study encountered difficulties that affected the measurement accuracy, such as insolation-related biases in the apparatus and the actual placement of instruments by field personnel. Around the same time, another study was conducted in Madison Wisconsin, United States, which used temperature, apparent temperature, extreme heat, extreme cold, and weather covariates (temperature, wind speed, snow depth, percent sun) data to assess the UHI [28]. The data collection in this study was carried out using 135 HOBO® U23 Pro v2 (Onset Electronics Manufacturer, Bourne, MA, USA) temperature/relative humidity sensors covered in solar shields from summer 2012 to winter 2013, at 15min intervals.
Research in New York City [29] utilizing various sensors underscored the pronounced UHI effects during heat waves, despite challenges in modeling surface-atmosphere interactions. The study utilized multi-channel radiometers (Radiometric MP-3000A), ground-based weather stations (ASOS, APRSWXNET), and indoor sensors, and discovered that New York’s urban heat island (UHI) intensity nearly doubled the decadal average in July 2016, reaching as high as 10 °C. However, the lack of direct wall-temperature observations further restricted the understanding of the dynamics of urban heat. Later, in 2019, a study conducted in the Greater Vancouver urban area, British Columbia, Canada, from late May to early September collected urban vegetation from pedestrian-level videos using color-based image processing [30]. This study used a GoPro camera (GoPro Inc., San Mateo, CA, USA), GPS (GPSMAP 78s, Garmin Ltd, Olathe, KS, USA), and a thermometer to analyze video data from 20 walking routes, and utilized a Met One 064-2 Thermometer (Met One Inc., Grants Pass, OR, USA) to collect the temperature data. This study emphasized the cooling properties of vegetation and contributed to the understanding of urban heat islands [30].
In 2020, two studies worked on collecting the data for UHI analysis in conventional ways. The first one used PurpleAir PA-II sensors to examine the temporal and geographical patterns of PM2.5 concentrations and intense heat in Richmond, Virginia [31]. The data collection was carried out from 14 February to 14 November 2019, with 2 min time intervals, and revealed differences in the amount of heat exposure and air quality among various socioeconomic groups, and discovered that places with intense heat frequently had worse air quality, especially the less wealthy eastern regions of the city [31]. Although inexpensive, these sensors were not very accurate and were sensitive to humidity, which might have an impact on PM2.5 measurements. Study [24] performed research at the Georgia Institute of Technology, Atlanta, United States, to assess the impact of vegetation and tree canopy on the UHI. This study used HOBO U23 Pro v2 with RS3 radiation shields to collect the data during the summer of 2017 at the University Campus. This research used ArcGIS 10.5 and R to analyze the data. The results showed that vegetated sites are up to 3.77 °C colder than settings without vegetation and that UHI is correlated with tree canopies [24].
In another study, researchers showed that, particularly on hot days, trees lower the ambient air temperature in the city of Camden, New Jersey, United States [32]. This research also demonstrated that north–south streets are hotter at night, whereas east–west streets are hotter during the day. The researchers used the HOBO Model U23, Solar Radiation Shield (HOBO RS1), Mounting setup (with ArborTie, DeepRoot Green Infrastructure, San Francisco, CA, USA), and the NIST-traceable thermometer with VWR model 1186D water bath (for calibration) for the data collection during early August through late-November 2017, with 10 min intervals. The study contrasted temperatures beneath street trees of different sizes, which are deciduous, with control sites that have no trees. Another study in 2021 worked on the impact of vegetation on the UHI in the same year. This study took place in Salt Lake Valley, Utah, United States [33]. The researchers ran the data collection in June, July, and August of 2016 with 15 min time intervals using HOBO Temperature Dataloggers (U23-002 and H8), 6-plate Radiation Shields (Model 41303, Campbell Scientific, Inc, Logan, UT, USA), Handheld Infrared Thermometer (Omegascope OS530L) Type-T Thermocouples attached to Omega HH509 thermocouple meters (Omega Engineering Instrumentation company, Norwalk, CT, USA), and eTrex 20x GPS (Garmin Ltd., Olathe, KS, USA) to collect the temperature and humidity data. However, the area of the research was in urban parks and residential neighborhoods, and, therefore, these sensors were prone to radiative heating errors.
One of the most recent studies conducted in Baltimore City compared mobile- and fixed-sensor data, suggesting a hybrid approach to urban temperature monitoring to balance accuracy and coverage [34]. The study discovered that although fixed sensor monitoring has logistical demands and high costs, it is more representative and provides better spatial inference. This study used “iButton” Model DS1923 Hygrochron (iButtonLink, LLC, Whitewater, WI, USA) thermometer/hygrometers as the fixed sensors while mounting the Resistance Temperature Detector (RTD) known as a thermocouple on a vehicle, to record the temperature data [34]. The most recent study in the field of UHIs that collected the data using traditional dataloggers was conducted in Chicago’s Loop neighborhood and used more than 150 HOBO (Onset Electronics Manufacturer, Bourne, MA, USA) and Elitech wireless sensors (Elitech Technology Inc, San Jose, CA, USA) in a variety of settings to look into subsurface urban heat islands (SUHIs) and try to identify their origins as well as their features [35]. The study found that the design and operational characteristics of subterranean buildings impacted the regional variability in SUHI temperatures [35].

3.1.2. Novel Technologies and Approaches

Most research conducted in Canada and the United States on UHI has used off-the-shelf data loggers, such as HOBO data loggers. However, since 2014, a few researchers have begun to adopt more innovative methodologies. A study published that year investigated two locations: one in downtown Nanaimo in British Columbia, Canada, and the second in Changwon in the Republic of Korea. This study carried out a data collection on June, 2009, at three sites in Nanaimo. To gather data, Raytek PM Plus (a portable non-contact thermometer) was used to measure surface temperatures in Nanaimo, while the CMP 11 and NR Lite were employed to measure humidity and temperature, respectively. Results indicated that Changwon recorded a temperature range from 27.8 °C to 29.3 °C with relative humidity from 33% to 44%, whereas Nanaimo’s experienced temperatures ranged from 22.9 °C to 28.7 °C, with humidity from 62% to 78%. A disparity was observed between the radiant temperatures in wide areas, which ranged from 50 °C to 60 °C, and those in narrow streets, which spanned from 40 °C to 50 °C [36].
Later, in 2018, [37] researchers designed a methodology for measuring air temperature using thermal cameras. Temperature data were collected at one and two meters above ground level using FLIR thermal imaging cameras by Teledyne FLIR Company, Wilsonville, OR, USA, and FLIR Tools software (2017), with the results closely aligning with weather station data. However, challenges were encountered at a one-meter height, necessitating further testing. To comprehend the relationship between surface and air temperatures, particularly over various infrastructures like green spaces, the research proposed a novel approach using infrared thermography [37].
Another study conducted at the main campus of Arizona State University employed a custom-built mobile platform, Marty, to study micrometeorological factors affecting pedestrian thermal exposure during extreme heat [38]. The study observed significant variations in thermal exposure attributable to lateral radiation inputs; mitigative cooling effects were provided by vegetation, shade, and cold surfaces, while the role of vegetation at night was emphasized. However, the duration of the research was constrained to a single day due to operational difficulties, potential health risks, and limitations pertaining to the sensors and data categorization [38].
Study [26] used custom-built mobile devices by attaching the instruments to a golf cart to collect the meteorological data and pyranometers to detect the albedo of the roads in the Power Ranch community, Phoenix, Arizona, to assess the pavement and surface impact on the UHI [26]. This study ran into several issues with sensor latency and temporal coverage limitations, but the findings demonstrated that although conventional concrete with a greater albedo did not considerably lower temperature, fresh asphalt raised it by as much as 0.5 °C. The air temperature did, however, drop in areas with greater reflecting surfaces, such as reflective concrete roofs and sidewalks.
Another study mapped urban microclimates in New York City using wearable weather stations, which highlighted the varied thermal sensations and underscored the significant role of urban parks in mitigating UHIs. Challenges with data accuracy occurred due to the orientation of wearable devices. Nonetheless, the study demonstrated the value of citizen science and portable measurement techniques in urban planning, exemplifying how urban parks, such as Bryant Park, positively influenced local microclimates [25]. This research was particularly innovative in its creation of a helmet-mounted sensor array. The sensors, which were installed on a medical stroller, included wearable weather stations, a GPS sensor, a visible camera, an infrared camera, a dedicated mobile graphical interface, and Wi-Fi data transmission capabilities.
In the most recent study, researchers [39] conducted on-site data collection to measure the UHI effects in several regions of the United States, namely Miami, Los Angeles, Denver, and Chicago. The study spanned from 1 January 2019 to 31 December 2019, and utilized an hourly data collection interval [39]. The temperature data were collected from the University Corporation for Atmospheric Research (UCAR) UrbaNet database, while rural temperatures were obtained from the nearest airport weather stations to the respective urban centers.

3.2. UHI Prediction and Machine Learning Application

Despite the advancements in the field of machine learning and artificial intelligence and their applications in diverse fields, their use in urban heat island prediction remains underexplored. The machine learning approaches excel at addressing complex issues beyond the capabilities of conventional statistic methods [40,41]. Whilst the challenges in the interpretation of a number of machine learning models results and their black-box nature usually bring challenges and a trade-off question as to their applications [42,43,44,45], these methods are particularly effective with the time-series and recurrence-related issues, which is crucial for the UHI analysis due to the sequential nature of the temperature data [46,47]. However, research within this domain has not been extensively pursued in the United States and Canada. Studies on computer-based UHI prediction in these countries can be divided into two distinct categories: (1) Non-Machine Learning Prediction models and (2) Statistical and Machine Learning Methods in Prediction. The overall statistics of these papers are shown in Table 3.

3.2.1. Non-Machine Learning Models

The first category of the prediction models in the UHI comprises non-machine learning models that were primarily utilized between 2012 and 2014 in the United States and Canada. Researchers [48] collected data on temperature, dew-point temperature, wind speed, and wind direction in Southeast Texas, Houston, U.S., on the 17 and 18 August 2006. They employed the Advanced Research Weather Research and Forecasting model (ARW-WRF) coupled with an atmosphere–land surface–urban canopy model, to simulate a realistic sea-breeze event. The study demonstrated the application of the bulk Richardson number for modeling local mesoscale circulation and evaluated the impact of lidar-derived urban canopy parameters on the simulation of coastal–urban circulation systems, aiding in UHI identification [48].
In research implemented in several locations across Ontario, Canada over the same period, study [49] used a Newtonian convective cooling model to forecast the winter under-bark temperature minimum of trees and its effect on insect colonization. Hourly data were collected for the study using HOBO 2× External Temperature Data Loggers (Model U23-003, from Onset Electronics Manufacturer, Bourne, MA, USA) between September 2008 and March 2010. The findings improved knowledge of microclimate differences in woodlot and urban environments, considering the impacts of urban heat islands while refining models.
Researchers [50] refined UHI modeling and energy prediction in New York City with data from 4–8 July 2010. They enhanced a Weather Research and Forecasting (WRF) model by incorporating high-resolution urban canopy parameters and validating it with extensive observational data, leading to more accurate UHI predictions and energy forecasts [50].
In 2014, a study conducted in New Jersey and Phoenix applied Subset Simulation, a sequential Monte Carlo method, for sensitivity analysis based on data from May 2010 and July 2012, respectively [51]. The research assessed green roofs’ performance across different climates and the sensitivity of urban hydrological models to input parameters, with a focus on UHI mitigation. Findings indicated that green roofs influence thermal and hydrological behaviors, contributing to UHI prediction [51].
After an 8-year gap for non-machine learning studies, in 2022 a study utilized data from the Long-Term Pavement Performance (LTPP) program from three sites in Alabama, Virginia, and Wyoming in the United States to make specific improvements to the Enhanced Integrated Climactic Model (EICM) for more accurate pavement temperature predictions for a better understanding of UHI effects. This research used a one-dimensional finite element model for analyzing pavement temperatures [52]. Although this research was not directly aimed at assessing the UHI, it was closely related to one of the important aspects of the UHI, surface temperature.
Overall, the non-machine learning methods have not been widely used for UHI prediction and were mostly used to assess the UHI and another factor (usually the tree canopy in urban areas) of interaction. Although these methods help the UHI identification process, the use of complex models such as Newtonian convective cooling models and ARW-WRF may provide accessibility and usability issues for municipal authorities and urban planners. These models’ complexity may prevent them from being used practically in urban planning when funding and technological guidelines are limited. Therefore, there is always a question of scalability for such studies.

3.2.2. Statistical and Machine Learning Models

The machine learning and data mining method is one of the most useful methods for predicting the UHI which has been used in Canada and the United States since 2012 and has had an inclining trend in previous years. Researchers [53] published the first research paper in this area conducted on the Island of Montreal, Canada, with data collected during the summer of 2010 using Hobo U10 data loggers (Onset Electronics Manufacturer, Bourne, MA, USA) [53]. This study used an Artificial Neural Network (ANN) model. Although this study’s primary objective is to develop predictive models for indoor temperatures, particularly in the context of UHI, rather than predicting the UHI effect itself, the reduced errors showed the strength of neural networks and provided the first empirical justification for the usage of neighborhood-specific parameters in UHI research.
Later on, other researchers worked on research in the New England region in the United States using spatial statistical network models, statistical tools used to analyze and predict data patterns in geographical networks, to understand the UHI impact on stream and river temperatures [54]. The researchers constructed two unique indices to evaluate the effects of urban heat islands: one based on the density of metropolitan areas, and the other on the difference between land surface temperatures measured by remote sensing and predicted air temperatures. However, they acknowledged that these methods of assessing the effects of urban heat islands were crude and needed to be improved [54].
In New York City and Pittsburg, researchers [55] conducted research to model the urban temperature. The study’s use of Gaussian process models for temperature field prediction and decomposition represents a methodological leap in UHI investigations. This research contributes to the body of knowledge on urban heat indices and offers public health and urban planners useful information on how to reduce the dangers associated with high heat occurrences [55]. This study can be known as the first research that worked on implementing the statistical model directly in the UHI prediction.
Later, a study for the prediction of UHI was carried out in the Northeast region of the United States, including Baltimore, Boston, Philadelphia, and New York City, based on the data collection from May–September of 2006–2013 [56]. This study used Random Forest-based Regression Kriging (RFRK) to predict air temperature using environmental covariates and collected the air temperature, relative humidity, atmospheric pressure, wind speed, wind direction, and rainfall data to predict the UHI [56]. The findings identified the greatest UHI intensity in dry tropical weather types and showed evidence for higher temperature variability in all cities except Boston.
The first U.S. and Canadian study to consider the time-series nature of UHI temperatures was conducted in 2021 at Harvard University, Cambridge, MA, between January and December [57]. This research used Global Horizontal Irradiance (GHI), Direct Normal Irradiance (DNI), and Diffuse Horizontal Irradiance (DHI) data and Recurrent Neural Networks (RNNs). Data were collected from the National Solar Radiation Database (NSRDB) and on-site sensors. Through the use of public data and minimal on-site measurements, the primary objective of the research was to generate accurate, localized weather predictions, which will improve building performance simulations and inform early-stage design decisions [57]. The results demonstrated that the use of RNNs can enhance building performance simulations and address UHI more effectively.
In 2023, two studies implemented Bayesian Networks in the field of UHI prediction [58,59], while another research used Artificial Neural Networks (ANNs) for Urban Canopy Temperature and UHI prediction [60]. The Bayesian Network research in New Jersey used a data-driven strategy and machine learning techniques to predict UHI severity, demonstrating high performance in accuracy, precision, recall, F1 score, and AUC. That said, the study’s narrow focus on New Jersey limits its generalizability, and further research may be needed to adapt the model to different geographical situations [58]. The second Bayesian Network study considered 32 variables, contributing to UHI prediction by mining causal relationships for a better understanding of UHI and improving prediction through score-based Bayesian-network structure learning and hyper-parameter tuning [59]. Overall, the first study focuses on parameter learning, while the second delves into structure learning and network pruning, investigating causal linkages among factors impacting UHI severity.
In 2023, a study presented an advanced method for predicting wind speed and temperature in urban canopies using Artificial Neural Networks (ANNs) [60]. This approach significantly increases the accuracy of building energy simulations by considering local urban climatic conditions. However, its complexity, computational intensity, and dependence on specialized tools like MATLAB and ENVI-met pose difficulties in terms of knowledge, resources, and accessibility. The research, implemented in downtown Vancouver, Canada, used air temperature, wind speed, solar radiation, and relative humidity data, along with HOBO U10-003 data loggers. While the model is adaptable to different urban settings, its accuracy varies for various locations [60].
Overall, the machine-learning and data-mining method can be recognized as the most recent topic in the field of UHI that has started to gain more attention recently. Most of the research in this area was trying to investigate the relationship between the UHI and some other factors, and predicting the UHI was considered only as a tool for better understanding of the second factor. However, recent papers in 2023 showed that this trend might start to change, and more researchers are considering the importance of the UHI prediction itself as a research question.

3.3. Synthesis of Findings across Studies

The synthesis of findings from the reviewed studies highlights several overarching trends in UHI research. First, there is a clear movement from traditional data collection methods toward more advanced technological applications, reflecting broader trends in environmental science and technology. Despite varied approaches, a common theme across studies is the significant impact of urban morphology on UHI intensity, indicating a need for urban design considerations in mitigation strategies. Moreover, machine learning models are increasingly applied to predict UHI effects with varying degrees of success, often limited by data quality and model transparency. These findings suggest a converging acknowledgment of the complexity of UHI phenomena, and the multifaceted strategies required to address them effectively.

4. Discussion

4.1. The Urban Heat Island Papers Comparison

4.1.1. Methodological Evolution and Focus

Initial Studies (1998–2014)

Research in this area in the United States and Canada started with studies [22,23] as the basic data collection methods, and Park et al. (2014) [36] as the more novel approaches and technologies. These foundational studies identified key relationships between UHIs and environmental factors, setting the stage for future research; however, they had limited technological application and data complexity. Therefore, the trend shows a move from basic tools like medical syringes and thermometers to more sophisticated instruments like wearable sensors and mobile platforms.

Advancement through Technology (2014–Present)

Between the years 2014 and 2023, the trend for UHI research started to grow in the United States and Canada (see Figure 2). Initially, research in UHI relied heavily on traditional data collection methods, using premanufactured sensors and data loggers. However, recently, novel technologies and custom devices have emerged, which aim to reduce bias and enhance data accuracy. The emergence of these technologies and UHI evolution in the mentioned period has several possible reasons. The rise in climate change awareness significantly influenced environmental research, with the 2015 Paris Agreement serving as a catalyst [61]. This global commitment spurred the need for advanced urban climate studies, including UHI research, to meet sustainability targets. Technological advancements, especially in sensor and remote-sensing technology, were propelled by the expanding capabilities of IoT and smart city projects, starting significantly with projects like New York City’s LinkNYC in 2016 [62,63]. Additionally, increased funding and international collaborations in environmental research, like the Green Climate Fund’s projects from 2014 onwards, up to this date [64], provided resources and a platform for innovation in UHI studies, promoting the development of new methodologies for data collection and analysis. These factors collectively enhanced the precision and scope of UHI research, integrating multidisciplinary approaches and novel data collection techniques, and provided better chances for deploying newer technologies.
For the traditional on-site data collection studies, most of the studies started to use HOBO devices on their other equivalent devices from other companies including Vernier, Met One, Elitech, and Purple Air. Beginning in the same year, the trend for inventing more comprehensive custom-built devices started. The studies in this era began to combine devices to build more versatile instruments capable of capturing a variety of data. Some of these devices were created to capture the temperature from different levels (e.g., surface and air) [26], while others were aimed at capturing a variety of information as perceived by pedestrians [25].
Since the year 2020, as illustrated by [33,35], the state of UHI research has been characterized by a multidisciplinary approach. These recent studies not only employ sophisticated data collection techniques but also merge knowledge from fields like urban planning, public health, and environmental science, providing a comprehensive view of UHI’s diverse effects and informing integrated mitigation strategies.

Comparison of the Used Technologies

Traditional technologies in UHI research, primarily comprising premanufactured sensors and data loggers, have been the basis of data collection for decades. These devices provided reliable and repeatable measurements that helped establish baseline UHI metrics and understand temporal patterns. The biggest advantage of using these devices is their reliability and the verified results in the case of correct usage. These devices are normally verified by the companies and have a specific accuracy which is not always the case when using custom-built devices.
However, these traditional methods are not without drawbacks. One major limitation is their inflexibility in capturing the nuanced and dynamic variations that characterize urban microclimates. Fixed-position sensors or loggers may miss transient or localized climatic events, leading to potential gaps or biases in data collection. This is because moving these sensors usually causes problems related to their physical characteristics. For instance, most of the data loggers rely on a piece of metal in their structure as the temperature sensors, which normally take a few minutes to adapt to the environment temperature. That means installing these devices on high-paced transporters like cars or bikes creates large biases in the recorded temperature for any location. In other words, the collected data are behind time and unrelated to the recorded location coordinates.
On the other hand, these modern tools are often designed to be more adaptable and sensitive to specific research requirements. These novel devices and approaches provide a more detailed and comprehensive understanding of UHI effects. For instance, wearable sensors and mobile data collection platforms can capture a broader range of environmental variables and offer insights into microclimatic conditions on a finer scale. These technologies also open up new possibilities for research, enabling studies that were previously impractical due to technological constraints. For instance, [26] use a device installed on a golf cart which enables the simultaneous data collection of the surface temperature and air temperature, which was impossible using the traditional approaches.
Despite these advantages, novel technologies carry several challenges as well. The complexity of these advanced tools can be a significant barrier, requiring specialized skills for operation and data analysis. This can limit their accessibility and use, particularly in resource-constrained settings. Moreover, the reliability and long-term accuracy of these newer technologies may not be as well-established as their traditional counterparts, posing risks for critical research. Furthermore, the production of these devices is usually more expensive, and, therefore, it is hard to build large numbers of these technologies.
Additionally, the integration of data from these novel devices with existing datasets can be challenging, potentially leading to issues in data compatibility and interpretation. Issues of data compatibility and interpretation arose due to varying data formats and resolutions, and different structure of the datasets. Researchers have usually navigated these challenges by developing standardized protocols for data integration and employing more sophisticated data processing tools that can reconcile differences in data types and scales. Moreover, typically, the comparison between two or more types of sensors was conducted to increase the studies’ precision. Such strategies ensure that new data complements rather than conflicts with existing datasets. For instance, the study [24] used advanced GIS (ArcGIS 10.5) and R package statistical software to integrate traditional sensor data for enhanced analysis, while another study [34] tackled these issues by comparing data from mobile sensors mounted on vehicles with fixed sensor data, addressing discrepancies through methodological adjustments. Researchers in study [26] overcame integration challenges by custom-building mobile devices that aligned with traditional data collection methods, ensuring compatibility across varied data types. These examples illustrate some of the ways in which researchers have successfully navigated data compatibility issues by developing innovative data integration protocols and employing sophisticated processing tools.

Geographic and Temporal Differences

The geographic and temporal domain of the reviewed studies is also worth attention. Research implemented in different urban settings, such as the research in New York City [29] and Phoenix, Arizona [26] provides insights into how local environmental conditions and urban planning decisions can influence UHI effects. Moreover, the temporal aspect, seen in longitudinal studies like those by the study [34], adds another layer of complexity, showcasing how UHI effects evolve over time. Another noteworthy point in these studies is that usually the data collection time is far behind the publication time. This event makes the validation of the results difficult. Delays between the data collection and analysis can lead to discrepancies between the time of data collection and the time of data application, potentially making findings less relevant to current conditions. That said, almost none of the studies in the field of UHI offer a temporal validation method for their findings.

Physical Urban Climate Models, Machine Learning Methods, and Limitations

Physical urban climate models and machine learning methods offer distinct approaches to understanding and predicting UHI phenomena. Physical models, such as the Weather Research and Forecasting (WRF) model integrated with urban canopy parameters, adopt a deterministic approach grounded in the physical laws that govern atmospheric processes. These models excel in simulating complex urban atmospheric conditions with high accuracy by utilizing detailed representations of urban environments. However, their reliance on extensive computational resources and the need for precise input data often constrain their applicability in practical, resource-limited settings.
Conversely, machine learning approaches leverage their robust capability to process large datasets and discern patterns to provide a more flexible and adaptable alternative. These methods are particularly advantageous in scenarios where detailed physical parameters are sparse or when real-time data processing is required. Despite these strengths, the often criticized ‘black box’ nature of machine learning models poses significant challenges. This opacity can obscure the underlying causal mechanisms of UHI effects, which are critical for developing targeted interventions.
The reviewed studies also revealed several limitations and potential biases inherent in both physical models and machine learning approaches, which must be considered to accurately interpret their findings. A prevalent issue is the heavy reliance on specific types of sensors and algorithms, which can bias outcomes toward certain urban configurations or climatic conditions. This bias is compounded by the frequent lack of long-term data and the limited geographical diversity represented in many studies, reducing the generalizability of results.
Furthermore, the interpretability of machine learning models continues to be a pivotal challenge. The opaque nature of these models can cloud the causal dynamics of UHI, leading to potential misinterpretations or overgeneralizations of their predictive capabilities. It is essential for future research to focus on enhancing the transparency and explainability of machine learning models to better understand and mitigate UHI effects.

Findings and Concentrations

The overall concentration of the papers in the field of UHI can be divided into three categories. The first subcategory, ‘Assessing UHI Intensity methodologies’, includes studies from 2014 to 2021, like studies [28,36], which established foundational methodologies using environmental metrics to gauge UHI intensity. The period from 2016 to 2021 saw innovative strides, such as the work of [29,34], which expanded the scope to include urban boundary-layer interactions and microclimate analyses via mixed sensor arrays.
The second subcategory, ‘Impact of UHI on Environmental and Social Factors’, delves into UHI’s interconnected environmental and societal impacts. Beginning with studies from 1998 to 2008 by studies [22,23], the focus was on UHI’s influence on CO2 levels and indoor environments. More recent work between 2016 and 2023 [39] has pivoted towards UHI’s health repercussions and its influence on building energy consumption, signaling an increased awareness of UHI’s human-centric effects. Notably, there remains a significant gap in the continuity of research in this area within the United States and Canada.
The third subcategory, ‘Effect of Environmental Parameters on UHI’, currently the most prevalent in UHI research, concentrates on the impact of environmental factors. During 2019–2021, studies such as those by [33,38]. underscored the vital role of urban greenery in UHI mitigation. In 2022, innovative approaches by [25,35] introduced new methodologies like subsurface temperature assessments and microclimate mapping, highlighting the complexities of data collection and setting the stage for future research.
In synthesizing these findings, this review not only charts the evolution of UHI research from basic assessments to complex interactions with environmental and social factors, but also underscores the importance of innovative methodologies and interdisciplinary approaches. The majority of studies, especially recent ones, emphasize the role of vegetation and urban design in mitigating UHI effects, suggesting a shift towards more sustainable and human-centric urban planning strategies. Moreover, an interesting point in all the research is that usually the data collection period is carried out several years before the data analysis phase, suggesting that probably the UHI assessment was not the primary goal of these data collections.
In summary, the comparison of these papers highlights the dynamic and multifaceted nature of UHI research. It underlines the evolution from basic assessments to complex, interdisciplinary studies. The varied methodologies, focus areas, and geographic scopes of these studies collectively contribute to a comprehensive understanding of UHI, underscoring its significance as a multidimensional urban issue requiring integrated solutions spanning environmental science, urban planning, and public health.

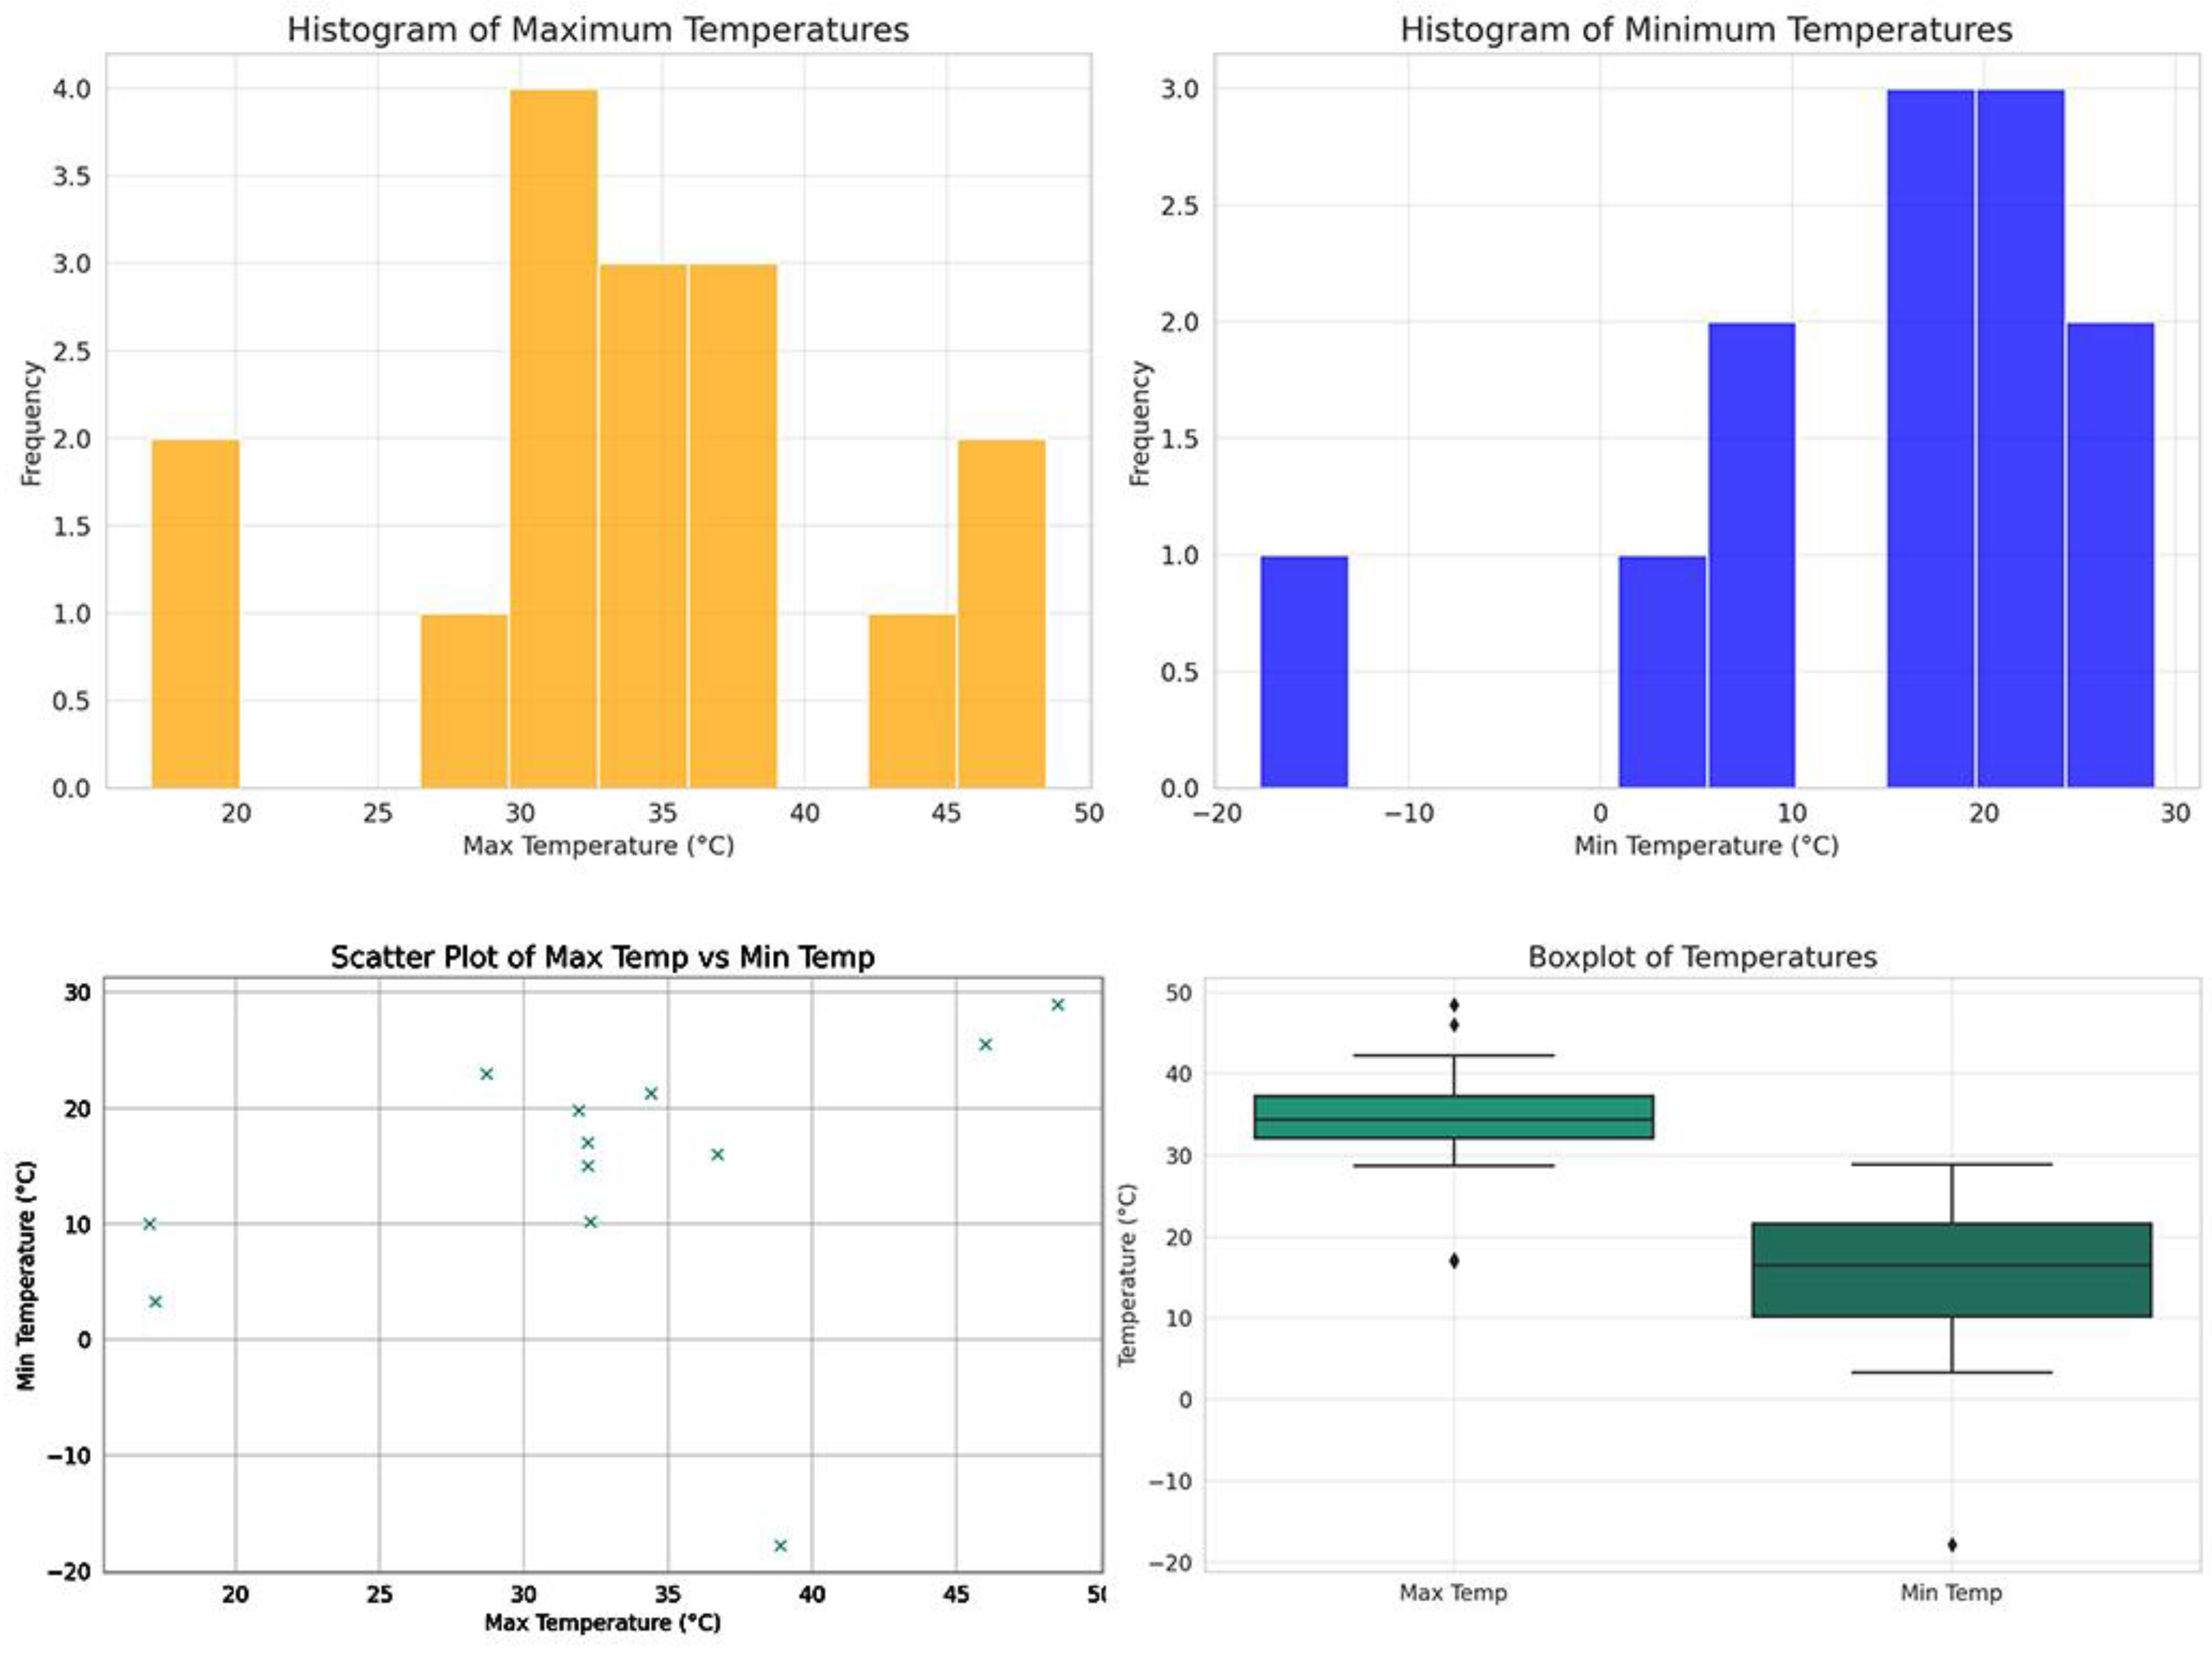
Temperature Meta-Analysis

After reviewing the papers, the meta-analysis for the temperature data was carried out. A total of 16 papers had information about their maximum and minimum temperature, which is demonstrated in Table 4. Furthermore, Table 5 and Figure 3 explain the maximum and minimum temperatures captured in various UHI studies statistically, offering a quantitative synthesis of UHI intensity across different urban settings.
The analysis of this data showed that the highest frequency of minimum temperatures is in the range of 15 to 30 °C, while this number is from 25 to 40 °C for the maximum temperature (see Figure 3). Moreover, the scatterplots showed that the increase in the maximum temperature will cause the increase in minimum temperature as well; however, this difference can be significantly varied in the maximum temperature range of 30 to 35 °C, where we have observed a minimum temperature range of 10 °C to above 20 °C. Furthermore, the analysis showed that the standard deviation is lower in the maximum temperature compared to the minimum temperature (see Figure 3).
According to the general statistics (Table 5), the current papers mostly concentrate on reporting the maximum-temperature rather than the minimum-temperature information. Moreover, the average maximum temperature for the United States and Canada was recorded as 33.99 °C, while the minimum average temperature was recorded as 14.34 °C.

4.2. Machine Learning Papers Comparison

Comparing the papers in the field of machine learning (ML) and prediction in UHI, several key observations and contrasts emerged, which highlight the evolution and diversity of approaches in this field.

4.2.1. Methodology and Applications

The application of prediction models, specifically machine learning in the field of UHI, started within the context of using these methods as a supplementary tool for understanding the UHI impact or analyzing its influences on factors such as indoor temperature modeling. The trend for these studies was started in 2012 by [53] and continued by [54]. These seminal works initially positioned ML as an auxiliary tool, aiding in the understanding of complex environmental phenomena. However, demonstrating the strength of these methods, the studies around the more direct implications of ML in UHI prediction started to emerge. This trend was clearly visible in the more recent studies in 2023, notably that of [58,60], which signifies a paradigm shift. Moreover, the recent research like [57] started to consider the time-series nature of the UHI that can be effectively handled by ML models. Currently, ML is no longer merely supportive, and has become pivotal in direct UHI prediction, indicative of the UHI research-field maturation. The advancement of ML in UHI has two characteristics: (i) varied techniques, and (ii) geographic and contextual variation.
Hardware advancements and computation power, alongside algorithm improvements and innovations, have reinforced the ML techniques which have impacted the UHI field, as well. The diversity of the ML techniques in the UHI currently covers a range of models from Gaussian process models, random forest, and regression Kriging models to more complex ML models including Artificial Neural Networks (ANNs) and complex Bayesian networks. The choice of technique is no longer a one-size-fits-all decision, but is carefully tailored to the intricate patterns and behaviors characteristic of UHI. Moreover, the non-machine learning models like simulation-based ones, had usually focused on assessing the UHI impact on other parameters like vegetation and urban canopy and were rarely able to predict the UHI as a dependent variable, suggesting the importance of the machine learning-based models in covering this gap.
This flexibility is further demonstrated by looking into the geographic range of ML applications in various American and Canadian metropolitan environments. As [60] have shown, the densely constructed environment of New York City presents a dramatic contrast to the urban layout of Vancouver. The study [55] explored this topic. This variance highlights how adaptable machine learning models are, since they can be adjusted to take into account the unique meteorological and urban characteristics of any research site.
Nevertheless, there are challenges on the way to success. The use of machine learning (ML) models in UHI research brings with it difficulties with data collection, processing power, and the interpretability of intricate models. The transition from simple methods to complex, data-hungry algorithms like Bayesian networks indicates the advancement of the discipline as well as the growing complexity of the research being carried out.
Overall, machine learning (ML) in UHI research is moving toward both complexity and refinement. ML models have exciting potential for improving prediction accuracy and influencing future urban planning and policy as they develop and become more suited to the complex dynamics of urban climates. The fact that machine learning is still developing shows how powerful technology is at both interpreting the current urban heat islands and projecting the environmental features of our cities in the future.

4.2.2. Integration with Urban Planning and Policy

One critical aspect of these studies is their potential impact on urban planning and policy; whereas earlier studies provided foundational knowledge, recent works align more closely with practical applications. These include the enhancement of urban design strategies to mitigate UHI effects and the refinement of urban climate models for effective policy formulation.
The collective recommendations made by the reviewed papers for future research include the need for ML models that are more thorough and easily understandable, the incorporation of socioeconomic data into UHI models, and the investigation of ML applications in a greater variety of urban settings outside of the US and Canada. In summary, a dynamic and developing area is revealed by comparing the publications on machine learning and prediction in the UHI research division. Urban environmental management and policymaking stand to benefit greatly from the developing research domain represented by the shift from simple machine learning applications to complex, direct predictive models.

5. Conclusions and Future Studies

This systematic literature review illuminates the multi-dimensional nature of urban heat island (UHI) research, underlining the evolution from basic data collection to the integration of advanced methodologies, particularly in North America. This study showed that while traditional technologies in UHI research offer reliability and standardization, they may lack the flexibility and coverage necessary for comprehensive urban climate studies. On the other hand, novel technologies provide enhanced accuracy and innovative data collection methods, but their complexity and unproven long-term reliability present new challenges. Balancing these pros and cons is crucial for advancing UHI research and developing effective urban planning and climate adaptation strategies. The transition from traditional approaches to novel ones highlights the importance of data collection methods in understanding the complexities of microclimates.
The integration of machine learning into UHI research has significantly expanded the capabilities that enable the making of sophisticated predictions and analyses of UHI phenomena. The reviewed studies collectively contribute to comprehending UHI as a multifaceted issue that intersects with environmental science, urban planning, and public health. The current trend for machine learning applications in the field of UHI shows that these methods are overcoming the conventional methods and, specifically in recent years, the concentration on UHI prediction as the main objective of the studies has been increased. Overall, UHI research is currently at a stage where technological advancements and interdisciplinary studies are intersecting. By focusing on these paths, the field has the potential to make contributions towards creating resilient and sustainable urban environments that can effectively tackle the issues posed by urban heat islands, considering the global climate change phenomenon.

5.1. Future Studies

The future studies in the field of UHI in North America can be divided into four categories.

5.1.1. Technological Advancement

The main problem with the current technological advancements is on their accuracy and reliability testing, implementation complexity, and their cost. Therefore, future studies should focus on refining novel devices to achieve more reliable ones. Moreover, developing more user-friendly and affordable sensors for comprehensive urban climate monitoring can be significantly helpful in developing future UHI studies.

5.1.2. Machine Learning and AI Integration

Although the use of machine learning models has increased in the past few years, the focus on predicting the UHI as the main objective of the papers is still overlooked. Therefore, future studies can consider using these models for UHI predictions and developing thorough generalizable models for different climate zones. Moreover, the current trend of machine learning-based studies mainly uses black-box models with interpretability problems. Therefore, future studies need to provide more interpretable models that can assess and rank the influential factors on the UHI effect in each climate zone to provide better insight for policymakers and future researchers. There is a critical need for research that directly informs urban planning and policy. Studies should aim to translate their findings into actionable strategies for mitigating UHI effects, such as urban greening initiatives, sustainable architectural designs, and climate-adaptive urban layouts.
Additionally, the available modes of machine learning are more diverse than those s currently being used in UHI detection in the North America region. Future researchers are recommended to apply different types of machine learning methods, including different neural network methods and time-series models, to fine-tune them, and to compare their results to find the most effective models for UHI prediction.

5.1.3. Interdisciplinary Approaches

Future research should enhance an interdisciplinary approach, integrating insights from urban planning, public health, environmental science, and sociology. Such an approach will enable a comprehensive understanding of UHIs, encompassing their socio-economic impacts and their contribution to urban sustainability. The current trend in the research is mainly focused on the impact of vegetation on the UHI, and vice versa.

5.1.4. Expanding Geographical Scope

While North America has been a focal point, this area includes diverse climate zones. Expanding the geographical scope of UHI studies is crucial. Currently, the studies are mainly working on New York State and Arizona in the U.S. and Vancouver in Canada. Research in diverse urban environments across different climatic zones will provide a more global perspective on UHI phenomena and aid in developing universally applicable strategies and solutions.
Overall, to effectively address the identified gaps in UHI research, future studies should focus on the integration of diverse data sources, including remote-sensing and ground-based measurements, to develop more comprehensive and scalable UHI models. Additionally, interdisciplinary approaches should be enhanced by incorporating insights from urban planning, public health, and socio-economic studies, to fully understand the impacts of UHI. It is also crucial to develop and validate transparent machine learning models (explainable artificial intelligence) which offer not only predictive accuracy but also clarity in their decision-making processes, enabling policymakers to make informed decisions based on reliable data. Lastly, expanding the geographical scope of studies to include underrepresented regions will help to build a more universally applicable understanding of UHI effects and mitigation strategies.

Author Contributions

Conceptualization, S.G. and M.H.; methodology, S.G. and M.H.; software, S.G.; validation, S.G., M.H., S.Y. and C.W.; formal analysis, S.G.; investigation, S.G., M.H. and S.Y.; resources, S.G., M.H. and S.Y.; writing—original draft preparation, S.G.; writing—review and editing, S.G., M.H. and C.W.; visualization, S.G.; supervision, M.H. and C.W.; project administration, S.G.; funding acquisition, M.H. and C.W. All authors have read and agreed to the published version of the manuscript.

Funding

This research was funded by the Office of Sustainability, University of Notre Dame.

Conflicts of Interest

The authors declare no conflicts of interest.

References

  1. Cetin, M. Climate comfort depending on different altitudes and land use in the urban areas in Kahramanmaras City. Air Qual. Atmos. Health 2020, 13, 991–999. [Google Scholar] [CrossRef]
  2. Karimi, A.; Mohammad, P.; Garcia-Martinez, A.; Moreno-Rangel, D.; Gachkar, D.; Gachkar, S. New Developments and Future Challenges in Reducing and Controlling Heat Island Effect in Urban Areas, Environment, Development and Sustainability; Springer: Dordrecht, The Netherlands, 2023. [Google Scholar] [CrossRef]
  3. Kousis, I.; Pisello, A.L. For the mitigation of urban heat island and urban noise island: Two simultaneous sides of urban discomfort. Environ. Res. Lett. 2020, 15, 103004. [Google Scholar] [CrossRef]
  4. Roxon, J.; Ulm, F.-J.; Pellenq, R.J.-M. Urban heat island impact on state residential energy cost and CO2 emissions in the United States. Urban Clim. 2020, 31, 100546. [Google Scholar] [CrossRef]
  5. Tian, P.; Li, J.; Cao, L.; Pu, R.; Wang, Z.; Zhang, H.; Chen, H.; Gong, H. Assessing spatiotemporal characteristics of urban heat islands from the perspective of an urban expansion and green infrastructure. Sustain. Cities Soc. 2021, 74, 103208. [Google Scholar] [CrossRef]
  6. Mohammad, P.; Goswami, A. Quantifying diurnal and seasonal variation of surface urban heat island intensity and its associated determinants across different climatic zones over Indian cities. GISci. Remote. Sens. 2021, 58, 955–981. [Google Scholar] [CrossRef]
  7. Matzarakis, A.; Martinelli, L.; Ketterer, C. Relevance of Thermal Indices for the Assessment of the Urban Heat Island. In Counteracting Urban Heat Island Effects in a Global Climate Change Scenario; Springer International Publishing: Cham, Switzerland, 2016; pp. 93–107. [Google Scholar] [CrossRef]
  8. Shen, P.; Wang, M.; Liu, J.; Ji, Y. Hourly air temperature projection in future urban area by coupling climate change and urban heat island effect. Energy Build. 2023, 279, 112676. [Google Scholar] [CrossRef]
  9. Levy, A. Changement climatique, îlot de chaleur urbain et impacts sanitaires: Paris et son urbanisme. Environ. Risques Sante 2016, 15, 351–356. [Google Scholar] [CrossRef]
  10. Lee, K.; Kim, Y.; Sung, H.C.; Kim, S.H.; Jeon, S.W. Surface urban heat island in South Korea’s new towns with different urban planning. Environ. Monit. Assess. 2022, 194, 360. [Google Scholar] [CrossRef] [PubMed]
  11. Liu, H.; Huang, B.; Zhan, Q.; Gao, S.; Li, R.; Fan, Z. The influence of urban form on surface urban heat island and its planning implications: Evidence from 1288 urban clusters in China. Sustain. Cities Soc. 2021, 71, 102987. [Google Scholar] [CrossRef]
  12. Dubovik, O.; Schuster, G.L.; Xu, F.; Hu, Y.; Bösch, H.; Landgraf, J.; Li, Z. Grand Challenges in Satellite Remote Sensing. Front. Remote Sens. 2021, 2, 619818. [Google Scholar] [CrossRef]
  13. NASA WorldView. EOSDIS Worldview; NASA: Washington, DC, USA, 2023. Available online: https://worldview.earthdata.nasa.gov/?v=-218.09270865546608,-12.780694486765938,6.4909205215590475,99.84010002729892&l=Reference_Labels_15m(hidden),Reference_Features_15m(hidden),Coastlines_15m,AIRS_L2_Total_Cloud_Fraction_Night(hidden),AIRS_L2_Total_Clou (accessed on 2 January 2024).
  14. NASA. Ask AIRS|Support; NASA: Washington, DC, USA, 2023. Available online: https://airs.jpl.nasa.gov/data/support/ask-airs?order=is_featured+desc%2C+question+asc&per_page=50&page=0&search=&condition_1=1%3Ais_featured&fs=&fc=&ft=&dp=&category= (accessed on 2 January 2024).
  15. Ghorbany, S.; Hu, M.; Yao, S.; Wang, C.; Nguyen, Q.C.; Yue, X.; Alirezaei, M.; Tasdizen, T.; Sisk, M. Examining the role of passive design indicators in energy burden reduction: Insights from a machine learning and deep learning approach. Build. Environ. 2024, 250, 111126. [Google Scholar] [CrossRef]
  16. Hu, M.; Ghorbany, S. Building Stock Models for Embodied Carbon Emissions—A Review of a Nascent Field. Sustainability 2024, 16, 2089. [Google Scholar] [CrossRef]
  17. Liberati, A.; Altman, D.G.; Tetzlaff, J.; Mulrow, C.; Gøtzsche, P.C.; Ioannidis, J.P.A.; Clarke, M.; Devereaux, P.J.; Kleijnen, J.; Moher, D. The PRISMA Statement for Reporting Systematic Reviews and Meta-Analyses of Studies That Evaluate Health Care Interventions: Explanation and Elaboration. Ann. Intern. Med. 2009, 151, W-65–W-94. [Google Scholar] [CrossRef] [PubMed]
  18. Page, M.J.; McKenzie, J.E.; Bossuyt, P.M.; Boutron, I.; Hoffmann, T.C.; Mulrow, C.D.; Shamseer, L.; Tetzlaff, J.M.; Akl, E.A.; Brennan, S.E. The PRISMA 2020 statement: An updated guideline for reporting systematic reviews. BMJ 2021, 372, 71. [Google Scholar] [CrossRef] [PubMed]
  19. Qin, Y.; Ghalambaz, S.; Sheremet, M.; Baro, M.; Ghalambaz, M. Deciphering Urban Heat Island Mitigation: A Comprehensive Analysis of Application Categories and Research Trends. Sustain. Cities Soc. 2024, 101, 105081. [Google Scholar] [CrossRef]
  20. Ramakreshnan, L.; Aghamohammadi, N. The Application of Nature-Based Solutions for Urban Heat Island Mitigation in Asia: Progress, Challenges, and Recommendations. Curr. Environ. Health Rep. 2024, 11, 4–17. [Google Scholar] [CrossRef] [PubMed]
  21. Mohajerani, A.; Bakaric, J.; Jeffrey-Bailey, T. The urban heat island effect, its causes, and mitigation, with reference to the thermal properties of asphalt concrete. J. Environ. Manag. 2017, 197, 522–538. [Google Scholar] [CrossRef]
  22. Idso, C.D.; Idso, S.B.; Balling, R.C. The urban CO2 dome of phoenix, Arizona. Phys. Geogr. 1998, 19, 95–108. [Google Scholar] [CrossRef]
  23. Smargiassi, A.; Fournier, M.; Griot, C.; Baudouin, Y.; Kosatsky, T. Prediction of the indoor temperatures of an urban area with an in-time regression mapping approach. J. Expo. Sci. Environ. Epidemiol. 2018, 18, 282–288. [Google Scholar] [CrossRef]
  24. Mallen, E.; Bakin, J.; Stone, B.; Sivakumar, R.; Lanza, K. Thermal impacts of built and vegetated environments on local microclimates in an Urban University campus. Urban Clim. 2020, 32, 100640. [Google Scholar] [CrossRef]
  25. Pioppi, B.; Pisello, A.L.; Ramamurthy, P. Wearable sensing techniques to understand pedestrian-level outdoor microclimate affecting heat related risk in urban parks. Sol. Energy 2022, 242, 397–412. [Google Scholar] [CrossRef]
  26. Sen, S.; Roesler, J.; Ruddell, B.; Middel, A. Cool Pavement Strategies for Urban Heat Island Mitigation in Suburban Phoenix, Arizona. Sustainability 2019, 11, 4452. [Google Scholar] [CrossRef]
  27. Vant-Hull, B.; Karimi, M.; Sossa, A.; Wisanto, J.; Nazari, R.; Khanbilvardi, R. Fine structure in manhattan’s daytime urban heat island: A new dataset. J. Urban Environ. Eng. 2014, 8, 59–74. [Google Scholar] [CrossRef]
  28. Schatz, J.; Kucharik, C.J. Urban climate effects on extreme temperatures in Madison, Wisconsin, USA. Environ. Res. Lett. 2015, 10, 094024. [Google Scholar] [CrossRef]
  29. Ramamurthy, P.; González, J.; Ortiz, L.; Arend, M.; Moshary, F. Impact of heatwave on a megacity: An observational analysis of New York City during July 2016. Environ. Res. Lett. 2017, 12, 054011. [Google Scholar] [CrossRef]
  30. Hong, K.Y.; Tsin, P.K.; van den Bosch, M.; Brauer, M.; Henderson, S.B. Urban greenness extracted from pedestrian video and its relationship with surrounding air temperatures. Urban For. Urban Green. 2019, 38, 280–285. [Google Scholar] [CrossRef]
  31. Eanes, A.M.; Lookingbill, T.R.; Hoffman, J.S.; Saverino, K.C.; Fong, S.S. Assessing Inequitable Urban Heat Islands and Air Pollution Disparities with Low-Cost Sensors in Richmond, Virginia. Sustainability 2020, 12, 10089. [Google Scholar] [CrossRef]
  32. Razzaghmanesh, M.; Borst, M.; Liu, J.; Ahmed, F.; O’connor, T.; Selvakumar, A. Air Temperature Reductions at the Base of Tree Canopies. J. Sustain. Water Built Environ. 2021, 7, 04021010. [Google Scholar] [CrossRef] [PubMed]
  33. Gomez-Navarro, C.; Pataki, D.E.; Pardyjak, E.R.; Bowling, D.R. Effects of vegetation on the spatial and temporal variation of microclimate in the urbanized Salt Lake Valley. Agric. For. Meteorol. 2021, 296, 108211. [Google Scholar] [CrossRef]
  34. Shi, R.; Hobbs, B.F.; Zaitchik, B.F.; Waugh, D.W.; Scott, A.A.; Zhang, Y. Monitoring intra-urban temperature with dense sensor networks: Fixed or mobile? An empirical study in Baltimore, MD. Urban Clim. 2021, 39, 100979. [Google Scholar] [CrossRef]
  35. Loria, A.F.R.; Thota, A.; Thomas, A.M.; Friedle, N.; Lautenberg, J.M.; Song, E.C. Subsurface heat island across the Chicago Loop district: Analysis of localized drivers. Urban Clim. 2022, 44, 101211. [Google Scholar] [CrossRef]
  36. Park, S.; Tuller, S.E.; Jo, M. Application of Universal Thermal Climate Index (UTCI) for microclimatic analysis in urban thermal environments. Landsc. Urban Plan. 2014, 125, 146–155. [Google Scholar] [CrossRef]
  37. Chui, A.C.; Gittelson, A.; Sebastian, E.; Stamler, N.; Gaffin, S.R. Urban heat islands and cooler infrastructure—Measuring near-surface temperatures with hand-held infrared cameras. Urban Clim. 2018, 24, 51–62. [Google Scholar] [CrossRef]
  38. Middel, A.; Krayenhoff, E.S. Micrometeorological determinants of pedestrian thermal exposure during record-breaking heat in Tempe, Arizona: Introducing the MaRTy observational platform. Sci. Total Environ. 2019, 687, 137–151. [Google Scholar] [CrossRef] [PubMed]
  39. Singh, M.; Sharston, R. Normalized urban heat island (UHI) indicators: Classifying the temporal variation of UHI for building energy simulation (BES) applications. Build. Simul. 2023, 16, 1645–1658. [Google Scholar] [CrossRef]
  40. Silva, T.C.; Zhao, L. Machine Learning in Complex Networks; Springer International Publishing: Cham, Switzerland, 2016. [Google Scholar]
  41. Ghorbany, S.; Noorzai, E.; Yousefi, S. BIM-based solution to enhance the performance of public-private partnership construction projects using copula bayesian network. Expert Syst. Appl. 2023, 216, 119501. [Google Scholar] [CrossRef]
  42. Rudin, C. Stop explaining black box machine learning models for high stakes decisions and use interpretable models instead. Nat. Mach. Intell. 2019, 1, 206–215. [Google Scholar] [CrossRef] [PubMed]
  43. Yang, Y.; Yuan, Y.; Han, Z.; Liu, G. Interpretability analysis for thermal sensation machine learning models: An exploration based on the SHAP approach. Indoor Air 2022, 32, e12984. [Google Scholar] [CrossRef] [PubMed]
  44. Ghorbany, S.; Yousefi, S.; Noorzai, E. Evaluating and optimizing performance of public–private partnership projects using copula Bayesian network. Eng. Constr. Arch. Manag. 2022, 31, 290–323. [Google Scholar] [CrossRef]
  45. Azodi, C.B.; Tang, J.; Shiu, S.-H. Opening the Black Box: Interpretable Machine Learning for Geneticists. Trends Genet. 2020, 36, 442–455. [Google Scholar] [CrossRef]
  46. Malakouti, S.M. Utilizing time series data from 1961 to 2019 recorded around the world and machine learning to create a Global Temperature Change Prediction Model. Case Stud. Chem. Environ. Eng. 2023, 7, 100312. [Google Scholar] [CrossRef]
  47. Yu, W.; Nakisa, B.; Ali, E.; Loke, S.W.; Stevanovic, S.; Guo, Y. Sensor-based indoor air temperature prediction using deep ensemble machine learning: An Australian urban environment case study. Urban Clim. 2023, 51, 101599. [Google Scholar] [CrossRef]
  48. Carter, M.; Shepherd, J.M.; Burian, S.; Jeyachandran, I. Integration of lidar data into a coupled mesoscale–land surface model: A theoretical assessment of sensitivity of urban–coastal mesoscale circulations to urban canopy parameters. J. Atmos. Ocean. Technol. 2012, 29, 328–346. [Google Scholar] [CrossRef]
  49. Vermunt, B.; Cuddington, K.; Sobek-Swant, S.; Crosthwaite, J. Cold temperature and emerald ash borer: Modelling the minimum under-bark temperature of ash trees in Canada. Ecol. Model. 2012, 235–236, 19–25. [Google Scholar] [CrossRef]
  50. Gutiérrez, E.; González, J.E.; Bornstein, R.; Arend, M.; Martilli, A. A New Modeling Approach to Forecast Building Energy Demands During Extreme Heat Events in Complex Cities. J. Sol. Energy Eng. 2013, 135, 040906. [Google Scholar] [CrossRef]
  51. Yang, J.; Wang, Z.-H. Physical parameterization and sensitivity of urban hydrological models: Application to green roof systems. Build. Environ. 2014, 75, 250–263. [Google Scholar] [CrossRef]
  52. Bryce, J.; Ihnat, Z. Improved models of solar radiation and convective heat transfer for pavement temperature prediction. Int. J. Pavement Eng. 2022, 23, 2123–2134. [Google Scholar] [CrossRef]
  53. Mirzaei, P.A.; Haghighat, F.; Nakhaie, A.A.; Yagouti, A.; Giguère, M.; Keusseyan, R.; Coman, A. Indoor thermal condition in urban heat Island—Development of a predictive tool. Build. Environ. 2012, 57, 7–17. [Google Scholar] [CrossRef]
  54. Detenbeck, N.E.; Morrison, A.C.; Abele, R.W.; Kopp, D.A. Spatial statistical network models for stream and river temperature in New England, USA. Water Resour. Res. 2016, 52, 6018–6040. [Google Scholar] [CrossRef]
  55. Malings, C.; Pozzi, M.; Klima, K.; Bergés, M.; Bou-Zeid, E.; Ramamurthy, P. Surface heat assessment for developed environments: Probabilistic urban temperature modeling. Comput. Environ. Urban Syst. 2017, 66, 53–64. [Google Scholar] [CrossRef]
  56. Hardin, A.W.; Liu, Y.; Cao, G.; Vanos, J.K. Urban heat island intensity and spatial variability by synoptic weather type in the northeast U.S. Urban Clim. 2018, 24, 747–762. [Google Scholar] [CrossRef]
  57. Han, J.M.; Ang, Y.Q.; Malkawi, A.; Samuelson, H.W. Using recurrent neural networks for localized weather prediction with combined use of public airport data and on-site measurements. Build. Environ. 2021, 192, 107601. [Google Scholar] [CrossRef]
  58. Assaf, G.; Hu, X.; Assaad, R.H. Predicting Urban Heat Island severity on the census-tract level using Bayesian networks. Sustain. Cities Soc. 2023, 97, 104756. [Google Scholar] [CrossRef]
  59. Assaf, G.; Hu, X.; Assaad, R.H. Mining and modeling the direct and indirect causalities among factors affecting the Urban Heat Island severity using structural machine learned Bayesian networks. Urban Clim. 2023, 49, 101570. [Google Scholar] [CrossRef]
  60. Tariku, F.; Mombeni, A.G. ANN-Based Method for Urban Canopy Temperature Prediction and Building Energy Simulation with Urban Heat Island Effect in Consideration. Energies 2023, 16, 5335. [Google Scholar] [CrossRef]
  61. United Nations. The Paris Agreement; United Nations: New York, NY, USA, 2016. [Google Scholar]
  62. LinkNYC. 2016. Available online: https://www.link.nyc/faq.html#linknyc (accessed on 7 May 2024).
  63. Shah, J.; Kothari, J.; Doshi, N. A Survey of Smart City infrastructure via Case study on New York. Procedia Comput. Sci. 2019, 160, 702–705. [Google Scholar] [CrossRef]
  64. IFC. Green Climate Fund; IFC: Washington, DC, USA, 2024; Available online: https://www.ifc.org/en/what-we-do/sector-expertise/blended-finance/climate/green-climate-fund (accessed on 7 May 2024).
Figure 1. Systematic paper selection flowchart.
Sustainability 16 04609 g001
Figure 2. The used-device evolution [22,23,24,25,26,27,28,29,30,31,32,33,34,35,36,37,38,39].
Sustainability 16 04609 g002
Figure 3. The minimum (Min)- and maximum (Max)-temperature frequency histograms (top), scatter plots (bottom left), and boxplots, including the median, upper and lower quartiles (rectangle edges), upper and lower whiskers, and outliers (bottom right).
Sustainability 16 04609 g003
Table 1. The papers’ distribution into data collection categories.
CategoryNumber of PapersYears Range
Premanufactured Sensors and Data Loggers121998–2022
Novel Technologies and Approaches62014–2023
Table 2. Study Devices, Data Collection Period, and Data Collection Intervals.
IDPaperYearData Collection YearDevices UsedData Collection PeriodData Collection Interval
1[22]19981998Medical Syringes, Basic Thermometers--
2[23]20082005HOBO instruments, Landsat 5/TMJuly10 min
3[27]20142012HOBO instruments, Vernier instrumentsJune–August 2012, July–October 2013Fixed: 3 min, Mobile: 10 s
4[28]20152012HOBO instrumentsJuly–September 2012, January–March 201315 min
5[29]20172016Multi-channel Radiometers (Radiometric MP-3000A), Ground-based weather stations (ASOS, APRSWXNET)July
6[30]20192014Met One 064-2 Thermometer, GoPro CameraMay–September10 s
7[31]20202019Purple Air PA-II sensorsFebruary–November2 min
8[24]20202017HOBO instrumentsJuly–September-
9[32]20212017HOBO instrumentsAugust–November10 min
10[33]20212016HOBO instrumentsJune–August15 min
11[34]20212016iButton Model DS1923Mobile sensor data: 29 August 2018; Fixed Sensors: May–SeptemberMobile Sensors: Every Second;
Fixed Sensors: Hourly
12[35]20222021HOBO instrumentsFebruary and June1 h
Table 3. The Computer-Based Prediction Models in UHI.
CategoryNumber of PapersYears Range
Non-Machine Learning Models52012–2022
Statistical and Machine Learning Models72017–2023
Table 4. The minimum and maximum captured temperature in the studies.
CategoryPaperYearData Collection YearLocationData Collection PeriodMax TempMin Temp
1[22]19981998Phoenix, AZ, USA-17.23.3
1[23]20082005Montreal, QC, CanadaJuly32.310.2
1[27]20142012Manhattan, New York City, NY, USAJune–August 2012, July–October 20131710
1[28]20152012Madison, WI, USAJuly–September 2012, January–March 201338.9−17.8
1[29]20172016New York City, NY, USAJuly32.2217
1[30]20192014Vancouver, BC, CanadaMay–September31.919.8
1[31]20202019Richmond, VA, USAFebruary–November4625.5
1[24]20202017Georgia Institute of Technology, Atlanta, GA, USAJuly–September34.421.24
1[32]20212017City of Camden, NJ, USAAugust–November34.78-
1[33]20212016Salt Lake Valley, UT, USAJune–August32.215
1[34]20212016Baltimore, MD, USAMobile sensor data: 29 August 2018; Fixed Sensors: May–September34.5
1[35]20222021Chicago Loop district, Chicago, IL, USAFebruary and June36.3-
2[36]20142009Nanaimo, BC, Canada11 June 200928.722.9
2[38]20192016Phoenix, AZ, USA19 June 201648.528.9
2[26]20192015Phoenix, AZ, USA13 August 201542.22-
2[25]20222019New York City, NY, USAJuly 201936.716
Table 5. Maximum- and minimum-temperature general statistics.
Maximum Temperature StatisticsMinimum Temperature Statistics
StatisticValueValue
Count1612
Mean33.99 °C14.34 °C
Standard Deviation8.46 °C12.39 °C
Minimum17.00 °C−17.80 °C
25th Percentile32.13 °C10.15 °C
Median (50th Percentile)34.45 °C16.50 °C
75th Percentile37.25 °C21.66 °C
Maximum48.50 °C28.90 °C
Disclaimer/Publisher’s Note: The statements, opinions and data contained in all publications are solely those of the individual author(s) and contributor(s) and not of MDPI and/or the editor(s). MDPI and/or the editor(s) disclaim responsibility for any injury to people or property resulting from any ideas, methods, instructions or products referred to in the content.

