Article

The Minimum Dietary Level and Mix Ratio of Krill Meal and Fish Meal to Elicit Feed Intake and Growth Performance in Juvenile Penaeus vannamei

by
Alberto J. P. Nunes
1,*,
Jordana Sampaio Leite
1,
Caio Gabriel Dantas Gomes
1,
Ragnhild Dragøy
2 and
Lena Burri
2
1
LABOMAR—Instituto de Ciências do Mar, Universidade Federal do Ceará, Avenida da Abolição, 3207-Meireles, Fortaleza 60165-081, Brazil
2
Aker BioMarine Feed Ingredients AS, Oksenøyveien 10, 1366 Lysaker, Norway
*
Author to whom correspondence should be addressed.
Sustainability 2024, 16(11), 4628; https://doi.org/10.3390/su16114628
Submission received: 18 April 2024 / Revised: 18 May 2024 / Accepted: 22 May 2024 / Published: 29 May 2024

Abstract

:
Shrimp feeds depend on high levels of digestible protein and essential amino acids, which can be sourced from various commercially available feed ingredients. Marine proteins can be used to partially fulfill the requirements of these and other important nutrients. Their utilization is further influenced by their palatability and growth-promoting effect. However, marine ingredients can significantly drive costs in feed formulation depending on the type and dietary inclusion level. This study aimed to determine the minimum dietary level of fish meal (FML) and krill meal (KRM) and their mix ratio to elicit feed intake and growth performance in juvenile Penaeus vannamei. Ten diets were formulated with graded FML (90, 60, 30 g kg−1) in combination with 15, 30, and 45 g kg−1 KRM and a control diet with 120 g kg−1 FML. Shrimp (1.28 ± 0.08 g body weight, BW) were stocked in seventy 1-m3 tanks (135 animals m−2), and after 88 days, their growth performance was determined. Feed preference was assessed through two-by-two comparisons in twenty 0.5 m3 tanks over four weeks. No significant differences in survival (93.9 ± 4.5%), gained yield (1235 ± 92 g m−2), and feed conversion ratio (1.47 ± 0.09) were observed. Diets with 60 g kg−1 FML led to faster growth and higher feed intake than 30, 90, and 120 g kg−1 FML. Shrimp on 30 g kg−1 FML diets had the lowest BW, especially with 30–15 (FML-KRM) and 30–30 diets. Diets with 90 g kg−1 FML outperformed 30 g kg−1 FML. The control diet delivered a higher shrimp BW than diets 30–15 and 30–30, showing similar results to other diets except 60–15. Feed preference was influenced by KRM inclusion, with 15 g kg−1 KRM resulting in higher apparent feed intake than 30 and 45 g kg−1. The findings indicate that FML can be effectively reduced by up to 75% when combined with lower levels of KRM. This corresponds with the industry’s ongoing trend to achieve greater sustainability and cost efficiency through the reduced utilization of critical resources.

1. Introduction

Low-trophic-level aquaculture has been identified as an important part of the puzzle for future food security, providing essential nutrients to a growing population [1]. Aquaculture has also demonstrated its ability to boost local per capita consumption of aquatic food while presenting itself as more sustainable compared to the production of other farmed animals [2]. Global production of farm-raised whiteleg shrimp, Penaeus vannamei, has significantly increased in recent years, reaching 5.8 million MT in 2020 [1]. This has led to a temporary oversupply in the market, with falling prices in recent years making the industry less profitable. Nevertheless, recent reports suggest a more promising outlook for the coming years [3], with anticipated further growth driven by technological advancements, increased political attention, and growing consumer interest in the industry [1,3]. As the industry aims to adapt, production and economic efficiency are in focus. In addition, to allow for sustainable growth, there is an increased emphasis on reduced use of marine resources from fish stocks that are either overfished or fished to the limit [4]. Thus, feeds become a crucial element for cost rationalization and the optimization of ingredients for more sustainable industry growth, as they may represent over 40% of overall shrimp production costs. Practical feed formulation is conducted on a least-cost basis, allowing the meeting of targeted levels of essential nutrients required by farmed animals for maximum growth at the lowest possible economic cost [5]. Nevertheless, high feed costs and the overuse of some ingredients may arise from over-formulating with levels of essential nutrients beyond the animal’s requirements and/or the inclusion of costly and/or less sustainable ingredients.
Shrimp feeds depend on high levels of digestible protein and essential amino acids (EAAs), which can be sourced from various commercially available feed ingredients. Marine proteins obtained from fish, squid, krill, and other crustaceans can be used to partially fulfill the requirements of these and other important nutrients. The utilization of marine proteins is further influenced by their ability to elicit chemoattraction and stimulate feeding in marine shrimp [6,7,8,9,10]. These factors collectively contribute to a growth-promoting effect in penaeid shrimp, sometimes correlated to the presence of unidentified growth factors [6,11,12,13]. However, marine ingredients can significantly drive costs in feed formulation depending on the type and dietary inclusion level. In addition, there is a significant risk that fish meal used in shrimp feeds originates from unsustainable fisheries [14,15]. Despite several studies supporting the reduction or complete removal of fish meal from shrimp feeds [16,17,18,19,20,21,22,23], this ingredient persists in usage in commercial feed formulations. The challenge arises from the difficulty of replicating the performance of marine ingredients in shrimp feeds, which demonstrates the importance of identifying their optimal combinations [16,17,18,19,20,22]. In these studies, krill meal has been included as a marine resource. Krill meal is a well-managed and sustainably fished resource [24], that has proven to be a highly effective ingredient in shrimp feeds [10,13,23].
Chemoattractants and palatability enhancers, collectively referred to as feeding effectors (meals and hydrolysates made from krill, squid, and fish), are added to shrimp feeds at levels ranging from 5 to 50 g kg−1 (g kg−1 of the diet on an as-is basis [8,10,12]). However, most published studies have evaluated their efficacy individually or in diets with low concentrations of marine ingredients [7,8,9,10]. This differs from practical feed formulas, which employ a combination of ingredients from various origins and chemical profiles [5], potentially resulting in antagonist or synergist effects on shrimp feeding responses. The modulation of behavioral olfactory responses, either through stimulation or suppression, has been documented in the Caribbean spiny lobster, Panulirus argus, using chemical binary mixtures, mostly synthetic amino acids [25,26,27]. These studies suggest that the physiological response arising from mixture interactions deviates from predictions based on individual responses to the components within the mixture, both in terms of quality and intensity [27]. Hence, it is crucial to investigate whether these interactions exist among protein ingredients used in practical shrimp feeds, particularly those derived from marine sources, to identify opportunities for reducing their usage for sustainability concerns and to enhance economic results. The present study aimed to determine the minimum dietary concentration of fish meal and krill meal, as well as their mix ratio, to stimulate feed intake and growth performance of juvenile P. vannamei.

2. Materials and Methods

2.1. Experimental Design

In this study, ten practical diets were formulated to contain graded levels of fish meal (FML) and krill meal (KRM). FML was included at 90, 60, and 30 g kg−1 (g kg−1 of the diet, as-is), each paired with 15, 30, and 45 g kg−1 KRM. This resulted in nine combinations of FML and KRM. A diet with 120 g kg−1 FML and no KRM was used as a control. Juvenile P. vannamei were stocked in outdoor tanks and fed four times daily in feeding trays over a continuous 88-day rearing period. At harvest, shrimp were counted, weighed on an electronic scale, and their survival, growth performance, yield, and feed efficiency were determined. Subsequently, feed preference was assessed by measuring the shrimps’ apparent feed intake. Diets with different levels of KRM within the same FML inclusion were confronted two-by-two in 30 tanks of 0.5 m3 over 10 days.

2.2. Rearing System, Water Preparation, and Management

Shrimp were raised in 70 independent round tanks of 1.0 m3 (h = 0.84 m, d = 1.06 m, bottom A = 0.89 m2), allowing seven replicate tanks per dietary treatment. Outdoor tanks were sheltered under a roof with a 70% dark sunblock shade cloth to protect from a water temperature exceeding 30 °C. Tanks were fitted with a perforated lid on top to prevent shrimp from escaping. Each tank was also equipped with an individual water inlet and outlet, as well as an aeration system. The system operated under a minimum water exchange condition, without any water interexchange between rearing tanks over the complete rearing cycle. Weekly water exchange was carried out using sand-filtered seawater mixed with groundwater. Continuous aeration was provided by an air diffusing system made with 0.5 m aeration tubing (Aero-Tube™, Tekni-Plex Aeration, Austin, TX, USA), which rested near the bottom of each tank, but opposed to the feed delivery point. A 150-kvA (Kilo Volt Amperes or 120 kW) diesel generator was used as a backup power supply in case of power failure.
Rearing tanks, aeration equipment, and feeding trays were thoroughly cleaned and disinfected before preparing the water. High-pressure jet cleaning was used on the tank walls, followed by manual removal of any residues. Tanks were treated with a sulfuric acid-based descaling agent, left for 24 h, and then disinfected using peracetic acid. After drying, tanks were filled with water at 11 g L−1 salinity, achieved by mixing groundwater at 5 g L−1 salinity with previously disinfected seawater at 35 g L−1 salinity. Seawater was previously disinfected using sodium hypochlorite at 30 ppm. Once tanks were filled, culture water was prepared by fertilizing it with a commercial probiotic containing a blend of microorganisms (Bacillus spp., Lactobacillus spp., and Saccharomyces cerevisiae). This probiotic mix, along with sugar-cane molasses, wheat bran, and tap water, underwent fermentation with aeration for 24 h. After sieving to eliminate solids, this mixture was added to each tank at a rate of 50 g m−3 daily for a week. Strong aeration was maintained in rearing tanks throughout mixing during the water preparation process.
During shrimp rearing, water was exchanged on a weekly basis at 14% of total tank volume by draining bottom water and replacing it with clean brackish water. Water pH, temperature, and salinity were measured daily in each tank. Average values reached a mean (±standard deviation) of 8.3 ± 0.2, 28.0 ± 0.7 °C, and 11.2 ± 2.8 g L−1, respectively. Dissolved oxygen was kept saturated with a continuous aeration on the tank bottom.

2.3. Diet Formulation

FML used in this study was produced from the byproducts obtained during processing of farmed Atlantic salmon (Pesquera Pacific-Star, Puerto Montt, Chile). KRM was obtained from the commercial fisheries of Antarctic krill (Euphausia superba) in the Antarctic Atlantic (from fishing Area 48) processed whole on board (QRILL™ Aqua, Aker Biomarine Feed Ingredients AS, Lysaker, Norway).
Ten practical grower diets for juvenile P. vannamei were formulated for this study (Table 1). A basal diet containing 120 g kg−1 (g kg−1 of the diet, as-is) FML was initially designed (diet 120–0, mix ratio of 100%). From this diet, nine other diets were formulated to contain 90, 60, and 30 g kg−1 FML, each in combination with 15, 30, and 45 g kg−1 KRM. This resulted in FML-KRM dietary levels (and mix ratios, in %) of 90–15 (17), 90–30 (33), 90–45 (50), 60–15 (25), 60–30 (50), 60–45 (75), 30–15 (50), 30–30 (100), and 30–45 (150), respectively. The inclusions of soybean meal, wheat flour, and wheat gluten meal were fixed at 380, 300, and 20 g kg−1, respectively, across all diets. To maintain a uniform dietary crude protein (CP) content, the inclusion of soy protein concentrate was adjusted relative to FML and KRM levels. Similarly, the total dietary content of methionine (Met) and lysine (Lys) was balanced with DL-Methionine and L-Lysine. Our previous study has shown that under green-water culture conditions, shrimp growth performance is maximized with a total dietary Met (Met + Cysteine, Cys) and Lys of 8.2 (12.9 g kg−1 of the diet, as-is) and 17.8 g kg−1, respectively, with a minimum of 60 g kg−1 FML [22]. To counteract the biased influence of Met (Met + Cys) on shrimp growth, diets were structured with levels of these two AAs marginally below specifications. Salmon oil and soy lecithin oil were used to meet the minimum required levels of essential fatty acids (EFAs) and phospholipids, respectively. Their dietary inclusion also varied according to FML and KRM levels.

2.4. Feed Manufacturing and Chemical Analysis

Diets were manufactured at LABOMAR’s experimental feed mill facility using a laboratory pelleting machine (model EX MICRO, Exteec Máquinas, Ribeirão Preto, Brazil). First, all dried raw materials were ground to less than 300 microns (mesh #48). Next, ingredients were weighed to a 0.01 g precision on an electronic scale following formula specifications. All micro-ingredients (vitamins, minerals, synthetic binder, crystalline AAs) were mixed with a 1 kg sample of all dried macro-ingredients in a Y-mixer (model MA201/5MO, Marconi Equipamentos para Laboratórios Ltd.a., Piracicaba, Brazil) for 10 min at 30 RPM. This mix was then combined with all other macro-ingredients (dry and liquids) and mixed for 10 min in a planetary mixer with freshwater until a feed dough was formed. The feed dough was then pressed through a plastic net to obtain small chunks of moist feed for extrusion. For feed cooking and extrusion, a pellet mill was used and adjusted to operate at a maximum temperature of 95 °C. The die and knife of the pelleting machine were first adjusted to produce pellets of 1.80 ± 0.07 mm in diameter by 5.86 ± 0.80 mm in length (n = 30). To obtain pellets with a consistent moisture content, the feed was dried at 60 °C using a convection oven for a maximum period of 3 h. After an initial 30 min drying, batches of 5 kg of feed were transferred to a pot for steam-cooking for 10 min under 95 °C. Post-cooked pellets were then subjected to final drying in the convection oven until a moisture content of 125.9 ± 11.2 g kg−1 (n = 10) was reached. Moisture content of pellets was kept as consistent as possible by taking feed samples at 15 min intervals during drying. Samples were analyzed with a halogen rapid moisture analyzer.
Finished diets were chemically analyzed [28]. Dry matter (DM) was determined by drying samples in a convection oven for 24 h at 105 °C. The Dumas combustion method was applied to analyze CP (AOAC 968.06), while total lipids were determined through acid hydrolysis (AOAC 954.02). Ash content was determined by burning samples in a muffle furnace at 600 °C for 2 h (AOAC 942.05) and crude fiber by enzymatic–gravimetric determination (AOAC 992.16). AA and FA compositions were determined using high-performance liquid chromatography [29,30] and high-resolution gas chromatography (GC) with a flame ionization detection fitted with a capillary GC column, respectively.
Diets reached a mean (±standard deviation, sd) CP and total lipid content of 344.5 ± 4.7 and 65.4 ± 5.8 g kg−1 (g kg−1 of the diet, as-is), respectively (Table 1). Total dietary Met (Met + Cys), Lys, and threonine (Thr) content reached 6.2 ± 0.2 (10.6 ± 0.4 g kg−1), 18.4 ± 0.6, and 12.9 ± 0.4 g kg−1, respectively (Table 2). The dietary FA profile changed as FML was replaced for KRM (Table 3). The total dietary concentration of eicosapentaenoic acid (EPA, 20:5n-3) tended to increase with higher inclusions of KRM, from a low of 1.4 g kg−1 in diet 120–0 to a high of 2.9 g kg−1 in diet 6–4.5. The total dietary content of docosahexaenoic acid (DHA, 22:6n-3) was more consistent across diets, varying between 2.1 and 2.8 g kg−1. The total dietary polyunsaturated (PUFA) and highly unsaturated fatty acid (HUFA) content remained above 19.9 and 4.0 g kg−1, respectively, across all diets.

2.5. Shrimp Stocking

The shrimp species used in this trial was the Pacific whiteleg shrimp, P. vannamei, purchased as post-larvae (PL) from a commercial hatchery (Atlantico Larvicultura Ltd.a., Beberibe, Brazil) distant 63 km from the lab. A total of 100,000 PLs at the age of PL10 with 2.7 ± 0.2 mg body weight (BW) were transported to the lab in nine 15-L plastic bags (741 PLs L−1). Plastic bags contained seawater saturated with pure dissolved oxygen. At arrival, shrimp were acclimated to temperature, pH, and salinity and stocked in nursery tanks. A shrimp sample containing approximately 1000 animals was collected for RT-PCR (Real-Time Polymerase Chain Reaction) to screen for the following viruses: White Spot Syndrome (WSS), Infectious Hypodermal and Hematopoietic Necrosis (IHHN), and Infectious Myonecrosis (IMN). RT-PCR results indicated shrimp were free from these viruses.
PLs were nursery-reared in five 23-m3 tanks with a commercial crumbled diet containing a minimum of 40% CP. Once shrimp reached 1.28 ± 0.08 g BW (p > 0.005, n = 140, one-way Analysis of Variance, ANOVA), they were transferred to seventy 1-m3 tanks under 135 shrimp m−2 (120 shrimp tank−1), allowing seven replicate tanks per diet. Shrimp were first acclimated during 19 days with a commercial 35%-CP feed (Camanutri 35, Neovia Nutrição e Saúde Animal Ltd.a., São Lourenço da Mata, Brazil) when they reached 2.87 ± 0.45 g. Animals were fed on the experimental diets from the 20th to the 88th day of rearing.

2.6. Feeding

Shrimp were fed daily, including Sundays, exclusively in feeding trays measuring 14.3 cm in diameter and borders with 3.5 cm in height. Trays were installed in the middle of each tank bottom at a density of one unit per tank. At each feeding time, feeding trays were checked for feed remains, which were collected for weighing and disposal. Feed delivery and collection of feed remains in feeding trays occurred at the following times: 1st meal: 07:00 a.m.–10:00 am; 2nd meal: 10:00 a.m.–01:00 p.m.; 3rd meal: 01:00 p.m.–04:00 p.m.; and 4th meal: 04:00 p.m.–07:00 a.m. Daily rations were split as 25, 15, 15, and 45% at the 1st, 2nd, 3rd, and 4th feeding times, respectively.
Over the 20-day acclimation period, shrimp were first fed a fixed daily ration that varied from 12.0 to 15.0 g of feed per tank (3.8–8.5% of the estimated stocked shrimp biomass). Starting on the 21st day of rearing, the daily rations were calculated based on the equation MM = 0.0931BW0.6200, where MM is the maximum amount of feed that can be consumed daily by an individual with a specific BW Daily meals were reduced by 30% across all treatments to achieve an FCR of 1.5. Feeding trays were inspected daily to check for dead animals, which were collected and discarded. Dead animals were not replaced throughout the culture period. Starting on the 19th day of rearing and then on a biweekly basis, five shrimp from each tank were captured, and their BW was determined. Until the next weight check, feed ratio increased, assuming individual mean daily weight shrimp gains for each tank from previous week, maintaining a fixed 0.21% daily drop in survival.

2.7. Shrimp Growth Performance

At harvest, all live shrimp were counted and individually weighed to a 0.01 g precision Ohaus Adventurer, model ARA520, Toledo do Brasil Indústria de Balanças Ltd.a., São Bernardo do Campo, Brazil). Final shrimp survival (S, %) was calculated as S = P O P f P O P i × 100 , where POPi represents the number of stocked shrimp, and POPf represents the number of shrimp at harvest. The weekly weight gain (WWG, g week−1) was determined by the formula
W W G = B W f B W i t × 7 ,
where
BWi is the wet shrimp body weight (BW, g) at stocking, BWf is the final shrimp BW at harvest, and t is the number of days in culture.
The gain in shrimp yield (YIE, g of shrimp biomass gained m−2) was determined as
Y I E = B I O f B I O i t a n k   b o t t o m   a r e a ( m 2 ) ,
where
BIOi denotes the initial shrimp biomass per tank (g), BIOf denotes the final shrimp biomass (g), and tank bottom area denotes 0.89 m2.
FCR was calculated by dividing the total inputs of feed (g, as-is basis) delivered per tank during the entire rearing period by the total gained shrimp biomass per tank (g, as-is). The apparent feed intake (AFI, g of feed delivered divided by the number of stocked shrimp) was calculated by dividing the total amount of feed delivered (g) by the number of stocked shrimp.

2.8. Shrimp Whole Body CP Content and Protein Deposition

At stocking and harvest, live shrimp were collected for CP (AOAC 968.06) analysis of their whole body. At stocking, a total of 1 kg of shrimp was collected for analysis. At harvest, a composite sample consisting of 70 shrimp from each dietary treatment (10 shrimp per tank) was prepared for analysis. The head-on shell-on (HOSO) shrimp were freeze-dried, ground, and blended. Deposition of dietary protein (%) was calculated as (NRC 2011)
D e p o s i t i o n   ( % ) = f i n a l   s h r i m p   B W   ×   C P   i n   s h r i m p   a t   h a r v e s t     i n i t i a l   s h r i m p   B W   ×   C P   i n   s h r i m p   a t   s t o c k i n g   ×   100 C P   i n   f e e d   ×   A F I .

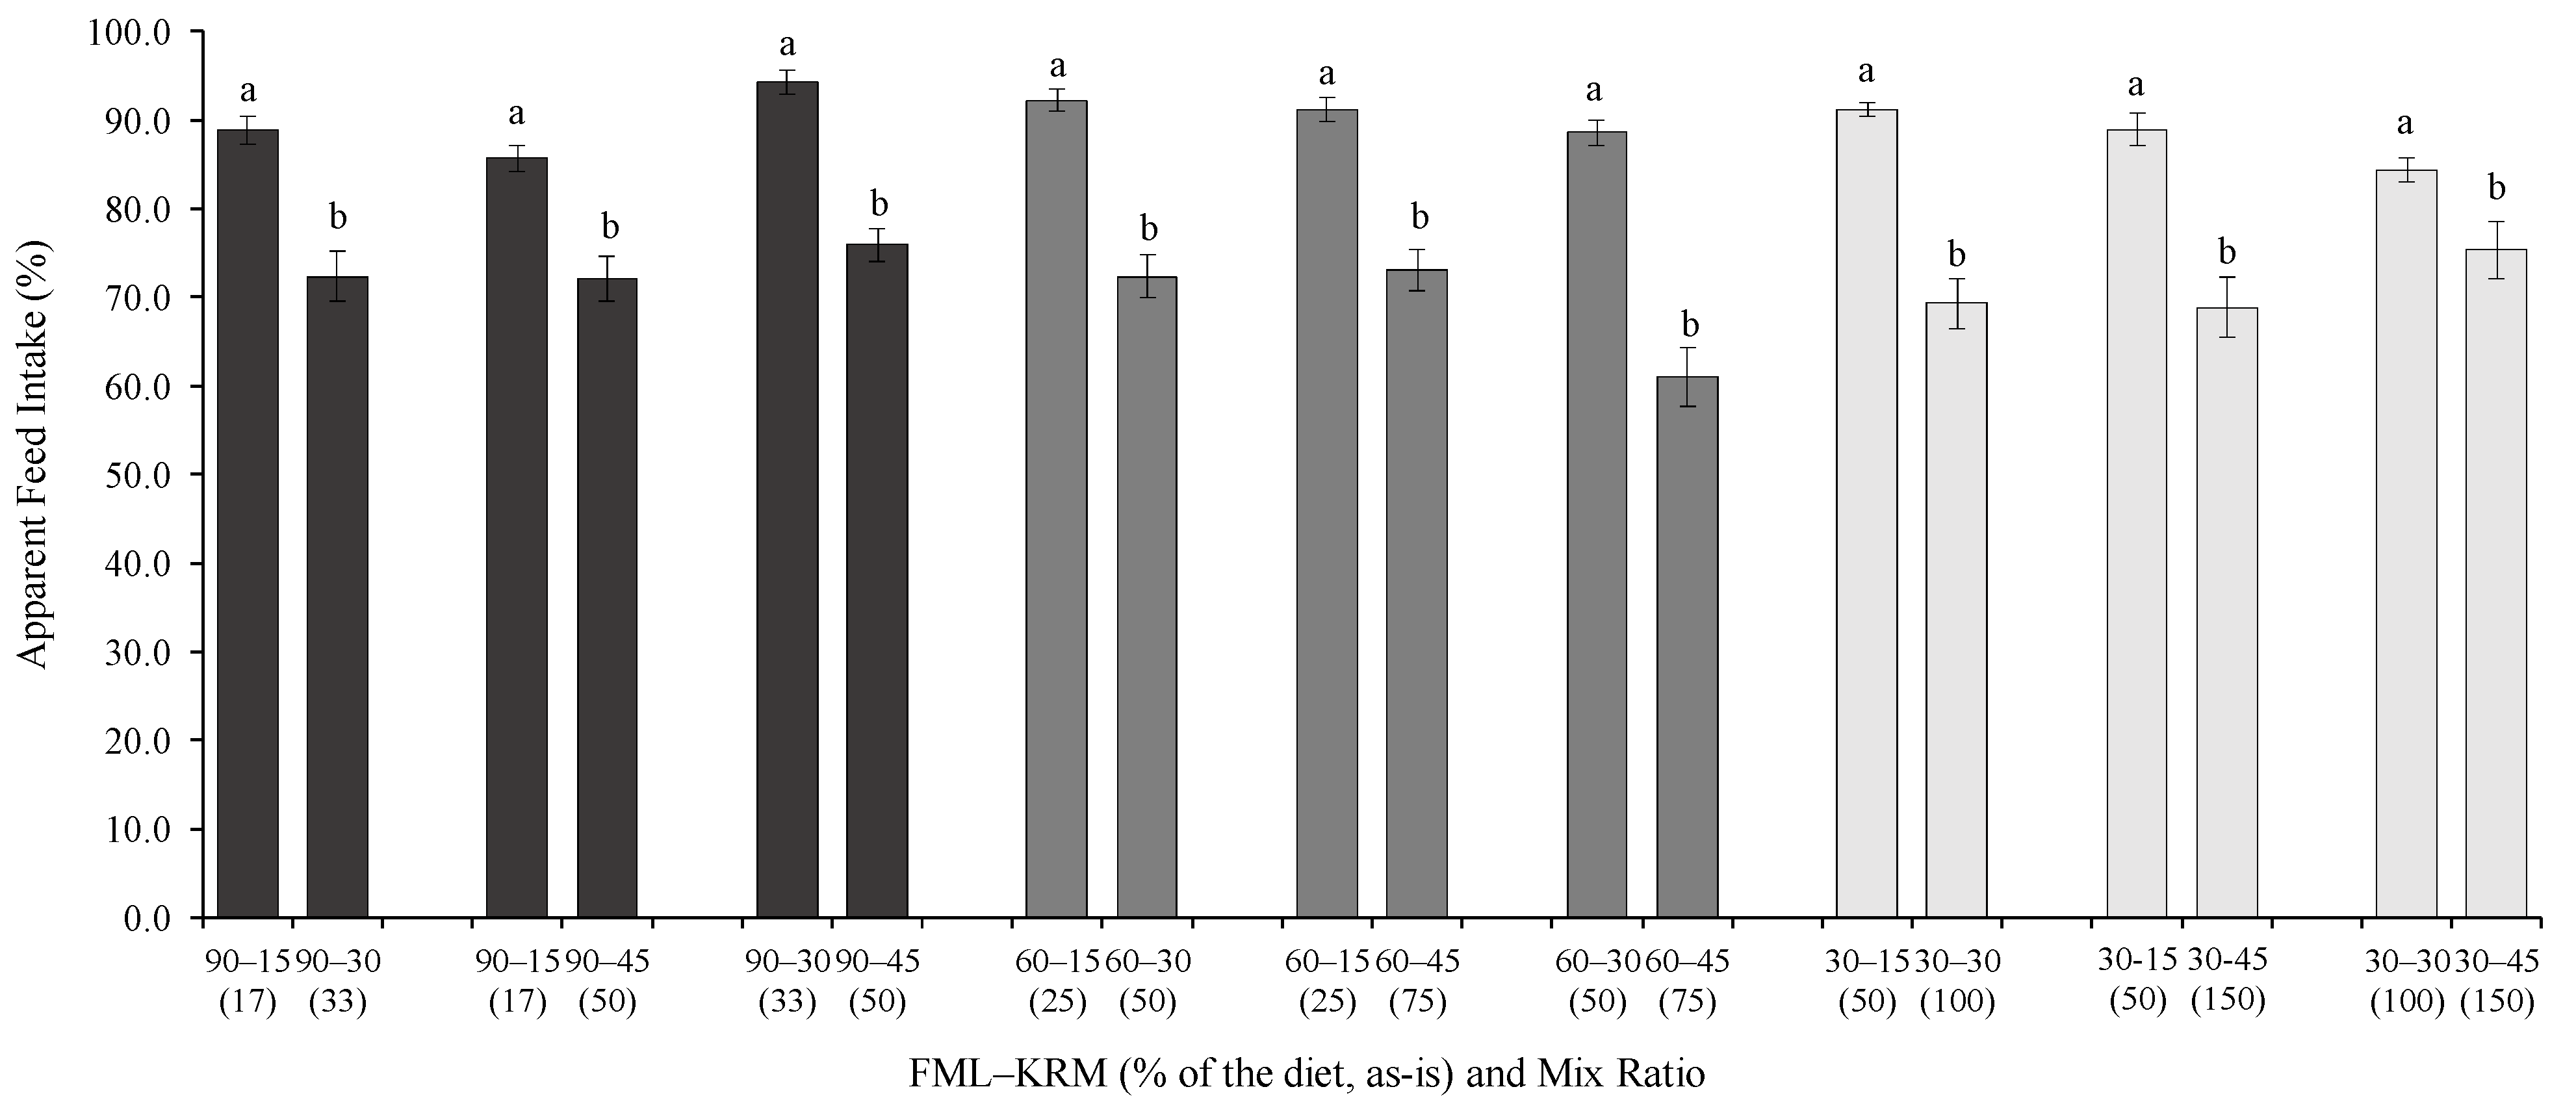
2.9. Feed Preference

Feed preference was assessed by simultaneously confronting two individual diets and measuring their relative apparent feed intake (AFI, %). In this study, 30 tanks of 0.5 m3 were stocked with juvenile shrimp of 12.46 ± 2.05 g (n = 1200) under 71 animals m−2 (40 shrimp tank−1). Two feeding trays (141 mm2 in surface area) were placed in each tank with individual diets. Feeding trays were simultaneously immersed in water and rested in the tank bottom near the side walls of the tank and away from the aeration area. During the observation period, shrimp were fed in excess so that feed remains were always available for collection. Feed delivery and collection of uneaten feed took place at the following times: 1st meal: 07:30 a.m.–08:30 a.m.; 2nd meal: 01:30 p.m.–02:30 p.m., respectively. Shrimp were fed for eight consecutive days. After one hour of feed delivery, feeding trays were recovered, feed remains were collected, dried in a convection oven at 105 °C for 24 h, and weighed. AFI (% of the total meal consumed) was calculated as (total amount of dried feed remains collected, in g/total amount of dried feed delivered, in g) × 100. The total amount of feed consumed was calculated on a DM basis by subtracting the amount of dried feed delivered from the dried amount of feed leftovers. Feed moisture content was determined by drying five samples of 3 g of each diet type in a convection oven at 105 °C for 24 h.

2.10. Statistical Analysis

Homogeneity of variance was examined for all data by using Bartlett-Box F and Cochran’s C tests. Kurtosis and skewness and their standard error (i.e., s.e. kurtosis and s.e. skewness) were applied to the data as measures of asymmetry and tests of normality. When needed, data were transformed to a log(x) scale to normalize and homogenize the variances and to meet statistical assumptions. The effect of the dietary inclusion and mix ratios of FML and KRM on shrimp final survival, gained yield, weekly growth, AFI, FCR, and protein deposition were analyzed through two-way ANOVA. The differences in the mean values of shrimp BW and CP content in HOSO shrimp between dietary treatments were analyzed with one-way ANOVA. When significant differences were detected, they were compared two-by-two with Tukey’s test. The significant level of 5% was set in all statistical analyses. The statistical package IBM® SPSS® Statistics 23.0 (SPSS Inc., Chicago, IL, USA) was used.

3. Results

The HOSO shrimp CP content at harvest reached 795.4 ± 10.8 g kg−1 (dry matter basis, n = 30) with a protein deposition of 36.04 ± 1.96% (n = 70). No statistical effect of FML and KRM dietary level or their mix ratio was detected over these parameters (p > 0.05). Final shrimp survival achieved 93.9 ± 4.5% (mean ± sd), and it remained unaffected by the dietary inclusion or different ratios of FML and KRM (Table 4, p > 0.05). A similar result was found for gained shrimp yield (1235 ± 92 g m−2) and FCR (1.47 ± 0.09). Shrimp grew from a minimum of 0.68 ± 0.05 g week−1 (diet 30–30) to a maximum of 0.76 g week−1 (diets 60–15 and 60–30). Both shrimp weekly growth and AFI were significantly influenced by the dietary inclusion of FML (p < 0.05). An inclusion of 60 g kg−1 FML, regardless of KRM inclusion, resulted in faster shrimp growth and higher AFI compared to 30 g kg−1. No statistical differences could be detected in these parameters among the other dietary inclusion levels of FML and KRM or their interaction (p > 0.05).
The final shrimp BW exceeded 10 g for all dietary groups except for shrimp fed the 30–30 diet. Final BW was significantly influenced by dietary treatment (Figure 1, p < 0.05). Shrimp fed diets with 30 g kg−1 FML, regardless of KRM inclusion, achieved the lowest BW, particularly when fed 30–15 and 30–30 diets. However, combining 30 g kg−1 FML with 45 g kg−1 KRM (30–45 diet) was as effective as diets 120–0 or 90–15 in terms of shrimp BW (p > 0.05). There was no difference in BW within the 60 g kg−1 FML group. Shrimp BWs from the 60–30 and 60–45 diets were comparable to the 120–0 diet, whereas only the 60–15 diet outperformed the former. Increasing FML from 30 to 60 g kg−1 significantly enhanced shrimp BW regardless of KRM inclusion. There was no significant increment in shrimp BW when FML was increased from 60 to 90 g kg−1. All diets with 90 g kg−1 FML outperformed those with 30 g kg−1 FML. Shrimp demonstrated comparable performance in the final BW, matching that of diet 120–0 and the group of diets containing 60 g kg−1 FML (Table 4). The only exception was the combination of 90–15, which showed an inferior BW in comparison to 60–15. The control diet, with 120 g kg−1 FML and no KRM, only outperformed diets 30–15 and 30–30. It performed similarly to all other diets, except when compared to shrimp fed the diet 60–15 (p < 0.05).
Feed preference was significantly affected by the dietary inclusion of KRM regardless of FML level (Figure 2). Two-by-two comparisons indicated that the dietary inclusion of KRM at 15 g kg−1 resulted in a higher AFI (%) than at 30 and 45 g kg−1 under all FML levels (p < 0.05, Student’s t-test). Diets with 30 g kg−1 KRM inclusion also resulted in a greater feed preference than at 45 g kg−1.

4. Discussion

The present study has indicated that a combination of 60–15 g kg−1 FML-KRM was able to deliver a higher final shrimp BW than 120 g kg−1 FML alone. Shrimp performance (survival, growth, yield, FCR, and final BW) exhibited similarity between diets containing FML–KRM in combinations such as 30–45, 60–30, 60–45, and 120–0. This corresponds to a reduction of up to 75% and 37.5% in the dietary utilization of FML and the sum of marine proteins, respectively. These findings are in line with the work of Nunes and Masagounder [22]. These authors reported that reducing the dietary inclusion of FML from 180 to 60 g kg−1 had no detrimental effect on shrimp overall performance if total dietary Met levels were kept at 8.2 g kg−1 (as-is).
Most of the published studies have evaluated KRM in diets that combined high levels of plant and/or animal proteins with low inclusions of FML [7,9,10,31] or in diets that were not thoroughly balanced for essential nutrients [7,9,23,31,32]. In the latter case, KRM is generally added to the diets as a supplementary ingredient or as an FML protein replacement. Even if formulas are designed to be isonitrogenous and/or isolipidic, these approaches will likely elevate the levels of EAAs, EFAs, and other nutrients if not appropriately balanced. Such conditions should favor an increased shrimp growth performance, especially when nutrients in diets used for comparison purposes are restrained. In our work, we sought to balance EAAs and EFAs across all diets, limiting the supply of dietary Met. Previous studies have shown that shrimp growth performance is maximized with a total dietary Met (Met + Cys) of 8.1 g kg−1 (12.8 g kg−1) depending on FML level [22]. Our results indicated that even when EAAs and EFAs are well-balanced with Met (Met + Cys) marginally restrained at 6.2 ± 0.2 g kg−1 (10.6 ± 0.4 g kg−1), KRM has a growth-promoting effect on juvenile P. vannamei.
However, these inclusion levels and ratios should not be viewed as fixed recommendations for whiteleg shrimp diets. The adoption of various other ingredients and dietary nutrient levels can introduce effects different from those in the present study. For example, higher dietary inclusions of KRM, more than 15 g kg−1, have been reported to have a growth and immune enhancement effect in juvenile P. vannamei. Ambasankar et al. [23] raised juvenile P. vannamei (initial BW = 0.5 g) with diets containing a combination of KRM at 0, 20, 40, and 60 g kg−1 with 60 or 120 g kg−1 FML (Indian fish meal with 614 g kg−1 CP and 76 g kg−1 lipid). They reported the highest final shrimp survival and BW when KRM was used at 40 and 60 g kg−1, irrespective of the FML level. The authors also observed that shrimp fed diets containing 120 g kg−1 FML and 60 g kg−1 KRM showed a higher up-regulation of immune parameters, such as a prophenoloxidase-activating enzyme, serine protease, and superoxide dismutase. In this work of Ambasankar et al., the diets remained isonitrogenous (ranging from 355.0 ± 1.4 to 363.9 ± 2.4 g kg−1, as-is) and isolipidic (53.6 ± 1.3 to 58.8 ± 1.0 g kg−1). Nevertheless, the dietary levels of EPA (20:5n-3) gradually increased with higher doses of KRM. Additionally, since diets were not designed for EAA balance, it is likely that their concentrations also increased in response to higher inclusions of KRM. A similar case was observed in Soares et al. [9] work with juvenile P. vannamei (initial BW = 0.15 ± 0.01 g). The authors added 10, 20, and 40 g kg−1 (as-is) KRM to an FML-deprived diet containing 540 g kg−1 soybean meal. They reported an increase in food consumption with 20 and 40 g kg−1 KRM diets, but only the latter diet improved shrimp growth. While in this case, diets were also kept isonitrogenous and isolipidic, and other dietary nutrients probably increased in response to higher inclusions of KRM.
KRM and FML are both known to act as strong chemoattractants for juvenile whiteleg shrimp [31]. These ingredients are reported to contain a high concentration of low molecular weight compounds that act as chemical drivers for shrimp feeding stimulation [10]. Our results indicated that a dietary inclusion of 15 g kg−1 of KRM and 60 g kg−1 FML at a 25% mix ratio in a practical diet for juvenile whiteleg shrimp can be more effective in terms of feed preference than higher inclusions of both ingredients. Other studies have found that KRM can successfully stimulate behavioral feeding activity in P. vannamei when included at a dietary level of 10 to 30 g kg−1 in FML-challenged diets [8,31]. Nevertheless, the effectiveness of feeding effectors varies [8,10,31], as does their minimum concentration needed to boost feed attractability and palatability [7,8,31]. This is likely because the amount of stimulatory compounds (free amino acids, nucleotides, peptides) diverges widely among ingredients [10]. For example, Derby et al. [7], working with juvenile P. vannamei, reported that 10, 30, and 60 g kg−1 KRM added to a feed deprived of FML enhanced the palatability (i.e., consumption) of pellets in a concentration-dependent fashion. In gelatin-based pellets, Nunes et al. [8] reported that 10 g kg−1 of condensed fish soluble protein is more effective in terms of attractiveness and palatability for juvenile P. vannamei than 5 g kg−1. In our study, a mixture of FML and KRM, without the inclusion of any other animal protein, appeared to generate a synergistic effect in enhancing shrimp feed preference, eliminating the need for additional quantities of these ingredients. A better understanding of the presence of chemical feed drivers in marine proteins, their threshold concentrations to stimulate feeding, and synergistic interactions will allow further reductions in their usage while optimizing shrimp feed intake and growth performance.

5. Conclusions

Our study emphasized the synergistic impact of combining precise dietary levels and mix ratios of FML and KRM for whiteleg shrimp grower diets. The findings indicate that when essential nutrients are evenly balanced across diets, lower doses of KRM and FML at specific ratios can be equally effective in generating positive feeding stimuli and promoting shrimp growth performance as higher ones. Furthermore, our findings demonstrated that FML can be effectively reduced by up to 75% when combined with lower levels of KRM. This corresponds with the industry’s ongoing trend to achieve greater sustainability and cost efficiency through the reduced utilization of critical resources. Further studies are necessary to better predict the dosage of feeding effectors based on the levels and interactions of chemical drivers of shrimp feeding stimuli. This may allow nutritionists to include feeding effectors based on targeted formulated levels and ratios of key drivers of shrimp feeding stimulation rather than relying on product-specific dietary inclusions.

Author Contributions

Conceptualization, A.J.P.N. and L.B.; data curation, A.J.P.N. and J.S.L.; funding acquisition, L.B.; investigation, A.J.P.N., J.S.L. and C.G.D.G.; project administration, A.J.P.N. and J.S.L.; resources, A.J.P.N. and J.S.L.; supervision, A.J.P.N.; writing—original draft, A.J.P.N. and L.B.; writing—review and editing, A.J.P.N., R.D. and L.B. All authors have read and agreed to the published version of the manuscript.

Funding

The Brazilian National Counsel of Technological and Scientific Development (CNPq, Brasilia, Brazil) provided financial support for the first author (CNPq/MCTI, PQ# 306144/2020-4). Krill meal for this study was provided by Aker BioMarine Feed Ingredients AS (Lysaker, Norway), and they financially supported the expenses associated with the chemical analysis of diets and shrimp outlined in this manuscript.

Informed Consent Statement

Informed consent was obtained from all subjects involved in the study.

Data Availability Statement

The data that support the findings of this study are available from the corresponding author upon reasonable request.

Acknowledgments

The first author acknowledges the support from a research productivity fellowship (CNPq/MCTI, PQ# 306144/2020-4).

Conflicts of Interest

L.B. and R.D. are employed by Aker BioMarine Feed Ingredients AS, Norway, which has provided the krill meal.

References

  1. FAO. The State of World Fisheries and Aquaculture (SOFIA); FAO: Rome, Italy, 2022; p. 266. [Google Scholar]
  2. Garlock, T.; Asche, F.; Anderson, J.; Ceballos-Concha, A.; Love, D.C.; Osmundsen, T.C.; Pincinato, R.B.M. Aquaculture: The missing contributor in the food security agenda. Glob. Food Secur. 2022, 32, 100620. [Google Scholar] [CrossRef]
  3. Villarreal, H. Shrimp farming advances, challenges, and opportunities. J. World Aquac. Soc. 2023, 54, 1092–1095. [Google Scholar] [CrossRef]
  4. Jannathulla, R.; Rajaram, V.; Kalanjiam, R.; Ambasankar, K.; Muralidhar, M.; Dayal, J.S. Fishmeal availability in the scenarios of climate change: Inevitability of fishmeal replacement in aquafeeds and approaches for the utilization of plant protein sources. Aquac. Res. 2019, 50, 3493–3506. [Google Scholar] [CrossRef]
  5. Suresh, A.V. 2—Feed formulation software. In Aquafeed Formulation; Nates, S.F., Ed.; Academic Press: San Diego, CA, USA, 2016; pp. 21–31. [Google Scholar]
  6. Ali, S.A.; Gopal, C.; Ramana, J.V. Attractant and growth promoting properties of some feed materials and chemicals incorporated in the diets for Penaeus monodon (Fabricius). Indian J. Fish. 2011, 54, 67–73. [Google Scholar]
  7. Derby, C.D.; Elsayed, F.H.; Williams, S.A.; González, C.; Choe, M.; Bharadwaj, A.S.; Chamberlain, G.W. Krill meal enhances performance of feed pellets through concentration-dependent prolongation of consumption by Pacific white shrimp, Litopenaeus vannamei. Aquaculture 2016, 458, 13–20. [Google Scholar] [CrossRef]
  8. Nunes, A.J.P.; Sá, M.V.C.; Andriola-Neto, F.F.; Lemos, D. Behavioral response to selected feed attractants and stimulants in Pacific white shrimp, Litopenaeus vannamei. Aquaculture 2006, 260, 244–254. [Google Scholar] [CrossRef]
  9. Soares, R.; Peixoto, S.; Davis, R.P.; Davis, D.A. Feeding behavior and growth of Litopenaeus vannamei fed soybean-based diets with added feeding effectors. Aquaculture 2021, 536, 736487. [Google Scholar] [CrossRef]
  10. Suresh, A.V.; Kumaraguru vasagam, K.P.; Nates, S. Attractability and palatability of protein ingredients of aquatic and terrestrial animal origin, and their practical value for blue shrimp, Litopenaeus stylirostris fed diets formulated with high levels of poultry byproduct meal. Aquaculture 2011, 319, 132–140. [Google Scholar] [CrossRef]
  11. Cruz-Suarez, L.E.; Guillaume, J.; Wormhoudt, A.V. Effect of Various Levels of Squid Protein on Growth and Some Biochemical Parameters of Penaeus japonicus Juveniles. Nippon Suisan Gakkaishi 1987, 53, 2083–2088. [Google Scholar] [CrossRef]
  12. Guillaume, J.; Cruz-Ricque, E.; Cuzon, G.; Van Wormhoudt, A.; Revol, A. Growth factors in Penaeid shrimp feeding. Adv. Trop. Aquac. 1989, 9, 327–338. [Google Scholar]
  13. Williams, K.C.; Smith, D.M.; Barclay, M.C.; Tabrett, S.J.; Riding, G. Evidence of a growth factor in some crustacean-based feed ingredients in diets for the giant tiger shrimp Penaeus monodon. Aquaculture 2005, 250, 377–390. [Google Scholar] [CrossRef]
  14. Ghamkhar, R.; Hicks, A. Comparative environmental impact assessment of aquafeed production: Sustainability implications of forage fish meal and oil free diets. Resour. Conserv. Recycl. 2020, 161, 104849. [Google Scholar] [CrossRef]
  15. Sharifinia, M.; Bahmanbeigloo, Z.A.; Keshavarzifard, M.; Khanjani, M.H.; Daliri, M.; Koochaknejad, E.; Jasour, M.S. Fishmeal replacement by mealworm (Tenebrio molitor) in diet of farmed Pacific white shrimp (Litopenaeus vannamei): Effects on growth performance, serum biochemistry, and immune response. Aquat. Living Resour. 2023, 36, 19. [Google Scholar] [CrossRef]
  16. Alvarez, J.S.; Hernández-Llamas, A.; Galindo, J.; Fraga, I.; García, T.; Villarreal, H. Substitution of fishmeal with soybean meal in practical diets for juvenile white shrimp Litopenaeus schmitti (Pérez-Farfante & Kensley 1997). Aquac. Res. 2007, 38, 689–695. [Google Scholar]
  17. Bulbul, M.; Kader, M.A.; Koshio, S.; Ishikawa, M.; Yokoyama, S. Effect of replacing fishmeal with canola meal on growth and nutrient utilization in kuruma shrimp Marsupenaeus japonicus (Bate). Aquac. Res. 2014, 45, 848–858. [Google Scholar] [CrossRef]
  18. Bulbul, M.; Koshio, S.; Ishikawa, M.; Yokoyama, S.; Kader, M.A. Performance of Kuruma shrimp, Marsupenaeus japonicus fed diets replacing fishmeal with a combination of plant protein meals. Aquaculture 2013, 372–375, 45–51. [Google Scholar] [CrossRef]
  19. Galkanda-Arachchige, H.S.C.; Wilson, A.E.; Davis, D.A. Success of fishmeal replacement through poultry by-product meal in aquaculture feed formulations: A meta-analysis. Rev. Aquac. 2020, 12, 1624–1636. [Google Scholar] [CrossRef]
  20. McLean, E.; Barrows, F.T.; Craig, S.R.; Alfrey, K.; Tran, L. Complete replacement of fishmeal by soybean and poultry meals in Pacific whiteleg shrimp feeds: Growth and tolerance to EMS/AHPND and WSSV challenge. Aquaculture 2020, 527, 735383. [Google Scholar] [CrossRef]
  21. Mendoza; Dios, D.; Vazquez; Cruz; Ricque; Aguilera; Montemayor. Fishmeal replacement with feather-enzymatic hydrolyzates co-extruded with soya-bean meal in practical diets for the Pacific white shrimp (Litopenaeus vannamei). Aquac. Nutr. 2001, 7, 143–151. [Google Scholar] [CrossRef]
  22. Nunes, A.J.P.; Masagounder, K. Optimal Levels of Fish Meal and Methionine in Diets for Juvenile litopenaeus vannamei to Support Maximum Growth Performance with Economic Efficiency. Animals 2023, 13, 20. [Google Scholar] [CrossRef]
  23. Ambasankar, K.; Dayal, J.S.; Vasagam, K.P.K.; Sivaramakrishnan, T.; Sandeep, K.P.; Panigrahi, A.; Raja, R.A.; Burri, L.; Vijayan, K.K. Growth, fatty acid composition, immune-related gene expression, histology and haematology indices of Penaeus vannamei fed graded levels of Antarctic krill meal at two different fishmeal concentrations. Aquaculture 2022, 553, 738069. [Google Scholar] [CrossRef]
  24. Krafft, B.A.; Lowther, A.; Krag, L.A. Bycatch in the Antarctic krill (Euphausia superba) trawl fishery. Fish. Manag. Ecol. 2023, 30, 154–160. [Google Scholar] [CrossRef]
  25. Ache, B.W.; Gleeson, R.A.; Thompson, H.A. Mechanisms for mixture suppression in olfactory receptors of the spiny lobster. Chem. Senses 1988, 13, 425–434. [Google Scholar] [CrossRef]
  26. Derby, C.D.; Girardot, M.N.; Daniel, P.C. Responses of olfactory receptor cells of spiny lobsters to binary mixtures. II. Pattern mixture interactions. J. Neurophysiol. 1991, 66, 131–139. [Google Scholar] [CrossRef] [PubMed]
  27. Fine-Levy, J.B.; Derby, C.D. Behavioral discrimination of binary mixtures and their components: Effects of mixture interactions on coding of stimulus intensity and quality. Chem. Senses 1992, 17, 307–323. [Google Scholar] [CrossRef]
  28. Association of Official Agricultural Chemists International. Official Methods of Analysis of AOAC International; Latimer, G.W., Jr., Ed.; Oxford University Press: Oxford, UK, 2023. [Google Scholar]
  29. White, J.A.; Hart, R.J.; Fry, J.C. An evaluation of the Waters Pico-Tag system for the amino-acid analysis of food materials. J. Autom. Chem. 1986, 8, 867320. [Google Scholar] [CrossRef]
  30. Hagen, S.R.; Augustin, J.; Grings, E.; Tassinari, P. Precolumn phenylisothiocyanate derivatization and liquid chromatography of free amino acids in biological samples. Food Chem. 1993, 46, 319–323. [Google Scholar] [CrossRef]
  31. Nunes, A.J.P.; Sabry-Neto, H.; Oliveira-Neto, S.; Burri, L. Feed preference and growth response of juvenile Litopenaeus vannamei to supplementation of marine chemoattractants in a fishmeal-challenged diet. J. World Aquac. Soc. 2019, 50, 1048–1063. [Google Scholar] [CrossRef]
  32. Claessens, S.; Aragão, C.; Hoffling, F.B.; Pinheiro, I.; Fracalossi, D.M.; Vieira, F.N. Mussel Meal as a Promotor of Growth Performance for the Whiteleg Shrimp (Litopenaeus vannamei). J. Mar. Sci. Eng. 2023, 11, 1670. [Google Scholar] [CrossRef]
Figure 1. Mean (±standard error) body weight (BW) of P. vannamei after 88 days of rearing under 135 shrimp m−2. Shrimp were raised with diets with different dietary levels of fish meal (FML) and krill meal (KRM) and mix ratio (in parentheses). Each column is the mean BW obtained from seven rearing tanks. Common letters indicate non-statistically significant differences according to Tukey’s test at α = 0.05 significant level.
Sustainability 16 04628 g001
Figure 2. Two-by-two comparisons of relative apparent feed intake (AFI, %) for juvenile P. vannamei fed diets with different levels of fish meal (FML) and krill meal (KRM) and their mix ratio (in parentheses). Diets were confronted against each other for two weeks in nine 0.5-m−3 tanks using two feeding trays per tank. Each bar represents the mean (±standard error) of 140 individual measurements of feed intake. Different letters indicate statistically significant differences in AFI between diets at the α = 0.05 level in accordance with the Student’s t-test.
Sustainability 16 04628 g002
Table 1. Ingredient and proximate composition (g kg−1, as-is) of experimental diets.
IngredientsDiets/Ingredient Composition (g kg−1, as-is)
Fish meal (g kg−1)120906030
Krill meal (g kg−1)0153045153045153045
Mix ratio10017335025507550100150
Soybean meal a380.0380.0380.0380.0380.0380.0380.0380.0380.0380.0
Wheat flour b300.0300.0300.0300.0300.0300.0300.0300.0300.0300.0
Soy protein concentrate c70.587.373.860.3117.6104.190.6147.9134.4120.9
Salmon meal d120.090.090.090.060.060.060.030.030.030.0
Krill meal e-15.030.045.015.030.045.015.030.045.0
Wheat gluten meal f20.020.020.020.020.020.020.020.020.020.0
Salmon oil37.937.536.635.837.937.136.238.337.536.6
Cassava starch20.015.516.918.49.410.912.43.44.96.4
Calcium carbonate15.016.515.514.519.118.017.021.620.619.5
Soy lecithin oil9.410.08.36.712.110.58.914.312.711.0
Sodium monophosphate g8.79.210.010.79.09.810.58.89.610.3
Salt6.77.27.27.27.77.77.78.28.28.2
Synthetic binder h5.05.05.05.05.05.05.05.05.05.0
Vitamin–mineral premix i3.03.03.03.03.03.03.03.03.03.0
DL-Methionine j1.61.81.61.52.01.91.82.32.22.0
Stay C, 35% k1.01.01.01.01.01.01.01.01.01.0
Choline chloride l0.80.70.80.80.50.60.70.40.50.5
L-Lysine m0.40.40.20.10.60.50.30.80.70.5
Proximate composition (%, as-is)
Dry matter865.0869.5863.6862.2861.7877.2879.1891.9882.9887.9
Crude protein347.2341.2342.3339.5341.4337.9345.8349.5349.2351.2
Total lipids73.769.570.664.752.165.263.066.462.566.1
Total fiber21.323.622.223.726.726.724.527.624.628.8
Crude ash68.571.071.072.170.371.771.873.372.073.9
Nitrogen-free extract n354364358362371376374375375368
Gross energy (MJ kg−1)16.916.916.816.616.216.917.017.417.017.0
a Bunge Alimentos S.A. (Luiz Eduardo Magalhães, Brazil). 898.1 g kg−1 dry matter (DM), 46.06 g kg−1 CP, 1.60 g kg−1 ether extract (EE), 5.70 g kg−1 total fiber, 6.79 g kg−1 ash, 0.51 g kg−1 methionine (Met), 1.27 g kg−1 M+C, 2.90 g kg−1 lysine (Lys), 1.80 g kg−1 threonine (Thr). b Bunge Alimentos S.A. (Gaspar, Brazil). 87.32 g kg−1 DM, 12.44 g kg−1 CP, 1.55 g kg−1 EE, 0.37 g kg−1 total fiber, 0.81 g kg−1 ash, 0.21 g kg−1 Met, 0.61 g kg−1 M+C, 0.28 g kg−1 Lys, 0.45 g kg−1 Thr. c X-Soy 600®, CJ Selecta S.A. (Araguari, Brazil). 93.04 g kg−1 DM, 62.24 g kg−1 CP, 1.20 g kg−1 EE, 4.60 g kg−1 total fiber, 6.60 g kg−1 ash, 0.81 g kg−1 Met, 1.68 g kg−1 M+C, 3.76 g kg−1 Lys, 2.40 g kg−1 Thr. d Pesquera Pacific Star (Puerto Monte, Chile). 89.42 g kg−1 DM, 63.86 g kg−1 CP, 9.30 g kg−1 EE, 0.14 g kg−1 total fiber, 16.20 g kg−1 ash, 1.65 g kg−1 Met, 2.35 g kg−1 M+C, 4.19 g kg−1 Lys, 2.35 g kg−1 Thr. e QRILL™ Aqua, Aker BioMarine Feed Ingredients AS (Lysaker, Norway). 93.53 g kg−1 DM, 57.42 g kg−1 CP, 22.00 g kg−1 EE, 3.51 g kg−1 total fiber, 12.23 g kg−1 ash, 1.57 g kg−1 Met, 1.98 g kg−1 M+C, 4.00 g kg−1 Lys, 2.41 g kg−1 Thr. f Agridient, Inc. (Farmington Hills, MI, USA). 90.91 g kg−1 moisture, 79.19 g kg−1 CP, 3.96 g kg−1 EE, 0.18 g kg−1 total fiber, 0.82 g kg−1 ash, 1.24 g kg−1 Met, 2.68 g kg−1 M+C, 1.33 g kg−1 Lys, 2.16 g kg−1 Thr. g Monobasic sodium phosphate. 0.60 g kg−1 calcium, 20.70 g kg−1 phosphorous, 14.12 g kg−1 available phosphorous. h Nutri-Bind Aqua Veg Dry, Nutri-Ad International NV (Dendermonde, Belgium). Synthetic pellet binder consisting of calcium lignosulfonate (94.00 g kg−1) and guar gum (6.00 g kg−1). i Rovimix 2050 Px Camarões VitMin (SAM) VM25L3 (BR4418A025). DSM Produtos Nutricionais Brasil Ltd.a. (São Paulo, Brazil). Guarantee levels per kg of product: vitamin A, 2,996,333 IU; vit. D3, 1,080,066 IU; vit. E, 22,344.50 mg; vit. K3, 7350 mg; vit. B1, 14,560 mg; vit. B2, 13,200 m g; vit. B5, 45,070 mg; vit. B6, 14,560 mg; vit. B12, 7.63 mg; folic acid, 1870 mg; nicotinic acid, 26,350 mg; biotin, 381 mg; inositol, 83,000 mg; Cu, 11,000 mg; I, 500 mg; Mn, 5000 mg; Se, 134 mg; Zn, 31,000 mg; Co, 1350 mg. j MetAMINO®, Evonik Nutrition & Care GmbH (Hanau, Germany). DL-Methionine, Feed Grade 990 g kg−1. k Rovimix® Stay C® 35. Minimum of 350 g kg−1 of phosphorylated vitamin C activity. DSM Nutritional Products AG (Schweiz, Switzerland). l Zouping Jujia Choline Industrial Co., Ltd. (Handian Industrial Zone, Zouping County, Shandong, China). 600 g kg−1 of active choline. m Biolys®, Evonik Nutrition & Care GmbH (Hanau, Germany). L-Lysine 546 g kg−1. n Calculated by difference [DM − (CP + EE + total fiber + ash)].
Table 2. Amino acid (g kg−1 of the diet, as-is) composition of experimental diets. CV, coefficient of variation (%).
CompositionDiets/Amino Acid Composition (g kg−1, as-is)
% FML120906030CV (%)
% KRM0153045153045153045
Essential Amino Acids (EAA)
Arginine20.421.720.019.220.320.720.621.520.320.93.5
Histidine7.78.17.17.47.77.98.07.97.98.04.0
Isoleucine13.314.113.212.413.613.313.213.913.814.13.9
Leucine24.025.424.022.623.924.324.124.823.924.73.0
Lysine18.619.317.917.318.218.218.319.218.118.43.2
Methionine6.36.56.36.15.86.46.16.35.86.23.8
Met + Cys a10.911.110.510.210.310.810.610.910.010.43.3
Phenylalanine15.316.214.714.415.515.715.516.115.516.03.7
Threonine12.913.513.312.312.713.113.013.012.512.62.9
Valine14.215.014.113.114.314.113.814.414.314.83.7
Non-Essential Amino Acids (NEAA)
Alanine15.716.314.914.714.915.315.315.014.314.83.7
Aspartic acid30.531.931.929.130.631.631.331.830.731.82.9
Cystine4.64.64.24.14.54.44.54.64.24.24.5
Glycine17.517.715.916.015.716.216.114.814.715.26.3
Glutamic acid63.866.459.958.763.664.162.966.363.265.64.0
Hydroxyproline1.81.41.51.31.01.00.90.60.60.639.2
Proline19.120.119.317.818.519.118.919.118.719.43.2
Serine15.416.315.614.515.215.815.515.815.015.43.2
Taurine0.80.80.90.90.60.70.80.10.50.635.9
Tyrosine10.410.910.29.810.310.610.510.810.510.83.1
∑ EAA b132.7139.8130.6124.8132.0133.7132.6137.1132.1135.73.0
∑ NEAA179.6186.4174.3166.9174.9178.8176.7178.9172.4178.42.9
∑ EAA + NEAA312.3326.2304.9291.7306.9312.5309.3316.0304.5314.12.9
a Methionine + cysteine. b Tryptophan not analyzed.
Table 3. Fatty acid composition (g kg−1 of the diet, as-is basis) of experimental diets.
Fatty AcidDiets/Fatty Acid Composition (g kg−1, as-is)
% FML120906030
% KRM0153045153045153045
4:0-0.10.1<0.010.10.10.10.10.1-
6:0<0.01<0.01<0.01<0.01<0.01<0.01<0.01<0.01<0.01<0.01
8:0<0.01<0.01<0.01<0.01<0.01<0.01<0.01<0.01<0.01<0.01
10:0<0.01<0.01<0.01<0.01<0.01<0.01<0.01<0.01<0.01<0.01
11:0<0.01<0.01<0.01<0.01<0.01<0.01<0.01<0.01<0.01<0.01
13:0<0.01<0.01<0.01<0.01<0.01<0.01<0.01<0.01<0.01<0.01
14:01.101.11.41.51.21.31.61.21.31.4
15:00.10.10.10.10.10.10.10.10.10.1
16:012.210.311.010.610.710.611.311.311.610.8
17:00.20.10.10.10.20.10.10.20.20.1
18:04.63.02.94.63.12.93.03.43.32.9
20:00.20.20.20.20.20.20.20.20.20.2
21:0<0.01<0.01<0.01<0.01<0.01<0.01<0.01<0.01<0.01<0.01
22:00.20.20.20.20.20.20.20.20.20.2
23:0---------0.1
24:00.10.10.10.10.10.10.10.10.10.1
15:1<0.01<0.01<0.01<0.01<0.01<0.01<0.01<0.01<0.01<0.01
16:1n-71.51.41.61.61.51.51.71.51.61.6
18:1n-924.118.919.824.120.219.420.122.022.320.4
20:1n-91.00.90.91.00.90.90.91.01.01.0
22:1n-90.40.40.40.40.40.40.40.40.40.4
24:1n-90.20.10.20.20.20.20.20.20.20.2
18:2n-619.417.918.219.417.816.616.619.218.716.4
20:2n-60.50.40.40.50.40.40.40.50.50.4
18:3n-60.10.10.10.10.10.10.10.10.10.1
20:3n-60.20.10.20.20.20.10.20.20.20.2
20:4n-60.20.10.20.20.20.20.20.20.20.2
18:3n-33.12.82.83.12.82.72.73.13.02.7
20:3n-30.10.10.10.10.10.10.10.10.10.1
20:5n-31.41.92.51.42.12.42.91.82.22.4
22:2n-60.1--0.1------
22:6n-32.32.12.52.32.42.52.82.42.72.6
∑n-3 a6.96.97.96.97.47.78.57.48.07.8
∑n-6 b20.518.619.120.518.717.417.520.219.717.3
∑SFA c18.715.216.117.415.915.616.716.817.115.9
∑MUFA d27.321.722.927.423.222.423.325.125.523.6
∑PUFA e23.421.421.823.421.420.020.123.222.619.9
∑HUFA f4.04.15.24.04.75.15.94.45.15.2
a n-3, 18:3n-3, 20:3n-3, 20:5n-3, 22:6n-3. b n-6, 18:2n-6, 20:2n-6, 18:3n-6, 20:3n-6, and 20:4n-6. c SFA, saturated fatty acids: 4:0, 6:0, 8:0, 10:0, 11:0, 13:0, 14:0, 15:0, 16:0, 17:0, 18:0, 20:0, 21:0, 22:0, 23:0, and 24:0. d MUFA, monounsaturated fatty acids: 15:1, 16:1, 18:1, 20:1, 22:1, and 24:1. e PUFA, polyunsaturated fatty acids: 18:2n-6, 20:2n-6, 18:3n-6, 18:3n-3, 20:3n-6, and 20:3n-3. f HUFA, highly unsaturated fatty acids: 20:4n-6, 20:5n-3, 22:2n-6, and 22:6n-3.
Table 4. Growth performance (mean ± standard deviation) and protein retention (%) in juvenile P. vannamei fed diets with different combinations (g kg−1 of the diet, as-is) of fish meal (FML) and krill meal (KRM). Shrimp were raised for 88 days under 135 animals m−2 and fed the experimental diets for 70 days. Each value represents the mean (±standard deviation, sd) of seven rearing tanks.
g kg−1 of the DietShrimp Growth PerformanceProtein Deposition (%)
Initial Body Weight (mg)Final Survival (%)Gained Yield (g m−2)Growth
(g week−1)
AFI a (g Feed per Stocked Shrimp)FCR b
FMLKRM
12001.31 ± 0.0795.1 ± 3.91252 ± 970.73 ± 0.0813.6 ± 1.01.46 ± 0.0534.88 ± 1.22
90151.27 ± 0.1094.3 ± 2.11237 ± 1010.73 ± 0.0513.3 ± 0.41.46 ± 0.1135.62 ± 2.18
301.27 ± 0.0893.9 ± 1.81258 ± 550.74 ± 0.0413.5 ± 0.41.45 ± 0.0336.19 ± 1.10
451.24 ± 0.0794.2 ± 3.21260 ± 1100.74 ± 0.0713.4 ± 0.81.43 ± 0.0536.73 ± 1.60
60151.28 ± 0.0989.6 ± 8.11224 ± 1120.76 ± 0.0613.8 ± 0.61.53 ± 0.1336.14 ± 1.45
301.28 ± 0.0892.8 ± 4.41261 ± 1070.76 ± 0.0913.6 ± 0.81.45 ± 0.0937.27 ± 2.52
451.33 ± 0.0793.3 ± 5.71269 ± 630.75 ± 0.0513.6 ± 0.71.45 ± 0.0837.25 ± 2.01
30151.33 ± 0.0793.9 ± 4.41179 ± 1230.69 ± 0.0713.1 ± 0.51.51 ± 0.1235.24 ± 2.53
301.28 ± 0.0794.9 ± 5.11166 ± 730.68 ± 0.0512.9 ± 0.41.50 ± 0.1034.79 ± 2.20
451.27 ± 0.1096.5 ± 4.31233 ± 470.71 ± 0.0412.9 ± 0.31.41 ± 0.0736.32 ± 1.68
Mean ± sd1.28 ± 0.0893.9 ± 4.51235 ± 920.73 ± 0.0613.4 ± 0.61.47 ± 0.0936.04 ± 1.96
Two-Way ANOVA---0.004; 6 > 3;0.004; 6 > 3;--
FML-0.0930.0843 = 12 = 9; 12, 9 = 63 = 12 = 9; 12, 9 = 60.5390.077
KRM-0.3560.3780.8760.8550.0660.194
FML × KRM-0.8030.9040.9270.9080.6820.838
a Apparent feed intake (AFI, g) is the amount of feed delivered (as-is) divided by the number of stocked shrimp. b Feed conversion ratio.
Disclaimer/Publisher’s Note: The statements, opinions and data contained in all publications are solely those of the individual author(s) and contributor(s) and not of MDPI and/or the editor(s). MDPI and/or the editor(s) disclaim responsibility for any injury to people or property resulting from any ideas, methods, instructions or products referred to in the content.

