Abstract
The Xiaojiang Basin ranks among the global regions with the highest density of geological hazards. Landslides, avalanches, and debris flows represent significant threats to the safety of residents and their properties, impeding sustainable development. This study utilized three InSAR techniques to monitor surface deformations in the basin, using the standard deviation of these measurements as a stability threshold to identify potential landslides. A systematic analysis of landslide development characteristics was then conducted. Key findings include the following: (1) The annual average deformation velocity in the basin from 2018 to 2021 ranged from −25.36 to 24.40 mm/year, identifying 212 potential landslides. (2) Deformation analysis of a typical landslide in Caizishan showed consistent detection of significant surface changes by all three InSAR methods. Seasonal deformation linked to summer rainfall exacerbates the movement in elevated landslides. (3) Landslides predominantly occur in fragile geological formations such as sandstone, mudstone, and kamacite on slopes of 20° to 40°. These landslides, typically covering less than 0.1 km2, are mostly found on barren and grassland terrains adjacent to lower debris gullies, with a relative elevation difference of under 300 m and an aspect range of 90° to 270°. A high kernel density value of 0.3 or higher was noted, with 86.8% influenced by regional tectonic activities, including fault zones. The results demonstrate that natural environmental factors primarily drive landslides in the Xiaojiang Basin, which pose significant threats to the safety of nearby residents. This study’s insights and outcomes provide valuable references for safeguarding local populations, disaster prevention, and promoting regional sustainable development.
1. Introduction
The Xiaojiang Basin, situated at the intersection of the Sichuan–Yunnan rhombic block and the Yangtze block, features a complex geological structure. This area is characterized by intense seismic activity and vigorous neotectonic movements that have extensively generated joints and fissures, leading to frequent geological disasters including landslides, mudslides, and avalanches. Such events significantly impact the livelihood of the basin’s inhabitants and hinder the economic and social development [1]. In 2020, the Dongchuan District, a primary administrative region within the basin, reported 153 landslides, 76 mudflows, 19 avalanches, and 10 instances of subsidence, posing threats to 45,827 individuals and potential economic losses amounting to CNY 2.893 billion [2]. Given these circumstances, it is imperative to conduct targeted research on landslide disaster monitoring and identification in the region. Understanding the development patterns, distribution characteristics, and influencing factors of regional landslides is essential for effective disaster mitigation and promoting sustainable development.
Traditional methods of monitoring landslide hazards involve establishing monitoring points, constructing observation routes, and using leveling instruments, total stations, and GNSS to measure the subsidence and horizontal displacement at these points. Although accurate, these techniques cover limited areas, require extensive labor and high costs, offer low efficiency, and the monitoring points may sustain damage, precluding continuous monitoring. This reduces the overall reliability of deformation monitoring and, consequently, the accuracy of landslide prediction. The introduction of interferometric synthetic aperture radar (InSAR) has significantly improved this scenario, attracting considerable academic interest for its application in landslide hazard monitoring due to its capability for precise, extensive deformation detection [3,4,5,6]. InSAR technology in monitoring landslides and other geological hazards has evolved into two main approaches. The first is the traditional differential interferometry synthetic aperture radar (D-InSAR) method. For instance, Romy Schlögel et al. utilized D-InSAR to monitor landslides in Southeast France [7], and Zhang et al. applied it to identify landslide hazards around the urban area of Dongchuan [8]. D-InSAR directly captures the surface deformation of landslide-prone areas and offers straightforward data processing, although it cannot provide continuous deformation data. The second approach involves time-series InSAR techniques, which address the limitations of D-InSAR by enabling the acquisition of deformation patterns and average deformation rates over extended periods. Prominent among these techniques are the persistent scatterer InSAR (PS-InSAR) and the small baseline subset InSAR (SBAS-InSAR). The PS-InSAR method has been used, for example, by Shi et al. for monitoring and stability analysis of landslides in the Three Gorges Reservoir area [9,10] and by Yang et al. to detect landslide clusters in the Batang section of the Jinsha River using Sentinel-1A data [11]. PS-InSAR’s main limitation is its sensitivity to man-made structures and bare ground, which can restrict the availability of coherent target points, especially in mountainous regions with few man-made features. The SBAS-InSAR method, on the other hand, has been applied by researchers like Zhao et al., who used it with ALOS/PALSAR data for large-scale landslide monitoring in northern California and southern Oregon, USA [12], and by Li, Zhang et al. for identifying potential landslides in the Bailong River basin [13,14,15]. SBAS-InSAR can use natural terrain features as coherent points, overcoming some of PS-InSAR’s drawbacks. However, it still faces challenges in extracting coherent points in densely vegetated areas and requires extensive data processing.
While the use of InSAR technology for landslide identification and monitoring is increasingly prevalent, its effectiveness is still compromised by several practical challenges. These include surface vegetation cover, terrain undulation, and atmospheric delays, which vary significantly across different terrains and surface covers [16,17,18,19]. Consequently, the reliability of landslide identification using a single InSAR method and its ability to effectively and comprehensively detect potential landslides in various regions remain uncertain. These uncertainties necessitate further in-depth exploration of InSAR technology’s application effectiveness across diverse areas. In response to these challenges, this study proposes the integration of the three InSAR methods to identify potential landslides within the same region. This approach not only facilitates cross-validation of the reliability of results obtained from different methods but also enhances the comprehensiveness of potential landslide detection. Such integration is crucial for advancing the monitoring capabilities necessary for sustainable development in vulnerable regions.
In this study, the Xiaojiang Basin was selected as the experimental site to employ Sentinel-1A microwave remote sensing imagery for topographical monitoring via three InSAR methods. These methods yielded data on deformation rates and the time-series deformation of the basin. An analysis of the deformation results from different InSAR techniques was conducted, focusing on the consistency of monitoring outcomes. Potential landslide zones were identified based on the specific characteristics of the study area. The distribution of landslides detected by various methods was examined, and the reliability of these findings was corroborated through existing field surveys. Furthermore, the development and distribution characteristics of potential landslides in the basin—such as slope gradient, slope direction, elevation difference, lithology, tectonics, and land-use type—were statistically analyzed in detail. This study discusses the main factors influencing the development of potential landslides in the watershed. This research aims to introduce novel ideas and methods for identifying and characterizing potential landslides at the basin scale, providing references for the emergency management of disaster prevention and mitigation, as well as for the development planning in the Xiaojiang Basin.
2. Overview of the Study Area
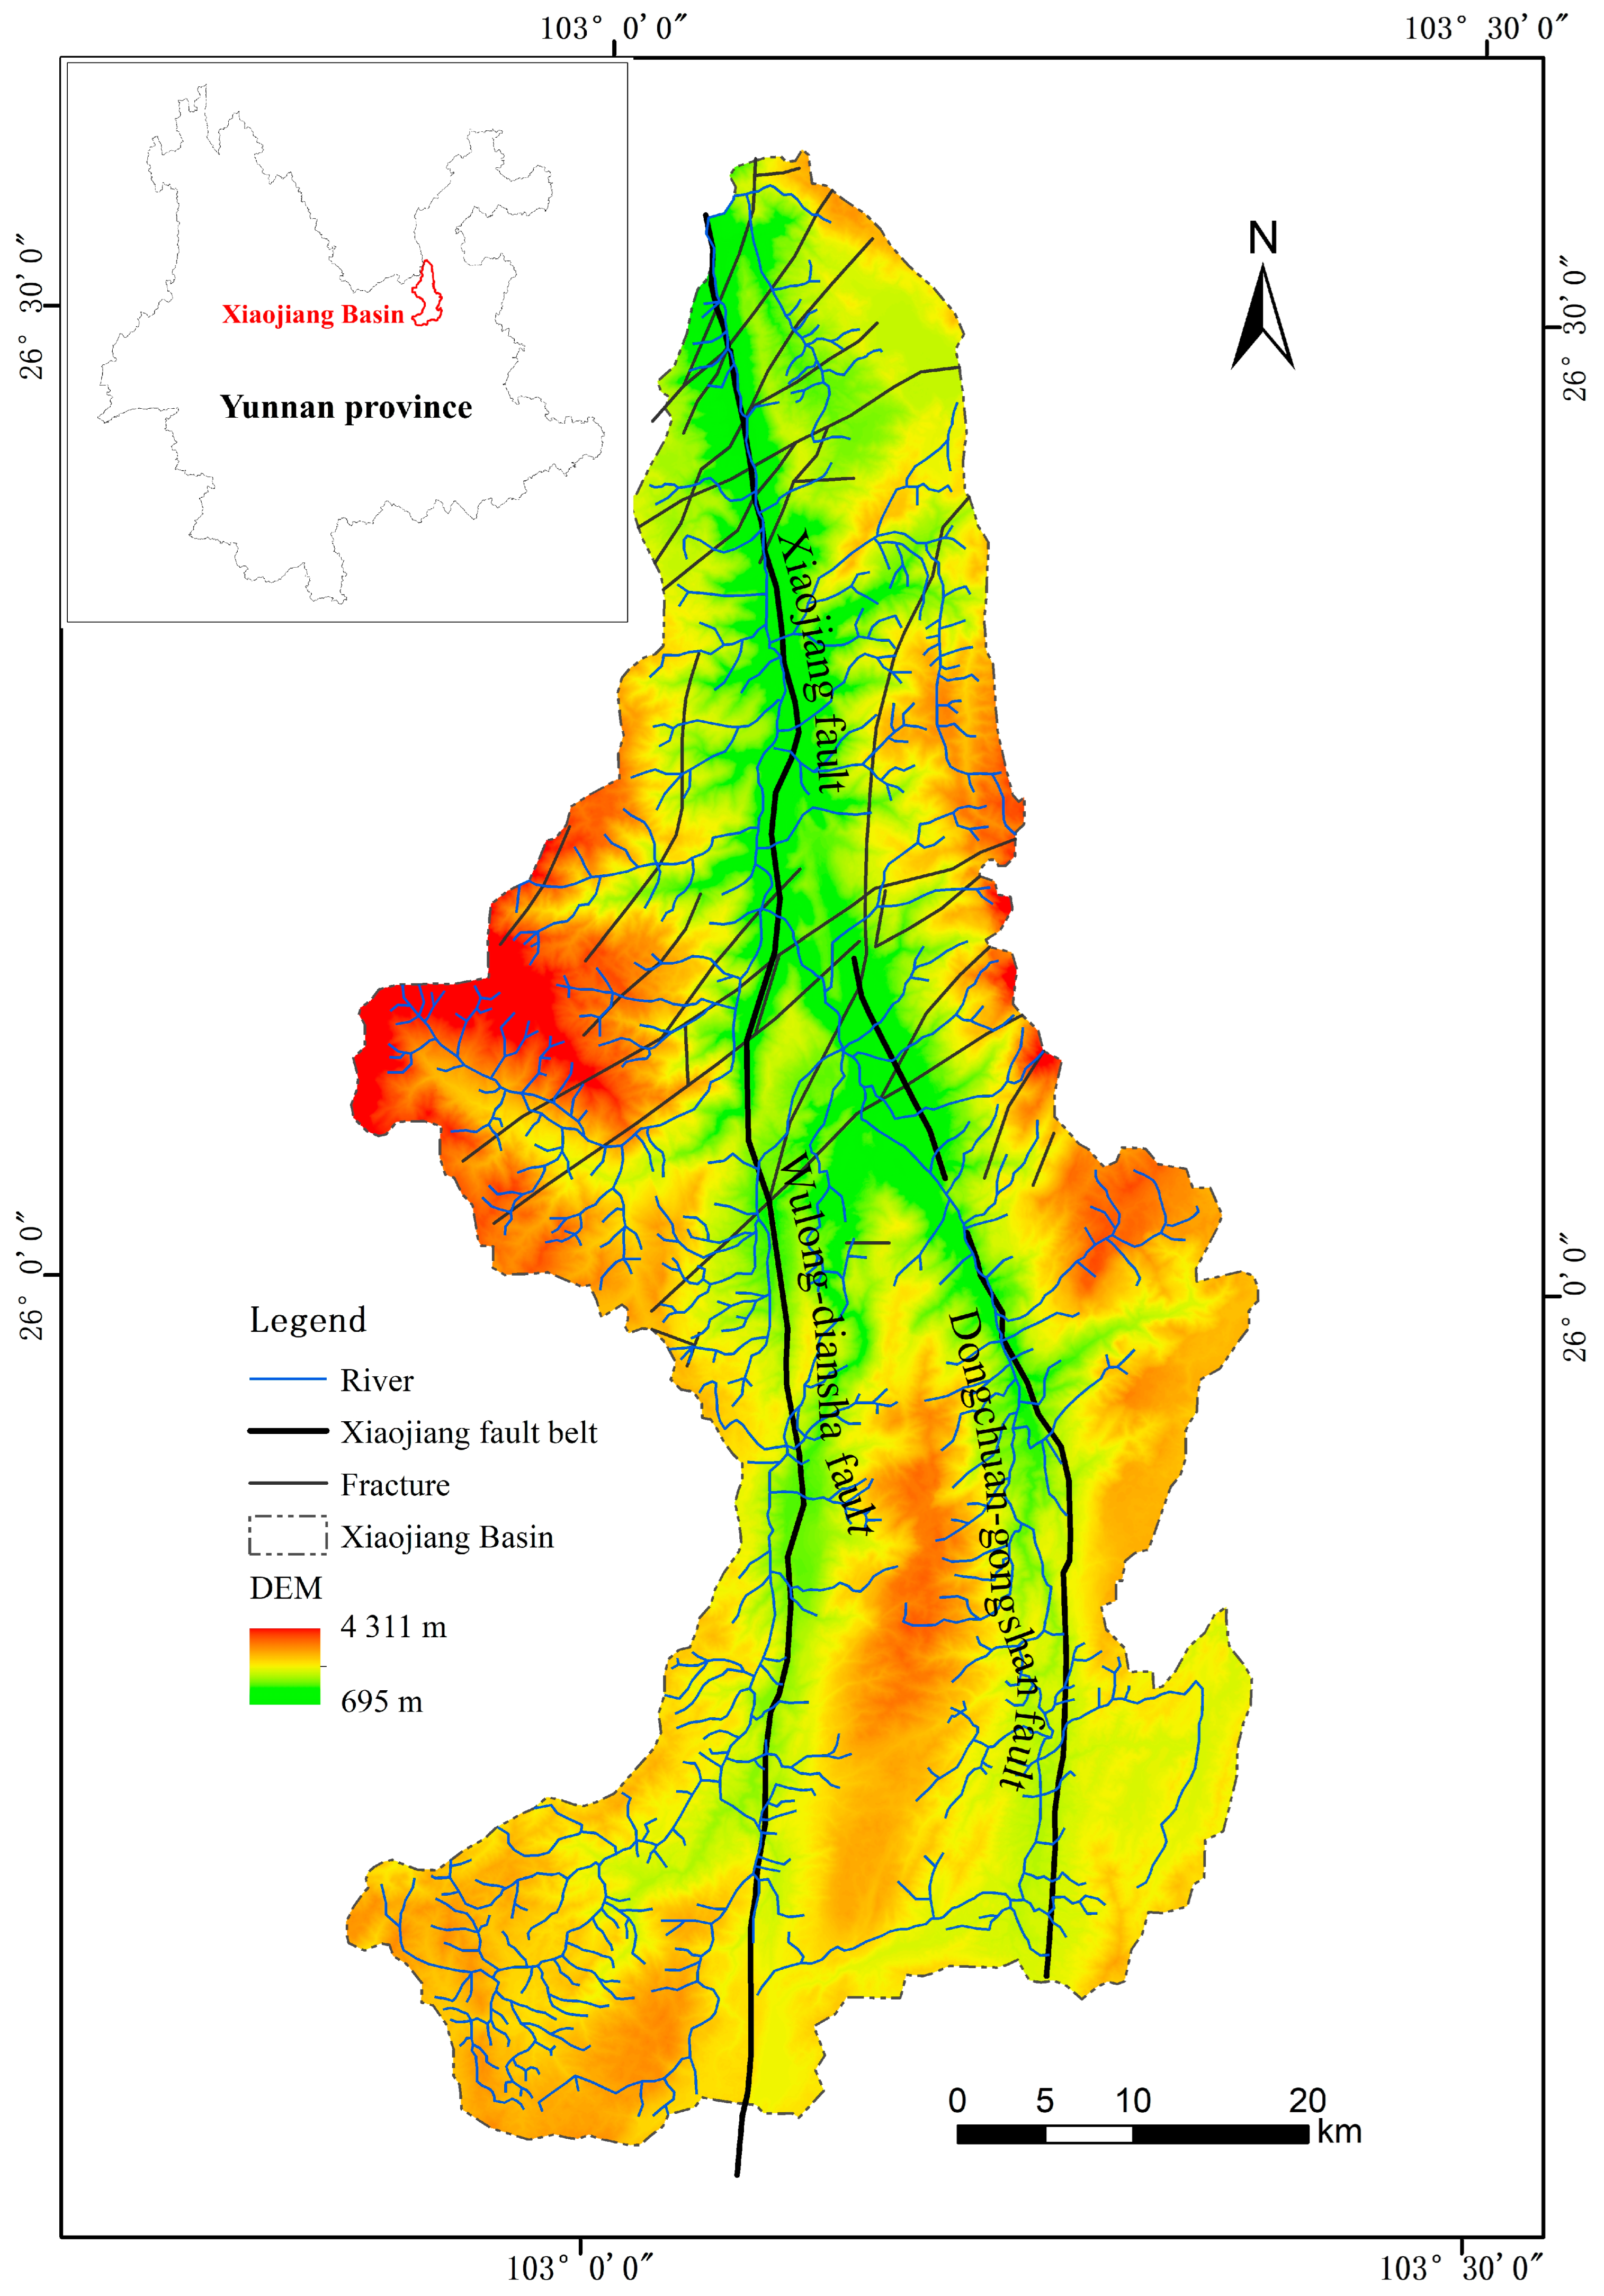
The Xiaojiang Basin, situated in northeastern Yunnan Province and a tributary on the right bank of the Jinsha River, covers an area of approximately 3070 km2. It features a substantial elevation range, with the highest point at 4344.1 m and the lowest at 695 m (as shown in Figure 1). The river originates from Qingshuihai Lake in Xundian County, flowing approximately 142 km. It is referred to as the Xiangshui River in its upper reaches, the Dabai River in the middle section, and Xiaojiang in the lower section, where it descends a vertical drop of 1510 m. The average flow rate over multiple years is about 51 m3/s. The terrain of the Xiaojiang Basin ascends from north to south, with the lowest point located at the northern extremity of the basin. Characterized by a subtropical monsoon climate, the basin exhibits pronounced three-dimensional climate zoning. It experiences high humidity and rainfall from May to October annually, transitioning to a dry period from November to April. The marked seasonality of precipitation results in an average annual rainfall of approximately 1000 mm.
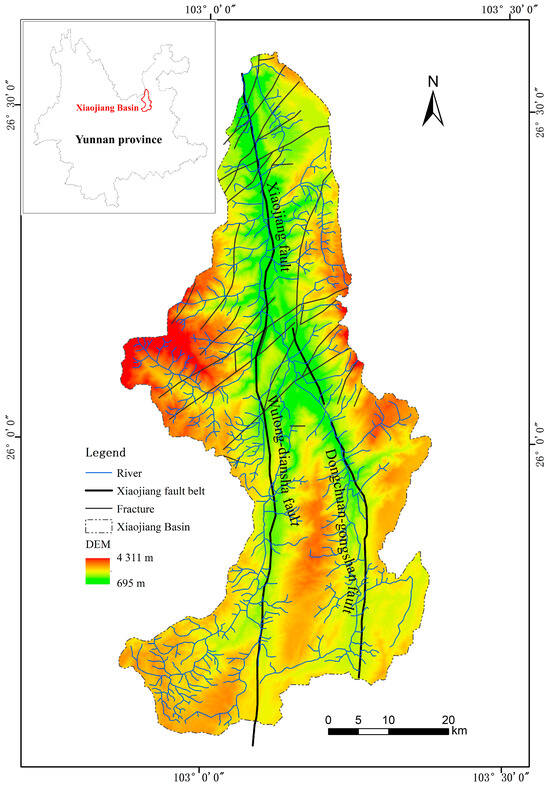
Figure 1.
Overview map of the study area.
The predominant geological formation in the Xiaojiang Basin is the Permian system, which is extensively distributed throughout the basin, especially in the middle and upper sections. The upper portion of this system comprises Emeishan basalt and is overlain by terrestrial volcanic deposits of sandstone, siltstone, and mudstone. The lower portion consists of muddy greywacke that includes dolomite, sandstone, and siltstone; these rocks form the high ridges seen in most of the basin’s mountain peaks. In the middle and lower reaches of the river basin, the geology is primarily characterized by slate and diorite. These materials exhibit low resistance to weathering and are susceptible to forming weathered clastic rocks due to tectonic activities. The valley slopes and gully accumulation fan areas are predominantly composed of Quaternary sedimentary rocks and Cenozoic alluvium, which have a loose structure, making them easily weathered and eroded. Located in the transitional zone between the Sichuan–Yunnan meridional tectonic belt and the Northeast China tectonic belt, the Xiaojiang fracture zone is a deep and extensive fracture zone known for its frequent and intense seismic activities. This fracture zone trends north–south and plays a pivotal role in controlling the geological structure of the region [20].
3. Data and Methods
3.1. Experimental Data
To assess the spatial distribution and developmental characteristics of landslide hazard sites within the designated study area, this investigation utilized 45 Sentinel-1A C-band Synthetic Aperture Radar (SAR) images from a descending orbit, covering the period from March 2018 to November 2021. These images, acquired in Interferometric Wide (IW) and Single Look Complex (SLC) modes with VV polarization, feature a spatial resolution of 5 m × 20 m.
For topographic correction during interferometric processing, the Shuttle Radar Topography Mission (SRTM) digital elevation model (DEM), provided by NASA with a spatial resolution of 30 m, was employed to assist in the geocoding of the SAR imagery.
Additionally, precise orbit ephemerides (POE) data from Sentinel-1A satellites facilitated the pre-processing and baseline error correction of the SAR data.
Optical remote sensing imagery from Landsat 8 and Gaofen-1 satellites was also integrated into the study, providing spatial resolutions of 30 m and 2 m, respectively.
Rainfall data for the same period were sourced from the Climatic Research Unit (CRU) of the University of East Anglia (UEA). This dataset was instrumental in analyzing the impact of rainfall on surface deformation within the study area.
3.2. Research Methods
3.2.1. D-InSAR Method
Differential synthetic aperture radar interferometry (D-InSAR) is a remote sensing technique that utilizes two interferometric images of the same area: one captured before and another after deformation. This method facilitates the acquisition of surface deformation through differential processing, achieving measurement accuracies at the millimeter level [21]. D-InSAR has been extensively applied in monitoring surface deformations such as ground settlement and landslides, yielding highly effective results [22].
For this study, two Sentinel-1A images, dated 13 October 2020, and 8 October 2021, were selectively cropped using the vector range line of the Xiaojiang River Basin. This process extracted the SAR image data required to assess the pre- and post-deformation states in the study area. The images were then processed using the D-InSAR method to determine the surface deformation from October 2020 to October 2021 (as shown in Figure 2a). The derived surface deformation variables for the study area were subsequently utilized to identify potential landslides within the region.

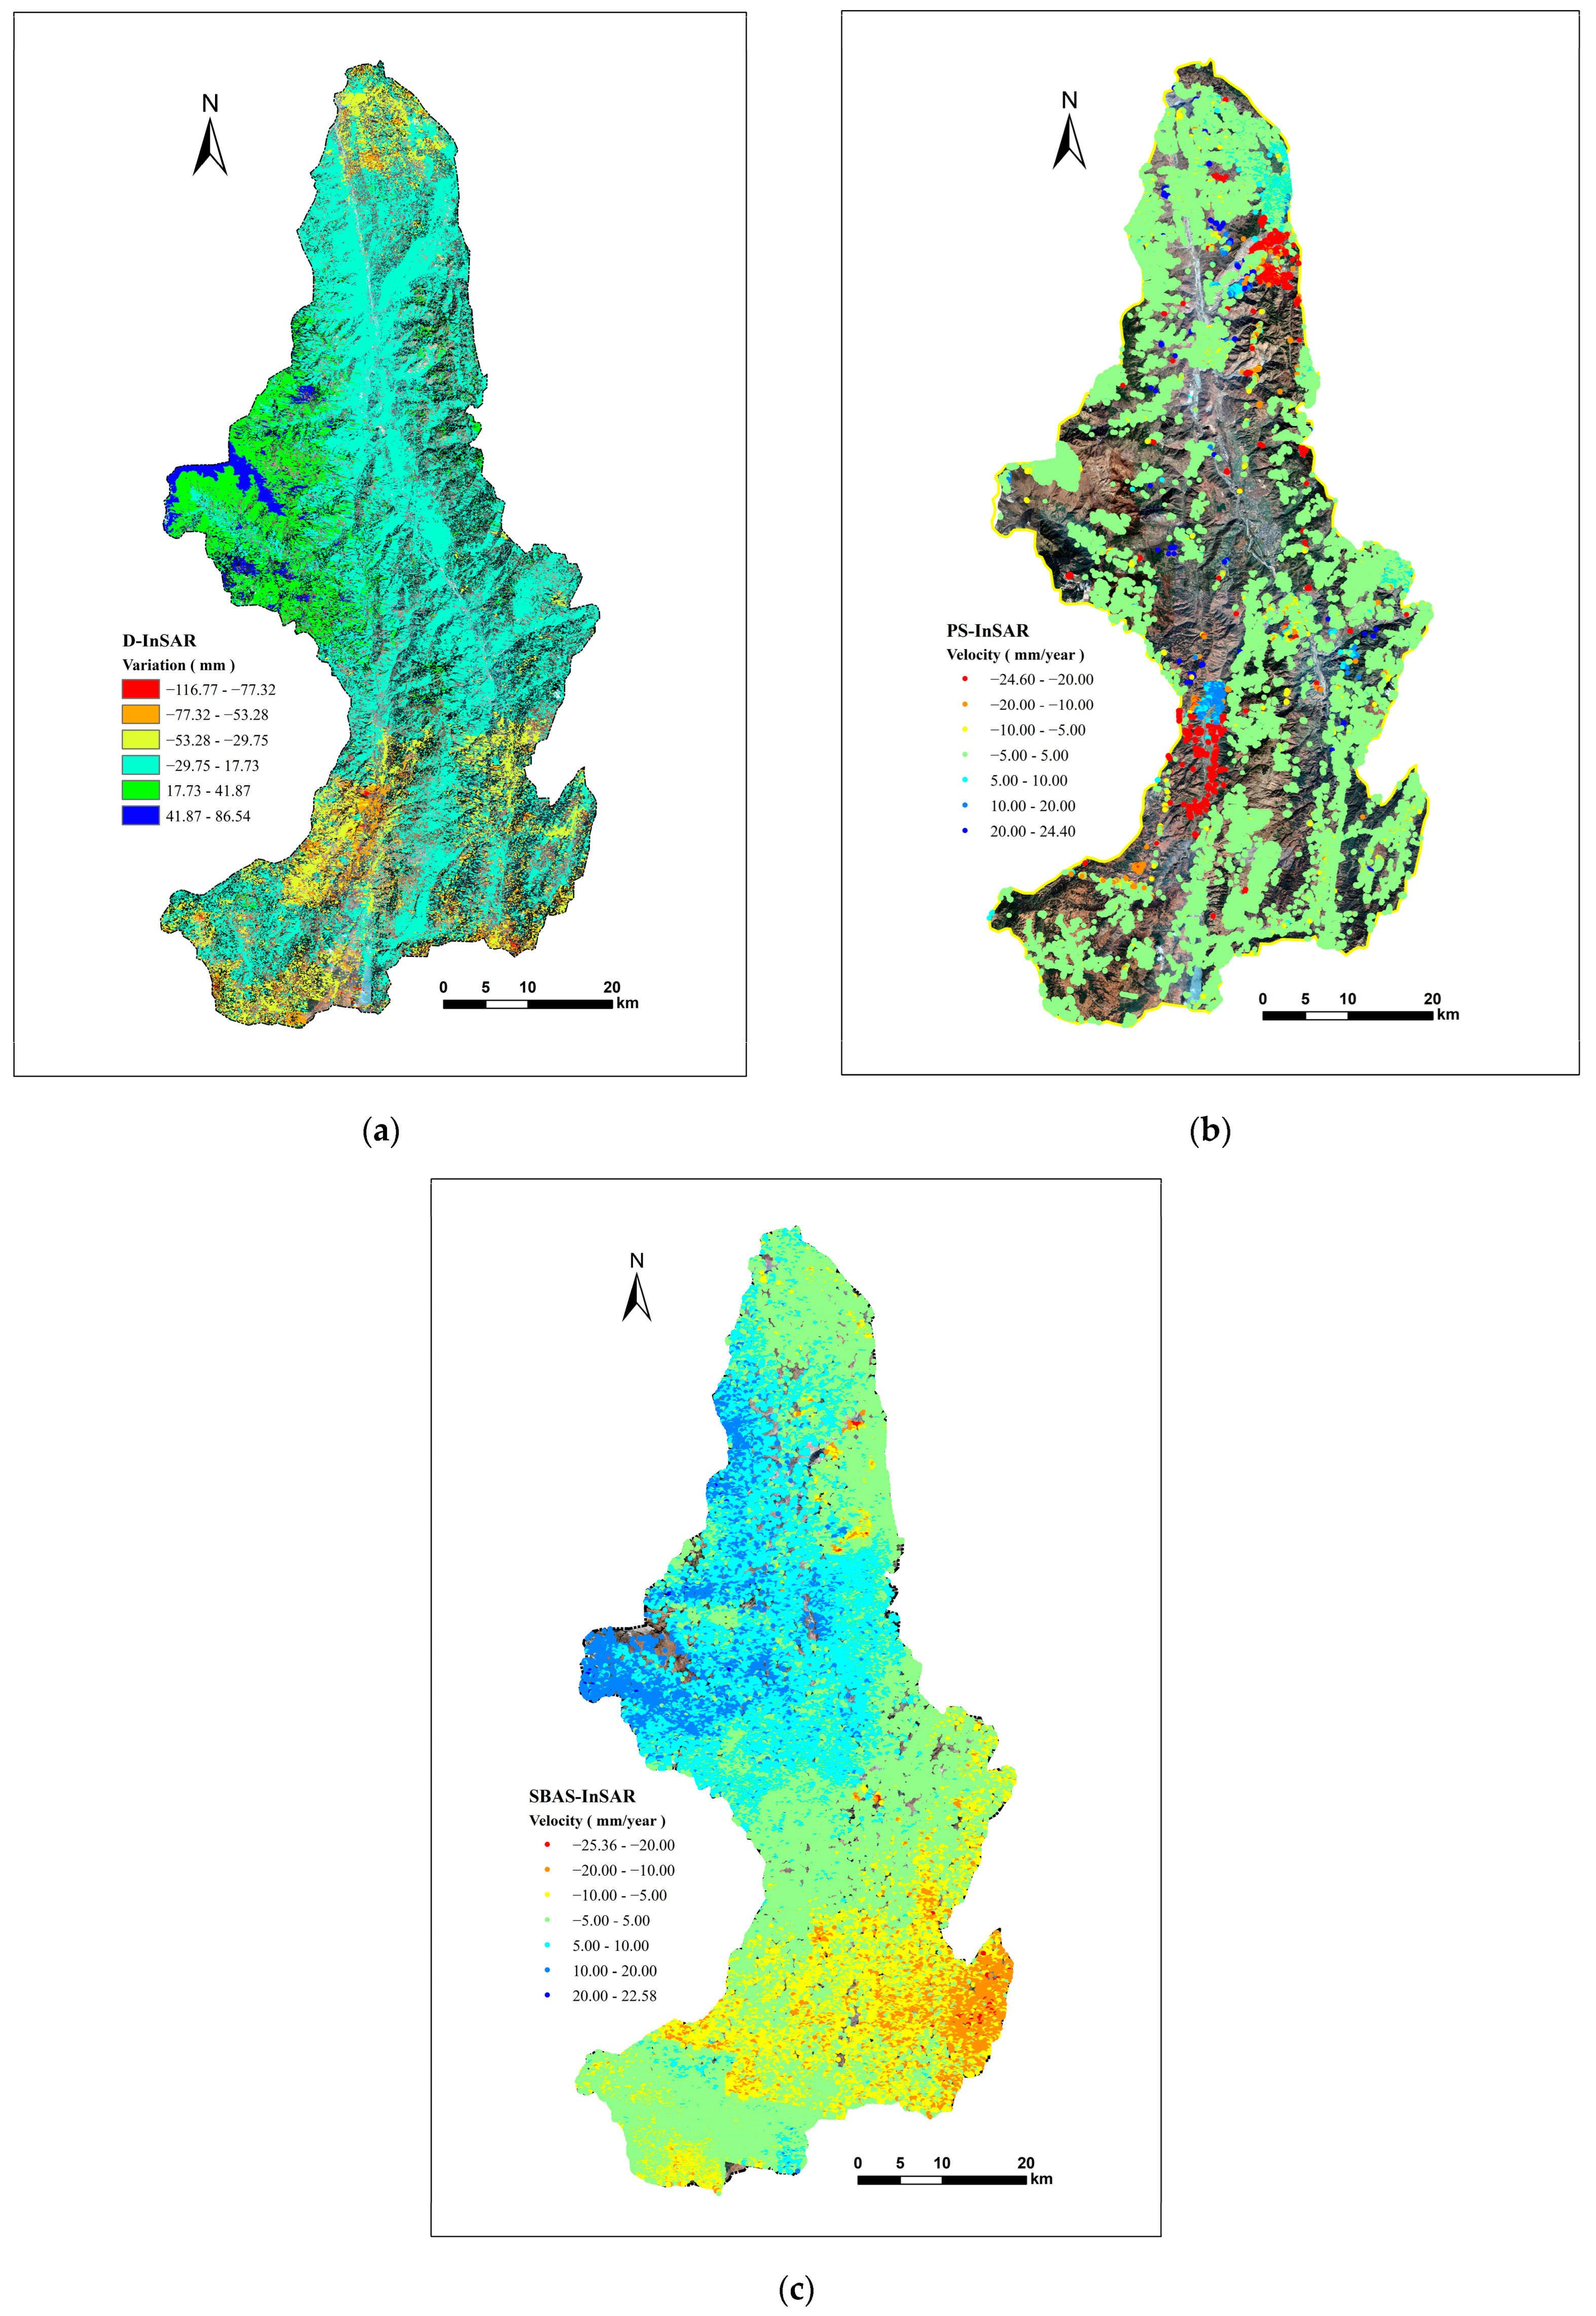
Figure 2.
Map of the three deformation monitoring results: (a) represents the D-InSAR surface deformation monitoring result; (b) is the PS-InSAR surface deformation monitoring result; and (c) is the SBAS-InSAR surface deformation monitoring result.
3.2.2. PS-InSAR Method
The permanent scatterers InSAR (PS-InSAR) technique was first proposed by the Italian scientist Ferretti in 2001 [23]. A D-InSAR technique, PS-InSAR performs interferometric processing by taking one of the images as the master image and then forming several pairs of interferometric images. PS-InSAR enhances measurement reliability by selecting only those target points within the study area that exhibit stable scattering characteristics and high coherence, known as permanent scatterers (PSs). This approach involves discarding pixel cells with significant coherence loss and isolating the phase components related to terrain, atmospheric, and non-deformation influences at each point, thereby yielding surface deformation information with improved accuracy [24]. Typically, PS points are strong scatterers such as man-made structures, bare rocks, and roads within a pixel cell, maintaining high coherence over extended periods. This attribute enables the PS-InSAR technique to effectively mitigate issues related to spatial–temporal incoherence and atmospheric delays, thereby enhancing the precision of surface deformation monitoring.
In this study, the PS-InSAR method was applied to 45 SAR images covering the Xiaojiang River Basin to ascertain the annual average deformation velocity in the line of sight (LOS) direction of the study area, as depicted in Figure 2b. Furthermore, time-series deformation variables from March 2018 to November 2021 were acquired for all identified PS points. These points were predominantly located on man-made structures and bare ground. The obtained average annual deformation velocities will be employed to identify potential landslide zones within the study area, and the time-series deformation data will facilitate an in-depth analysis of the surface deformation processes in these areas.
3.2.3. SBAS-InSAR Method
The small baseline subset InSAR (SBAS-InSAR) technique, proposed by Berardino and Lanari in 2002, has undergone continuous development and optimization [25]. SBAS-InSAR operates on the principle of utilizing short spatio-temporal baselines, which facilitates the creation of multiple differential interferometric pairs from a limited number of original image datasets, thereby enhancing spatial and temporal coherence. This technique initially generates a sequence of interferograms from multi-master images, aligned according to the principle of short spatio-temporal baselines. Subsequently, it applies spatial filtering to the differential interferometric phases. High-coherence ground target points, termed slowly decorrelating filtered phase pixels (SDFPs), are identified based on average spatial coherence. Observation equations are established for these SDFP points, followed by 3D phase unwrapping and singular value decomposition to resolve the phase sequence of the single primary image. Finally, spatio-temporal filtering is employed to estimate and correct atmospheric delay phases, thus obtaining refined terrain elevation error data and time-series deformation information [26].
The SBAS-InSAR method was applied to process SAR images of the Xiaojiang Basin, capturing the annual average deformation velocity and time-series deformation variables in the LOS direction from March 2018 to November 2021, as shown in Figure 2c. The coherent points identified through this method were uniformly distributed across the study area. These deformation results were utilized to identify potential landslide zones within the study area and to analyze the landslide time-series deformation process.
4. Landslide Identification and Analysis
4.1. Surface Deformation Monitoring Results
In this study, the deformation results obtained from the three InSAR methods represent the deformation along the radar line of sight (LOS) direction. A positive deformation value indicates the movement of the surface feature towards the satellite, while a negative value signifies movement away from the satellite.
- (1)
- Results of surface deformation monitoring by D-InSAR method
In this analysis, the output coherence threshold was set at 0.5 to ensure adequate pixel density. Consequently, 5,998,480 highly coherent target points were identified, resulting in an average density of 1954 points/km2 within the study area. The D-InSAR method provided results on cumulative surface deformation along the LOS from October 2020 to October 2021. The range of deformation varied from −116.77 mm to 86.54 mm, with a mean deformation of −6 mm and a standard deviation of 24.
- (2)
- Results of surface deformation monitoring by PS-InSAR method
Under conditions that maintained the density of output pixels with an output coherence threshold set at 0.7, the PS-InSAR monitoring in the study area identified a total of 516,152 high-coherence target points. The average density of these target points was 168 points/km2. The annual average deformation velocity in the LOS direction for the basin ranged from −24.60 to 24.40 mm/year, with a mean deformation velocity of −0.05 mm/year and a standard deviation of 4.44. Due to its sensitivity to man-made features, the PS-InSAR technique predominantly identified high-coherence points in residential areas characterized by a high density of structural elements and exposed rock bodies, which are compositionally similar to the materials used in building construction.
- (3)
- Results of surface deformation monitoring by SBAS-InSAR method
To ensure pixel density and result reliability, the output coherence threshold was set at 0.7, yielding 264,407 highly coherent target points. The average density of these target points in the study area was 86 points/km2. The annual average deformation velocity of the watershed along the LOS direction ranged from −25.36 mm/year to 22.58 mm/year, with an average value of 0.49 mm/year and a standard deviation of 4.15. The high-coherence points identified by the SBAS-InSAR technique were broadly distributed across the natural environment, resulting in a more uniform distribution of these points across the region.
This study compares the surface deformation results obtained from the same dataset covering the study area, processed using two different data processing methods: PS-InSAR and SBAS-InSAR. The analysis as a time series of deformation reveals that the annual mean deformation rate of the study area, as measured by PS-InSAR, ranges from −24.60 mm/year to 24.40 mm/year, while that measured by SBAS-InSAR ranges from −25.36 mm/year to 22.58 mm/year. Both methods exhibit similar ranges and standard deviations in the annual mean deformation rates of the long time series InSAR results, indicating consistency between the two time series InSAR monitoring outcomes.
4.2. Landslide Identification
According to previous studies, the standard deviation of surface deformation rates at regional coherent points is commonly used as a threshold to assess slope stability and identify potential landslides [27,28,29,30,31,32]. Given the variations in rock properties, surface morphology, ground cover, and data accuracy across different slopes [33], this study integrates surface deformation monitoring results, high-resolution optical remote sensing imagery, and field investigations. We adopted a standard deviation of the deformation rates from PS-InSAR and SBAS-InSAR monitoring results as the relative stability threshold, setting it at −10 mm/year to 10 mm/year. Within this range, the area is considered stable. Further analysis, combining field surveys and existing studies, indicates that surface deformation rates exceeding ±10 mm/year are associated with the appearance of tension cracks. Rates exceeding ±20 mm/year are linked to ground collapses, slope skid marks, and visible damage to the surface. Based on these observations and two time-series InSAR monitoring results, D-InSAR monitoring adopts twice the standard deviation as the stability threshold. The areas where the cumulative surface deformation variables fall within the range of −54 mm to 42 mm are deemed stable, while those outside this range are considered unstable. Potential landslide identification is a two-step process in which the initial location and extent of potential landslides were determined based on surface deformation rate changes, and then the precise potential landslide boundaries were determined in conjunction with changes in the rate of surface deformation, changes in the color characteristics of optical imagery and changes in topography.
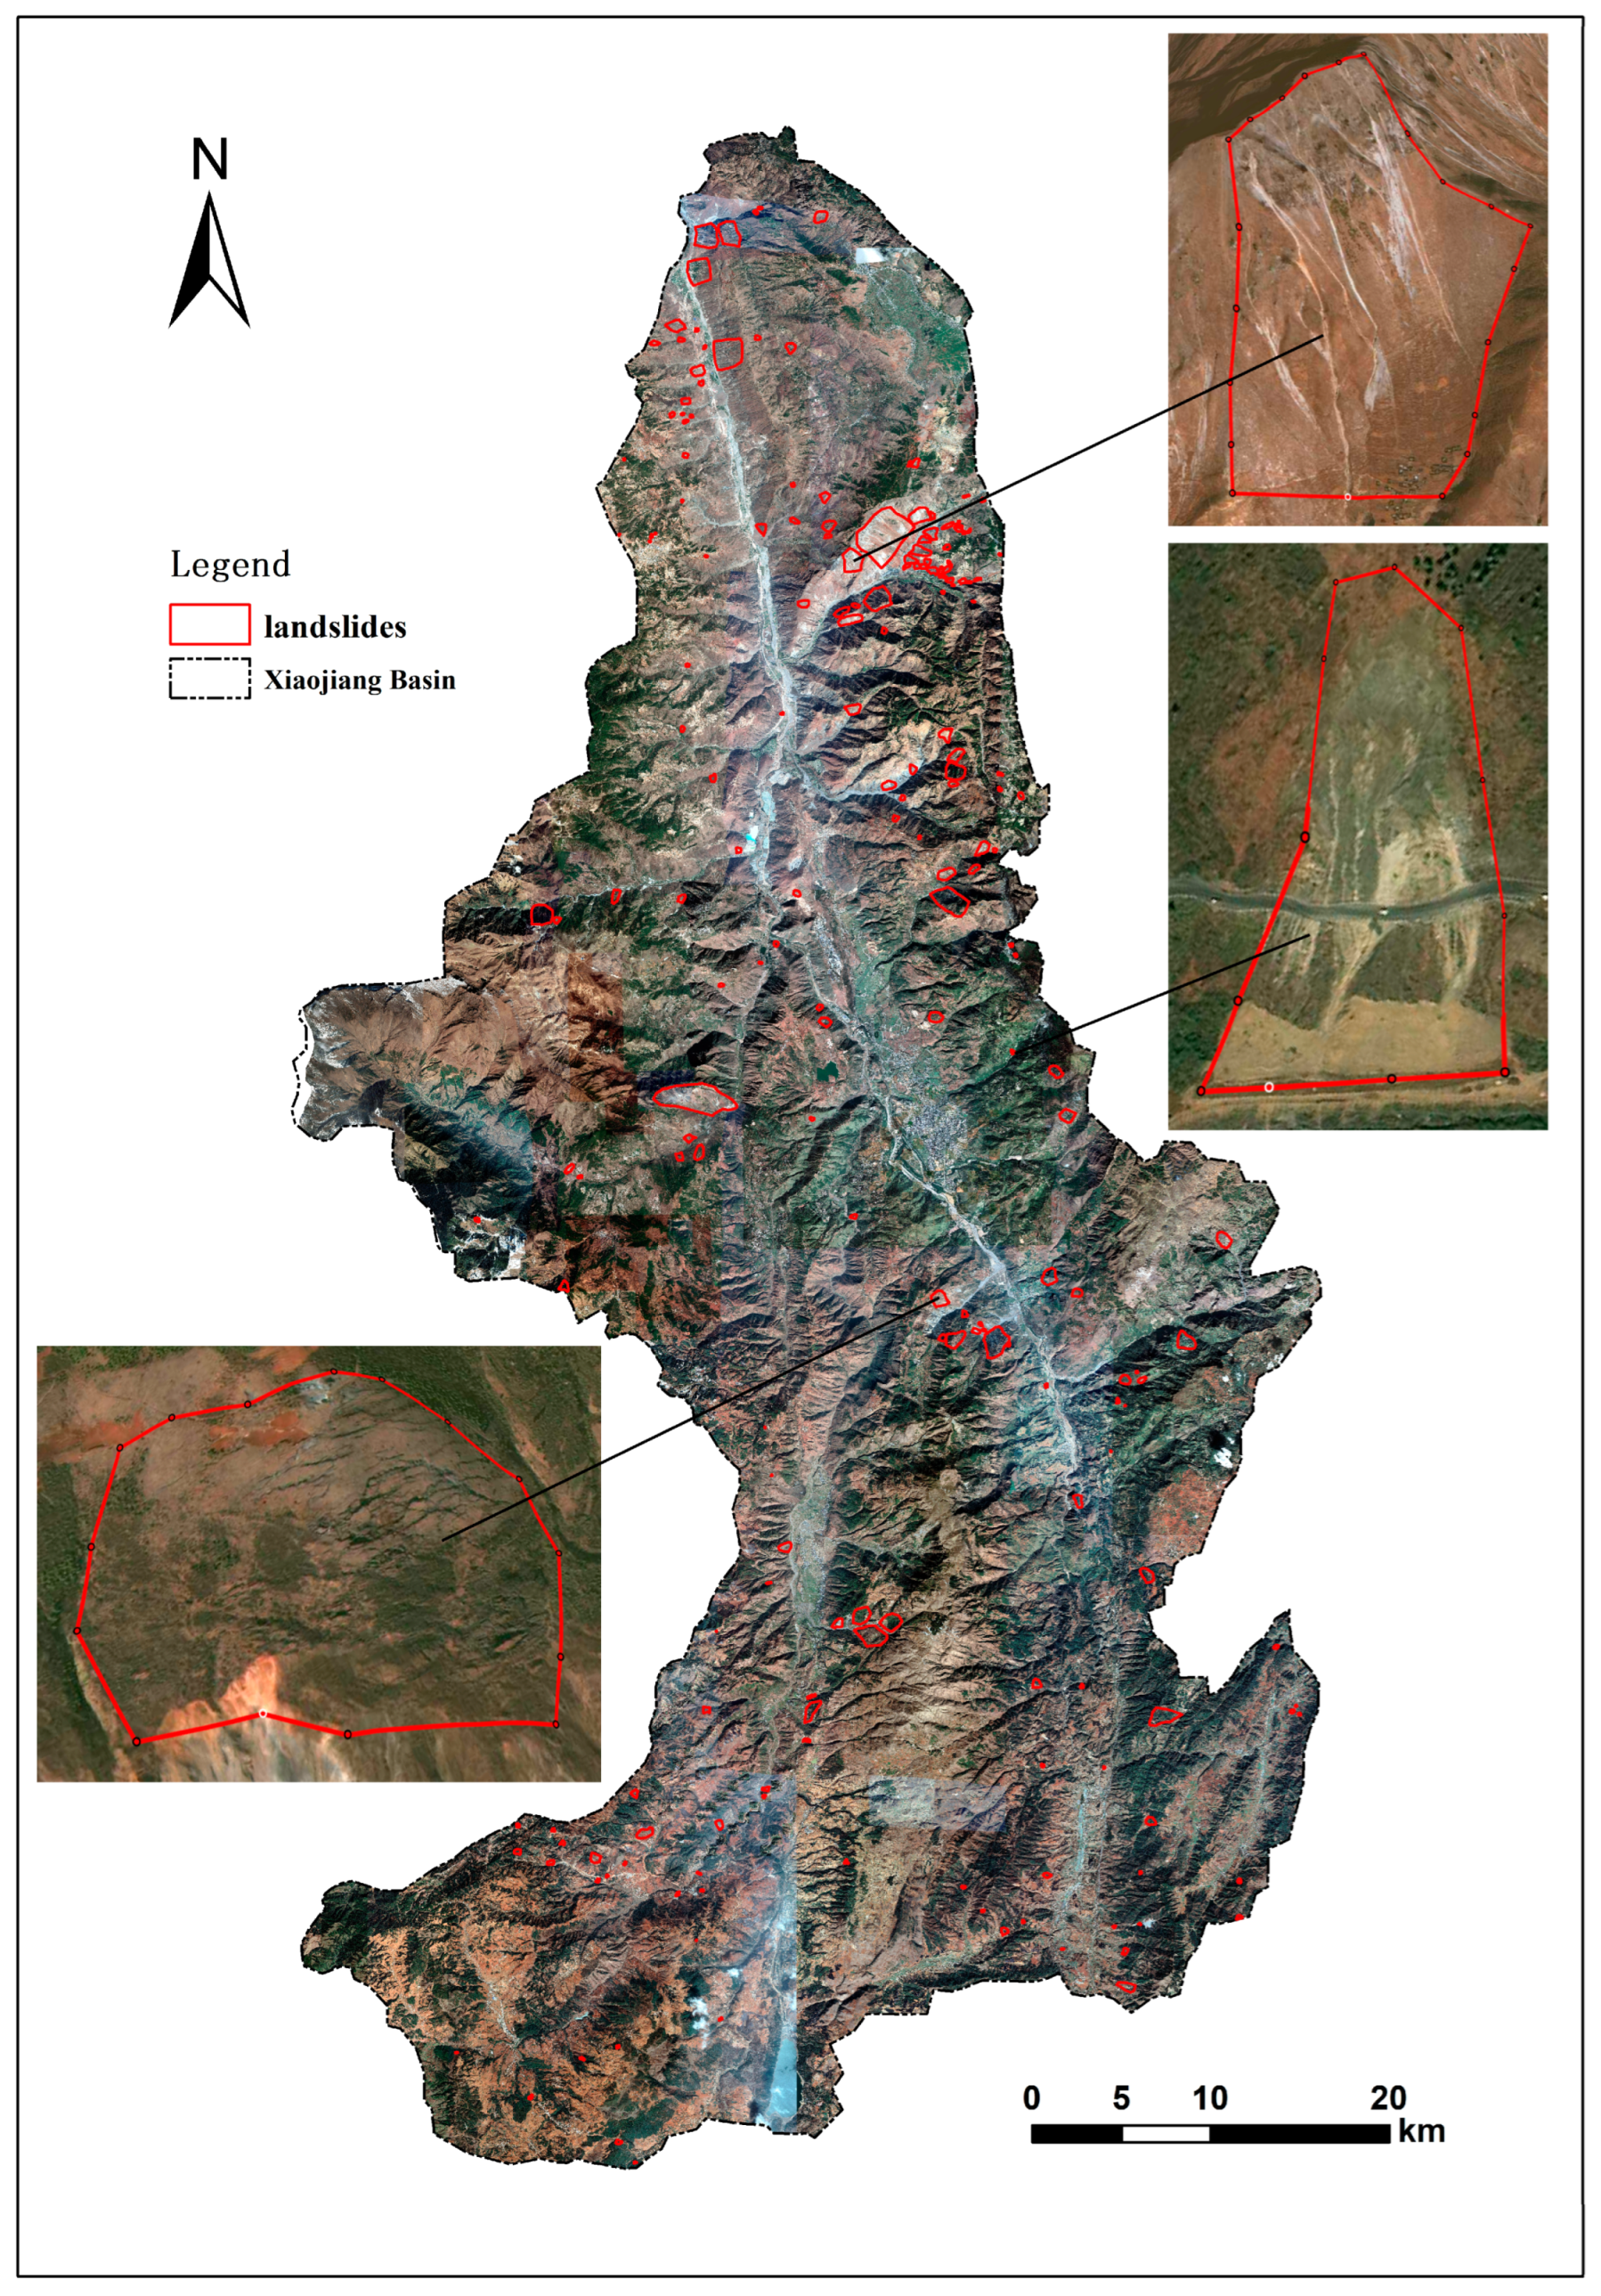
Based on the results of InSAR surface deformation monitoring, supplemented by observations from the optical remote sensing images and field investigations in the study area, a total of 212 potential landslide hazard areas were identified in the Xiaojiang Basin, as depicted in Figure 3. In the identified potential landslide areas, remote sensing images were used for validation. The results showed that these pinpointed slopes exhibited distinct landslide features in the images, characterized by slide marks, rock debris, or tensile cracks (as shown in Figure 3). This suggests that the landslide inventory derived from this study has commendable reliability.
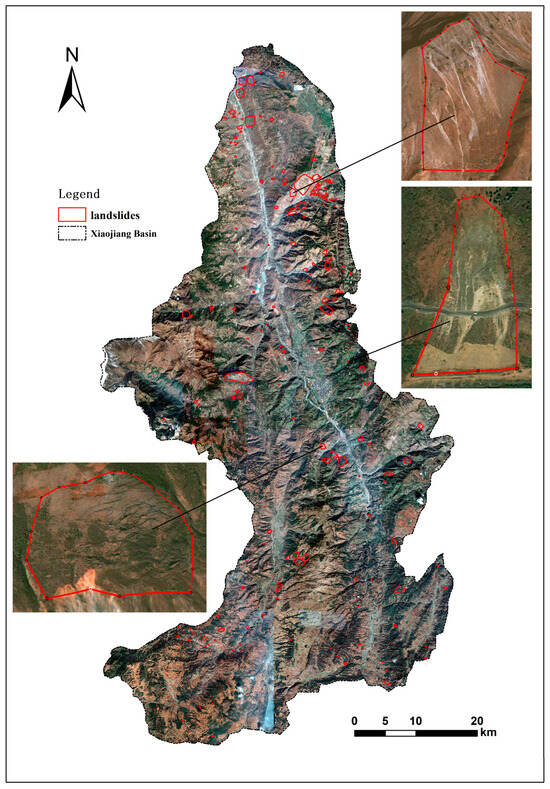
Figure 3.
Spatial distribution of landslides in the Xiaojiang Basin.
4.3. Analysis of Typical Landslide Deformation
The Caizishan landslide, positioned at 25°58′20″ N, 103°12′50″ E, spans approximately 2 km east–west and 1.5 km north–south with an elevation difference of 700 m and a slope gradient of 45°, representing a typical landslide in the region prone to mudslides. Landslides and debris flows in this area predominantly occur during the rainy season due to concentrated heavy rainfall, which leads to visible ground surface cracks that trigger these events. Conversely, the dry season is marked by negligible rainfall, with infrequent landslide occurrences. Figure 4a illustrates the surface deformation monitoring results from D-InSAR, indicating a maximum deformation rate of −39.61 mm. Figure 4b presents the annual average deformation velocity monitored by PS-InSAR, showing a maximum of −24.59 mm/year, while Figure 4c, using SBAS-InSAR, documents a similar deformation velocity of −24.71 mm/year. All three InSAR methods confirm significant surface deformation in the landslide area.
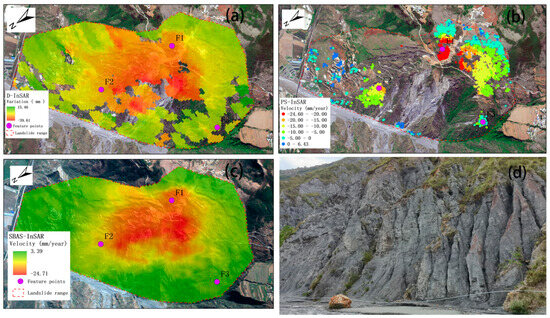
Figure 4.
Map of the Caizishan landslide deformation monitoring and field investigation. (a) SBAS-InSAR results; (b) PS-InSAR results; (c) D-InSAR results; (d) field survey.
Three feature points (F1, F2, and F3) were selected within the landslide area, situated in the upper, middle, and lower parts of the landslide, respectively. The analysis of surface time-series deformation data from PS-InSAR and SBAS-InSAR between March 2018 and November 2021 (as shown in Figure 5) reveals that these feature points exhibit consistent trends in deformation across both time series, corroborating the reliability of the monitoring results. Specifically, F1, located in the upper section, displays a significant and ongoing downward trend with annual average deformation velocities of −20.70 mm/year (SBAS-InSAR) and −24.51 mm/year (PS-InSAR), and a cumulative deformation of −24.02 mm (D-InSAR). Notably, the rate of decline during the rainy season (May to October) is considerably higher than in the dry season, with the peak decline occurring from June to September, which coincides with the heaviest rainfall, suggesting that rainfall may accelerate landslides in the upper region. F2, in the middle section, also shows continuous sliding, with annual average deformation velocities of −15.30 mm/year (SBAS-InSAR) and −14.75 mm/year (PS-InSAR), and a cumulative deformation of −19.66 mm (D-InSAR). Here, the decline rate during the rainy seasons of 2018 and 2019 was greater than in the dry season, indicating ongoing subsidence influenced by rainfall. F3, positioned in the lower section, exhibits minor changes, with annual average deformation velocities of −2.15 mm/year (SBAS-InSAR) and −3.23 mm/year (PS-InSAR), and a cumulative deformation of −19.0 mm (D-InSAR). The similar deformation rates between rainy and dry seasons suggest that rainfall has minimal impact on the lower region’s stability.
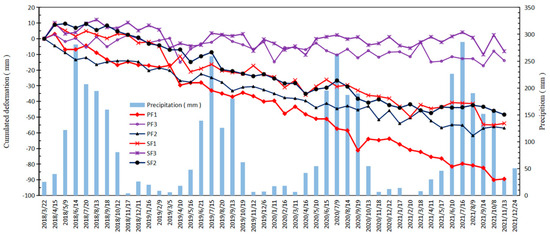
Figure 5.
Figure of cumulative deformation of feature points with rainfall. PF1, PF2, and PF3 are the deformation results of points F1, F2, and F3 processed by PS-InSAR technique, respectively. SF1, SF2, and SF3 are the deformation results of points F1, F2, and F3 processed by SBAS-InSAR technique, respectively.
The observations from optical remote sensing images clearly indicate the presence of tension cracks and landslide traces in the area. This observation, coupled with the field investigations shown in Figure 4d, reveals that the middle and upper rock bodies are weathered and detached, influenced by geological tectonic movements and rainfall. These sections have also experienced collapses, leading to distinct erosion gullies in the lower part of the area, where the slope surface is gradually sliding. The consistency between the results of optical remote sensing image observations and field investigations with those obtained through InSAR technology further confirms the reliability of the InSAR monitoring results.
5. Discussion and Analysis of Landslide Development Characteristics
5.1. Kernel Density Analysis of the Landslide Spatial Distribution
In order to analyze the spatial aggregation characteristics of potential landslides within the Xiaojiang Basin, and to provide a reference for the subsequent determination of key monitoring areas for geological hazards and sustainable prevention and control. In kernel density analysis, a smooth surface covers each element, the value of the surface decreases as the distance from the element increases, and the final density estimate is obtained by calculating the density of the elements around each output raster image element and superimposing the values of all kernel surfaces. Since kernel density analysis is a spatial data analysis method, it is mainly used to analyze the density distribution of elements in a specific region. Therefore, the kernel density analysis method was chosen to obtain the spatial aggregation characteristics of potential landslides in Xiaojiang Basin in this study. Kernel density effectively quantifies the spatial aggregation of landslides; a higher kernel density indicates a more concentrated distribution of landslides. The areas with high kernel density values may be potential landslide-prone areas, which can be used as an important reference for the subsequent determination of key monitoring areas for geological hazards, as well as a more effective guide to the monitoring and prevention of hazards on a specific regional scale from the perspective of spatial analysis.
Using ArcGIS software (version: 10.7.10450), a landslide distribution kernel density map was created (Figure 6) with a pixel size of 10 m and a density analysis area measured in km2. One high-density aggregation area for landslides is located in the northeastern part of the basin, featuring a kernel density value exceeding 0.3. This area, found in the lower part of the Xiaojiang basin around Xiaojiangkou-Jianshangou, predominantly consists of bare land and grassland. Additionally, three medium-density aggregation areas with kernel density values ranging from 0.1 to 0.2 are situated in Jiangjiagou in the lower reaches, Dabainigou in the middle reaches, and Longtan Valley in the upper reaches of the basin, where the surface cover is primarily bare land, grassland, and dryland. Debris flows and landslides occur more frequently in all four kernel-density aggregated areas. The density map also reveals that the upper and middle western parts of the basin experience fewer landslides, exhibit lower kernel density values, and have surface cover dominated by forest and dryland. In the Xiaojiang basin, regions with high landslide density are primarily concentrated on the bare land and grassland flanking the debris gullies in the lower basin, while areas of low density are predominantly in the forested and dryland regions of the upper and middle basin. This pattern suggests that areas with naturally bare surfaces are more susceptible to landslide development.
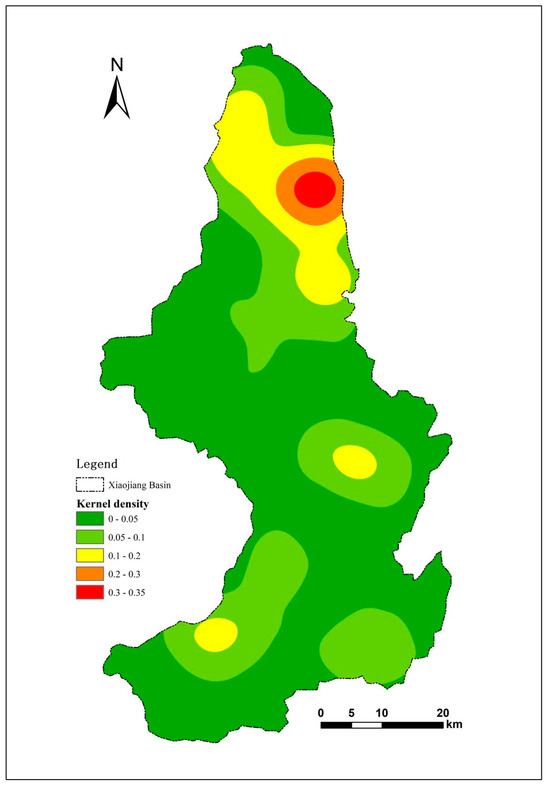
Figure 6.
Kernel density map of landslides in the Xiaojiang Basin.
5.2. Terrain Features of Landslide Distribution
Slope, relative elevation difference, and slope direction are fundamental attributes of terrain morphology that significantly influence surface cover and slope stability. Using DEM data, slope and aspect maps for the study area were generated. Subsequent statistical analysis provided the average slope, relative height difference, and average aspect for the 212 landslide hazards identified within the study area, enabling further analysis of their developmental characteristics and spatial distribution.
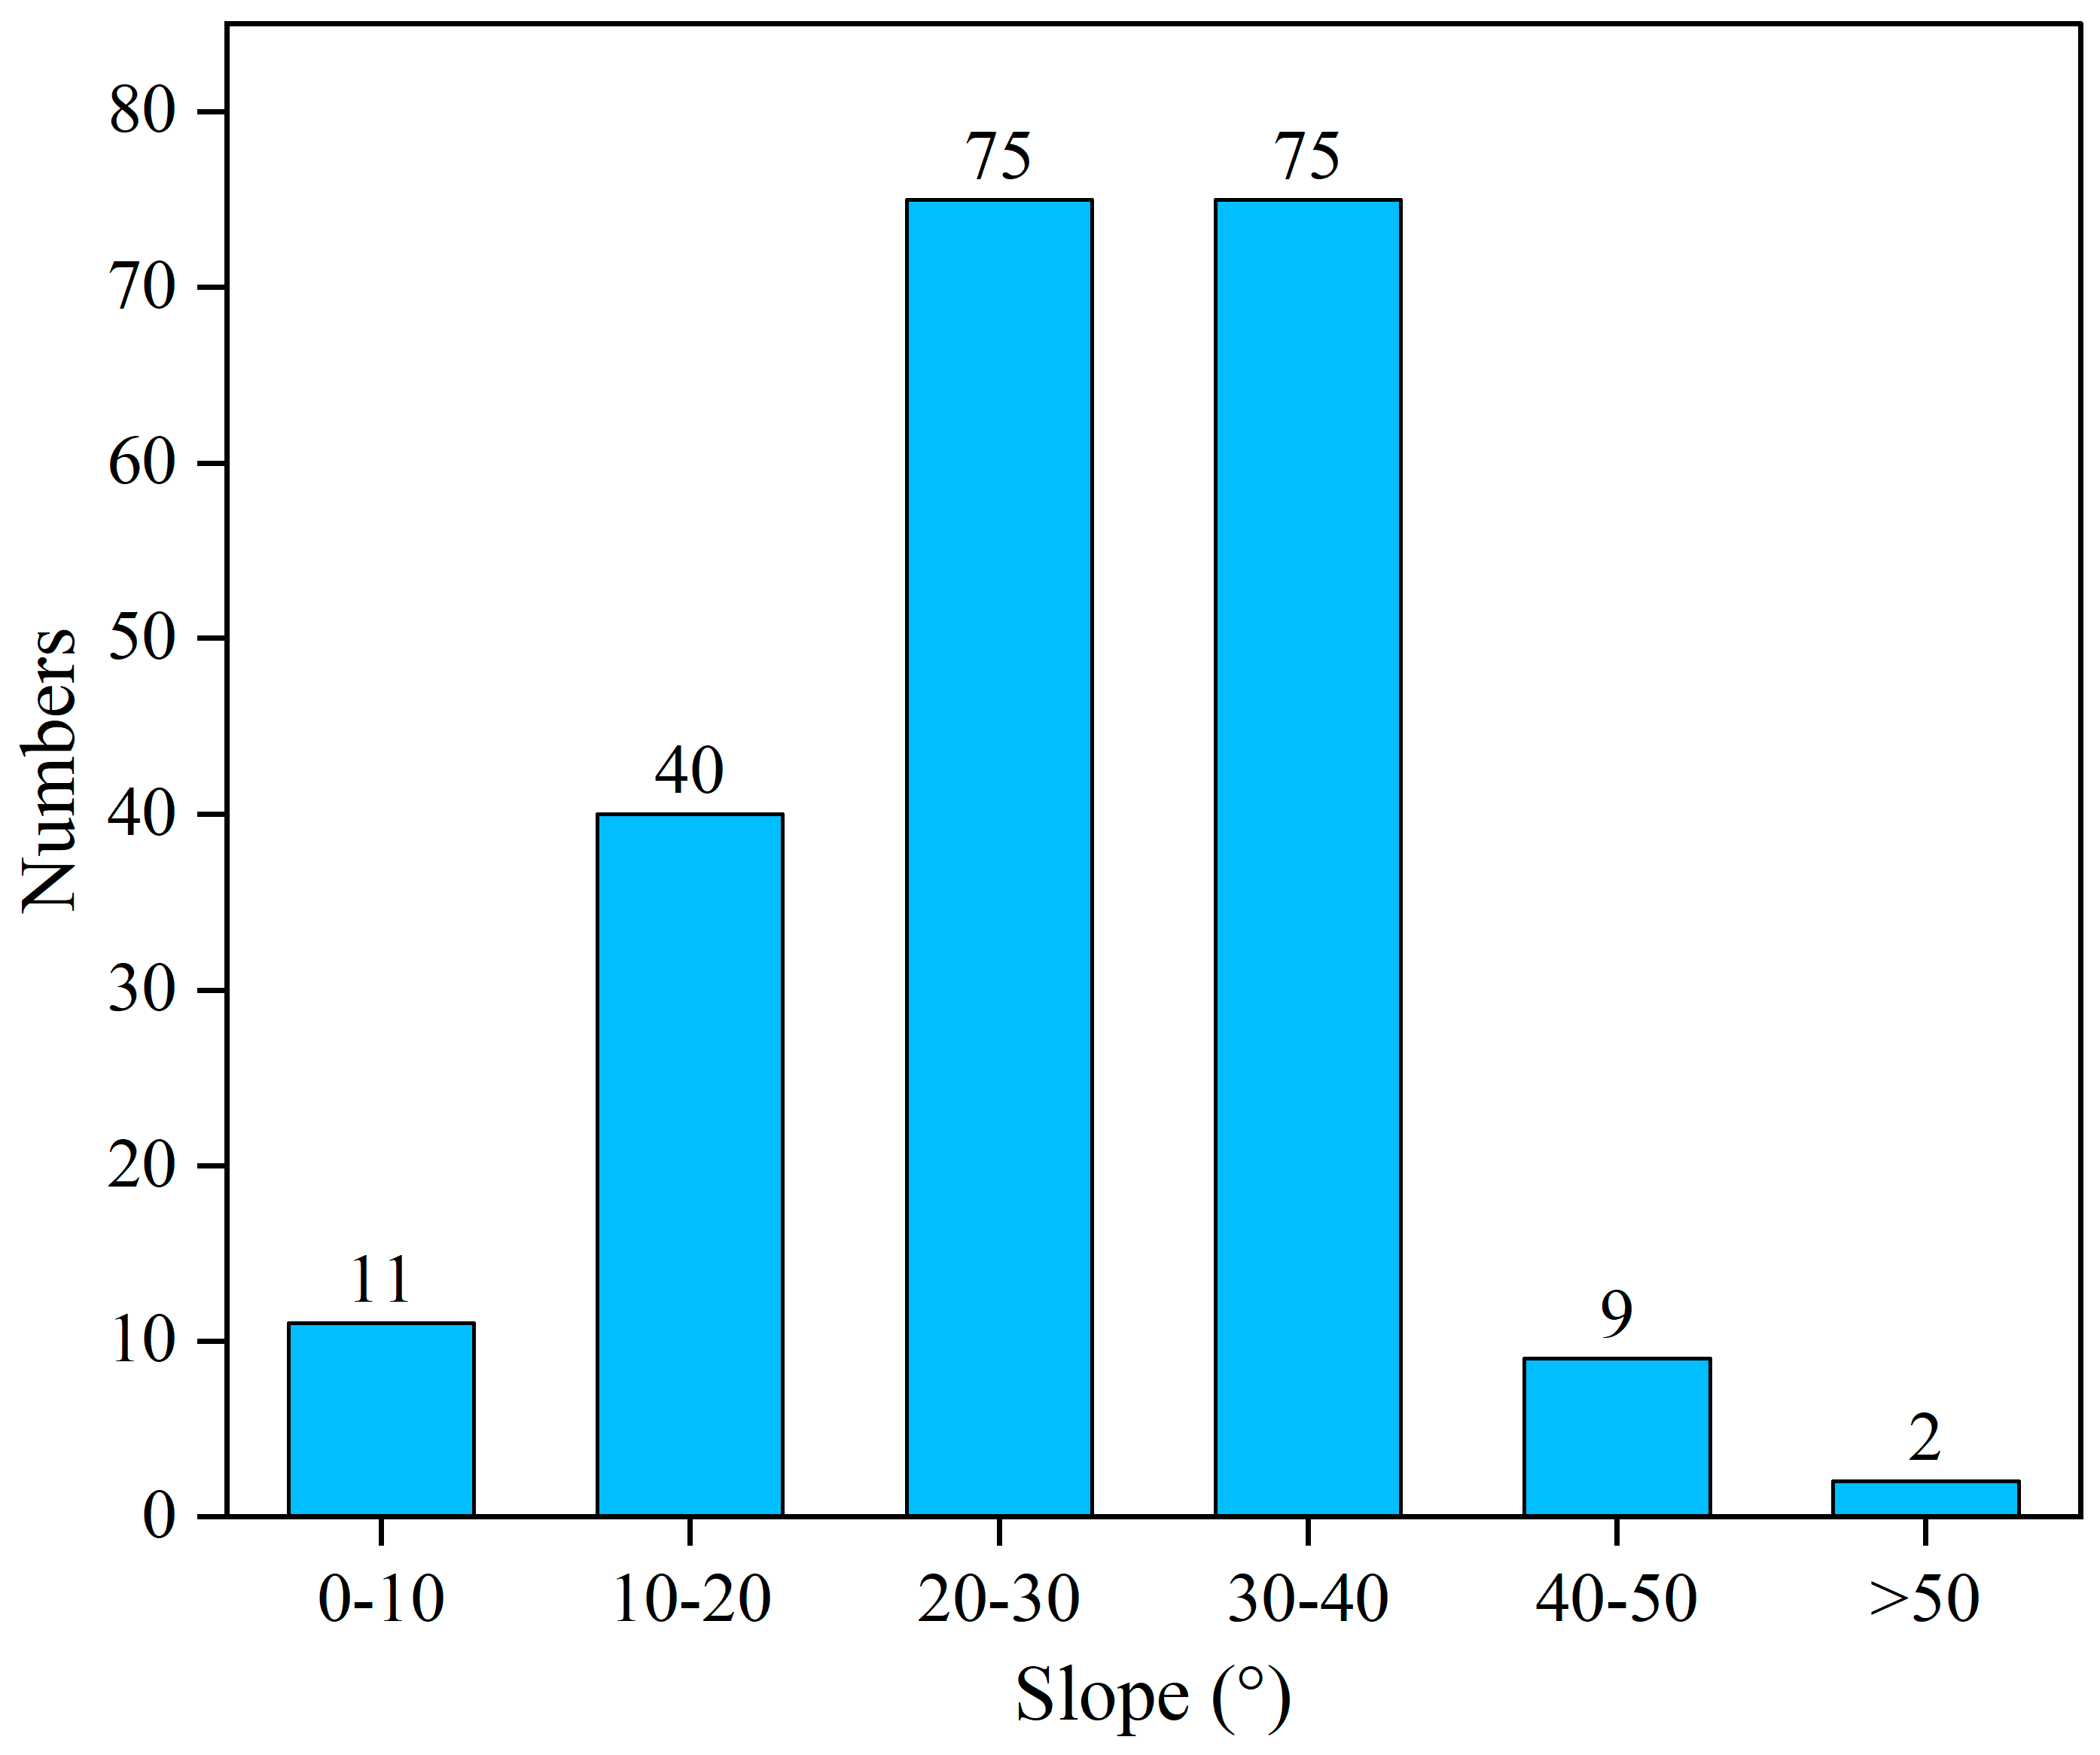
Slope impacts several critical factors on slopes including surface soil moisture content, the thickness of pile cover, vegetation cover degree, and the intensity of rainwater erosion, all of which play pivotal roles in landslide development and slope stability. The statistical results, as illustrated in Figure 7, reveal that the landslides in the Xiaojiang Basin are distributed across various slope grades but are predominantly concentrated in the slope range of 20° to 40°. This range comprises 70.75% of the total number of observed landslides, indicating that this slope range is particularly conducive to the transition from gravitational potential energy to dynamic potential energy, fostering landslide formation.

Figure 7.
Statistical distribution of landslides in slope.
The relative height difference significantly impacts the stability of slopes and determines the potential energy and disaster risk of landslides. Statistical analysis indicates that the relative height differences within landslide-prone slope units in the basin primarily range from 0 to 300 m, accounting for 79.2% of the total (Figure 8). Specifically, the 0–100 m interval contains the highest concentration of landslides, representing 37.3% of the cases. Additionally, approximately 10% of landslides occur in each of the subsequent 50 m intervals up to 300 m. This distribution suggests that these height differences provide favorable conditions for slope sliding. Moreover, the maximum relative height difference in slope units with potential landslides exceeds 1000 m, where the predominant processes include localized weathering collapses of rock bodies and shallow surface avalanches and slides.
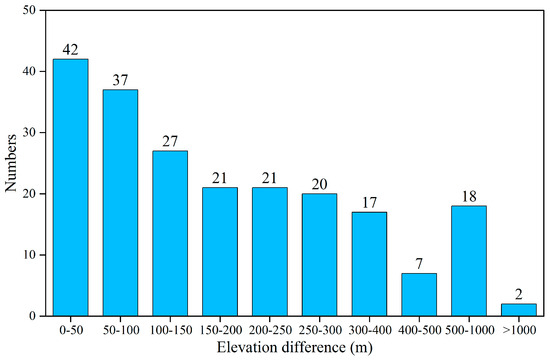
Figure 8.
Statistical distribution of landslides in elevation difference.
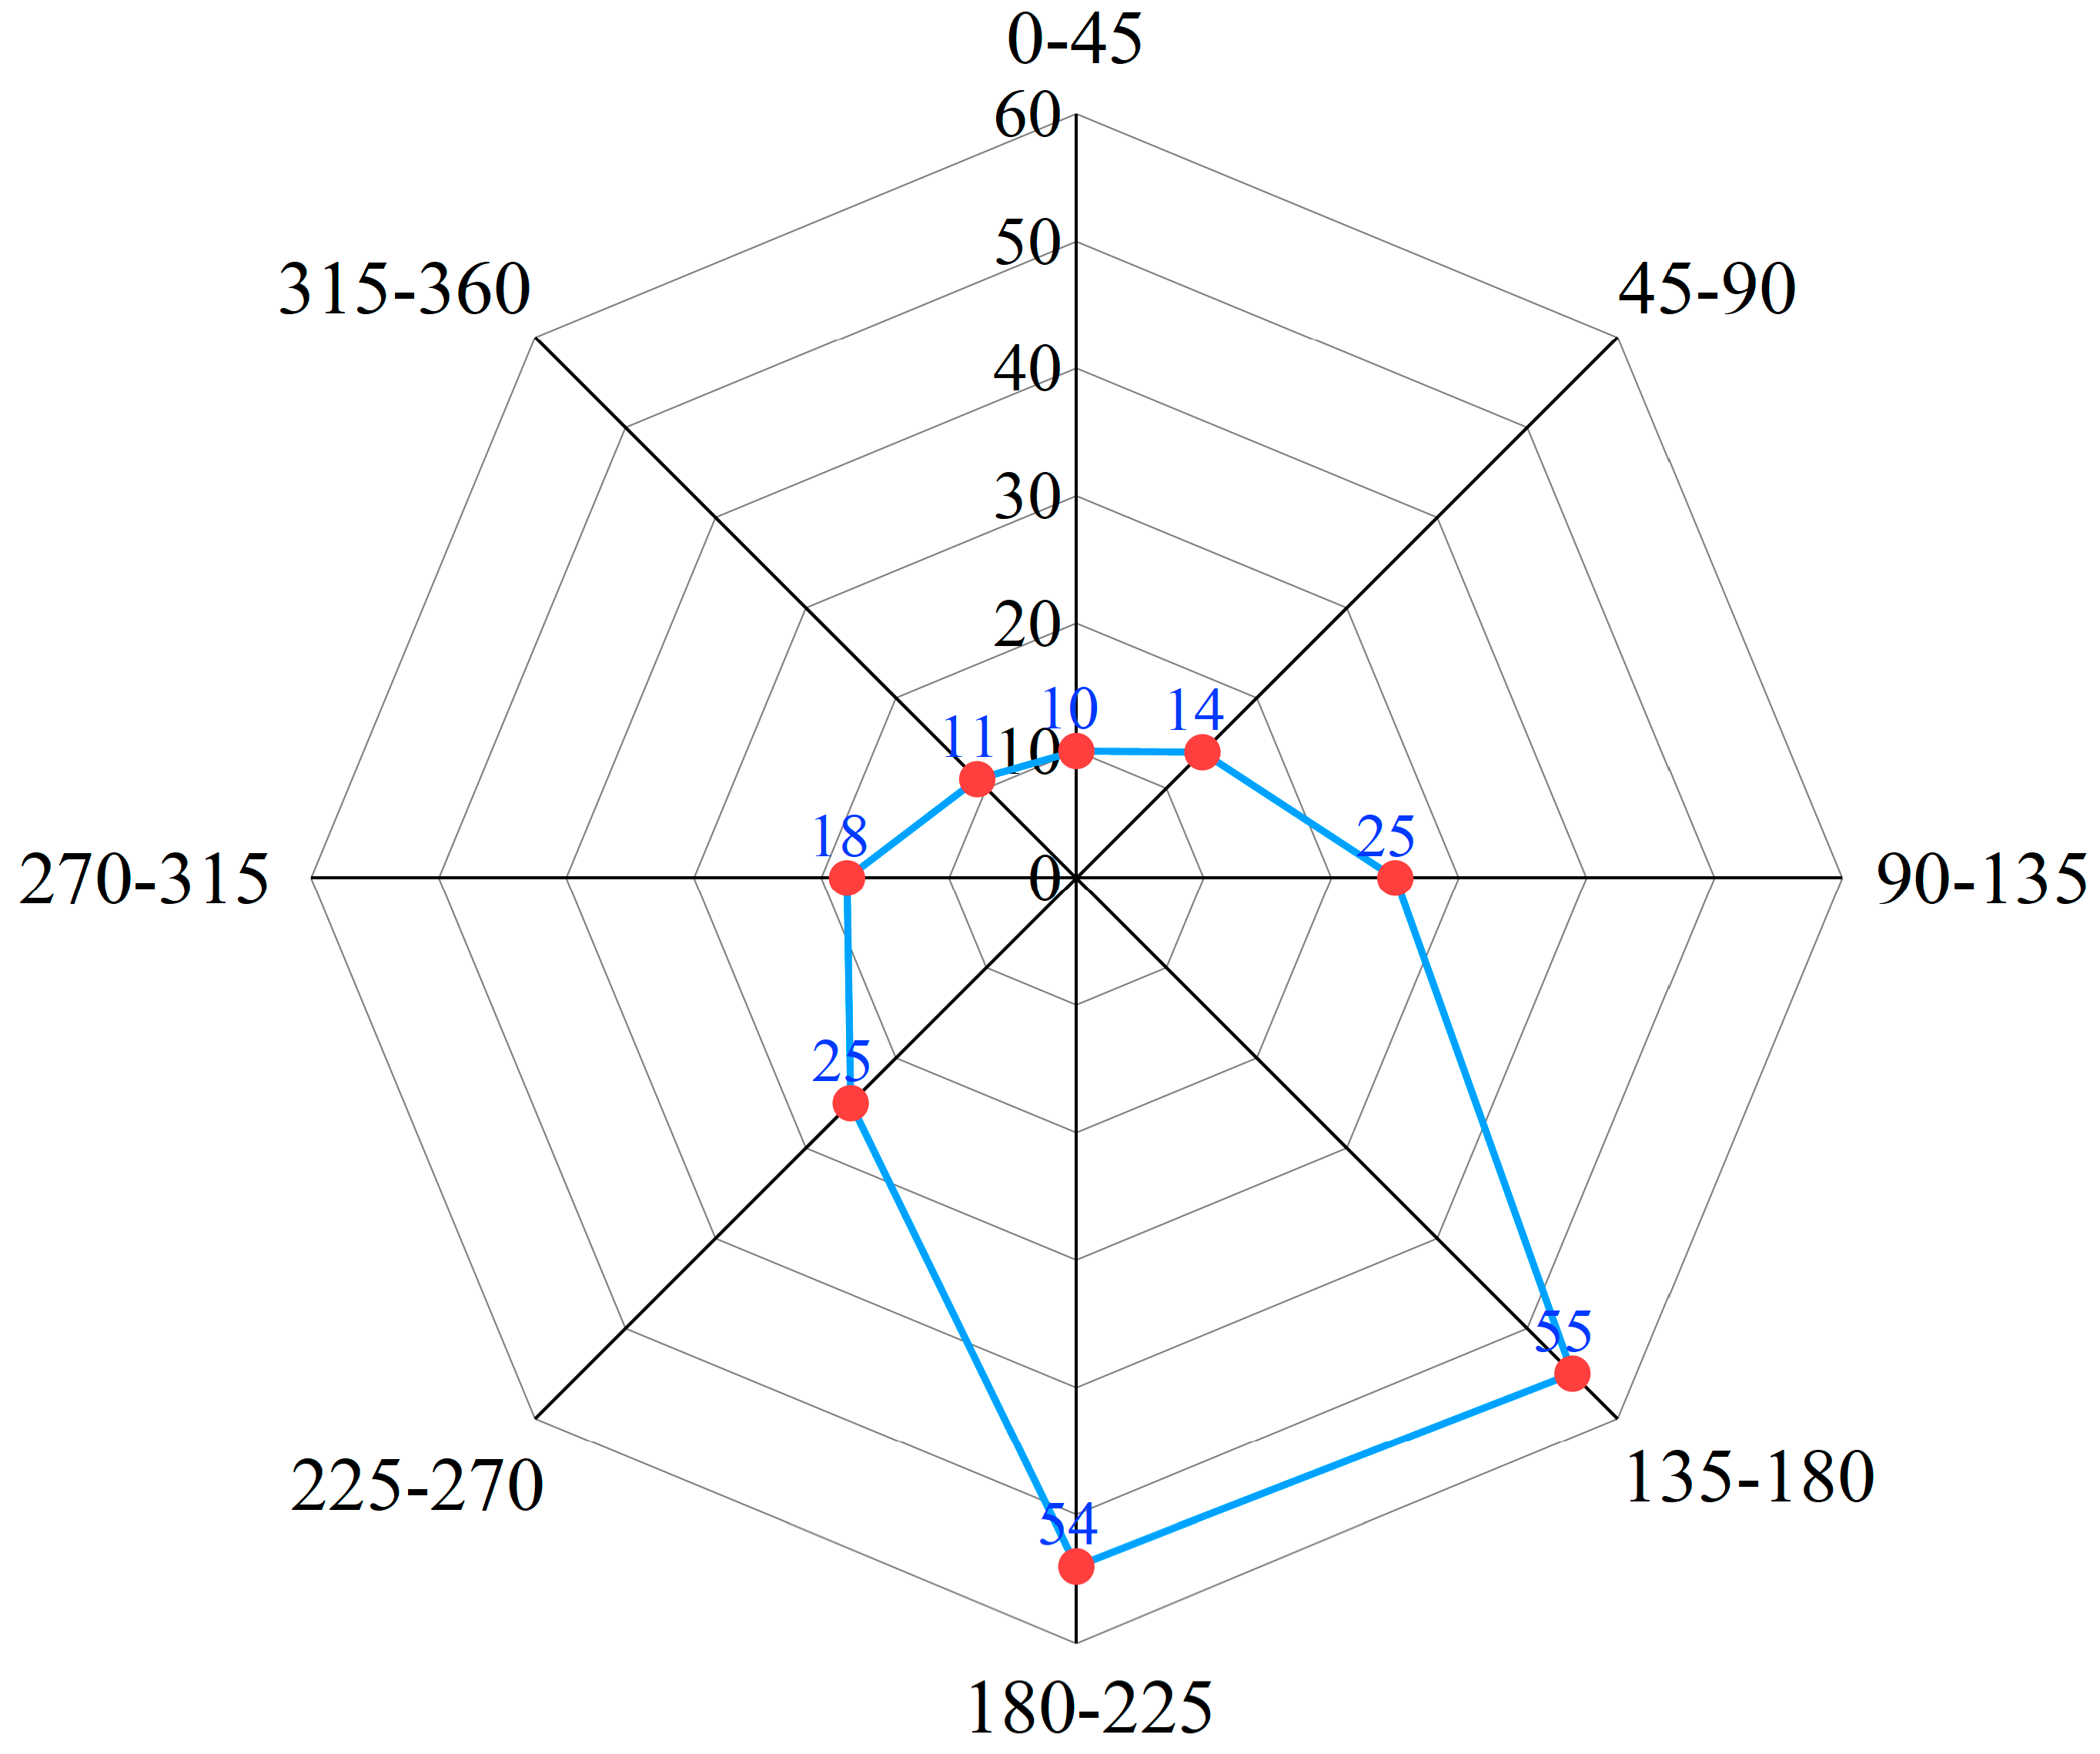
In mountainous regions, there are pronounced differences in sunlight exposure and rainfall across various aspects, which significantly affect the weathering of surface rock and soil, vegetation cover, and frequency of human activities. The distribution of landslides in the study area, as illustrated in Figure 9, primarily occurs in the southeast, south–south, and southwest directions, within the aspect range of 90° to 270°, and constitutes 75% of the total occurrences. The Xiaojiang Basin, featuring a sunny southern aspect, extends through the north and south with the Xiangshui River, Dabai River, and Xiaojiang River, presenting distinct contrasts between the yin (shaded) and yang (sunny) aspects. The yang aspects, as windward slopes exposed to more sunlight, receive significantly more rainfall and sunshine than the yin aspects, leading to more intense weathering and fragmentation of rock surfaces. Furthermore, the surveys reveal that human settlement and agricultural activities are predominantly situated on these yang aspects, resulting in less natural vegetation cover compared to the yin aspects. This disparity in vegetation cover and the consequent human impact compromise the slope stability on the sunny sides.

Figure 9.
Radar map of landslides in aspect.
5.3. Geological Characteristics of Landslide Distribution
The primary outcrop stratum in the Xiaojiang Basin is the Permian system, which extends throughout the basin. The upper segment of this system consists of Emeishan basalt interspersed with sandstone, siltstone, and mudstone, while the lower segment comprises muddy greywacke that includes dolomite, sandstone, and siltstone. In the middle and lower reaches of the basin, slate and kyanite predominate. Due to tectonic movements, these rocks exhibit limited resistance to weathering and are susceptible to forming weathered clastic rocks. In areas such as valley slopes and gully accumulation fans, the dominant materials are Quaternary sedimentary rocks and Cenozoic alluvial aggregates. These materials are structurally loose, rendering them easily weathered and eroded [20] (Figure 10).
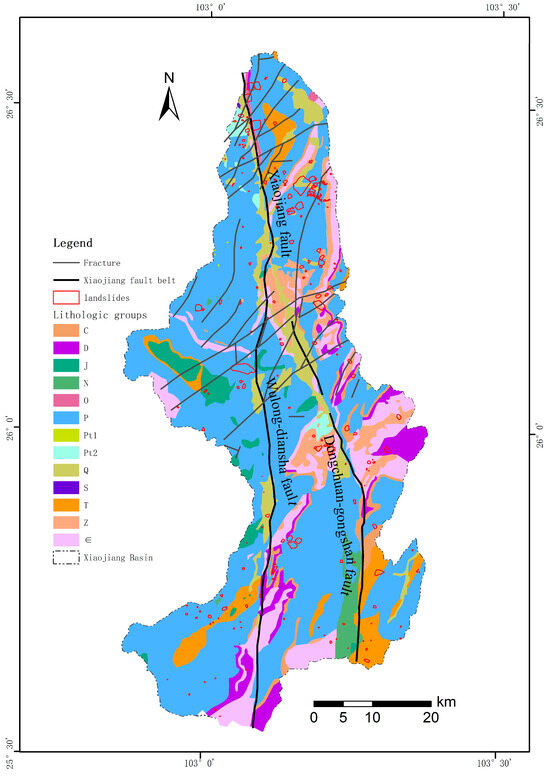
Figure 10.
Geological structure map and lithologic groups of Xiaojiang Basin.
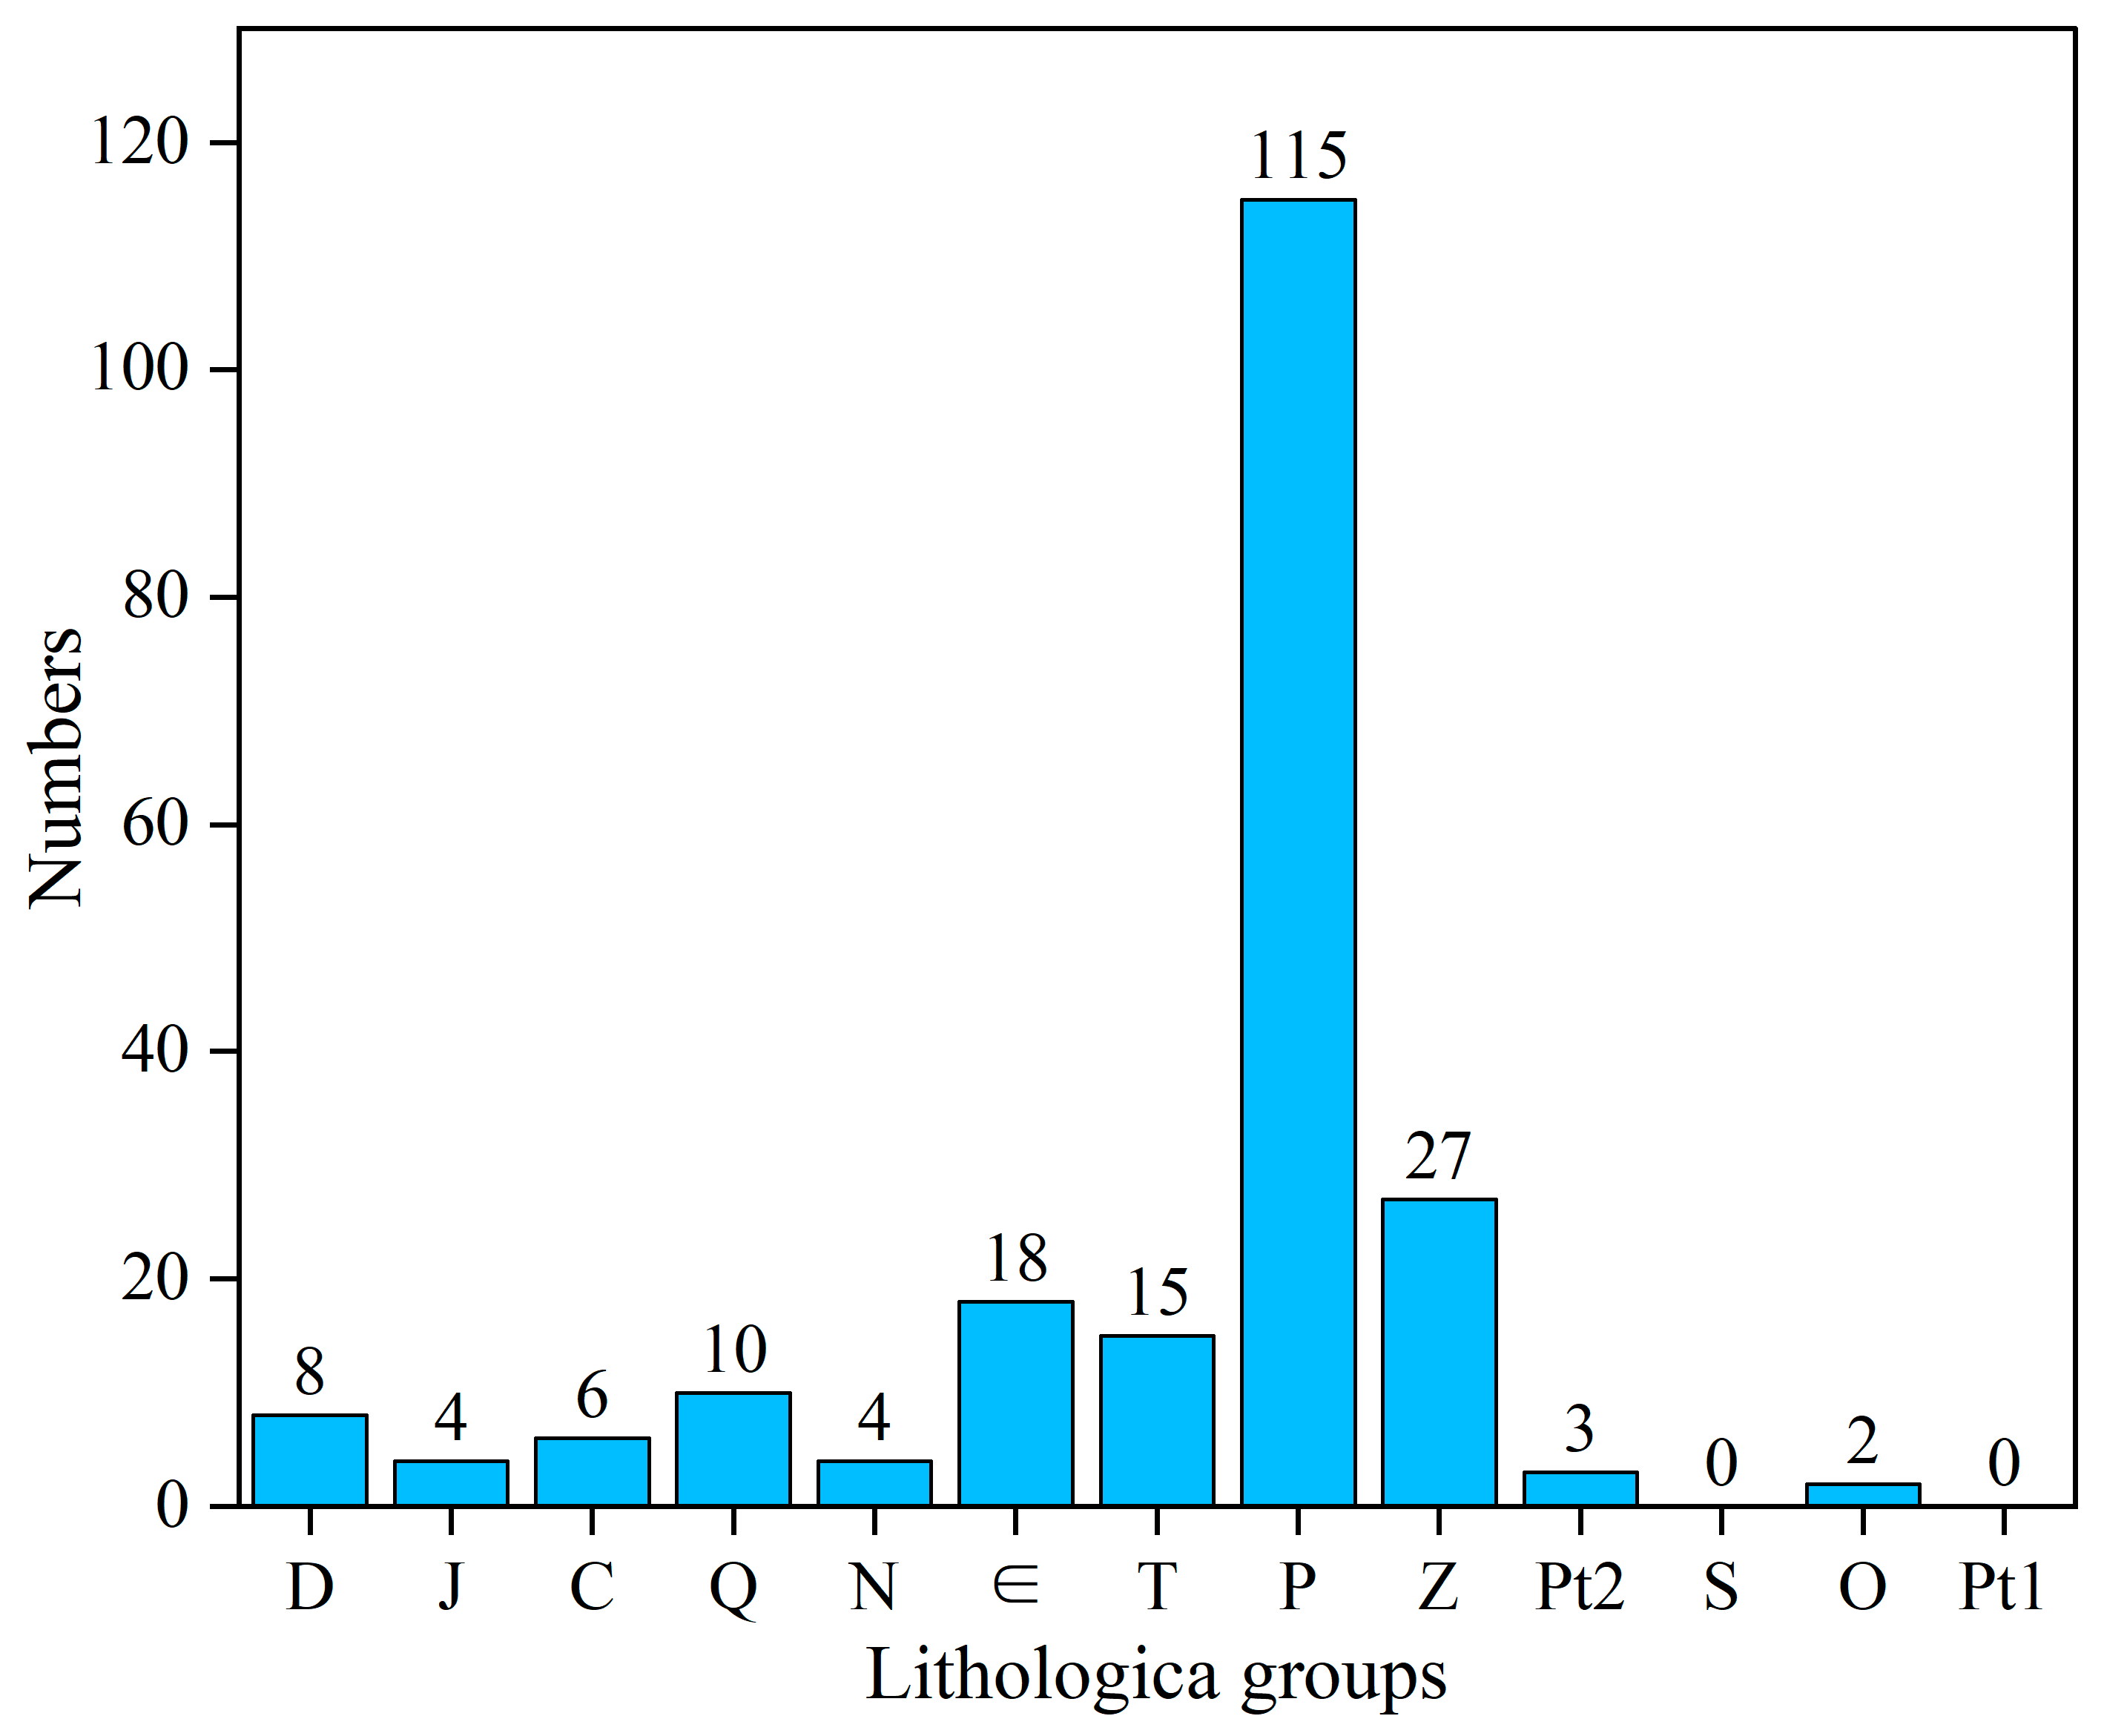
The statistical analysis of the landslide areas, when overlaid on the stratigraphic lithology map (Figure 11), reveals that landslides in the basin predominantly occur in the Permian sandstone, siltstone, mudstone, and muddy greywacke; Aurignacian slate, kilo magnetite, and sandstone; Cambrian muddy shale and slate shale; and Triassic sandstone and sandy shale. Collectively, these formations account for 82.5% of the total landslides in the basin. This pattern suggests that areas composed of sandstone, mudstone, and chamotte, which possess fragile geological textures and exhibit poor weathering resistance, are particularly susceptible to landslide disasters, often triggered by external factors such as rainfall and geological tectonic movements.
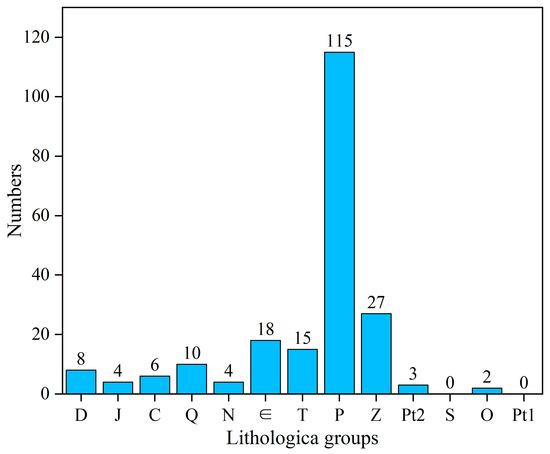
Figure 11.
Statistical distribution of landslides in lithology.
Lithologic Groups: “D” represents Devonian formations including dolomite, greywacke, sandstone, and shale. “J” denotes Jurassic sandstone and sandy shale interbeds. “C” refers to Carboniferous dolomite, sandstone, and associated interbeds. “Q” identifies Quaternary floodplain and lacustrine deposits such as sands, gravel, conglomerate, and clays. “N” indicates Tertiary mudstones. “∈” symbolizes Cambrian greywacke, sandstone, dolomite, mudstone, and related shale and slate shale interbeds. “T” signifies Triassic tuffs, dolomites, sandstones, and sandy shales. “P” stands for Permian sequences including basaltic interbedded tuffs, sandstones, siltstones, mudstones, muddy tuffs, and dolomites. “Z” represents Aurignacian dolomites, slates, and sandstones. “Pt2” corresponds to Middle Proterozoic dolomites, gneisses, slates, and similar formations. “S” designates Silurian greywacke, sandstone, gneiss, slate, and kyanite. “O” encompasses Ordovician dolomite, greywacke, and sandstone. Finally, “Pt1” pertains to Palaeoproterozoic slate interbedded with greywacke, dolomite, and slate [34].
The Xiaojiang fault zone is one of the world’s deepest and largest fault zones, oriented north–south, and plays a pivotal role in shaping the geological structure of the region. Along with the Dabai River and Wulong River fault zones, it forms the primary and secondary fault structures of the Xiaojiang River system. Prolonged stress has led to the formation of numerous secondary tensional fault zones, “X”-shaped shear lines, and torsional faults, both tensional and compressive, within the fault zone. Most faults in the basin are concentrated in the lower reaches of the Xiaojiang Basin. Statistical analysis reveals that 184 potential landslides, which represent 86.79% of the total, are located within 5 km of these fault zones or faults. This proximity underscores that the susceptibility of landslides in the basin is significantly influenced by geological structures such as fault zones and faults.
5.4. River Valleys Characteristics of Landslide Distribution
By creating buffer zones around the main rivers in the Xiaojiang Basin and overlaying the distribution of landslides (Figure 12), statistical analysis indicates that only 42 landslides are located more than 1 km from a river. Conversely, 80.2% of the landslides occur within areas adjacent to the river valleys, suggesting that landslides in the Xiaojiang Basin predominantly develop on both sides of these valleys. In areas of high mountain valleys, landslides on the flanks of river valleys frequently block river channels, creating weirs that significantly threaten the lives and properties of downstream residents. Consequently, landslides in the Xiaojiang Basin represent a substantial risk to the safety of human lives in the region.
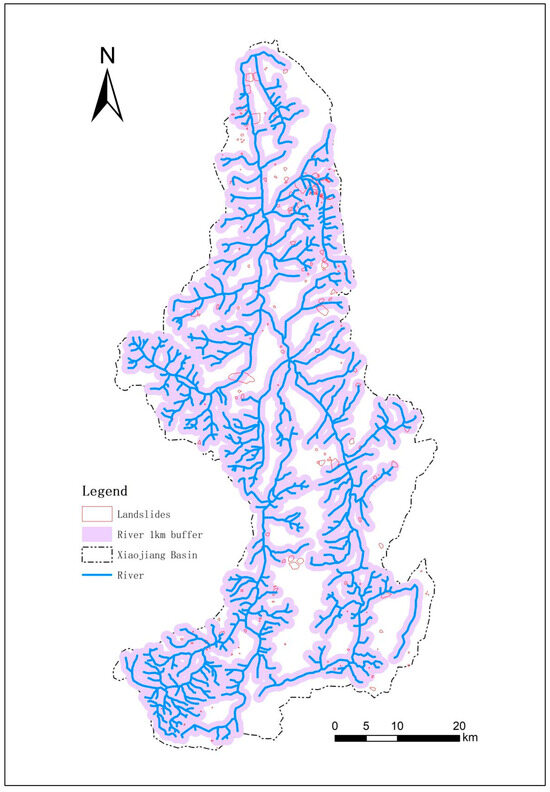
Figure 12.
River buffer map.
5.5. Land Use Characteristics of Landslide Distribution
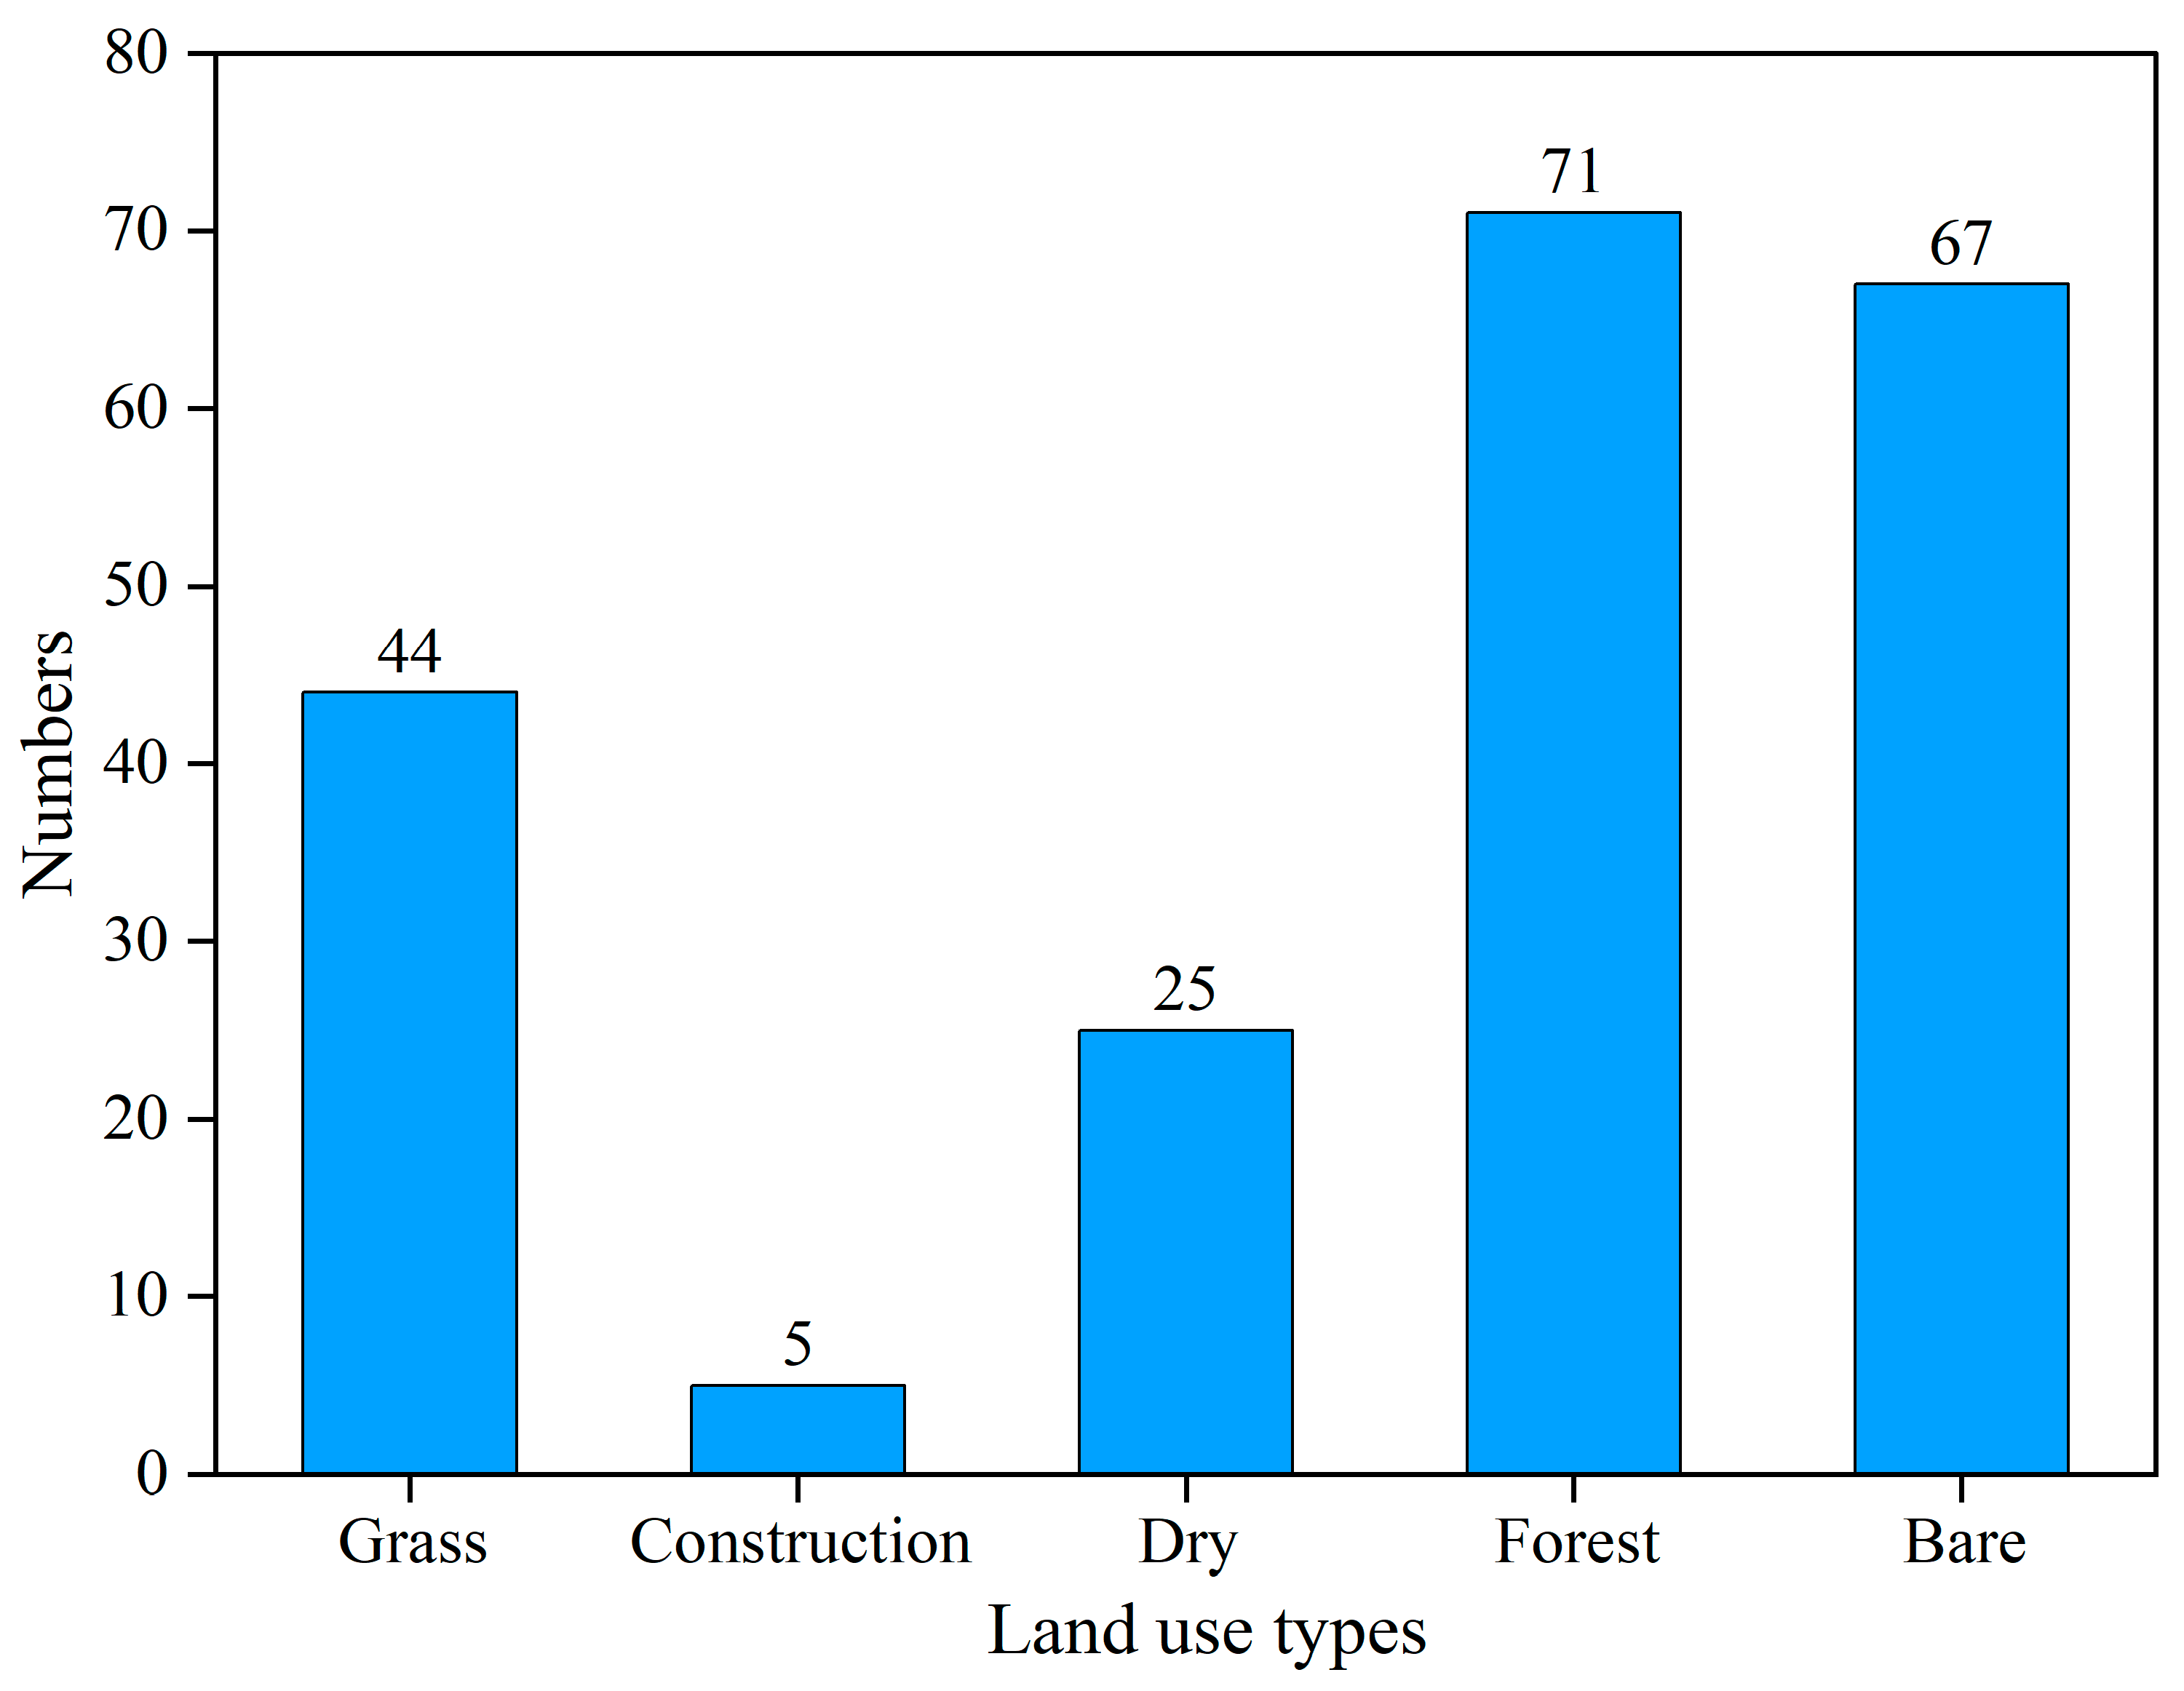
In the process of survival and development, human activities such as farming and construction have significantly altered the original morphology of slopes, impacting their stability. Land use serves as a direct indicator of human modification of the terrestrial surface, visually representing the human impact on the environment. In the Xiaojiang Basin, a survey of land use combined with the interpretation of high-resolution images provided detailed information on the land use types associated with landslide units. The land use categories within the basin where landslides are prevalent include grassland, construction land, dry land, forest land, and bare land. Statistical analysis revealed that 182 landslides, accounting for 85.8% of the total, are concentrated in three types of land use: forest land, bare land, and grassland. This distribution indicates that landslides in the Xiaojiang Basin predominantly occur in areas with natural surface characteristics (Figure 13).

Figure 13.
Statistical distribution of landslides in land use.
5.6. Development Area of Landslides
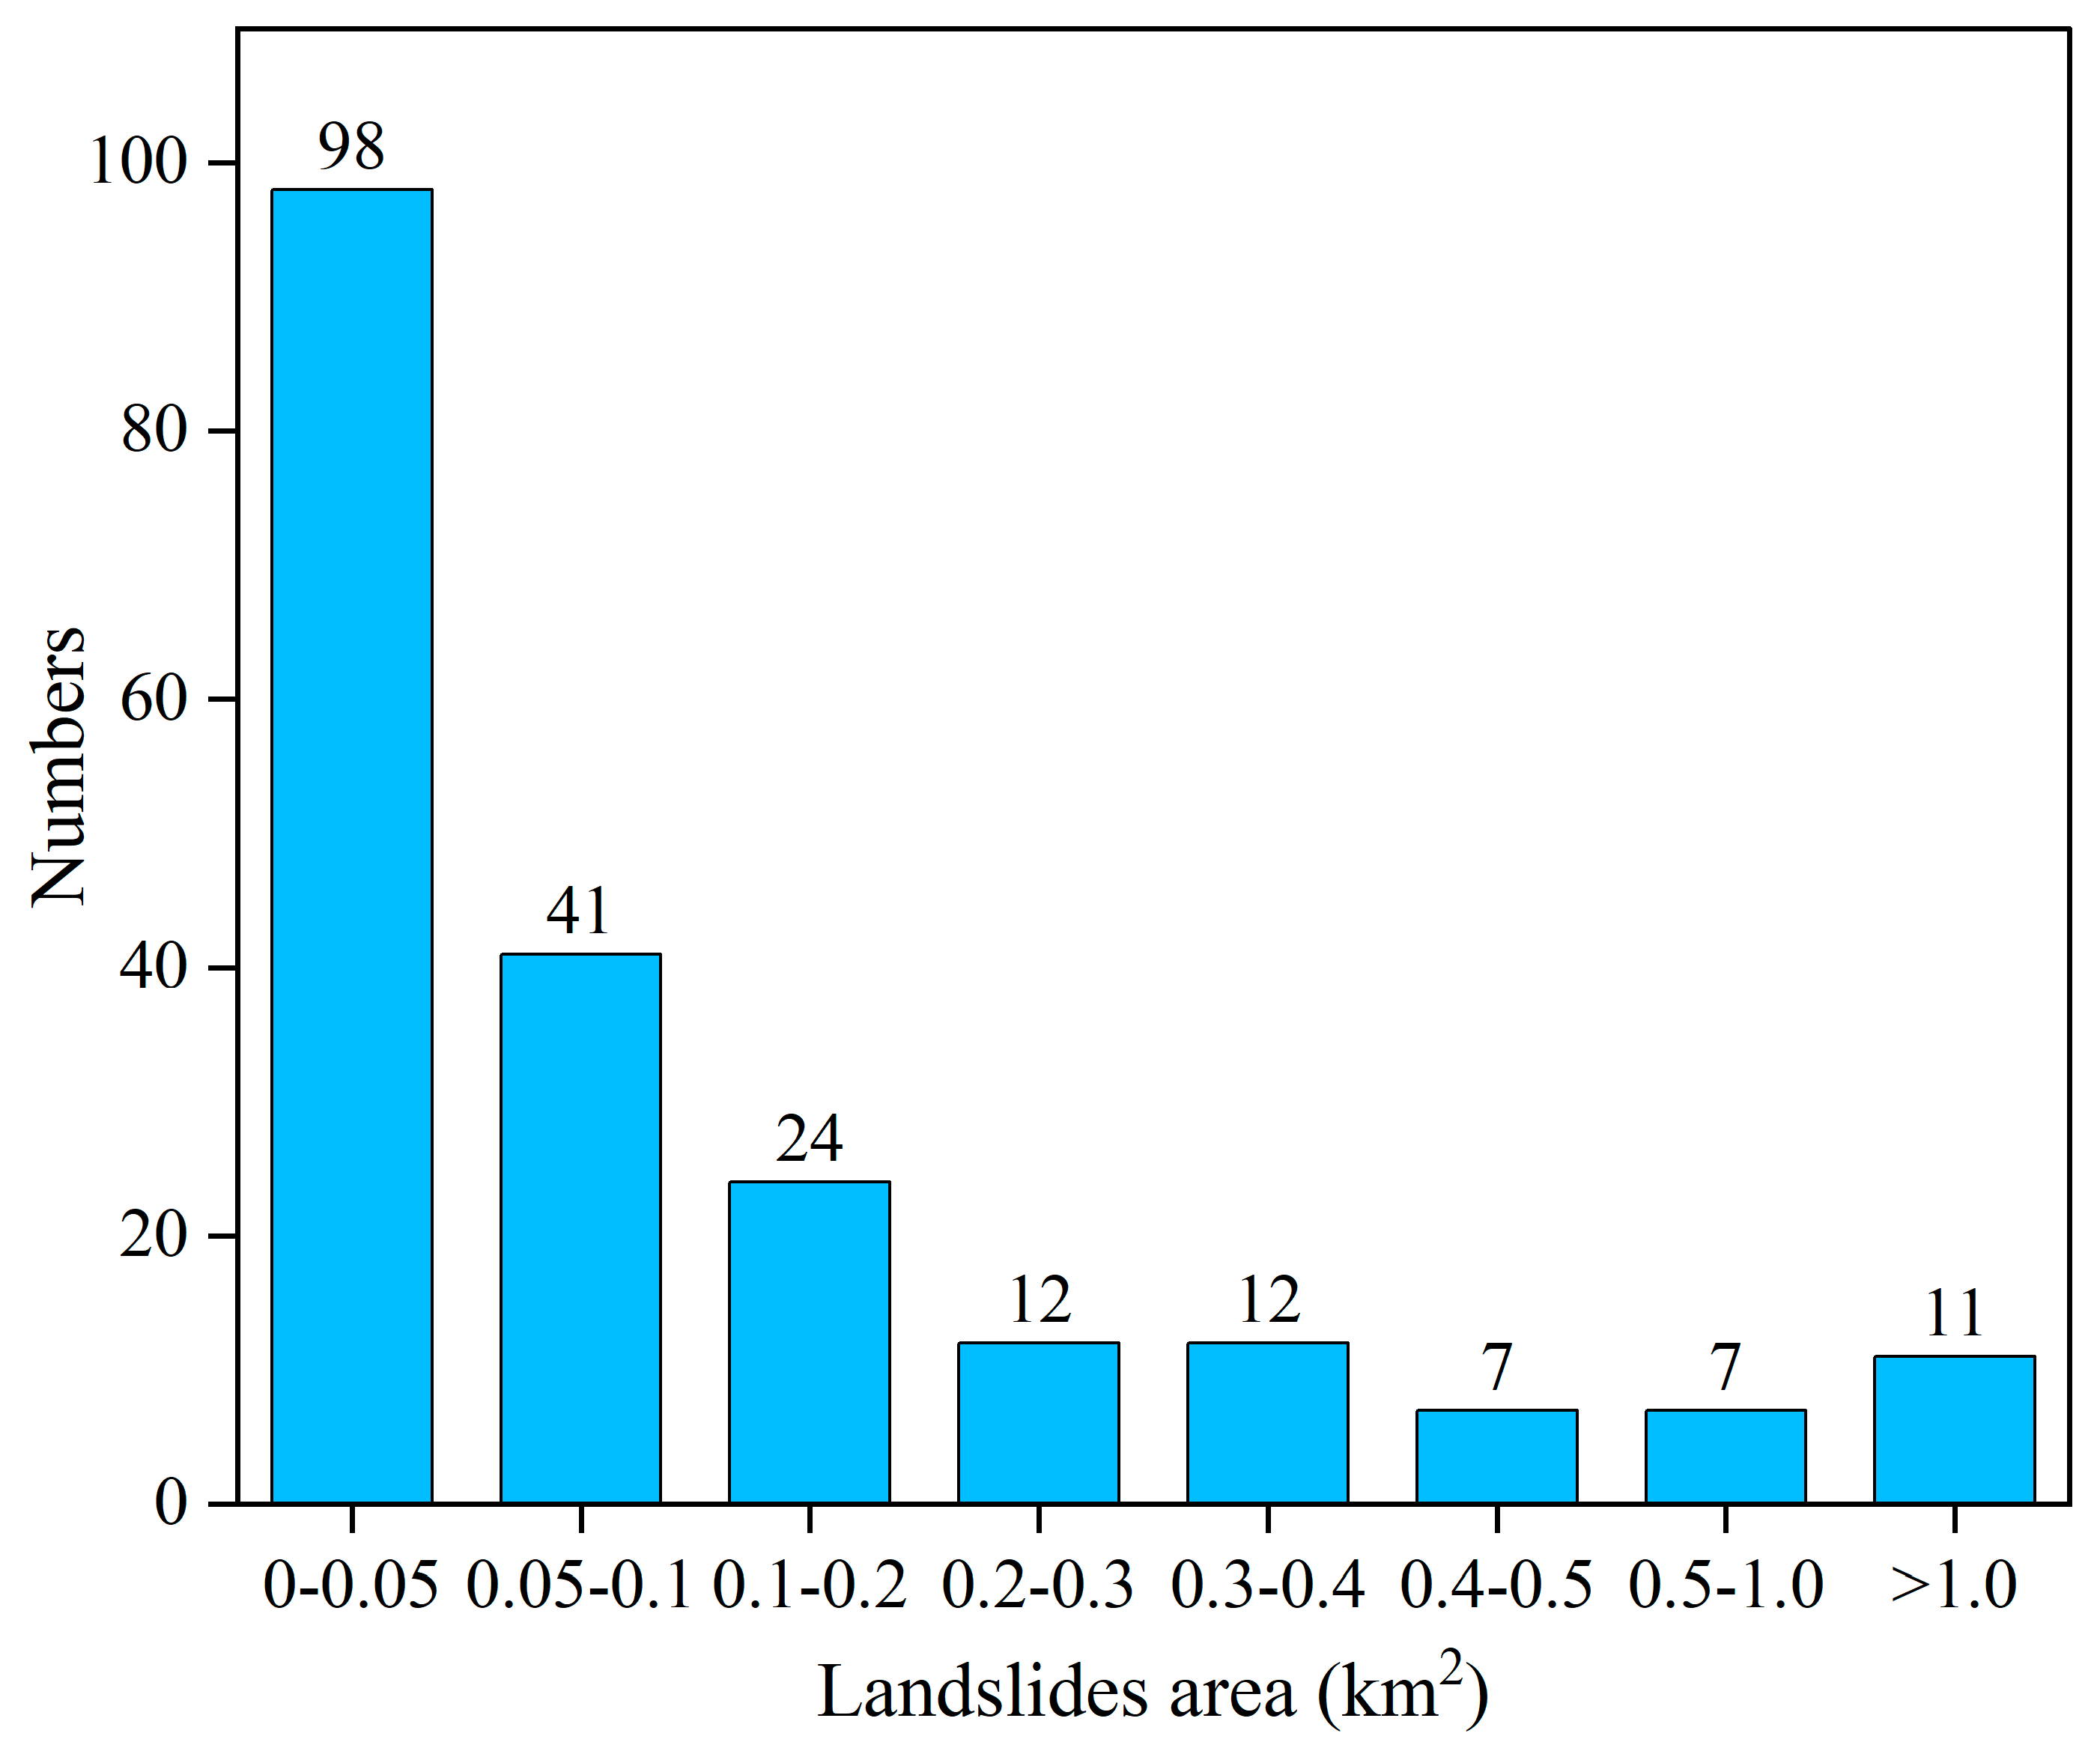
The area statistics for 212 landslides in the Xiaojiang Basin (Figure 14) reveal that the majority of landslides occupy areas smaller than 0.1 km², accounting for 65.6% of the total. These landslides are predominantly small to medium-sized and shallow, with large and giant landslides being relatively rare. Influenced by factors such as terrain slope, relative elevation differences, fracture zones, and fault tectonic movements, these landslides are typically situated on both sides of river valleys, where the risk of geological disasters is elevated.

Figure 14.
Statistical distribution of landslide development area.
5.7. Discussion of the Effectiveness of Landslide Identification
In the Xiaojiang Basin, a total of 212 potential landslides were identified using three different InSAR methods. Specifically, the PS-InSAR method identified 93 potential landslides, the SBAS-InSAR method identified 103, and the D-InSAR method identified 132. Cross-validation between the PS-InSAR method and the other two methods revealed an identification accuracy of 51.61%. The identification accuracies for the SBAS-InSAR and D-InSAR methods were 72.82% and 69.70%, respectively. This indicates that over half of the potential landslides identified by each method were also detected by the other two methods, affirming the reliability of these results. The comparative analysis demonstrates that the potential landslide identifications in this study are dependable. Moreover, the effectiveness of employing all three InSAR methods for potential landslide detection in the Xiaojiang Basin is suggested. Compared to the existing landslide hazard identifications in the Dongchuan District by Zhu Zhifu et al. using the SBAS-InSAR method [1] and by Zhang Xiaolun et al. using the D-InSAR method [8], utilizing a combination of the three methods not only cross-verifies the reliability of the results but also enhances the comprehensiveness of the identifications. This approach is particularly beneficial for monitoring regional landslide hazards and supporting sustainable development. The successful application of the InSAR method in this basin serves as a valuable reference for monitoring and identifying landslide hazards in other regions globally.
Further analyses indicated that the SBAS-InSAR method identified potential landslides with higher accuracy, suggesting its greater suitability for detecting potential landslides within the Xiaojiang Basin. The slightly lower accuracy observed with D-InSAR and PS-InSAR may be attributable to the dense vegetation cover and steep topography characteristic of some areas within the region. Yueping Yin et al., in their study of the Jiaju landslide in Sichuan, China, found that D-InSAR was more effective for monitoring surface deformation in urban and non-vegetated areas due to its higher coherence. In densely vegetated and wet areas, it may be necessary to install corner reflectors as coherence points, especially in steep mountainous regions [35]. PS-InSAR faced challenges in obtaining a sufficient number and density of coherent points in densely vegetated and wet areas, which could compromise the accuracy of landslide monitoring [26,36,37]. We also recognize that the relatively large size of the Xiaojiang Basin, the diversity of its surface cover, and the presence of dense vegetation in some areas, undulating topography, and numerous high mountains and valleys could impact the coherence, thereby affecting the density of coherent points and the accuracy of monitoring. This may represent a limitation of our study. Moreover, the data used in this study are from Sentinel-1A, which has relatively low resolution and may not be detailed enough for precise identification. Future research might consider applying higher-resolution SAR imagery for regional landslide monitoring, or employing a combination of multiple datasets to better identify potential landslides in the region.
6. Conclusions
In this study, three InSAR techniques were utilized to assess surface deformation in the Xiaojiang Basin, supplemented by optical remote sensing images and field investigations. This comprehensive approach facilitated the early identification of potential landslides within the basin. The reliability of monitoring results was corroborated by comparing landslides identified by different methods, and an in-depth analysis was conducted on typical landslide profiles and their development and distribution characteristics in the basin, yielding the following conclusions: 1. The annual average deformation rate along the LOS direction in the Xiaojiang Basin ranged from −25.36 mm/year to 24.40 mm/year between March 2018 and November 2021. For the PS-InSAR and SBAS-InSAR time-series methods, an average annual deformation velocity threshold of −10 to 10 mm/year was set. For the D-InSAR method, a cumulative deformation rate of −54 to 42 mm was established as the threshold. A total of 212 landslides were identified within the basin. Statistical analysis of surface deformation and landslides using the three InSAR methods, coupled with existing geological survey data, confirmed that the surface deformation monitoring and potential landslide identification are consistent and effective. 2. The characterization of deformation in a typical landslide in the Caizishan area showed significant surface movements detected by all three InSAR methods. The upper part of the slope exhibited substantial continuous decline, the middle part also showed ongoing decline, while the lower part experienced relatively minor deformation. Deformations in the upper and middle sections were predominantly observed during the annual rainy season (May-October), highlighting the significant impact of rainfall on landslide activity in the basin. The trends observed at three feature points by the SBAS-InSAR and PS-InSAR methods were generally consistent, further validating the reliability of these data processing techniques. 3. Spatial and statistical analyses of the distribution of 212 landslides in terms of kernel density, topography, lithology, structure, land use type, valley proximity, and area revealed that landslides predominantly occurred in fragile rock formations such as sandstone, mudstone, and millimetalite, with slope angles ranging from 20° to 40°, a relative elevation difference of less than 300 m, and an aspect between 90° and 270°. Landslides with high kernel density were mainly concentrated in bare land and grassland areas on both sides of the debris gullies in the lower parts of the basin. Most landslides covered areas smaller than 0.1 km². Additionally, 86.8% of the landslides were influenced by regional tectonic activities, such as fracture zones and faults, and 85.8% were located in three types of natural surface land uses: forest, bare land, and grassland. Furthermore, 80.2% of the potential landslides developed on both sides of river valleys.
The findings suggest that landslides in the Xiaojiang Basin are primarily influenced by the natural environment and highlight the potential threat landslides pose to the safety of life and property in areas surrounding the river valleys. The combined application of high-resolution optical remote sensing, field investigations, and InSAR techniques proves to be an effective and reliable method for regional geological hazard assessment.
Author Contributions
Conceptualization, X.Z. and S.G.; methodology, X.Z.; formal analysis, X.Z. and X.W.; investigation, X.Z. and H.Z.; data curation, X.Z. and Y.S.; writing—original draft preparation, X.Z.; writing—review and editing, S.G. and X.Y. All authors have read and agreed to the published version of the manuscript.
Funding
This research was funded by the National Natural Science Foundation of China (Grant No. 41861054) and Scientific Research Foundation of Yunnan Education Department (Grant No. 2019J0889).
Institutional Review Board Statement
Not applicable.
Informed Consent Statement
Not applicable.
Data Availability Statement
The data are not publicly available as they involve the subsequent application of the other studies.
Acknowledgments
The Sentinel-1A images (https://scihub.copernicus.eu/, accessed on 1 June 2022) and DEM were provided by the European Space Agency (ESA) and the United States Geological Survey (USGS), respectively.
Conflicts of Interest
The authors declare no conflicts of interest.
References
- Zhu, Z.; Gan, S.; Yuan, X.; Zhang, J. Landslide Susceptibility Mapping with Integrated SBAS-InSAR Technique: A Case Study of Dongchuan District, Yunnan (China). Sensors 2022, 22, 5587. [Google Scholar] [CrossRef] [PubMed]
- People’s Government of Dongchuan District, Kunming. Dongchuan District 2020 Annual Geological Disaster Prevention and Control Programme [R]; Office of the People’s Government of Dongchuan District, Kunming: Kunming, China, 2020. (In Chinese) [Google Scholar]
- Guo, H.; Zhang, L. 60 years of radar remote sensing: Four-stage development. J. Remote Sens. 2019, 23, 1023–1035. [Google Scholar] [CrossRef]
- Zhang, K.; Guo, H.; Jiang, D.; Han, C. Analysis of Geometric Characteristics and Coverage for Moon-Based/Spaceborne Bistatic SAR Earth Observation. Remote Sens. 2023, 15, 2151. [Google Scholar] [CrossRef]
- Li, Z.; Song, C.; Yu, C.; Xiao, R.; Chen, L.; Luo, H.; Dai, K.; Ge, D.; Ding, Y.; Zhang, Y.; et al. Application of Satellite Radar Remote Sensing to Landslide Detection and Monitoring: Challenges and Solutions. Geomat. Inf. Sci. Wuhan Univ. 2019, 44, 967–979. [Google Scholar] [CrossRef]
- Van Natijne, A.L.; Bogaard, T.A.; Van Leijen, F.J.; Hanssen, R.F.; Lindenbergh, R.C. World-wide InSAR sensitivity index for landslide deformation tracking. Int. J. Appl. Earth Obs. Geoinf. 2022, 111, 102829. [Google Scholar] [CrossRef]
- Romy, S.; Cécile, D.; Jean-Philippe, M.; Frédéric, M. Landslide deformation monitoring with ALOS/PALSAR imagery: A D-InSAR geomorphological interpretation method. Geomorphology 2015, 231, 314–330. [Google Scholar] [CrossRef]
- Zhang, X.; Yang, Y.; Chen, Z.; Shao, Y.; Chen, G.; Wan, B.; Li, D. The identification of landslide disasters around Dongchuan city based on D-InSAR. J. Kunming Metall. Coll. 2021, 37, 38–44. (In Chinese) [Google Scholar] [CrossRef]
- Shi, X.; Xu, J.; Jiang, H.; Zhang, L.; Liao, M. Slope Stability State Monitoring and Updating of the Outang Landslide, Three Gorges Area with Time Series InSAR Analysis. Earth Sci. 2019, 44, 4284–4292. [Google Scholar] [CrossRef]
- Shi, X.; Liao, M.; Li, M.; Zhang, L.; Cory, C. Wide-Area Landslide Deformation Mapping with Multi-path ALOS PALSAR Data Stacks: A Case Study of Three Gorges Area, China. Remote Sens. 2016, 8, 136. [Google Scholar] [CrossRef]
- Yang, C.; Dong, J.; Zhu, S.; Xiong, G. Detection, Identification and Deformation Characteristics of Landslide Groups by InSAR in Batang Section of Jinsha River Convergence Zone, China. J. Earth Sci. Environ. 2021, 43, 398–408. [Google Scholar] [CrossRef]
- Zhao, C.; Lu, Z.; Zhang, Q.; Fuente, J. Large-area landslide detection and monitoring with ALOS/PALSAR imagery data over Northern California and Southern Oregon, USA. Remote Sens. Environ. 2012, 124, 348–359. [Google Scholar] [CrossRef]
- Li, Y.; Zhang, Y.; Su, X.; Zhao, F.; Liang, Y.; Meng, X.; Jia, J. Early identification and characteristics of potential landslides in the Bailong River Basin using InSAR technique. J. Remote Sens. 2021, 25, 677–690. [Google Scholar] [CrossRef]
- Zhang, Y. Detecting Ground Deformation and Investigating Landslides Using InSAR Technique—Taking Middle Reach of Bailong River Basin as an Example; Lanzhou University: Lanzhou, China, 2018. (In Chinese) [Google Scholar]
- Zhang, Y.; Meng, X.; Chen, G.; Qiao, L.; Zeng, R.; Chang, J. Detection of Geohazards in the Bailong River Basin Using Synthetic Aperture Radar Interferometry. Landslides 2016, 13, 1273–1284. [Google Scholar] [CrossRef]
- Kiseleva, E.; Mikhailov, V.; Smolyaninova, E.; Dmitriev, P.; Golubev, V.; Timoshkina, E.; Hooper, A.; Samiei-Esfahany, S.; Hanssen, R. PS-InSAR Monitoring of Landslide Activity in the Black Sea Coast of the Caucasus. Procedia Technol. 2014, 16, 404–413. [Google Scholar] [CrossRef]
- Zhang, X.; Gan, S.; Yuan, X.; Zong, H.; Wu, X. Slope deformation monitoring and early identification of disasters in debris flow source area of Baini River, Dongchuan District, China. Front. Earth Sci. 2022, 10, 1000736. [Google Scholar] [CrossRef]
- Zhao, F.; Meng, X.; Zhang, Y.; Chen, G.; Su, X.; Yue, D. Landslide susceptibility mapping of Karakorum Highway combined with the application of SBAS-InSAR technology. Sensors 2019, 19, 2685. [Google Scholar] [CrossRef] [PubMed]
- Hussain, M.A.; Chen, Z.; Zheng, Y.; Shoaib, M.; Shah, S.U.; Ali, N.; Afzal, Z. Landslide Susceptibility Mapping Using Machine Learning Algorithm Validated by Persistent Scatterer In-SAR Technique. Sensors 2022, 22, 3119. [Google Scholar] [CrossRef] [PubMed]
- Zheng, L.; Li, X.; Xu, R. Sensitivity evaluation of regional landslide based on slope units: Taking Xiaojiang River Basin in Yunnan Province as an example. Sci. Technol. Eng. 2021, 21, 12322–12329. (In Chinese) [Google Scholar]
- Cheng, Z.; Yue, L.; Peng, G.; Chen, W.; Li, H.; Hou, Y.; Nuremangli, T.; Ma, H. Landslide mapping with remote sensing: Challenges and opportunities. Int. J. Remote Sens. 2020, 41, 1555–1581. [Google Scholar] [CrossRef]
- Su, X.; Zhang, Y.; Jia, J.; Liang, Y.; Li, Y.; Meng, X. InSAR-based monitoring and identification of potential landslides in Lueyang County, the Southern Qinling Mountains, China. Mt. Res. 2021, 39, 59–70. (In Chinese) [Google Scholar] [CrossRef]
- Ferretti, A.; Prati, C.; Rocca, F. Nonlinear Subsidence Rate Estimation Using Permanent Scatters in Differential SAR Interferometry. IEEE Trans. Geosci. Remote Sens. 2000, 38, 2202–2212. [Google Scholar] [CrossRef]
- Solari, L.; Del Soldato, M.; Raspini, F.; Barra, A.; Bianchini, S.; Confuorto, P.; Casagli, N.; Crosetto, M. Review of Satellite Interferometry for Landslide Detection in Italy. Remote Sens. 2020, 12, 1351. [Google Scholar] [CrossRef]
- Berardino, P.; Fornaro, G.; Lanari, R.; Sansosti, E. A new algorithm for surface deformation monitoring based on small baseline differential SAR interferograms. IEEE Trans. Geosci. Remote Sens. 2002, 40, 2375–2383. [Google Scholar] [CrossRef]
- Zhang, L.; Liao, M.; Dong, J.; Xu, Q.; Gong, J. Early detection of landslide hazards in mountainous areas of West China using time series SAR interferometry- a case study of Danba, Sichuan. Geomat. Inf. Sci. Wuhan Univ. 2018, 43, 2039–2049. [Google Scholar] [CrossRef]
- Zhang, Y.; Li, Y.; Dong, J.; Fan, Q.; Che, B.; Zhang, L.; Zhou, Y.; Liao, M. Landslide hazard detection in Markam with time-series InSAR analyses. J. Remote Sens. 2019, 23, 987–999. [Google Scholar] [CrossRef]
- Colesanti, C.; Wasowski, J. Investigating landslides with Space-Borne synthetic aperture radar (SAR) Interferometry. Eng. Geol. 2006, 88, 173–199. [Google Scholar] [CrossRef]
- Wasowski, J.; Bovenga, F. Investigating landslides and unstable slope with satellite multi temporal interferometry: Current issues and feature perspectives. Eng. Geol. 2014, 174, 103–138. [Google Scholar] [CrossRef]
- Dong, J.; Zhang, L.; Tang, M.; Liao, M.; Xu, Q.; Gong, J.; Ao, M. Mapping landslide surface displacements with time series SAR interferometry by combining persistent and distributed scatters: A case study of Jiaju landslide in Danba, China. Remote Sens. Environ. 2018, 205, 180–198. [Google Scholar] [CrossRef]
- Ng, A.H.M.; Ge, L.; Li, X. Assessments of land subsidence in the Gippsland Basin of Australia using ALOS/PALSAR data. Remote Sens. Environ. 2015, 159, 86–101. [Google Scholar] [CrossRef]
- Zhang, Y.; Meng, X.; Dijkstra, T.A.; Jordan, C.J.; Chen, G.; Zeng, R.; Novellino, A. Forecasting the magnitude of potential landslides based on InSAR techniques. Remote Sens. Environ. 2020, 241, 111738. [Google Scholar] [CrossRef]
- Kang, Y.; Zhao, C.; Zhang, Q.; Lu, Z.; Li, B. Application of InSAR Techniques to an Analysis of the Guanling Landslide. Remote Sens. 2017, 9, 1046. [Google Scholar] [CrossRef]
- Lan, H.; Wang, L.; Zhou, C. Study on the key landslide factor by means of GIS in Xiaojiang Valley, Yunnan. Chin. J. Geol. Hazard Control 2003, 14, 100–106. (In Chinese) [Google Scholar] [CrossRef]
- Yin, Y.; Zheng, W.; Liu, Y.; Zhang, J.; Li, X. Integration of GPS with InSAR to monitoring of the Jiaju landslide in Sichuan, China. Landslides 2010, 7, 359–365. [Google Scholar] [CrossRef]
- Agarwal, V.; Kumar, A.; Qin, Z.; Gomes, R.L.; Marsh, S. Lessons for Sustainable Urban Development: Interplay of Construction, Groundwater Withdrawal, and Land Subsidence at Battersea, London. Remote Sens. 2023, 15, 3798. [Google Scholar] [CrossRef]
- Agarwal, V.; Kumar, A.; Gee, D.; Grebby, S.; Gomes, R.L.; Marsh, S. Comparative Study of Groundwater-Induced Subsidence for London and Delhi Using PSInSAR. Remote Sens. 2021, 13, 4741. [Google Scholar] [CrossRef]


Disclaimer/Publisher’s Note: The statements, opinions and data contained in all publications are solely those of the individual author(s) and contributor(s) and not of MDPI and/or the editor(s). MDPI and/or the editor(s) disclaim responsibility for any injury to people or property resulting from any ideas, methods, instructions or products referred to in the content. |
© 2024 by the authors. Licensee MDPI, Basel, Switzerland. This article is an open access article distributed under the terms and conditions of the Creative Commons Attribution (CC BY) license (https://creativecommons.org/licenses/by/4.0/).