Article

Pollutant Removal Efficiency in a Rainwater Treatment System in Roztocze National Park (Poland)

by
Tadeusz Grabowski
1,2,
Andrzej Bochniak
3,
Tadeusz Siwiec
2 and
Krzysztof Jóźwiakowski
2,*
1
Roztocze National Park, Plażowa 2, 22-470 Zwierzyniec, Poland
2
Department of Environmental Engineering and Geodesy, University of Life Sciences in Lublin, Leszczyńskiego 7, 20-069 Lublin, Poland
3
Department of Applied Mathematics and Computer Science, University of Life Sciences in Lublin, Głęboka 28, 20-612 Lublin, Poland
*
Author to whom correspondence should be addressed.
Sustainability 2024, 16(11), 4709; https://doi.org/10.3390/su16114709
Submission received: 15 April 2024 / Revised: 24 May 2024 / Accepted: 29 May 2024 / Published: 31 May 2024

Abstract

:
The aim of this paper was to determine the efficiency of a rainwater treatment installation located near the farm buildings of Roztocze National Park (RNP), Poland. The rainwater treatment system, consisting of two polypropylene filters, one activated carbon filter and a UV lamp, was examined. Samples of raw and treated rainwater were collected once a month from June to December 2023. The study shows that average efficiency of pollutant removal in the analysed rainwater treatment system was not very high and amounted to 38.8% for ammonia, 29.6% for turbidity, 27.9% for NO2, 19.8% for NO3, and 6.9% for copper. The low efficiency values can be explained by the low concentration of these parameters in rainwater from the tanks. The efficiency of removing microbiological contaminants was very high and ranged from approximately 98% to 100%. It was shown that the UV lamp ensures very good disinfection of rainwater. The study shows that rainwater treated using filtration and disinfection (UV lamp) can be used for watering the Polish Konik horses living in the park, as well as for washing vehicles, watering green areas, or flushing toilets. The present findings can be used in the design of a new system for managing rainwater that is planned to be built in the RNP’s Animal Breeding Centre, as well as to prepare other rainwater systems, especially in protected areas.

1. Introduction

A circular economy, which includes the creation of closed water cycles, is one of the key components of the European Union’s sustainable development strategy and policy [1]. Due to ongoing climate change and water shortages, the need to harvest rainwater has been increasingly brought to public attention in the 21st century [2]. The technology of rainwater collection and use dates back to antiquity, and the oldest examples of rainwater collection systems come from the Neolithic period [3]. Recently, more and more research indicates that the harvesting and utilisation of rainwater can help to surmount the problems connected with water deficits caused by climate change in various regions of the world [4,5]. Raimondi et al. [6] have reported that the number of publications recorded yearly in the Scopus database containing the keyword “rainwater harvesting” increased from zero in 1985 to over 400 in 2021. According to the UN, climate change is the greatest threat to social and economic development. The ‘Earth Summit’ in Rio adopted the Declaration on Environment and Development and Agenda 21, which sets out a set of principles by which humanity should develop in the 21st century [7]. According to the Human Development Index (HDI) for the year 2022, Poland is classified as a highly developed country and ranks 36th, with an index of 0.881, among the 191 countries assessed [8]. Poland’s Gross Domestic Product in 2022 was USD 688.1 billion, ranking 21st in the world. In terms of population, Poland is ranked 35th in 2022, with a population of 36.82 million [9].
The current state of the art and future perspectives for rainwater harvesting systems in Europe were presented in the paper by Wartalska et al. [10], whereas Dalman et al. [11] and Jin et al. [12] showed the costs and benefits of this subject. On the other hand, de Sá Silva et al. [13] presented a review of the environmental, economic, and social aspects of the use of the rainwater harvesting systems. Authors from Germany [14], Greece [15], Brasil [16], Australia [17], and Jordan [18] have pointed out that rainwater can meet 100% of household water demand and that it can be used for various purposes [19]. Kim et al. [20] have reported that rainwater is used as the main source of water supply for millions of people in developing countries. In recent years, however, climate change, droughts, and the rising costs of water have also forced highly developed countries to invest in water-harvesting and utilisation technologies [6,21]. The potential of using rainwater on an urban scale for the example of Turin in Italy was presented by Carollo et al. [22], while the potential of rainwater harvesting in the retail sector in Portugal was presented by Ferreira et al. [23].
The advantages of rainwater collection systems have been discussed in detail by Morey et al. [24], Yawalkar et al. [25], and Ertop et al. [26]. Those authors have noted that rainwater can be utilised (1) as an additional source of water where demand is high but water from other sources is scarce, (2) to protect water resources, (3) to reduce the consumption of surface and groundwater resources, (4) to produce safe drinking water in the process of purification, (5) for watering plants and landscaping, and (6) to reduce unproductive outflow of water through rivers into the seas and oceans; at the same time, rainwater utilisation systems are (7) simple, easy to maintain, and cheap to operate, (8) can be used anywhere, regardless of the terrain, geology, or land development pattern, (9) can be used on-site in households or public utility facilities, (10) can improve the water management system, and (11) can protect urban areas from flooding and reduce the severity of floods during heavy rainfall. It has also been demonstrated that excess rainwater can be diverted and captured for groundwater recharge. However, on sloping hillsides, rainfall can leach soluble organic matter [27] and cause soil erosion [28].
The impacts of rainfall change on stormwater control and the water-saving performance of rainwater-harvesting systems (RHSs) were presented in the paper of Ali et al. [29]. It was shown that the impacts of rainfall change on the performance of RHSs are dependent on not only the trends and extents of local rainfall change but also tank sizes and water demand. In some special cases, rainwater that has good organoleptic, physicochemical, and microbiological properties may meet the quality standards of water intended for human consumption. However, more often than not, roof-harvested rainwater contains ammonium ions and increased levels of microbiological contaminants that most likely come from bird droppings accumulated on roof surfaces [30,31,32]. Before such water is used for drinking purposes for humans and animals, it has to undergo treatment [32].
So far, there has been little research into the functioning of full-scale rainwater treatment technologies. Therefore, there is an urgent need for studies that will provide data on such systems for different roof types, different regions of the world, and different seasons of the year. The aim of this paper was to evaluate the efficiency of a rainwater treatment system operating in Roztocze National Park (RNP) in Poland at producing potable water for watering the animals living in the park and other purposes. The rainwater treatment system under study is the terminal element of a rainwater-harvesting system installed in the outbuildings of the RNP Headquarters. In the treatment system, harvested rainwater is filtered and disinfected using a UV lamp. This paper provides useful data for the design and construction of a new rainwater management system in the RNP’s Animal Breeding Centre, which is planned to produce water, among other things, for watering the Polish Konik horses living in the park.
Rainwater management technologies can be used as part of nature protection programmes aimed at limiting the consumption of high-quality water and the quantitative protection of groundwater resources in national parks, as provided for by the Act of 16 April 2004 on nature protection [33]. The need to use rainwater instead of groundwater is also covered by the provisions of the Roztocze National Park Protection Plan, established by the Regulations of the Minister of the Environment of 19 April 2018 [34], regarding measures for preventing the lowering of the groundwater table, limiting groundwater abstraction, and protecting the feeding, nesting, and breeding grounds of amphibians and reptiles. Rainwater harvesting is an implementation of the policy of the Polish State, including the draft Act on investments in counteracting the effects of drought, and the policy of the European Union, including Directive 2000/60/EC of the European Parliament [35], and of the Council of 23 October 2000 establishing a framework for community action in the field of water policy.

2. Materials and Methods

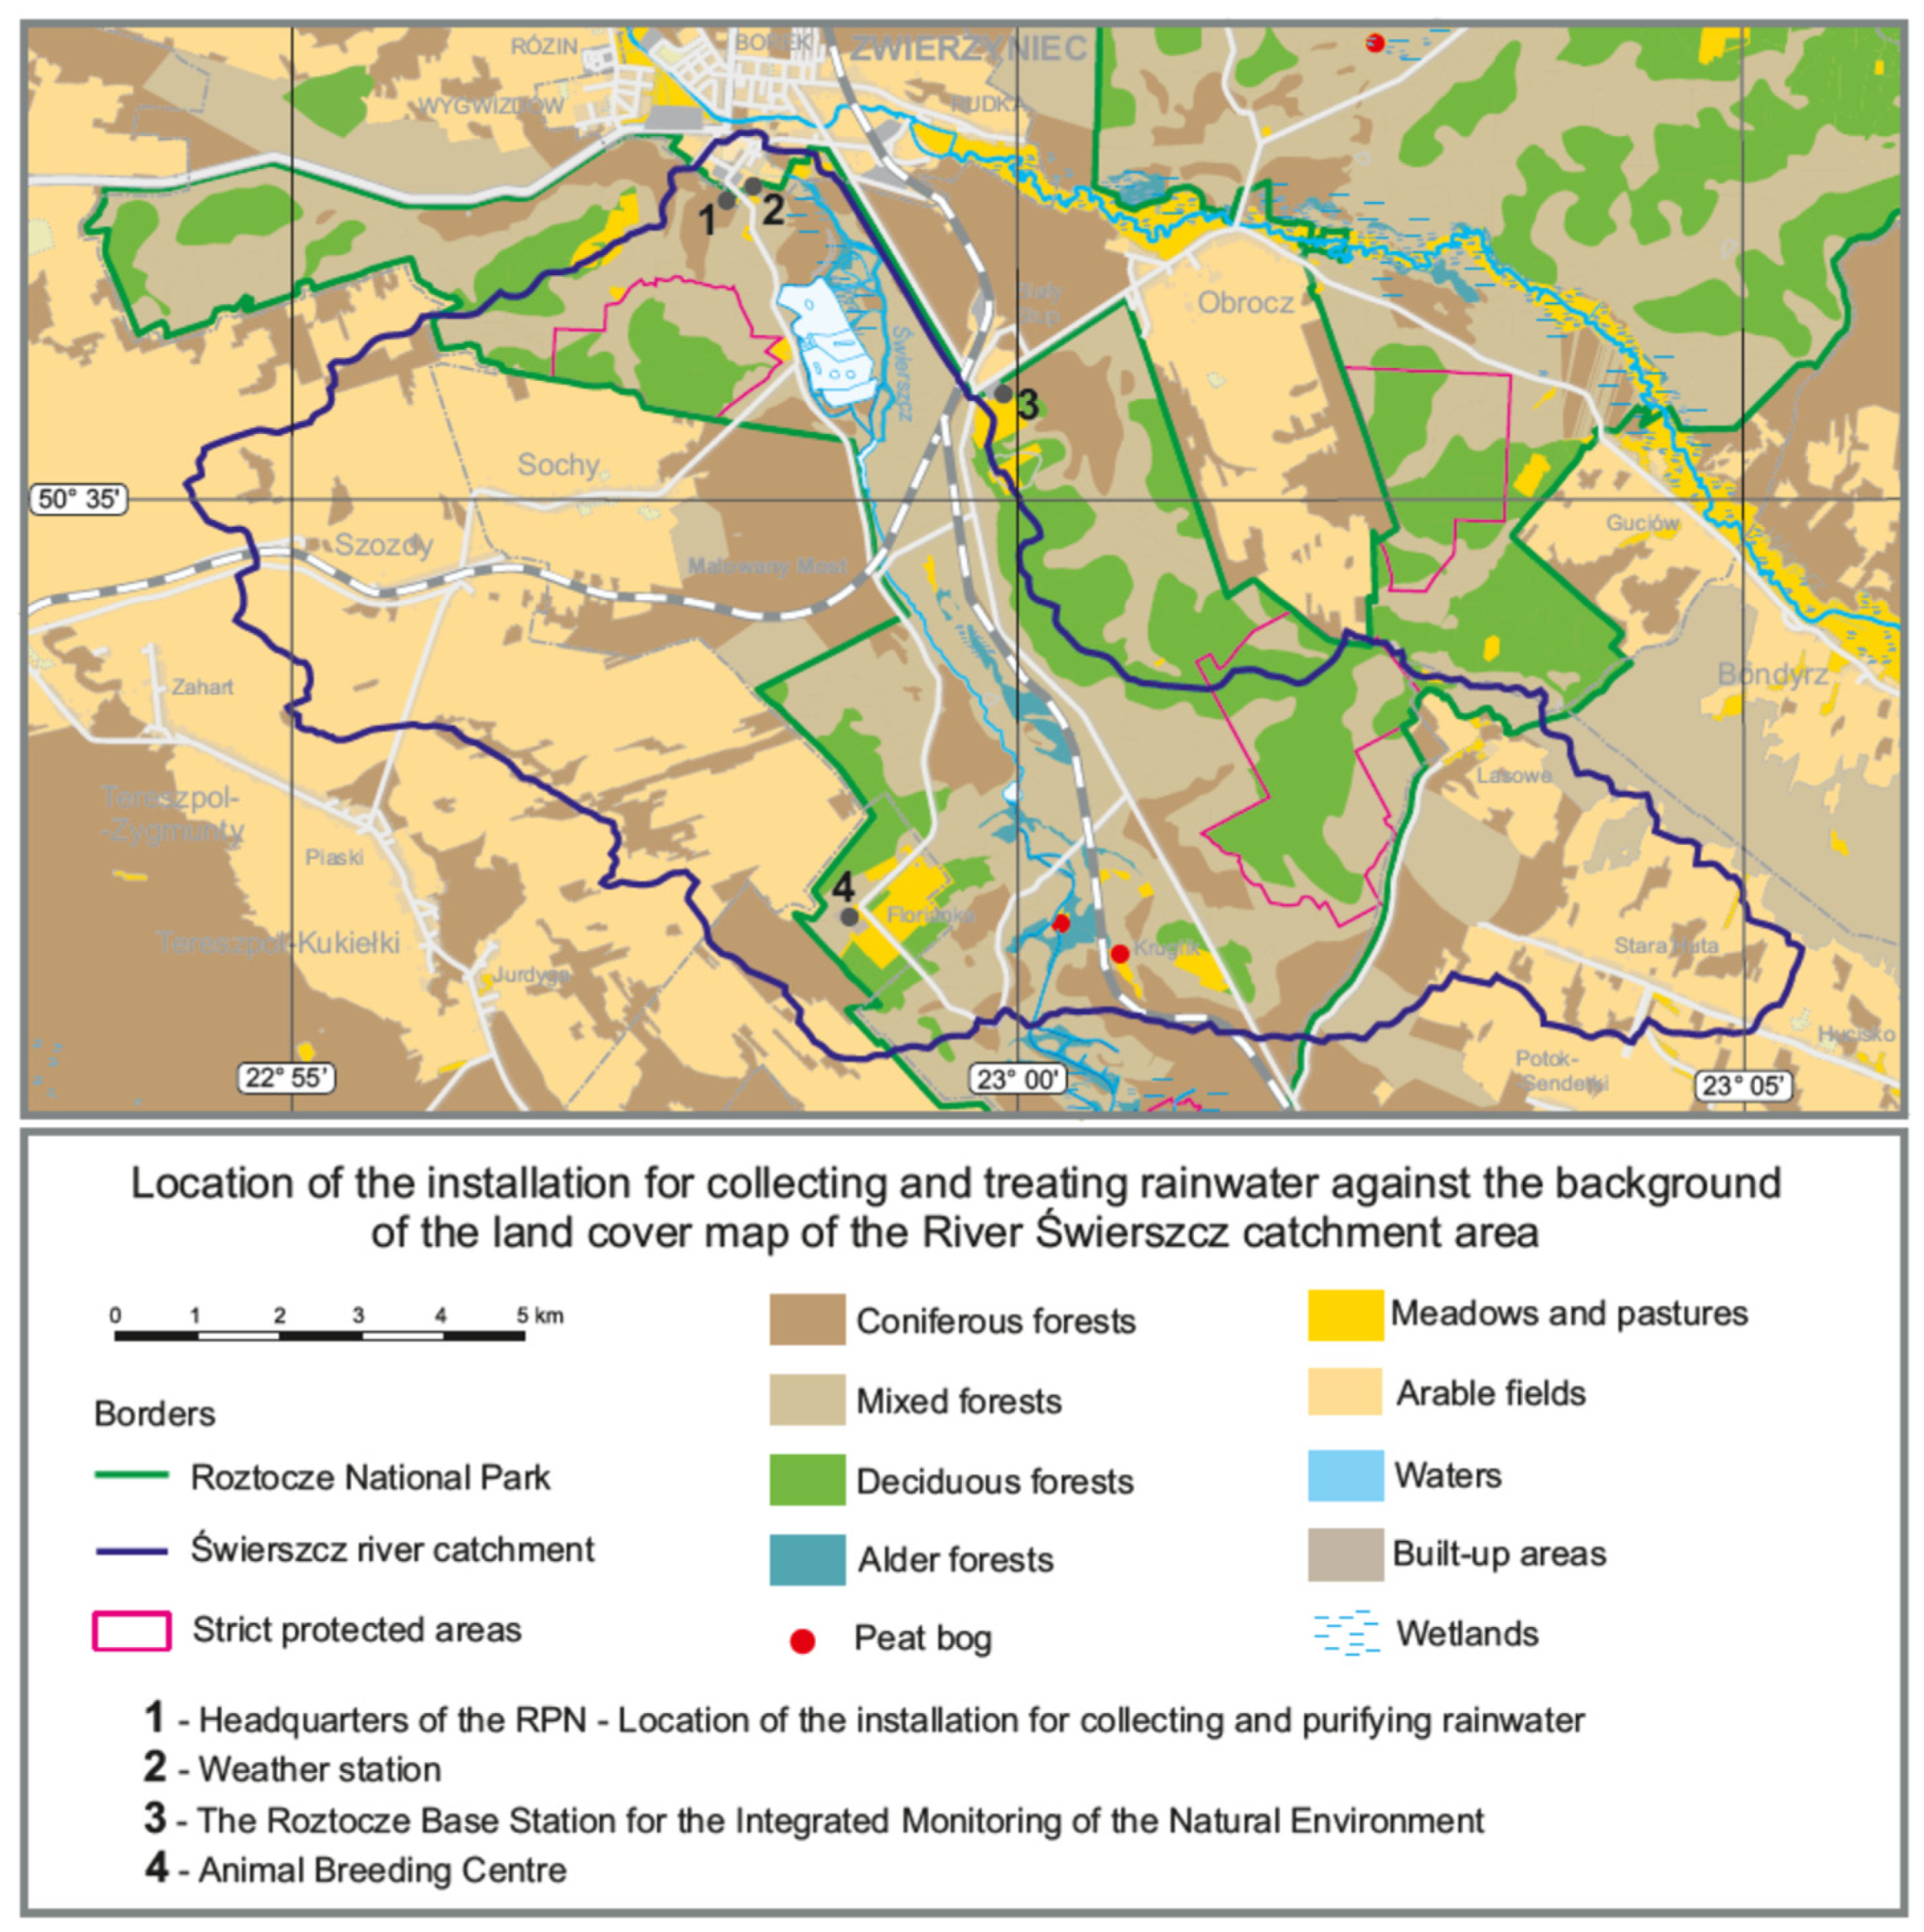
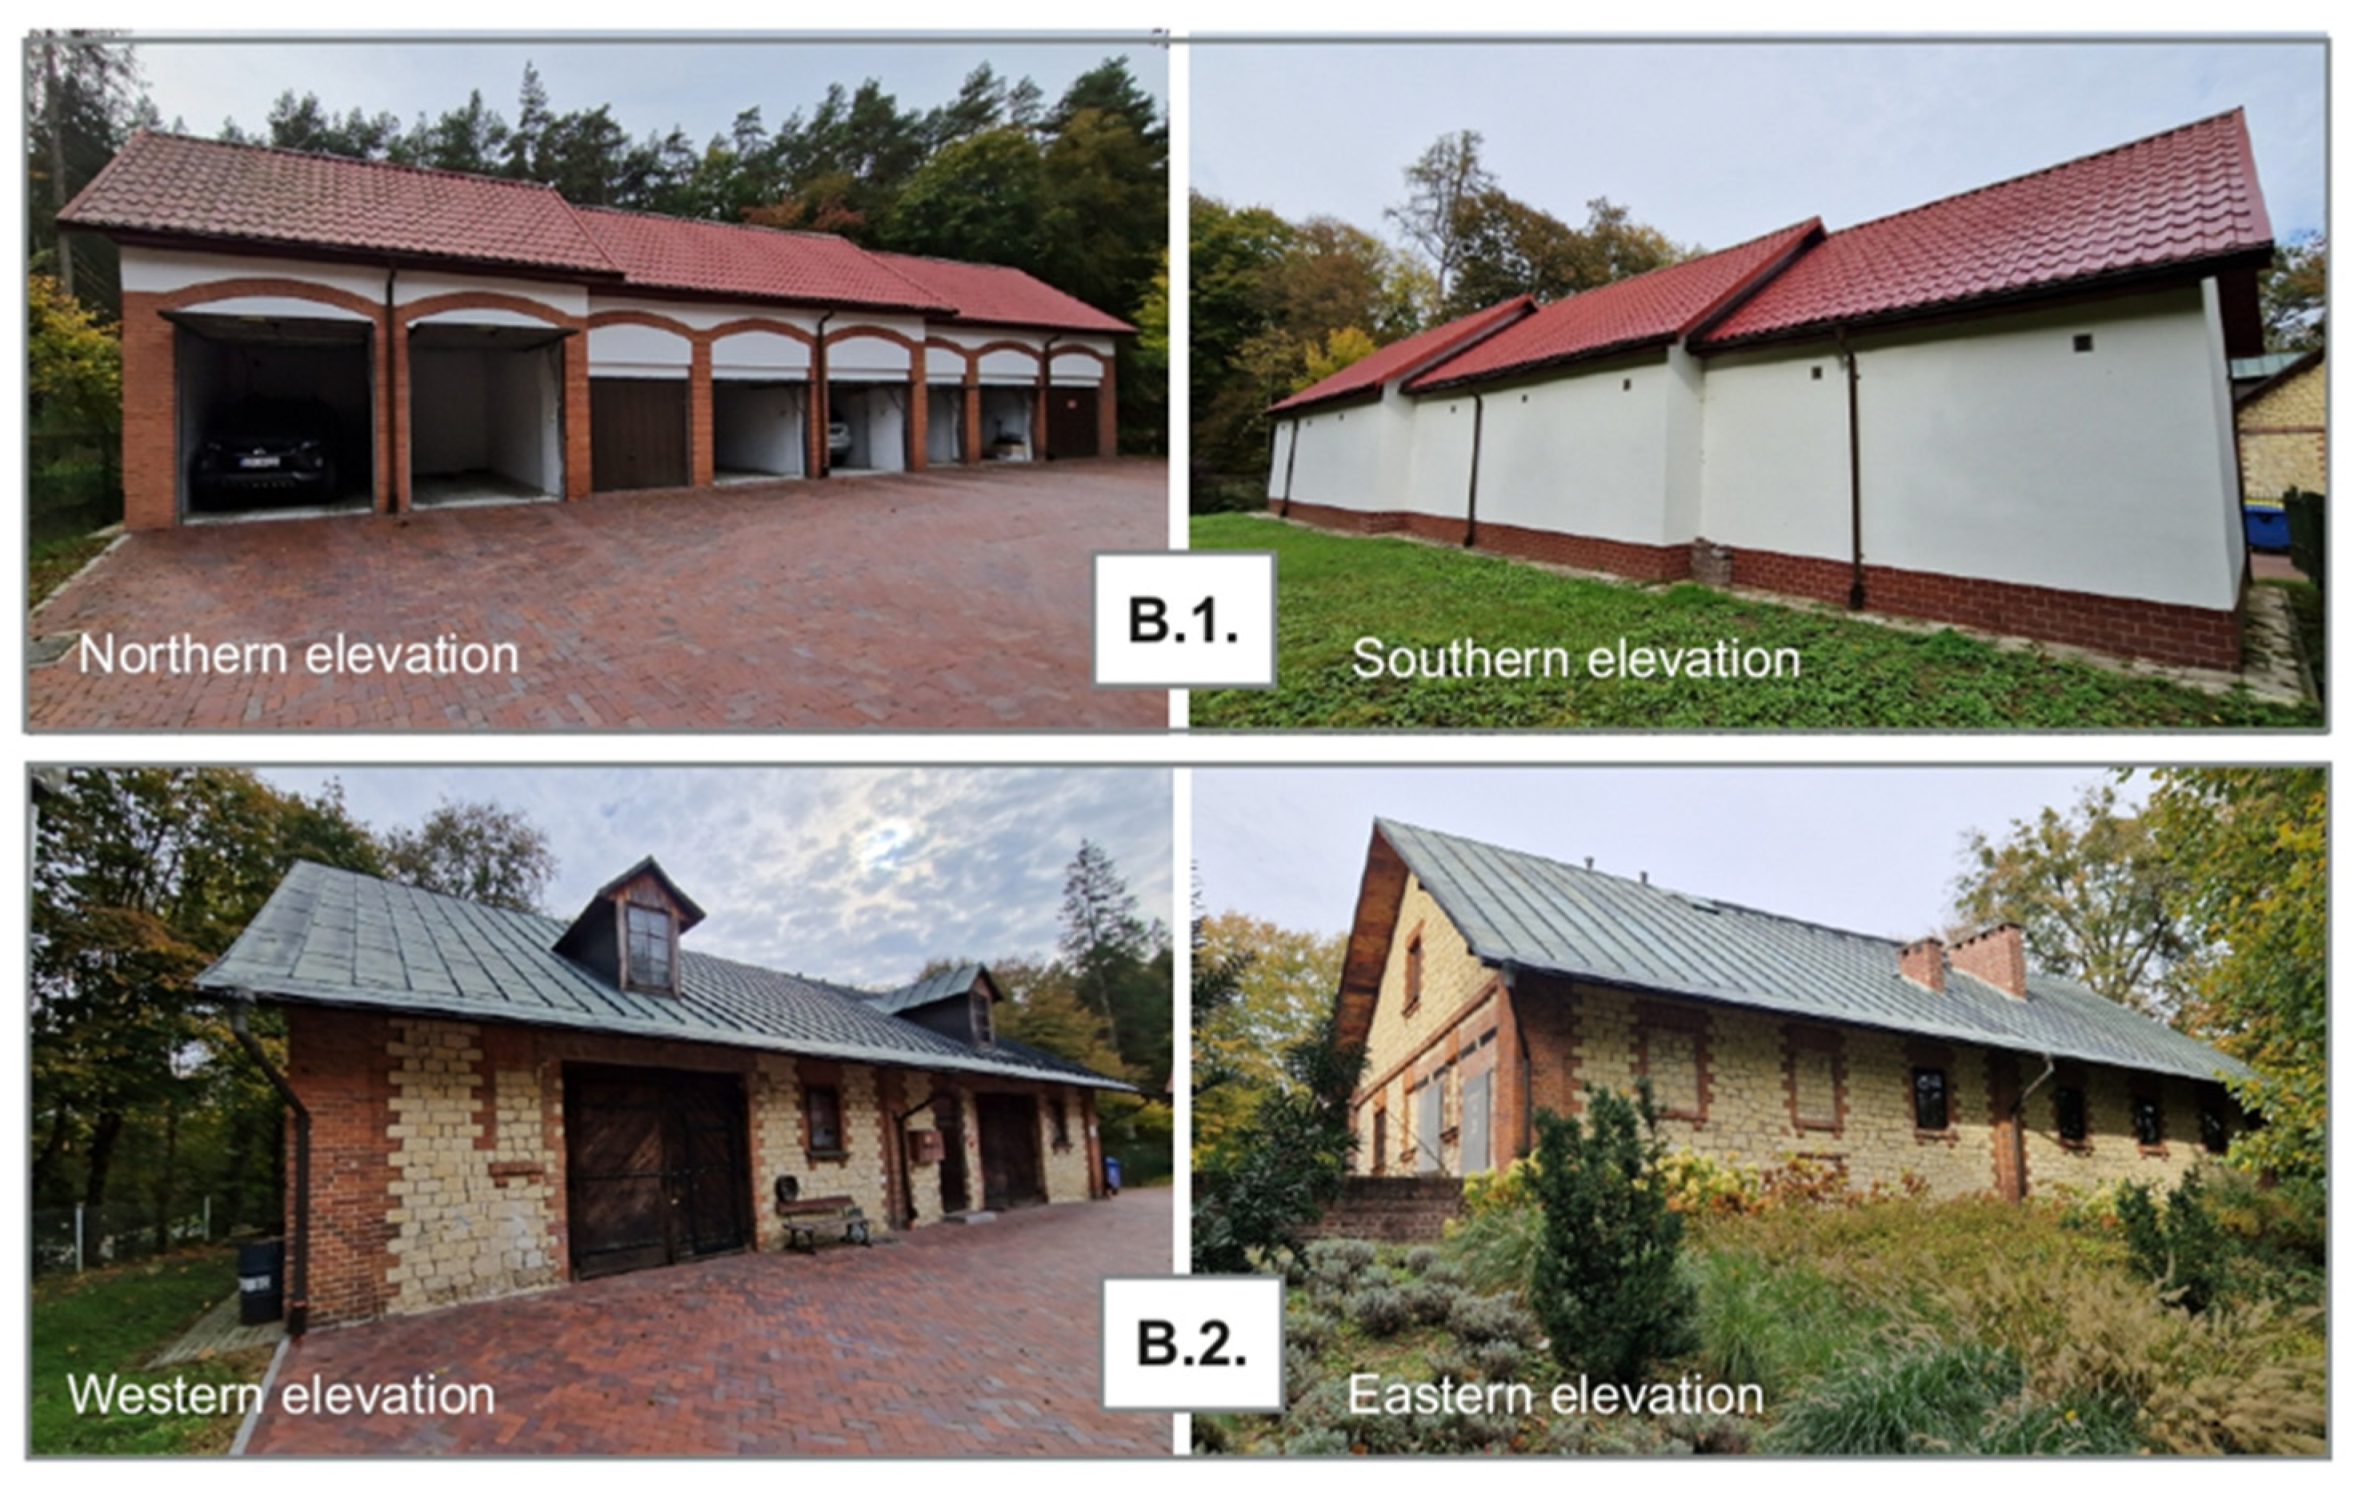
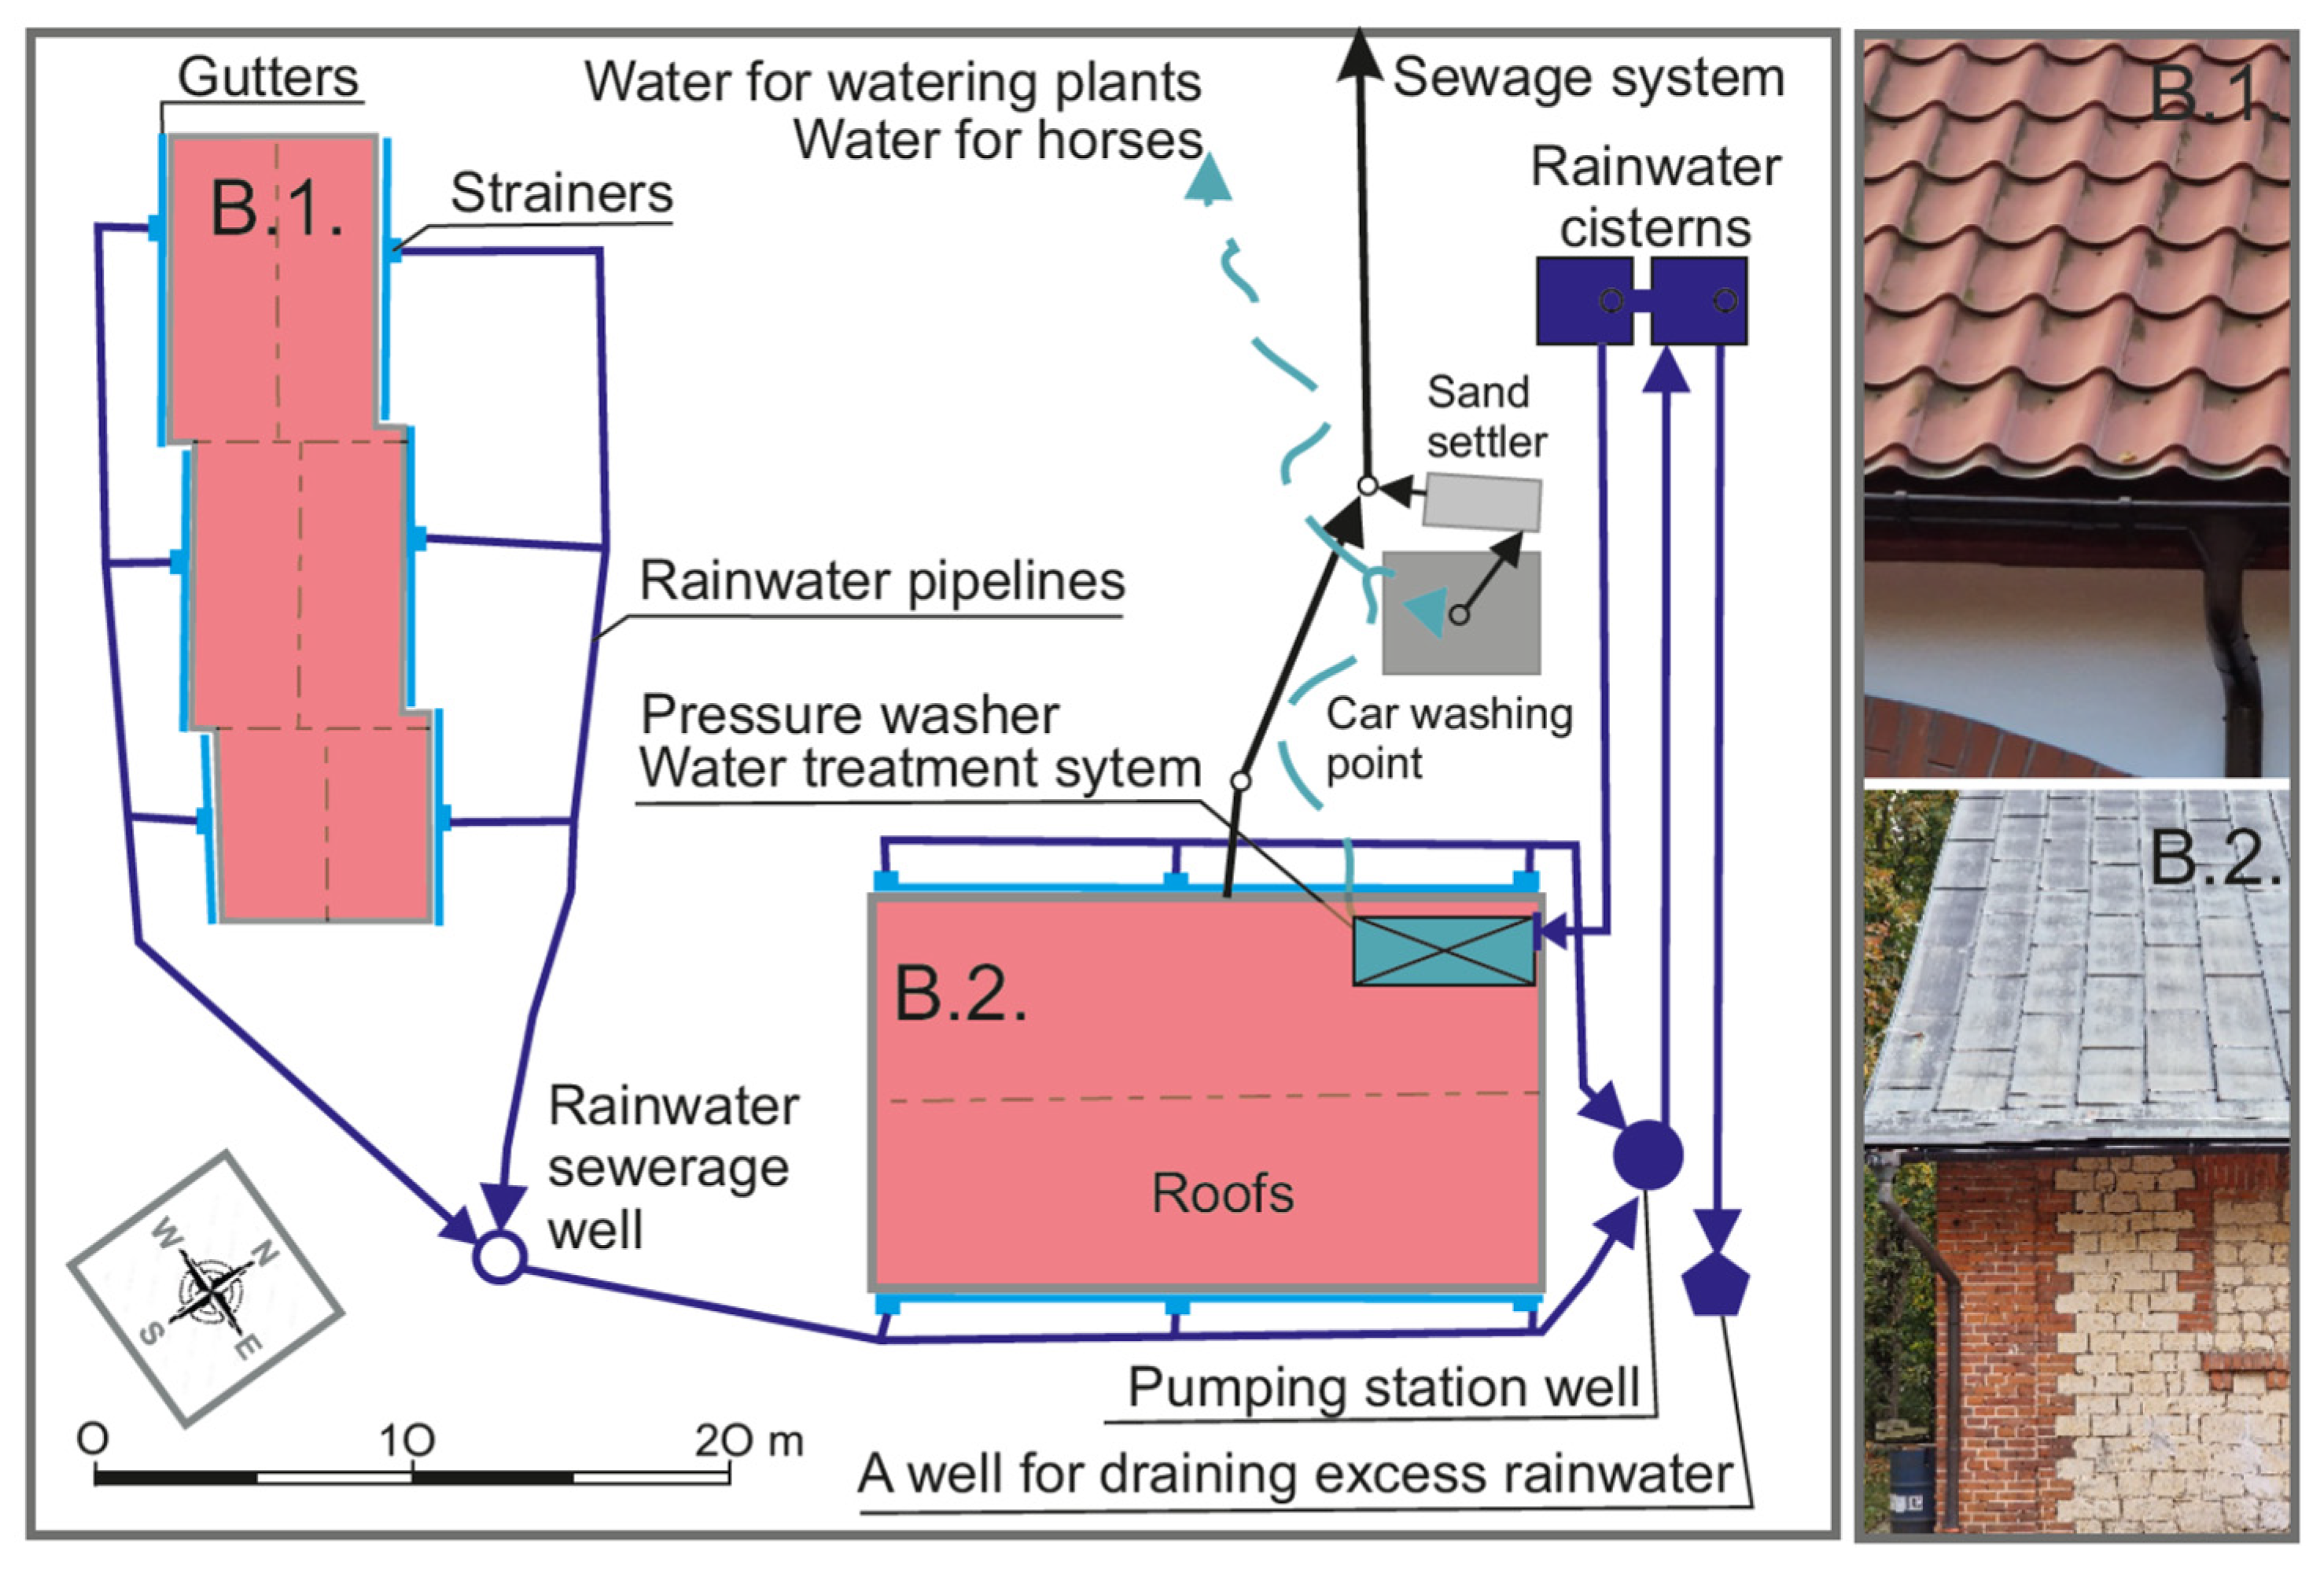
2.1. Characteristics of the Rainwater Treatment System

The original system for rainwater harvesting and management was built in 2014 next to the RNP Headquarters building in Zwierzyniec, 50°36′21.1″ N, 22°58′00.6″ E. The geographical location of the facility on the RNP land cover map is shown in Figure 1. This and the other figures are the authors’ own elaboration.
The rainwater-harvesting and utilisation installation includes a system of gutters and downpipes, a water pumping station (an Omnigena pump with a maximum capacity of 2.1 m3/h), and two concrete tanks with a capacity of 10 m3 and a depth of 2.45 m each. Water is collected by the system of gutters and downpipes from the roofs of outbuildings B1 (garage) and B2 (workshop). Photographic images of the two buildings are shown in Figure 2. Building B1 occupies an area of 24.6 m × 6.5 m; its roof area in plan view is approximately 185 m2 and the roof pitch angle is 40°. The dimensions of building B2 are 21 m × 12.4 m, and the roof area in plan view is approximately 302 m2, with a pitch angle of 37° [30]. The roof coverings are shown in Figure 3. The two outbuildings have gable roofs, with gutters on both sides of the buildings. Water from the two guttered sides of each building runs into the pumping station and from there to two concrete tanks that are joined together to form one large water storage tank.
Water from the tanks is sucked up and transported through a suction pipeline connected to a pump installed in the workshop in building B2, where the rainwater treatment system is located.
To ensure the best possible quality of the water flowing into the concrete tanks, each of the downpipes was fitted with a downspout cleanout, as shown in Figure 4.
The rainwater-harvesting system on which the study was conducted is not the target environment. The rainwater tanks and the entire rainwater-harvesting system were built earlier. For the construction of a new system for animal watering, in May 2023, a water treatment installation was installed in building B2, which consisted of a hydrophore, three filters, and a UV lamp. The aim was to test the effectiveness of treating harvested rainwater. A detailed schematic of the treatment system is presented in Figure 5, and an actual image of the system is shown in Figure 6.
Water from the concrete tanks is sucked up by a WZ 250/2L (Omnigena, Mława, Poland) centrifugal pump connected to a hydrophore and controlled by an LC pressure switch. Water flowing from this part of the installation is separated into two streams, one of which is used for watering plants, while the other passes through the water treatment system and then splits into two further streams, one of which is intended for watering horses and the other for washing cars.
Rainwater for treatment goes through a series of treatment devices. It first passes through filter 1 with a 20 μm pore-size polypropylene cartridge (3), then through filter 2 with a 5 μm pore-size polypropylene cartridge (4) and finally through filter 3 with an activated carbon cartridge (5). Microbial contaminants, especially coliform bacteria originating from avian faecal droppings accumulated on the roofs, are removed with a UV disinfection lamp (Eko Technika (Gliwice, Poland) TMA D6, 2.3 m3/h) (6). Because the effectiveness of the lamp is strongly contingent on water clarity, it is located at the end of the treatment train, downstream of the three filters. The amount of water used is measured with two water meters—2A and 2B (Figure 5). Water for watering horses has sufficient pressure, so it flows directly from the treatment system to the drinking troughs. Water for washing cars is run through a pressure washer (Karcher) to produce a higher pressure. As preliminary tests have shown, the UV lamp reaches full disinfection efficiency 2 min after switching on, which is why the impulse from the LC pressure switch turning on the pump has been delayed. As a result, when the minimum pressure in the hydrophore has been reached, the UV lamp turns on, and the pump switches on two minutes later to pump water through the treatment system and refill the hydrophore tank.

2.2. Scope and Methods

Performance tests of the rainwater treatment system were conducted from June to December 2023. They included the determination of selected microbiological and physicochemical contaminants in samples collected once a month from the concrete tank and at the outlet from the treatment system downstream of all the treatment devices. Microbiological assays included total microbial counts at 22 °C and 36 °C and counts of the following bacteria: coliform bacteria, Escherichia coli, faecal enterococci, and Pseudomonas aeruginosa. Organoleptic tests were run to determine the presence of a foreign odour and the threshold odour number (TON). Physicochemical tests included the determination of turbidity, colour, pH, electrical conductivity (specific conductance) at 25 °C, the levels of ammonium ions, nitrates, nitrites, total nitrogen and total phosphorus, and total hardness (CaCO3), as well as the concentrations of chlorides, manganese, iron, silver, copper, sodium, magnesium, boron, barium, cobalt, molybdenum, zinc, arsenic, selenium, antimony, total chromium, aluminium, cadmium, manganese, nickel, lead, and mercury. Water quality tests were performed in accordance with Polish standards in the accredited Research Services Laboratory of the Lublin Cooperative of Dairy Services in Lublin (Laboratorium Usług Badawczych Lubelskiej Spółdzielni Usług Mleczarskich w Lublinie), Poland. A full list of test standards and procedures is given in Table 1.
The water temperature was measured at 0.5 m, 1.0 m, and 1.5 m from the bottom of the rainwater tank. To determine the balance of benefits obtained from the use of rainwater, the consumption of treated rainwater for specific purposes was also determined using water meters 2A and 2B (Figure 5). In addition, the present study reports air temperature and rainfall totals for the RNP obtained from the meteorological station in Zwierzyniec (located 100 m away from the investigated rainwater-harvesting and treatment installation), which operates as part of the Integrated Monitoring of the Natural Environment under the Chief Inspectorate for Environmental Protection.
Since Polish law does not define water quality standards for rainwater intended for watering animals and washing cars, the results of the present study were compared against the limits specified in the Polish Regulations of the Minister of Health of 7 December 2017 on the quality of water intended for human consumption [53].

2.3. Statistical Analysis

The results of the microbiological and physicochemical tests were analysed statistically. Because the values of some parameters were so small as to fall far below the water quality standards and the measurement range of the testing equipment used, a more detailed comparative analysis was only conducted for those parameters for which specific numerical values were obtained. The tables summarise the basic descriptive statistics: minimum, median, mean, and maximum values. Since sample sizes were small (7 observations) and the data often did not follow a normal distribution, the water parameters before treatment (rainwater in the tank) and after treatment were compared using the Wilcoxon matched pair test (a non-parametric test for dependent samples). Time-series plots and boxplots were used to visualise changes in water quality over time in comparison to drinking water standards; only those measurement results for which the largest differences were observed were represented. Moreover, the pollutant removal efficiency of the rainwater treatment system was estimated using Formula (1):
e f f i c i e n c y y = y i n y o u t y i n · 100 %
where y denotes an examined parameter, yin is the value of the parameter y in untreated rainwater from the tank, and yout is the value of the parameter y in treated water sampled at the outlet from the treatment system.
Pearson’s correlation coefficients were also determined between the water temperature at various depths of the tank and the external air temperature. The statistical analysis was carried out using Tibco Statistica v. 14. All statistical tests were considered significant at α = 0.05.

3. Results and Discussion

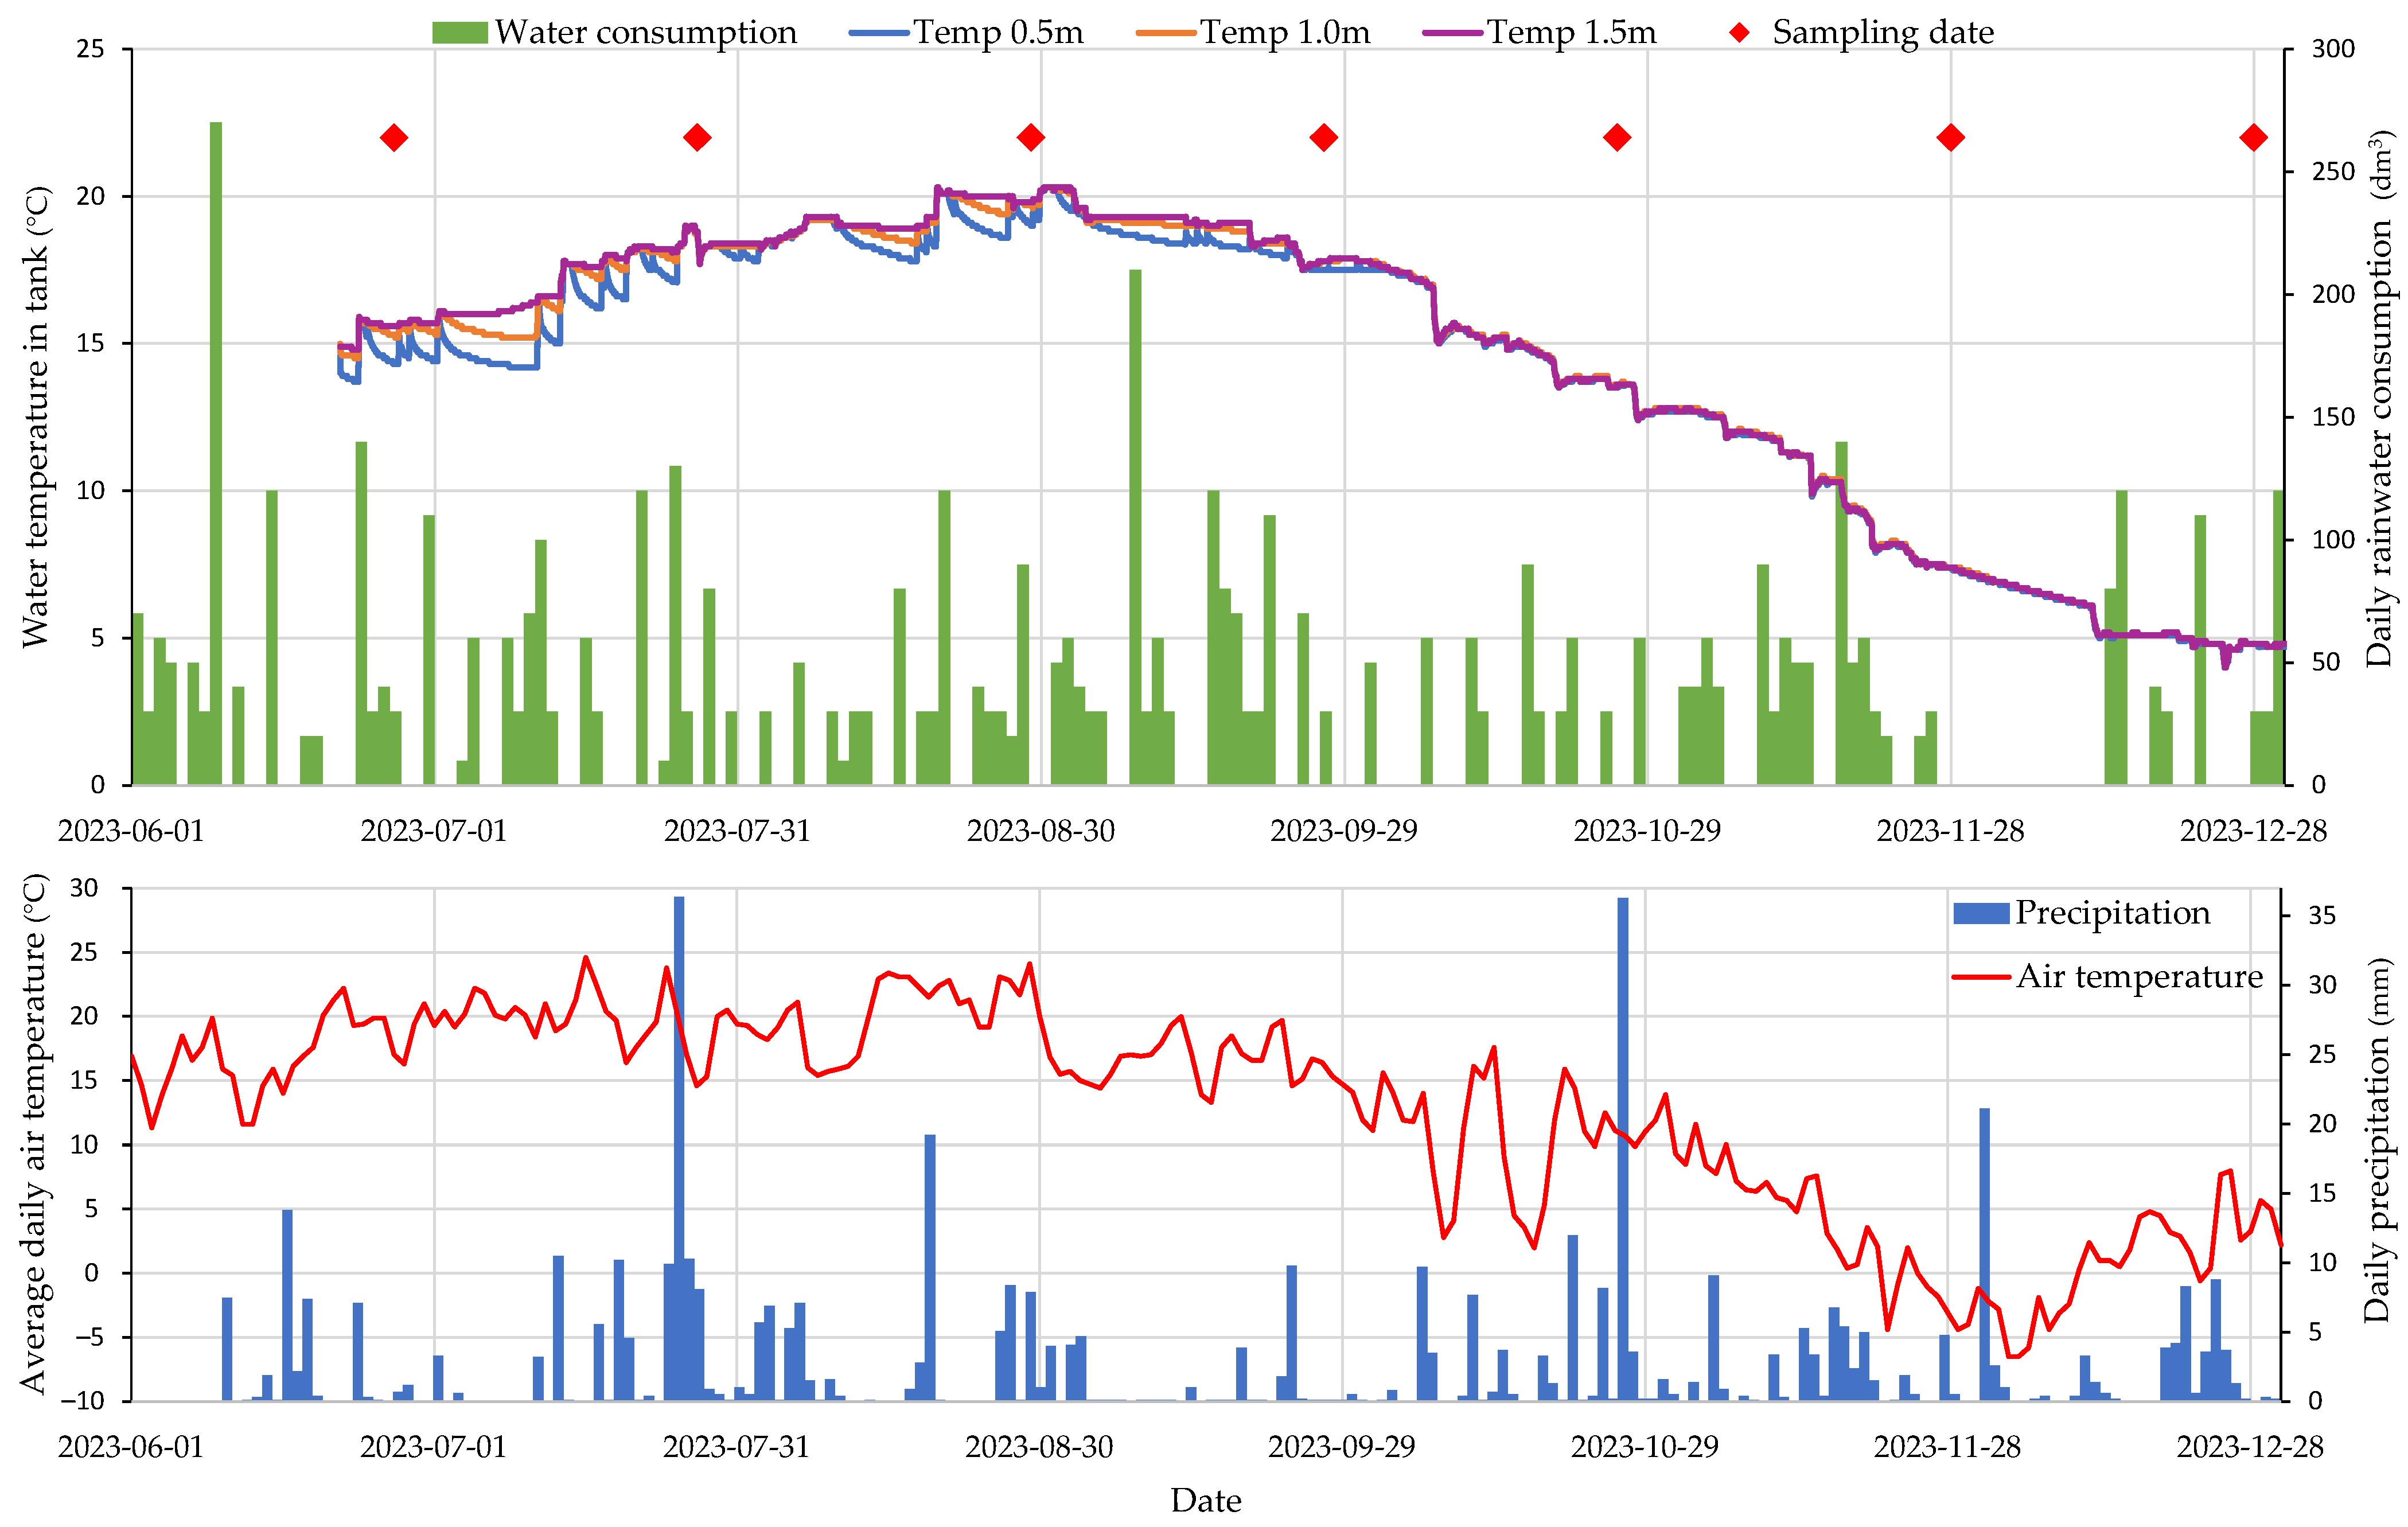
3.1. Precipitation and Air Temperature during the Study Period

A detailed description of the terrain conditions of the area of the RNP can be found in our previous works [2,32].
In 2023, the year of the study, the average annual temperature was 9.7 °C. It was the second warmest year, after 2019 (9.8 °C), on record since 1998, when the Integrated Monitoring of the Natural Environment programme was launched in the RNP. Total precipitation in 2023 (764.3 mm) was slightly (nearly 46 mm) higher than the long-term average (since 1998). In the study period, from June to December 2023, the average temperature was 12.6 °C and the average precipitation was 469.7 mm. Air temperature and precipitation distribution data for 2023 are shown in Table 2.
In the analysed period, June was a relatively cold month. It was 0.5 °C colder than the long-term average. The monthly precipitation total for Zwierzyniec in June was 43 mm (nearly 50%) lower than the long-term average (1998–2023). The month of June closed the first half of the year 2023. Those six months were 1 °C warmer than the average half-yearly temperature for January–June in the years 1998–2023. The precipitation deficit for this half-year period was 11 mm (3%). In the second half of the year, all months were warmer than the long-term average (1998–2023). July and August passed without any weather anomalies. In August, a maximum temperature of 32.8 °C was recorded on the 15th day of the month. It was one of the month’s eleven hottest days, with maximum temperatures exceeding 30 °C. September 2023 was the warmest on record in the RNP (since 1998). With an average monthly temperature of 16.4 °C, it was 3.4 °C warmer than the long-term average for September and 1.4 °C warmer than September 2015, the second-warmest September. Stable, sunny weather prevailed throughout most of the month. As many as 14 days with a maximum temperature above 25 °C were recorded (the highest maximum temperature of 29.4 °C was registered on the 13th day of the month), and night temperatures dropped by no more than 5 °C. There were few rainy days. The monthly precipitation total for September in Zwierzyniec was 27.7 mm, and it was 30.8 mm (over 52%) lower than the long-term average for this month. This trend also continued into the next month, which was the warmest October on record. With an average monthly temperature of 10.8 °C, October 2023 was 0.4 °C warmer than October 2020, the second-warmest October since 1998, and 2.6 °C warmer than the average October in the years 1998–2023. The monthly precipitation total was 94.8 mm, and it was over 43 mm higher than the long-term average for October. November 2023 did not show any weather anomalies, with an average temperature of 3.6 °C and a monthly precipitation total of 54.1 mm. In December 2023, the average temperature was 0.8 °C. It was 1.4 °C warmer than the average December temperature in the years 1998–2023. In the first 10 days of the month, similarly to the end of November, the temperature remained below 0 °C. The frosty and snowy weather lasted until 10 December, with temperatures dropping during the night to −10 °C. Starting from 11 December, there was gradual warming, combined with rainfall. A maximum temperature of 10.5 °C was recorded on Boxing Day, which was one of the four December days with an average temperature exceeding 5 °C. The monthly precipitation total for December 2023 was 65.3 mm, and it was over 20 mm higher than the long-term average for this month [54].

3.2. The Temperature of Rainwater in the Tank

Figure 7 shows changes in the water temperature in the tank at various depths from the bottom of the tank (0.5, 1, 1.5 m), against the background of the average daily external air temperature, daily precipitation, and the consumption of rainwater collected in the tank. The graph also shows the dates on which laboratory analyses of the quality parameters of raw and treated rainwater were performed.
In the colder months (from mid-September on), the water temperature values of the thermometers immersed at different tank levels differed by up to 0.5 °C. The water temperature in the tank also correlated with the external air temperature. The correlation coefficient ranged from 0.84 (for the 0.5 m level) to 0.88 (for the 1.5 m level). However, the graph shows that the shift in water temperature was delayed in relation to air temperature (by approx. 1 month). A more accurate determination of the delay time requires a longer research period.
The water temperature graph also shows peaks correlated with precipitation. In the warm months (June–August), a gradual increase in water temperature was observed on rainy days, when warm rainwater from the hot roofs ran into the tank. The highest temperature increases at the depth of 0.5 m from the bottom of the tank were recorded on 20 July (an increase by 1.52 °C), 25 July (1.34 °C), and 11 July (1.24 °C). After heavy rainfall, the water temperature in the tank was the same at all depths, and then, when there was no rainfall, it gradually decreased in the lower parts of the tank (especially at the bottom of the tank) but remained the same at the shallowest measurement point (1.5 m).
In the cold months (September–December), rainwater flowing into the tank reduced the temperature of the water already present in the tank. At the depth of 0.5 m from the bottom of the tank, the greatest drops in water temperature were recorded on 8 October (a decrease of 1.62 °C), 20 November 20 (0.93 °C), and 14 November (0.9 °C).

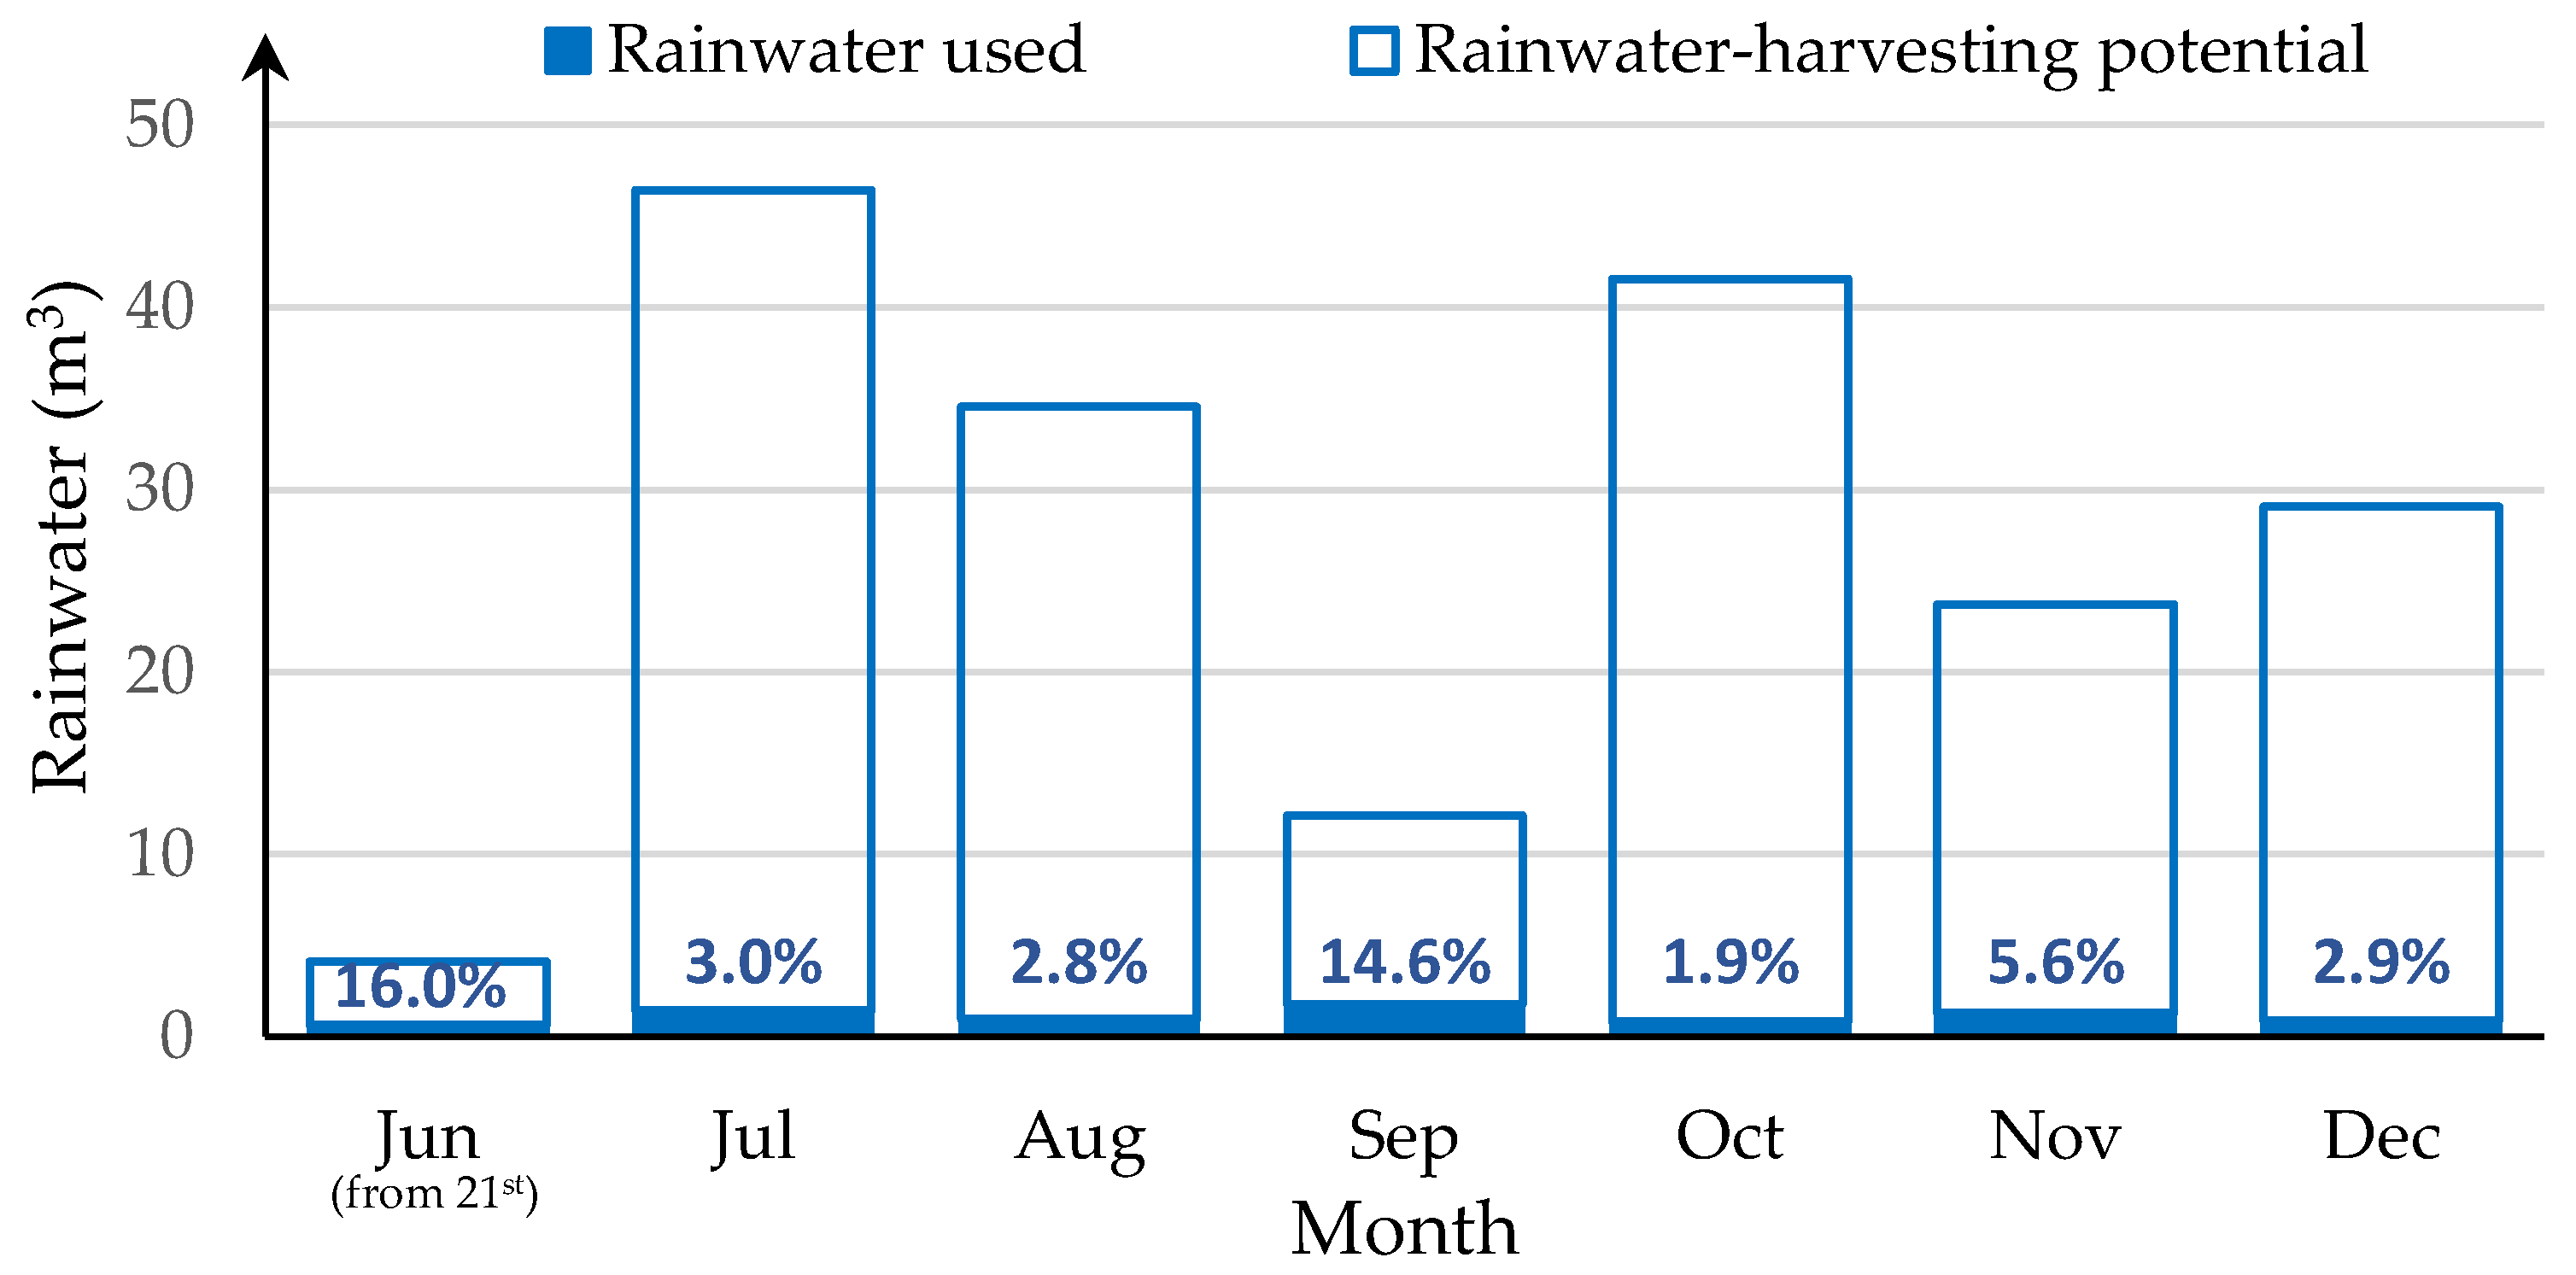
3.3. The Amount of Rainwater and Its Consumption

The amount of rainwater flowing from the roofs of the outbuildings into the tanks was estimated, based on monthly rainfall totals recorded at a nearby meteorological station. We used the formula given in [2], which allows one to determine the amount of rooftop runoff, taking into account the amount of rainfall, roof area (487 m2), and surface runoff coefficient = 0.9. During the study period, the total rainfall was 437 mm, which yielded 191.5 m3 of harvested rainwater. At the same time, readings from water meter 2A (Figure 5) showed that the total water consumption for individual purposes was 7.76 m3, which represented only 4% of the amount of water flowing into the tanks. It is immediately obvious that the surplus of collected rainwater could be used for other purposes.
Figure 8 shows the estimated amounts of water flowing into the tank each month, as well as the amount of water used for washing cars. The largest amounts of influent were recorded in July (46.42 m3) and October (41.55 m3), and the smallest in September (12.14 m3). A small amount was also recorded in June (4.12 m3), because the installation was launched late in that month, and it only operated for a few last days of June. The large amounts of water in July and October theoretically exceeded the capacity of the tank, but there was no risk of overflow, because some of the water was used for washing cars, and excess rainwater ran through the overflow and soaked into the ground.
At that time, according to water meter readings, from 0.81 to 1.77 m3 of rainwater from the tanks was used monthly (except for June). The smallest amounts of water were used in October (0.81 m3) and December (0.84 m3), and the largest in September (1.77 m3), July (1.41 m3), and November (1.32 m3). Overall, only 1.9% to 16% of rainwater from the tanks was utilised. This indicates that there is great potential for additional use of this water.

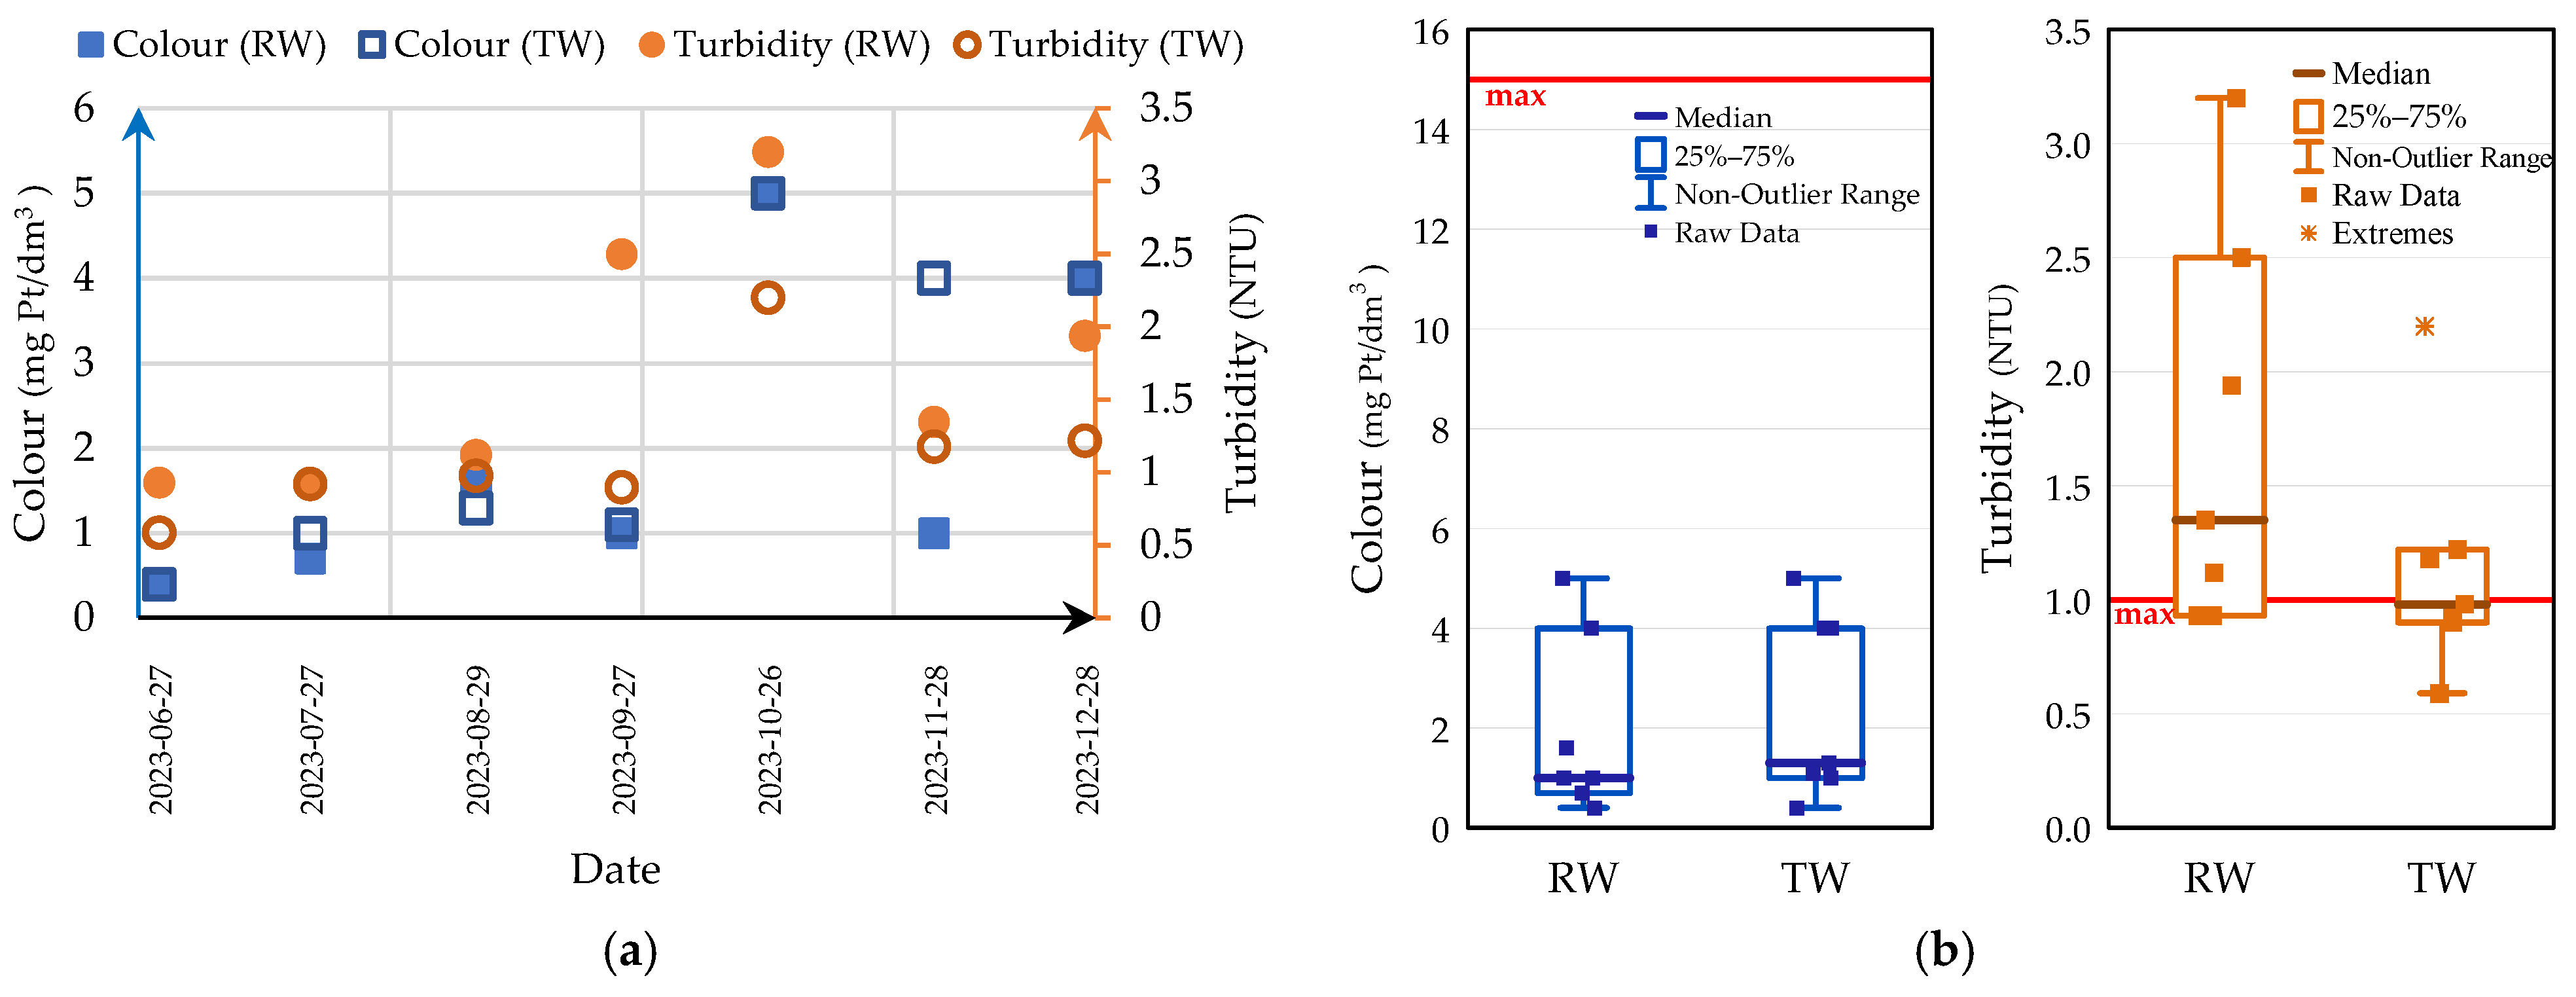
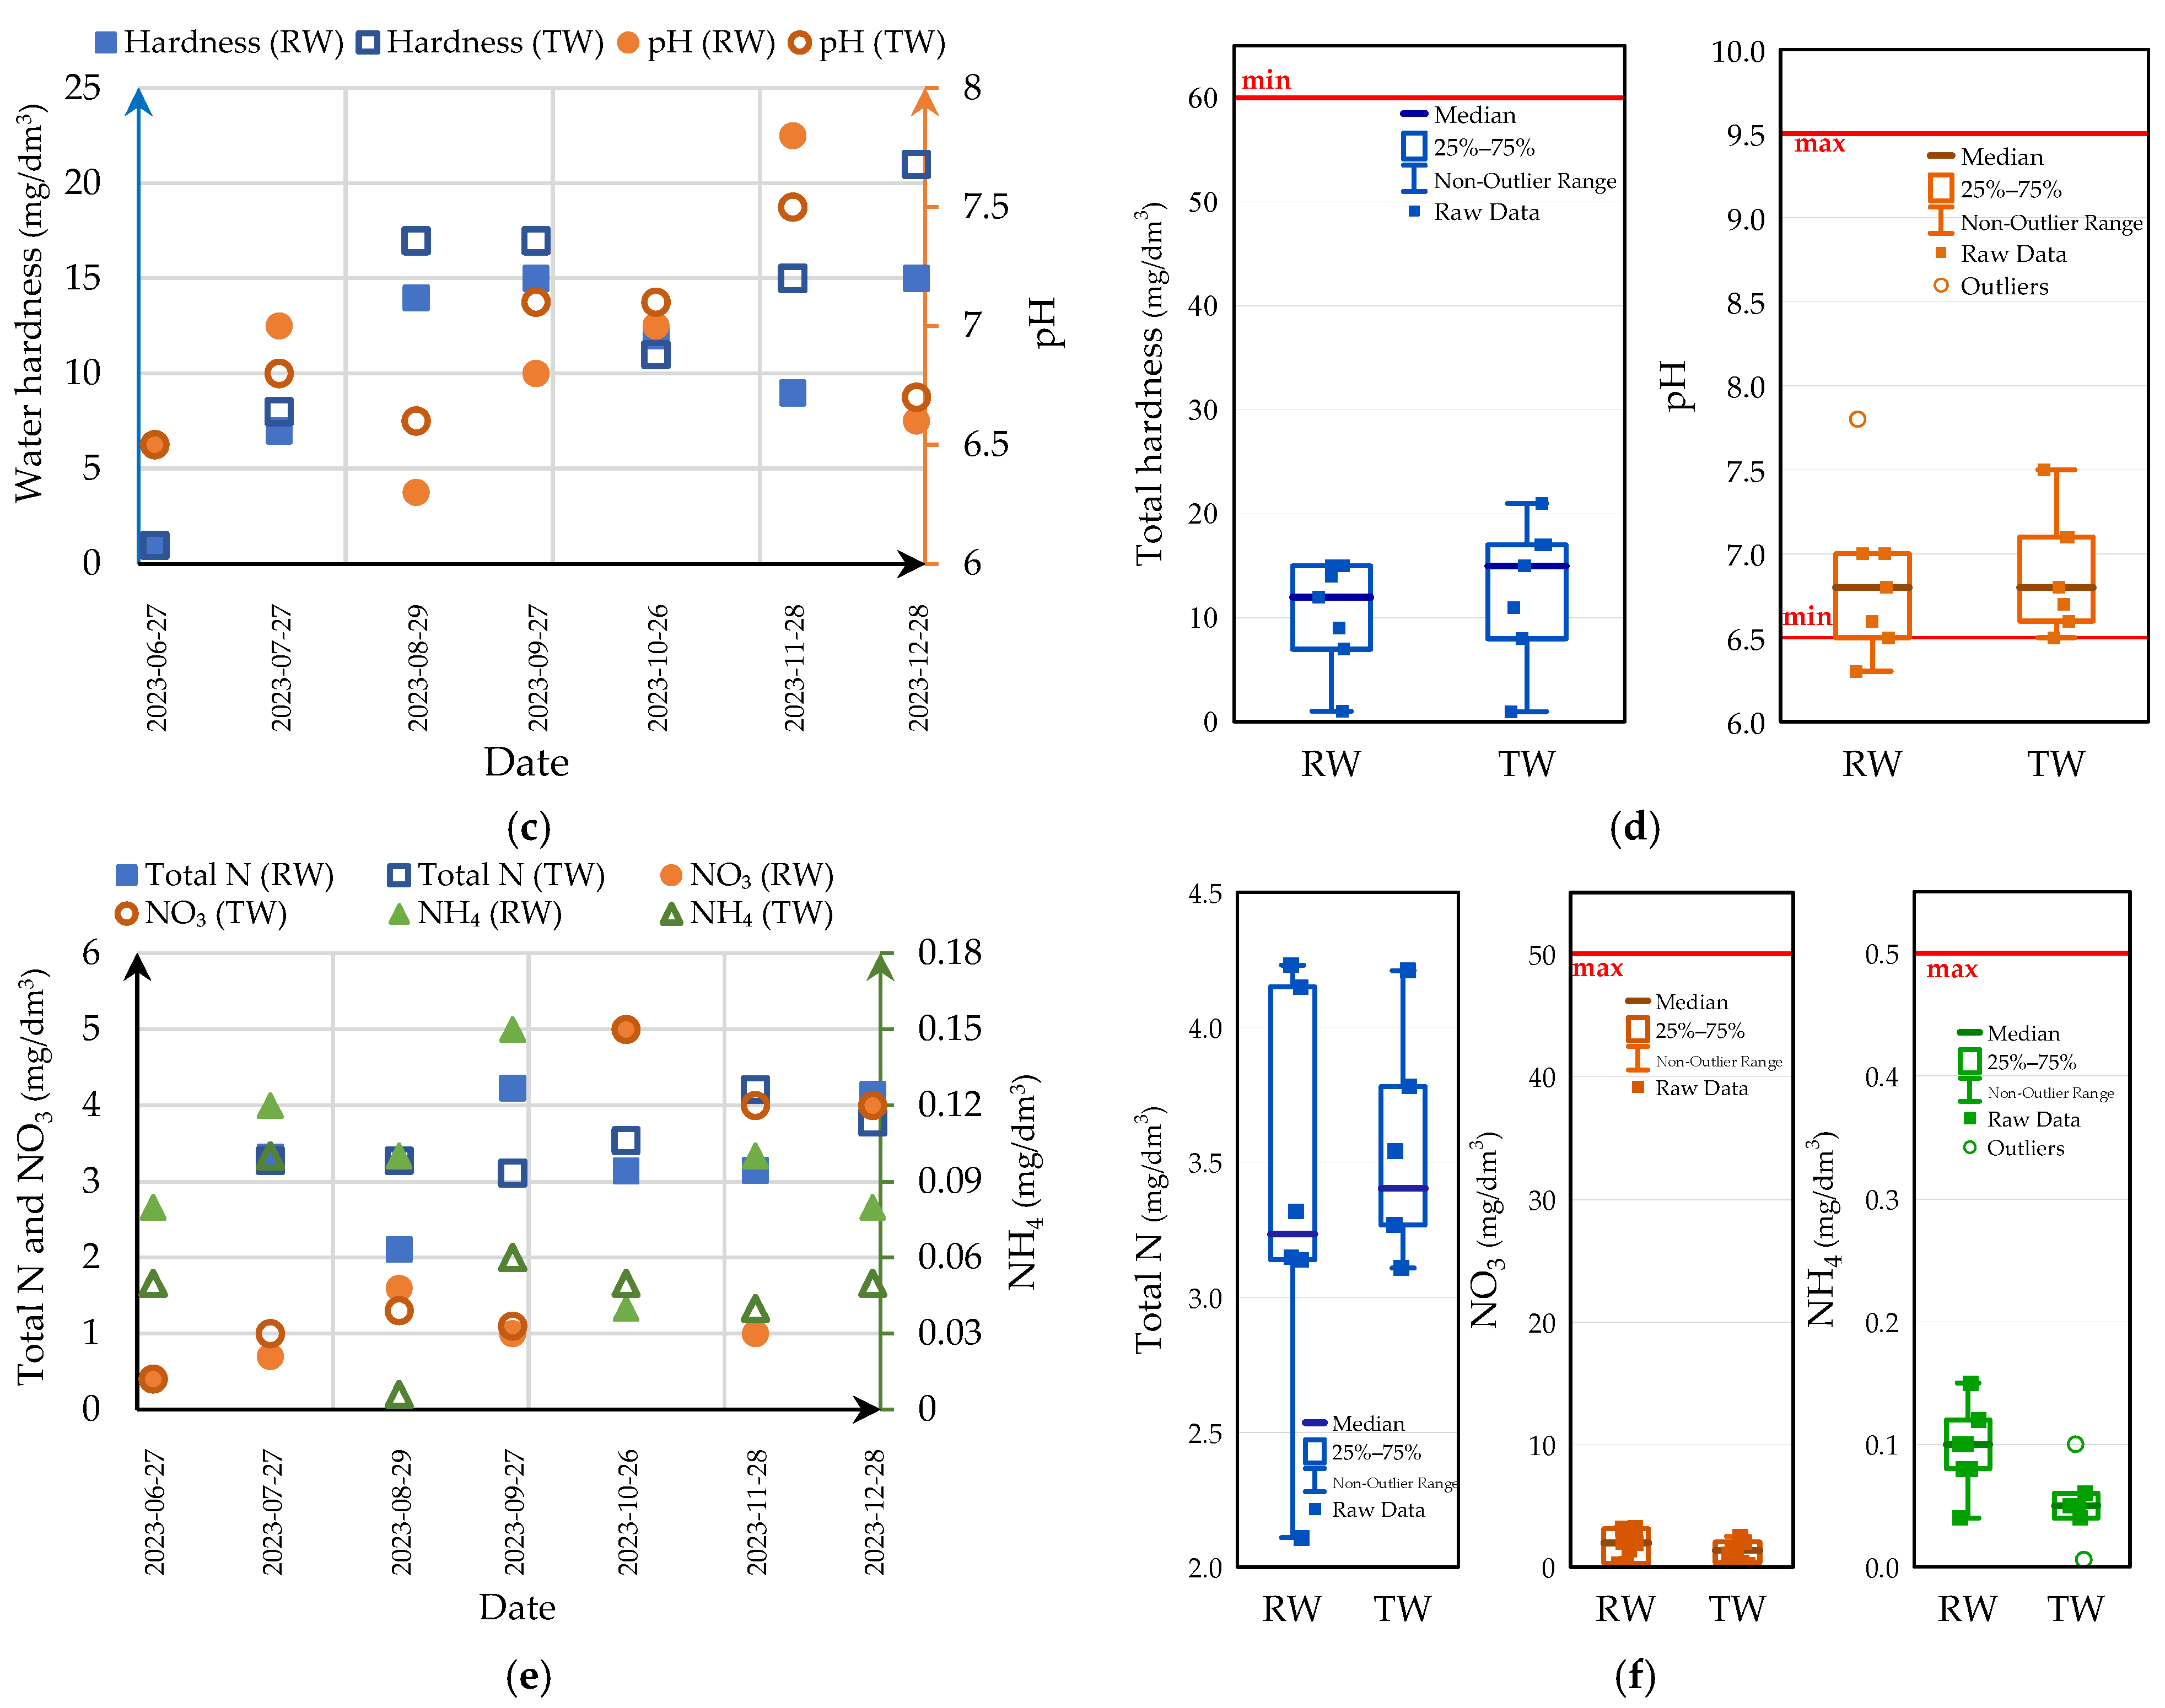
3.4. Quality of Untreated and Treated Rainwater

3.4.1. Organoleptic and Physicochemical Properties of Rainwater

Table 3 provides basic descriptive statistics (minimum, median, mean, maximum, and standard deviation) for the physicochemical parameters of the rainwater before and after treatment. Parameters with values below the measurement threshold are not shown. The last column presents the results of the non-parametric Wilcoxon test for dependent samples, which indicate whether there were statistically significant differences in the values of the parameters tested between the water sampled from the tank and effluent from the installation. The boxplots in Figure 9 show the distributions of the physicochemical parameter values compared against Polish drinking water quality standards [53].
Both raw rainwater from the tank and treated rainwater had very good physicochemical and organoleptic parameters. The Wilcoxon matched pairs test demonstrated that there were no statistically significant differences in the values of the physicochemical parameters between samples of rainwater collected from the tanks and samples of treated rainwater, which confirms that the rainwater generally had very good quality. Samples of effluent from the treatment system showed a statistically significantly lower turbidity (p = 0.018) and contained statistically significantly lower levels of ammonium ions (p = 0.028) and nitrates (p = 0.043) and nearly statistically significantly higher concentrations of nitrites (p = 0.076). Purified rainwater contained significantly higher concentrations of zinc (p = 0.028) and had higher total hardness values (p = 0.076), which were nearly significant.
Its organoleptic parameters, in particular odour and colour, made it suitable for consumption. Increased turbidity was solely observed in samples of raw rainwater from the tank. In treated rainwater, turbidity exceeded the limit value of 1 NTU only in the autumn (Figure 9a,b). It should be emphasised that during this season, rainwater running from the roofs comes into direct contact with falling leaves, which change both its colour and turbidity. According to Zdeb et al. [55], water quality parameters strongly depend on the type of roofing.
pH values ranged from 6.3 to 7.8 in raw rainwater harvested from the roofs and from 6.5 to 7.5 in treated rainwater (Table 3). However, in most cases, pH values were lower than 7, which means the water was slightly acidic (Figure 9c,d). A rainwater pH lower than 7.0 is usually an effect of the presence of increased levels of carbon dioxide, sulphur oxides, and other acidifying gases in the air [56]. In our study, the deviations from the pH value of 7.0 were so small that the water could be classed as having good quality and being suitable for consumption. The pH values of rainwater collected in the RNP in 2023 were similar to those recorded in the years 2021–2022 [32]. In some other reports, however, the rainwater was acidic and unsuitable for use as drinking water. In a study conducted in the Tatra Mountains in Poland [57], the pH of rainwater ranged from 3.4 to 6.42. Samples of rainwater collected in eastern and south-eastern India [58] had pH values in the range of 5.35–6.77.
The concentrations of nitrogen compounds, i.e., total nitrogen and ammonium, nitrite and nitrate nitrogen, at both sampling points were lower than the limits for drinking water (Figure 9e,f). The concentration of ammonium nitrogen in the stored water was lower than in the precipitation itself [59]. Analogous observations can be made regarding iron, manganese, and chloride compounds. In the present study, we observed a significant decrease in the concentration of ammonium nitrogen in treated water (Figure 9e,f). The increased concentrations of ammonium nitrogen in rainwater from the tank were likely caused by the presence of bird droppings on the roofs from which water ran into the tank. Previously, similar observations were made in studies by Evans et al. [60], Jóźwiakowski et al. [30], and Grabowski et al. [32].
Low concentrations of mineral salts, especially calcium and magnesium compounds, resulted in the very low general hardness of the tested rainwater (1–21 mg CaCO3/dm3) (Table 3, Figure 9c,d). Low hardness values (3.3–34 mg CaCO3/dm3) had also been obtained at the same measurement point in the RNP in the years 2021–2022 [32]. Similar findings were reported by researchers from Sri Lanka, in whose study rainwater was characterised by a low hardness of 4–36 mg CaCO3/dm3 [61]. It is widely known that rainwater is soft, and in the present study, rainwater hardness was lower than the 60 mg CaCO3/dm3 limit set in Polish regulations for drinking water for human consumption [53]. In accordance with the recommendations of the World Health Organization and the European Union, rainwater should not be consumed by humans, as its low general hardness poses the risk of various diseases [62].
However, as shown in Australia, many people prefer to use rainwater over tap water, which is chlorinated and fluoridated [63]. Observations conducted by RNP employees show that rainwater is fully safe for animals to drink. The Polish Konik horses living in the park drink rainwater willingly and do not show any negative symptoms associated with its consumption. Particularly interesting findings in this regard have been reported by Krakowski et al. [64]. Although their study does not concern the direct impact of the environment on Polish Konik horses, the conclusions they drew from blood tests clearly suggest that the structure of water and its circulation in the environment (water → soil → photosynthesis → animal) constitute a synergistic system in the ecosystem of the RNP.
Those authors found that the natural environment (which is potentially less favourable) had a positive effect on the immunological and haematological blood parameters in Polish Konik horses (mares). Horses are herbivorous animals, which digest cellulose and other plant components in complex biochemical processes taking place in the large intestine. This organ is responsible for the synthesis of some vitamins, the production of immunological components, and absorption. All these processes require good-quality water with a microbiome. Polish Konik horses are a synergistic part of the ecosystems in which they live. Their diet in the RNP depends on the biochemical composition of plants, which is determined by weather and soil conditions, the structure of land cover, and the quality of groundwater, surface water, and rainwater. The horses absorb carbonates and other mineral compounds that are not found in rainwater directly from the plants they feed on. The herd lives in the park’s “sanctuary” in semi-natural conditions, and they only eat the plants that grow in their natural surroundings. They drink water from natural watering sites with a non-standardised and variable content of microorganisms, anions, and cations. These water bodies include stagnant rainwater in sunken land areas, Stawy Echo (Echo Ponds), and the River Świerszcz.
In Krakowski et al.’s study [64], Polish Konik horses living in natural conditions in the wild had a better immunity than those kept in stables, as indicated by some immunological and haematological blood parameters. Polish Konik horses living in stables are fed with good-quality hay and oats. They are watered with standardised water coming from a groundwater source in Florianka in the RNP [29].
To address potential concerns about the suitability of the rainwater harvested in the park for watering animals, rainwater samples were additionally assayed for concentrations of silver, copper, sodium, magnesium, boron, barium, cobalt, molybdenum, zinc, arsenic, selenium, antimony, total chromium, aluminium, cadmium, nickel, lead, and mercury. None of these parameters exceeded the standards for drinking water.
An analysis of the test results presented in Figure 9a–f indicates that the rainwater had very little colour, much lower than the requirements for drinking water, and that the raw rainwater did not differ significantly in colour from treated rainwater. This is not surprising, because the mechanical filters we used can remove turbidity but not colour. And indeed, the treated rainwater was much less turbid than the raw rainwater (Figure 9b). There was no clear trend regarding the effect of water treatment devices on rainwater hardness and pH (Figure 9c,d), which was not due to the unstable operation of the system but resulted from seasonal changes in water temperature and carbonate transformations caused by the dissolution and desorption of carbon dioxide. Worth noting is the clear decrease in the concentration of ammonium compounds in treated rainwater compared to raw rainwater (Figure 9f). Most probably, ammonium nitrogen was transformed into nitrates as a result of the action of air oxygen on rainwater in the hydrophore. However, the concentrations of nitrogen compounds were too low to yield useful data on the impact of the water treatment system on the transformation of various forms of nitrogen (Figure 9e,f).

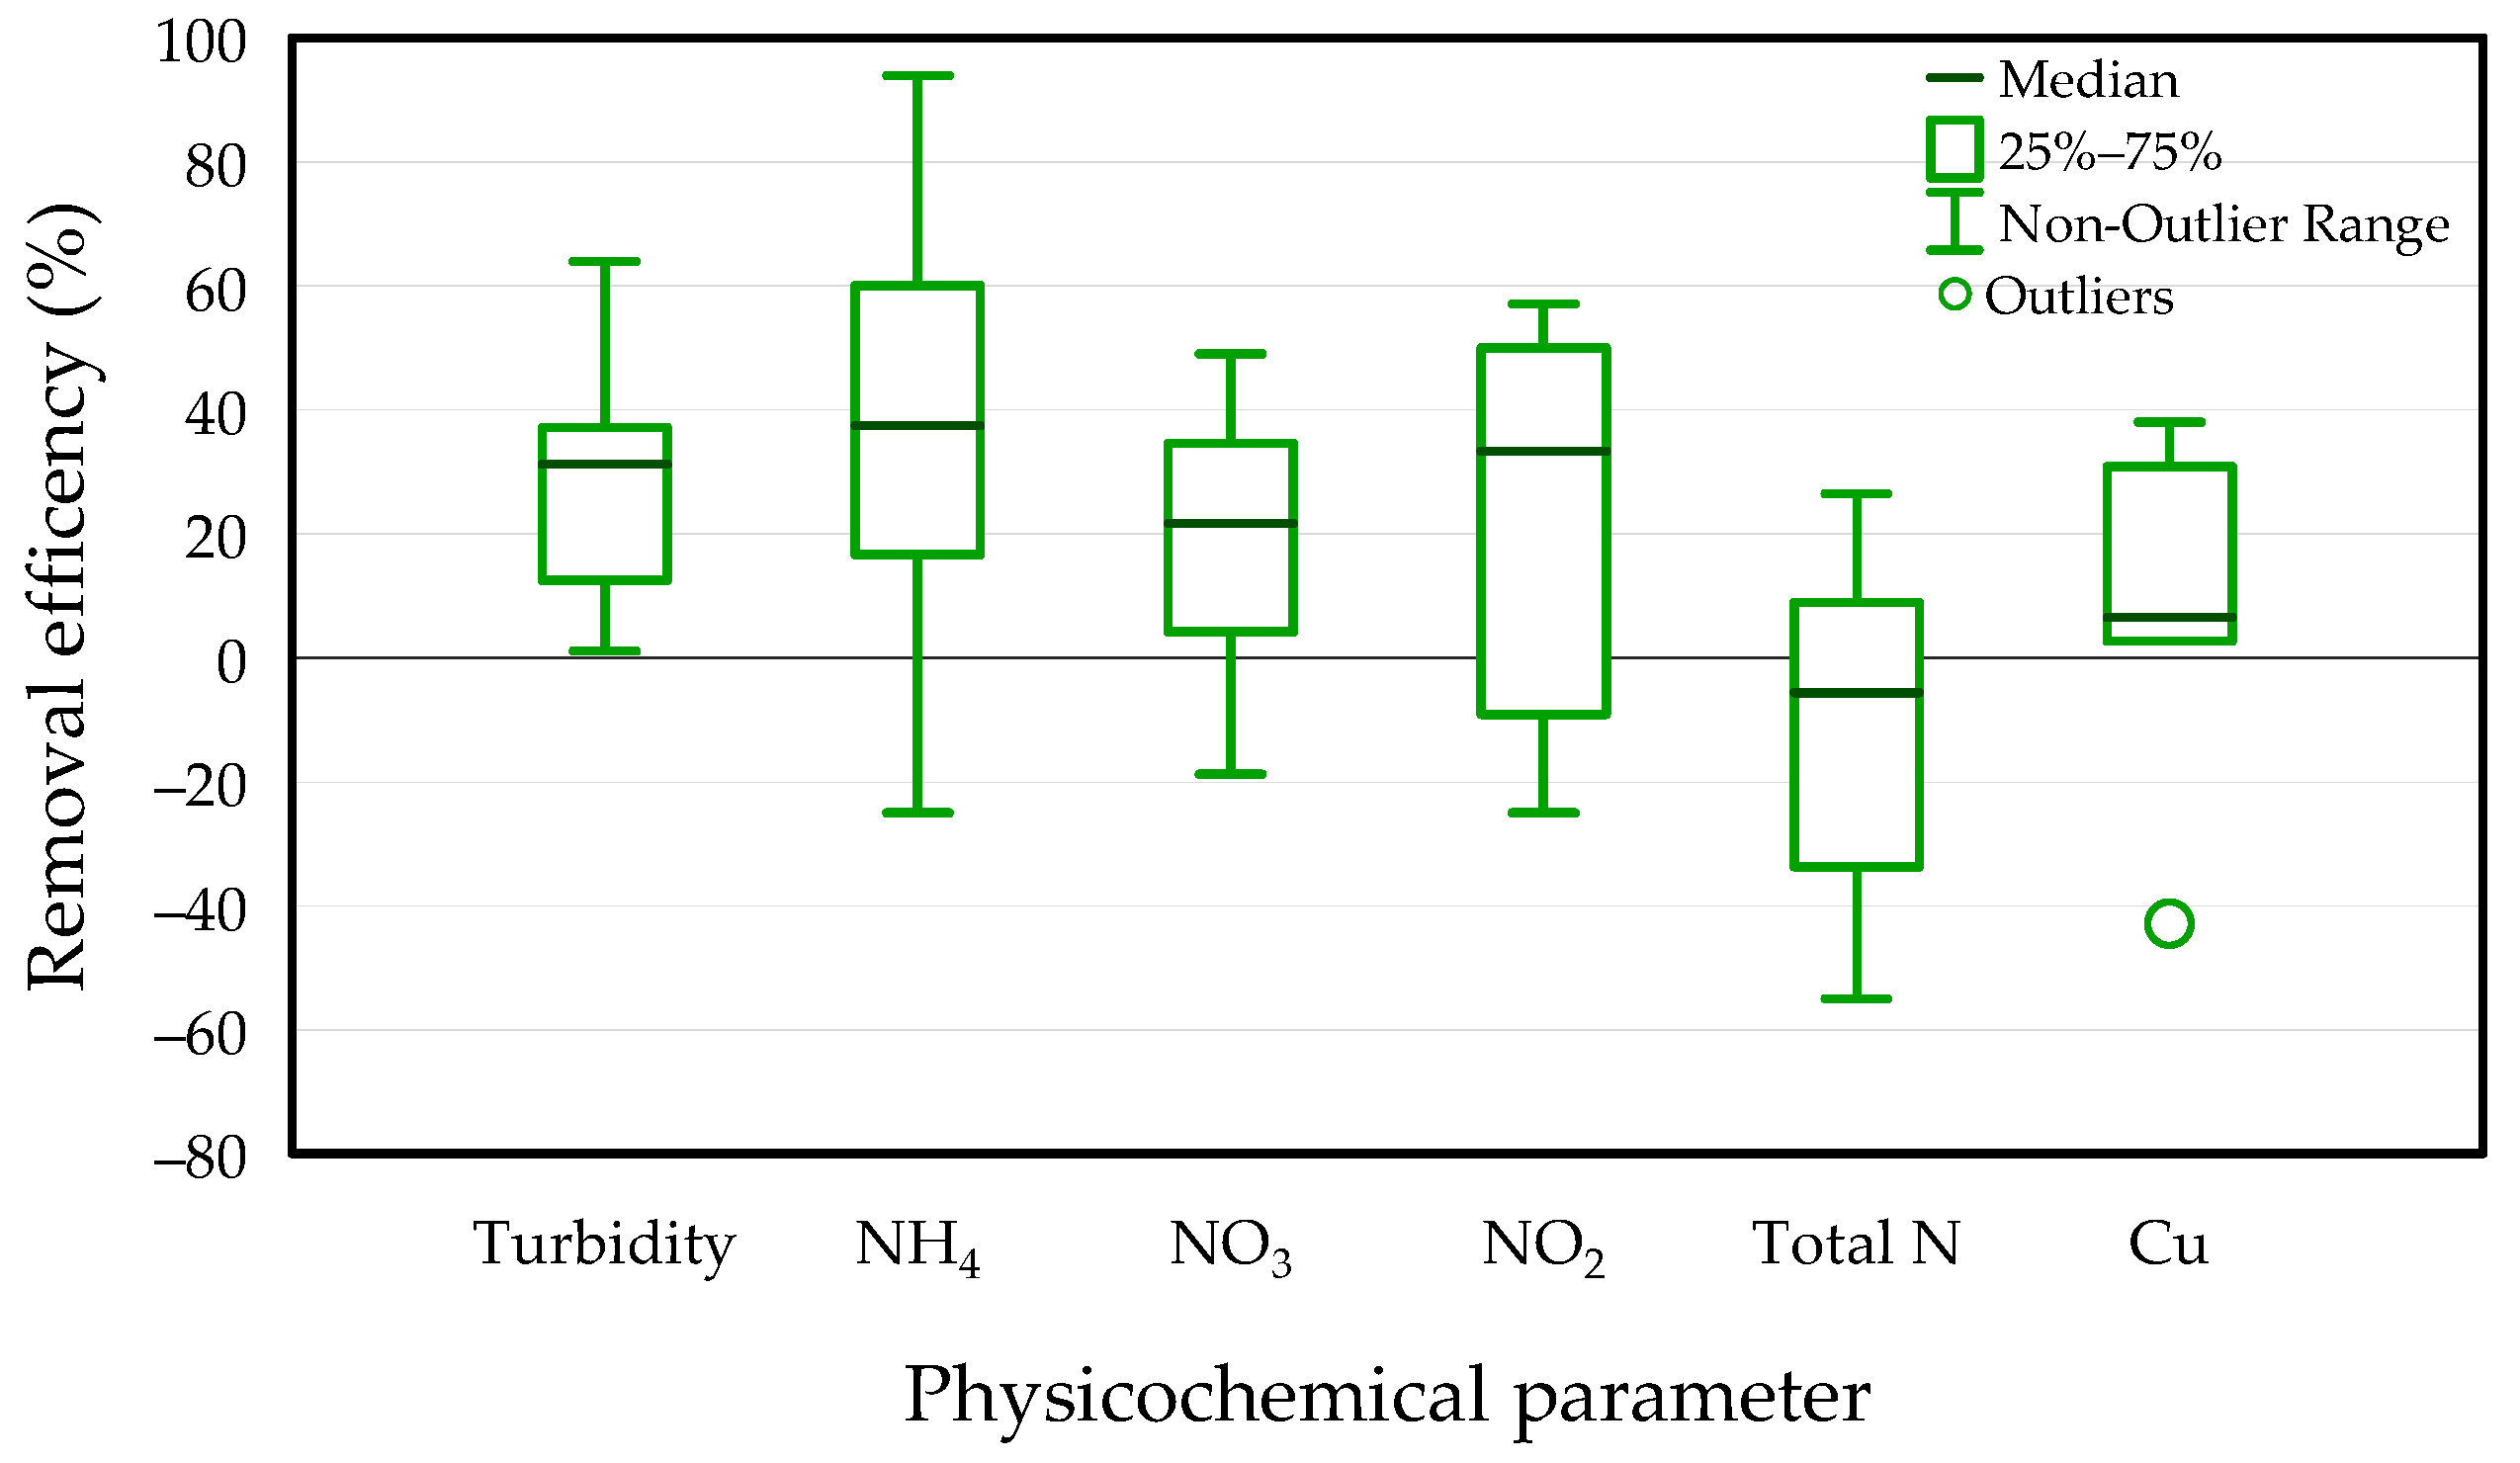
3.4.2. Efficiency of Removal of Selected Physicochemical Contaminants from Harvested Rainwater

Since the investigated facility is located in a legally protected area, the air there is very clean, which translates into a relatively good quality of rainwater. Our assays showed that rainwater harvested in the RNP contained very low concentrations of physicochemical contaminants—much lower than the limits for drinking water. At such low values, analytical errors were inevitable, and they could sometimes generate fluctuations between the results for raw and treated rainwater. Also, the low concentrations of physicochemical pollutants may raise doubts as to whether the treatment train should include filters. However, as shown in Section 3.4.3, filtration is necessary for removing bacteriological contaminants: filtration, especially the reduction of turbidity, increases the effectiveness of the UV lamp.
The efficiency of the entire rainwater treatment system was confirmed by the Wilcoxon test (Table 3), which showed that the values of the most important pollution parameters (turbidity, conductivity, ammonium ion, nitrates, and zinc) in treated water were statistically significantly different from those in raw rainwater. The results for nitrites and general hardness also fell narrowly short of significance and would probably be statistically significant if the sample were larger.
Figure 10 shows changes in the efficiency of the treatment system at removing selected physical and chemical contaminants from rainwater.
The median pollutant removal efficiency of the analysed rainwater treatment system was not very high at 38.8% for ammonia, 29.6% for turbidity, 27.9% for NO2, 19.8% for NO3, and 6.9% for Cu (Figure 10). The low efficiency values can be explained by the low concentrations of these parameters in rainwater from the tank. A similar study on the performance of a rainwater treatment system using various filters was performed by Teixeira and Ghisi [65]. These authors demonstrated that a sand filter removed turbidity, ammonia, and nitrates at efficiencies of 13, 34, and 10%, respectively. To compare, a membrane filter removed 11, 32.1, and 13.6% of those contaminants. Other authors [66] found that the use of filters with expanded clay (ceramsite) and activated carbon did not ensure a very high efficiency of removing nitrogen compounds. Our results and the literature data both indicate that in rainwater treatment systems, filtration processes should be followed by disinfection, which provides the effective elimination of microbiological contaminants.

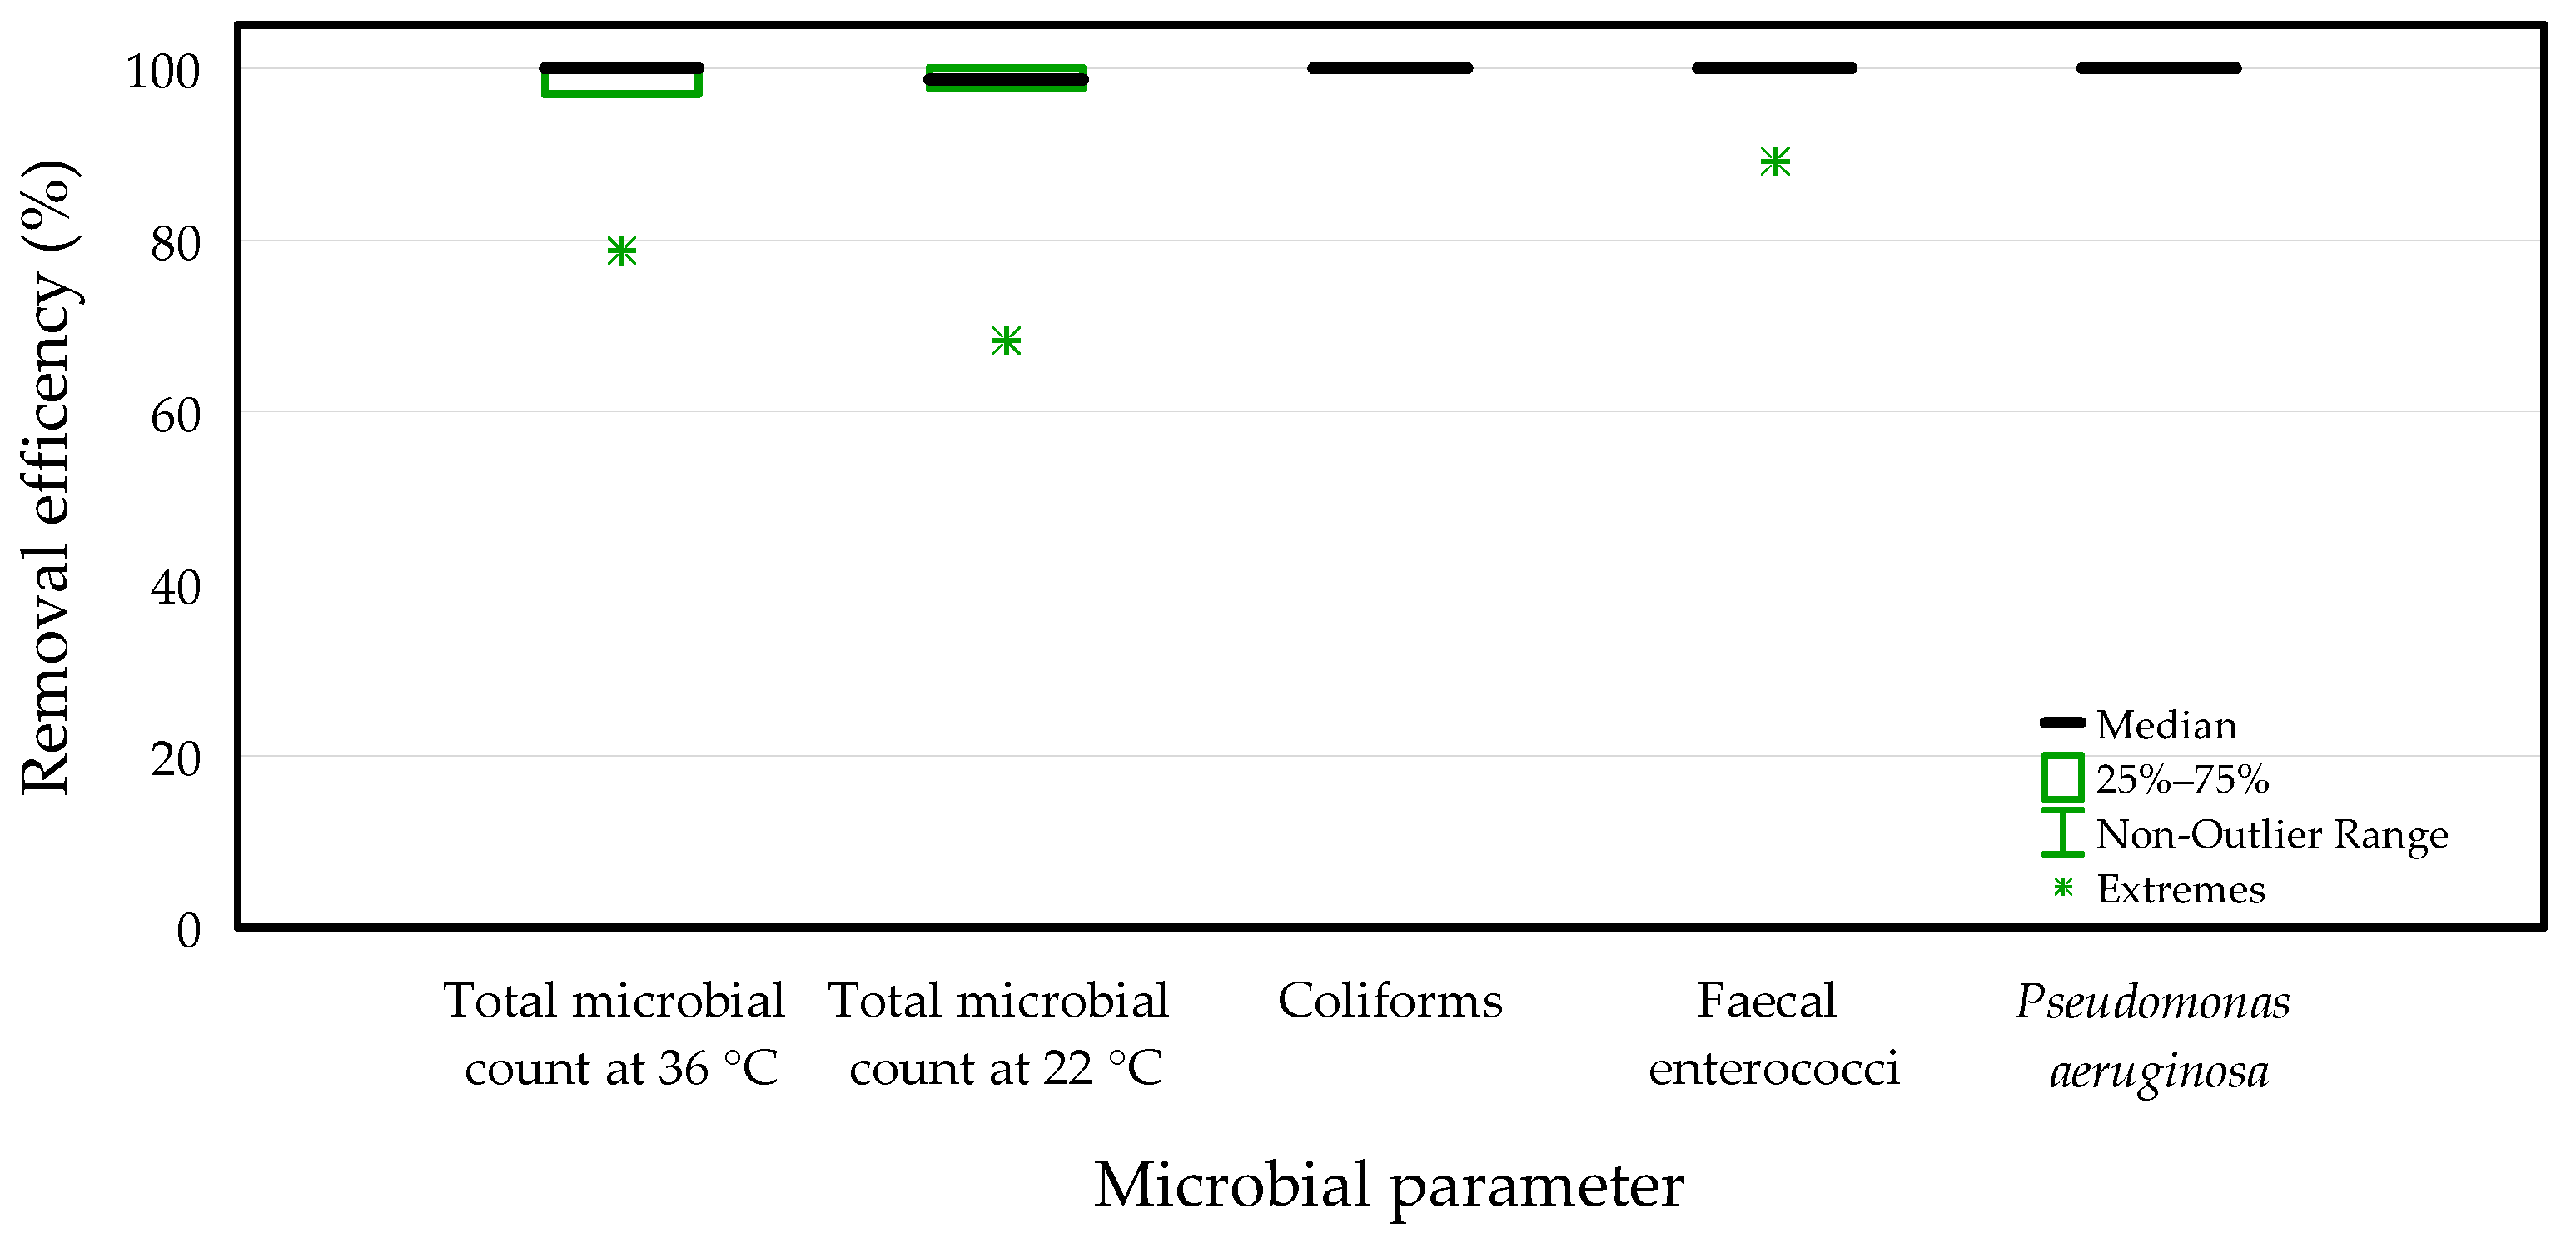
3.4.3. Microbiological Properties of Rainwater

Table 4 gives basic descriptive statistics (minimum, median, mean, maximum, and standard deviation) of selected microbiological contaminants found in the tested rainwater before and after treatment. The last column presents the results of the non-parametric Wilcoxon test for dependent samples, which indicate whether the contaminant levels in samples of raw rainwater and treated rainwater were statistically different. The boxplots (Figure 11) present the distributions of the obtained microbiological contaminant values compared against Polish drinking water quality standards [53]. In the boxplots for total microbial counts, values are expressed on a logarithmic scale for clearer reference to the standard limit. Graphs are only shown for parameters for which mostly non-zero values were recorded.
The microbial quality of rainwater in the tanks showed quite a large variability, caused by periodic water runoff from the roofs. The large volume of the tanks (20 m3) partially mitigated those abrupt changes in water quality, but fluctuations, especially in the content of microbiological contaminants, were still visible. Rainwater samples were tested for the presence of two types of microorganisms normally found in natural waters and the environment: psychrophilic bacteria, growing at ambient temperatures (approx. 22 °C and below), and mesophilic bacteria, growing at temperatures above 36 °C. The counts of both types of microorganisms were statistically significantly lower in treated water (Wilcoxon test p = 0.018).
Faecal bacteria, such as E. coli, coliform bacteria, faecal enterococci, and P. aeruginosa, were also assayed. A statistically significant reduction was only observed for faecal enterococci (p = 0.018), because generally few samples, even those collected from the tanks, were contaminated with these bacteria. Rooftop runoff is contaminated with dust and avian faecal droppings. Contamination with these pollutants is quantitatively and qualitatively variable in close correlation with rainfall and snowfall. In the case of snowmelt runoff, there is obviously a time shift associated with air temperature.
The mixing of fresh rainwater and snowmelt runoff with water in the tanks leads to the averaging of its composition, with various biological, physical, and chemical processes taking place inside the water mass. The darkness inside the tank does not favour the development of photosynthetic microorganisms, hence the water does not contain algae. The diverse composition of rainwater is also related to the aerobic processes taking place in its upper layer, which comes into direct contact with air, as well as the hypoxic or anaerobic processes taking place in the bottom water layer.
It was shown that the total microbial count in the raw rainwater was in the range of 78–14,000 cfu/cm3 at 22 °C and 120–23,000 cfu/cm3 at 36 °C. Raw rainwater flowing from the roof either contained small amounts of E. coli or was free of these bacteria. It contained 1–48 cfu/100 cm3 of faecal enterococci and 0–38 cfu/100 cm3 of P. aeruginosa. Similar microbial counts were recorded in rainwater harvested from roofs at the two measurement points in the RNP in the years 2021–2022 [32]. A related study on the quality and treatment of harvested rooftop runoff was carried out in a facility located in south-eastern Poland in the Carpathian Foothills [67]. In that study, the total microbial count in raw rainwater was in the rage of 390–12,200 cfu/cm3 at 20 °C, and 90–16,000 cfu/cm3 at 37 °C. Moreover, these waters contained 0–98 cfu/100 cm3 of faecal enterococci and 0–91 cfu/100 cm3 of E. coli. The results of our own research and data from the literature indicate that raw rainwater does not meet microbial standards for drinking water [53]. This is probably due to the presence of avian faecal droppings in rainwater harvested from rooftops, as mentioned in previous studies [30,31,32,68,69]. The disinfection efficacy of different types of UV lamps has been confirmed by other researchers [70].
Our experiments demonstrated that treatment of rainwater in the investigated system considerably reduced the counts of all microbiological parameters tested, as shown in Table 4 and Figure 11a–d. The total microbial count was in the range of 0–420 cfu/cm3 at 22 °C and 0–520 cfu/cm3 at 36 °C. The number of faecal enterococci ranged from 0 to 4 cfu/100 cm3. Rainwater treated in the facility was free of coliform bacteria, E. coli, and P. aeruginosa. A similar study of a rainwater treatment system using preliminary filtration, ultrafiltration, and UV disinfection was conducted by Zdeb and Papciak [67]. Those authors obtained total microbial counts for purified rainwater in the range of 4–650 cfu/cm3 at 20 °C and 1–220 cfu/cm3 at 37 °C. Moreover, their rainwater samples contained 0–1 cfu/100 cm3 of E. coli-type bacteria and were free of faecal enterococci.

3.4.4. Efficiency of Removal of Microbiological Contaminants

As Table 4 clearly shows, the counts of psychrophilic and mesophilic bacteria in water sampled from the tanks vary greatly and range from several to several thousand. Despite such large bacterial counts, the treatment system used, especially the bactericidal effect of the UV lamp, turned out to be very effective. For many water samples collected at the outlet from the treatment train, the disinfection efficiency was very high, in the range of approximately 98% to 100% (Figure 12). Incidentally, in August, the effectiveness of the removal of psychrophilic bacteria and mesophilic bacteria dropped to 78.8% and 68.3%, respectively. This is surprising since the water from the tank contained only 160 cfu/cm3 of psychrophilic bacteria and 120 cfu/cm3 of mesophilic bacteria at that time. Small counts of E. coli and coliform bacteria were only recorded in the water from the tank in November and were completely absent in samples of treated rainwater. Faecal enterococci were found in samples from the tank in counts of several dozen organisms. Water treatment, and especially disinfection, was so effective that only four faecal enterococci were detected in treated rainwater in the sample taken in August. Similarly to coliform bacteria, P. aeruginosa bacteria were recorded in a tank water sample in September 2023 but were not found in treated water samples.
As regards the overall performance of the rainwater treatment system, the median efficiency over the entire measurement period was 99.3% for psychrophilic bacteria and 98.6% for mesophilic bacteria. The installation used eliminated 100% of E. coli, faecal enterococci, and P. aeruginosa (Figure 12). To sum up, the application of a rainwater treatment system using filtration processes and a UV lamp has shown that this technology is quite effective and provides an effluent suitable for use in technical and agricultural applications and animal breeding. Additionally, the system can be regulated by changing the flow rate and thus the energy dose. It is known from the literature that the effectiveness of disinfection expressed in logarithmic form is a linear function of the radiation dose [71] and depends on the UV lamp used, or more precisely on its wavelength [72].
The effectiveness of the tested rainwater treatment system was confirmed by the Wilcoxon test (Table 4), which showed that the levels of the most important bacterial contaminants had been statistically significantly reduced during treatment. In the case of P. aeruginosa, no statistically significant differences were found between influent and effluent samples, because very few raw rainwater samples were contaminated with these bacteria. Contamination with coliforms and E. coli was observed only once or not at all, respectively, so the statistical test could not calculate p-values.

4. Conclusions

The aim of this paper was to determine the efficiency of a rainwater treatment installation located near the farm buildings of Roztocze National Park (RNP), Poland. The treatment system, consisting of two polypropylene filters, one activated carbon filter, and a UV lamp, was tested. The study shows that average efficiency of pollutant removal in the analysed stormwater treatment system was not very high and amounted to 38.8% for ammonia, 29.6% for turbidity, 27.9% for NO2, 19.8% for NO3, and 6.9% for Cu. These low efficiency values can be explained by low concentrations of these parameters in rainwater from the reservoir. The efficiency of removing microbiological contaminants was very high and ranged mostly from approximately 98% to 100%. It was shown that the UV lamp ensures a very good disinfection of rainwater. The rainwater treated using filtration and disinfection (UV lamp) can be used for watering the Polish Konik horses living in the park, as well as for washing vehicles, watering green areas, or flushing toilets. Excess rainwater can be used to replenish water in amphibian breeding sites.
Research on the utilisation of rainwater for various purposes has shown that the use of a well-thought-out treatment system with a tank of an appropriate volume can substantially reduce the consumption of tap water. Obviously, rainwater can be used for watering green areas without any treatment; however, purification allows one to harness it for other purposes, such as watering animals. The implementation of this type of solution is particularly important in the context of climate change, as it can prevent the lowering of the groundwater table.
It is worth emphasising that the application of a three-stage filtration system with a UV disinfection lamp provides an effluent that can be used for watering animals (e.g., Polish Konik horses in the RNP) and for washing vehicles. Factors that hinder the use of treated rainwater for human consumption include its low hardness and the incidental presence of various types of microbial contaminants. Nevertheless, the tests we performed showed that rainwater quality parameters can be improved through treatment and that this requires minor modifications to the treatment process. One of the most important findings of the present study is that the rainwater harvested in the park does not contain heavy metals, and the concentrations of iron, manganese, nitrogen compounds, and phosphorus are low. Therefore, as a natural next step, properly treated rainwater can be used for flushing toilets and doing the laundry, where low water hardness is a large advantage.
As has been shown, the use of a concrete tank buried in the ground has a positive effect on the stability of water temperature, which prevents uncontrolled chemical and biological processes. Large-capacity tanks help mitigate water temperature issues in extremely adverse conditions—e.g., when runoff from a roof is very hot after a long drought, or conversely, when it is very cold after a sudden rainfall or when it comes from melting snow. Additionally, the lack of light in the tank prevents the growth of algae and various microorganisms, which, if uncontrolled, could interfere with the operation of the filtration set used for water treatment.
The present study demonstrates that rainwater can be harnessed to water Polish Konik horses in Roztocze National Park and can be successfully utilised in other places where water deficits may occur, especially in protected areas.
The results presented in this paper will be helpful for the design and construction of a new rainwater management system in the RNP’s Animal Breeding Centre, which is planned to produce water, among other things, for watering the Polish Konik horses inhabiting the park.

Author Contributions

Conceptualisation, T.G., T.S. and K.J.; methodology, T.G., T.S., K.J. and A.B.; software, T.G. and A.B.; validation, T.G., T.S., K.J. and A.B.; formal analysis, T.G. and A.B.; investigation, T.G.; resources, T.G.; data curation, T.G.; writing—original draft preparation, T.G., T.S., K.J. and A.B.; writing—review and editing, T.G., K.J., T.S. and A.B.; visualisation, T.G., T.S. and A.B.; supervision, T.G., A.B. and K.J.; project administration, T.G. and K.J.; funding acquisition, T.G. and K.J. All authors have read and agreed to the published version of the manuscript.

Funding

The paper was written as part of a PhD thesis entitled “Development and implementation of a system for the collection and use of rainwater for watering animals in the Roztocze National Park” prepared by Tadeusz Grabowski. The study was funded by project no. DWD/4/88/2020, financed by the Ministry of Education and Science (Ministerstwo Edukacji i Nauki, Poland).

Institutional Review Board Statement

Not applicable.

Informed Consent Statement

Not applicable.

Data Availability Statement

Data are contained within the article.

Acknowledgments

This paper is a result of cooperation between Roztocze National Park (RNP) based in Zwierzyniec, the University of Life Sciences in Lublin, and Maria Curie Skłodowska University in Lublin (UMCS). The authors would like to thank the director and staff of the RNP for establishing a climate for creative work. Special thanks are given to the staff of the RNP Integrated Environmental Monitoring Base Station and the staff of the Department of Hydrology and Climatology of Maria Curie-Skłodowska University (UMCS) for many years of research on the natural environment of Roztocze and the RNP and for their kindness and assistance in compiling this paper.

Conflicts of Interest

The authors declare no conflicts of interest.

References

  1. Dragomir, V.D.; Dumitru, M. The state of the research on circular economy in the European Union: A bibliometric review. Clean. Waste Syst. 2024, 7, 100127. [Google Scholar] [CrossRef]
  2. Grabowski, T.; Jóźwiakowski, K.; Bochniak, A.; Micek, A. Changes in the Amount of Rainwater in the Roztocze National Park (Poland) in 2001–2020 and the Possibility of Using Rainwater in the Context of Ongoing Climate Variability. Water 2022, 14, 1334. [Google Scholar] [CrossRef]
  3. Bruins, H.J.; Evenari, M.; Nessler, U. Rainwater-harvesting agriculture for food production in arid zones: The challenge of the African famine. Appl. Geogr. 1986, 6, 13–32. [Google Scholar] [CrossRef]
  4. Palla, A.; Gnecco, I.; Lanza, L.G.; La Barbera, P. Performance analysis of domestic rainwater harvesting systems under various European climate zones. Resour. Conserv. Recycl. 2012, 62, 71–80. [Google Scholar] [CrossRef]
  5. Musayev, S.; Burgess, E.; Mellor, J. A global performance assessment of rainwater harvesting under climate change. Resour. Conserv. Recycl. 2018, 132, 62–70. [Google Scholar] [CrossRef]
  6. Raimondi, A.; Quinn, R.; Abhijith, G.R.; Becciu, G.; Ostfeld, A. Rainwater Harvesting and Treatment: State of the Art and Perspectives. Water 2023, 15, 1518. [Google Scholar] [CrossRef]
  7. Kałamucka, W.; Grabowski, T. The System of Protected Areas of the Roztocze in Poland and Ukraine and the Sustainable Development of the Region; Roztocze National Park: Zamość, Poland, 2021; p. 382. ISBN 978-83-954586-0-6. (In Polish) [Google Scholar]
  8. Economic Observer. Available online: https://www.obserwatorgospodarczy.pl (accessed on 20 May 2024).
  9. General Statistical Office. Available online: https://www.stat.gov.pl (accessed on 20 May 2024).
  10. Wartalska, K.; Grzegorzek, M.; Bełcik, M.; Wdowikowski, M.; Kolanek, A.; Niemierka, E.; Jadwiszczak, P.; Kaźmierczak, B. The Potential of RainWater Harvesting Systems in Europe—Current State of Art and Future Perspectives. Water Resour. Manag. 2024. [Google Scholar] [CrossRef]
  11. Dallman, S.; Chaudhry, A.M.; Muleta, M.K.; Lee, J. Is Rainwater Harvesting Worthwhile? A Benefit–Cost Analysis. J. Water Resour. Plan. Manag. 2021, 147, 4. [Google Scholar] [CrossRef]
  12. Jin, Y.; Lee, S.; Kang, T.; Park, J.; Kim, Y. Capacity optimization of Rainwater Harvesting systems based on a cost-benefit analysis: A Financial Support Program Review and Parametric Sensitivity Analysis. Water 2023, 15, 186. [Google Scholar] [CrossRef]
  13. de Sá Silva, A.C.R.; Bimbato, A.M.; Balestieri, J.A.P.; Vilanova, M.R.N. Exploring environmental, economic and social aspects of rainwater harvesting systems: A review. Sustain. Cities Soc. 2022, 76, 103475. [Google Scholar] [CrossRef]
  14. Herrmann, T.; Schmida, U. Rainwater utilisation in Germany: Efficiency dimensioning, hydraulic and environmental aspects. Urban Water 1999, 1, 307–316. [Google Scholar] [CrossRef]
  15. Sazakli, E.; Alexopoulos, A.; Leotsinidis, M. Rainwater harvesting, quality assessment and utilization in Kefalonia Island, Greece. Water Res. 2007, 41, 2039–2047. [Google Scholar] [CrossRef]
  16. Ghisi, E.; Bressan, D.L.; Martini, M. Rainwater tank capacity and potential for potable water savings by using rainwater in the residential sector of southeastern Brazil. Build. Environ. 2007, 42, 1654–1666. [Google Scholar] [CrossRef]
  17. Zhang, Y.; Chen, D.; Chen, L.; Ashbolt, S. Potential for rainwater use in high-rise buildings in Australian cities. J. Environ. Manag. 2009, 91, 222–226. [Google Scholar] [CrossRef] [PubMed]
  18. Abdulla, F.A.; Al-Shareef, A.W. Roof rainwater harvesting systems for household water supply in Jordan? Desalination 2009, 243, 195–207. [Google Scholar] [CrossRef]
  19. Semaan, M.; Day, S.D.; Garvin, M.; Ramakrishnan, N.; Pearce, A. Optimal sizing of rainwater harvesting systems for domestic water usages: A systematic literature review. Resour. Conserv. Recycl. 2020, 6, 100033. [Google Scholar] [CrossRef]
  20. Kim, Y.; Han, M.; Kabubi, J.; Sohn, H.G.; Nguyen, D.C. Community-based rainwater harvesting (CB-RWH) to supply drinking water in developing countries: Lessons learned from case studies in Africa and Asia. Water Supply 2016, 16, 1110–1121. [Google Scholar] [CrossRef]
  21. Kumar, S.; Agarwal, A.; Ganapathy, A.; Villuri, V.G.K.; Pasupuleti, S.; Kumar, D.; Kaushal, D.R.; Gosain, A.K.; Sivakumar, B. Impact of climate change on stormwater drainage in urban areas. Stoch. Environ. Res. Risk Assess. 2022, 36, 77–96. [Google Scholar] [CrossRef]
  22. Carollo, M.; Butera, I.; Revelli, R. Rainwater Harvesting Potential: The Turin Case for an Analysis at the Urban Scale. In Proceedings of the EGU General Assembly 2023, Vienna, Austria, 24–28 April 2023; EGU: Vienna, Austria, 2023. [Google Scholar] [CrossRef]
  23. Ferreira, A.; Sousa, V.; Pinheiro, M.; Meireles, I.; Matos Silva, C.; Brito, J.; Mateus, R. Potential of rainwater harvesting in the retail sector: A case study in Portugal. Environ. Sci. Pollut. Res. 2023, 30, 42427–42442. [Google Scholar] [CrossRef] [PubMed]
  24. Morey, A.; Dhurve, B.; Haste, V.; Wasnik, B. Rainwater Harvesting System. Int. Res. J. Eng. Technol. 2016, 3, 2158–2162. [Google Scholar]
  25. Yawalkar, R.; Ingole, S.; Derkar, S.; Gaurkar, M.; Kawle, S.; Hingwe, G. Rainwater Harvestıng by Rooftop Method. Int. Res. J. Eng. Technol. 2021, 8, 1988–1991. [Google Scholar]
  26. Ertop, H.; Kocięcka, J.; Atilgan, A.; Liberacki, D.; Niemiec, M.; Rolbiecki, R. The Importance of Rainwater Harvesting and Its Usage Possibilities: Antalya Example (Turkey). Water 2023, 15, 2194. [Google Scholar] [CrossRef]
  27. An, L.; Zheng, Z.; Li, T.; He, S.; Zhang, X.; Wang, Y.; Huang, H.; Yu, H.; Ye, D. Quantity and quality characteristics of DOM loss in sloping cropland under natural rainfall in Southwestern China. Catena 2024, 240, 108000. [Google Scholar] [CrossRef]
  28. Zhao, L.; Fang, Q.; Hou, R.; Wu, F. Effect of rainfall intensity and duration on soil erosion on slopes with different microrelief patterns. Geoderma 2021, 396, 115085. [Google Scholar] [CrossRef]
  29. Ali, S.; Zhang, S.; Chandio, F.A. Impacts of rainfall change on stormwater control and water saving performance of rainwater harvesting systems. J. Environ. Manag. 2021, 280, 111850. [Google Scholar] [CrossRef]
  30. Jóźwiakowski, K.; Listosz, A.; Gizińska-Górna, M.; Pytka, A.; Marzec, M.; Sosnowska, B.; Chołody, M.; Dyczko, A. Quality of rainwaters outflowing from roofs of garage buildings of park authority of Roztocze National Park. J. Ecol. Eng. 2016, 17, 208–215. [Google Scholar] [CrossRef] [PubMed]
  31. Zdeb, M.; Zamorska, J.; Papciak, D.; Skwarczynska-Wojsa, A. Investigation of Microbiological Quality Changes of Roof-Harvested Rainwater Stored in the Tanks. Resources 2021, 10, 103. [Google Scholar] [CrossRef]
  32. Grabowski, T.; Jóźwiakowski, K.; Bochniak, A.; Stachyra, P.; Radliński, B. Assessment of Rainwater Quality Regarding Its Use in the Roztocze National Park (Poland)—Case Study. Appl. Sci. 2023, 13, 6110. [Google Scholar] [CrossRef]
  33. The Act of 16 April 2004 on the Protection of Nature. Journal of Laws of 2023, Items 1336, 1688. Available online: https://www.global-regulation.com/translation/poland/3353949/the-act-of-16-april-2004-on-the-protection-of-nature.html (accessed on 14 April 2024).
  34. Regulation of the Minister of the Environment of April 19, 2018, on the Establishment of a Protection Plan for the Roztocze National Park; Journal of Laws of 2018, Item 1081. Available online: https://isap.sejm.gov.pl/isap.nsf/DocDetails.xsp?id=WDU20180001081 (accessed on 14 April 2024).
  35. Directive 2000/60/EC of the European Parliament and of the Council of 23 October 2000 Establishing a Framework for Community Action in the Field of Water Policy. Available online: http://data.europa.eu/eli/dir/2000/60/oj (accessed on 20 May 2024).
  36. PN-EN ISO 6222:2004; Water Quality. Quantification of Microorganisms Capable of Growth. Determination of the Total Number of Colonies by Inoculation on Nutrient Agar. Polish Committee for Standardization: Warszawa, Poland, 2004.
  37. PN-EN ISO 9308-1:2014-12+A1:2017-04; Quantification of Escherichia coli and Coliform Bacteria. Membrane Filtration Method for Testing Waters with a Small Amount of Accompanying Microflora. Polish Committee for Standardization: Warszawa, Poland, 2014.
  38. PN-EN ISO 7899-2:2004 Standard; Detection and Quantification of Fecal enterococci. Membrane Filtration Method. Polish Committee for Standardization: Warszawa, Poland, 2004.
  39. PN-EN ISO 16266:2009; Water quality—Detection and quantification of Pseudomonas aeruginosa—Membrane Filtration Method. Polish Committee for Standardization: Warszawa, Poland, 2009.
  40. PN-EN 1622:2006; Presence of Foreign Odor (Qualitative Method). Odor Threshold Number, Simplified even Method, Free Selection. Polish Committee for Standardization: Warszawa, Poland, 2006.
  41. PN-EN ISO 7027-1:2016-07; Water Quality—Turbidity Determination, Nephelometric Method. Polish Committee for Standardization: Warszawa, Poland, 2016.
  42. PN-EN ISO 7887:2012; Water Quality—Color Determination, Spectrophotometric Method. Polish Committee for Standardization: Warszawa, Poland, 2012.
  43. PN-EN ISO 10523:2012; Water Quality—pH Determination, Potentiometric method. Polish Committee for Standardization: Warszawa, Poland, 2012.
  44. PN-EN 27888-1999; Water Quality—Determination of Specific Electrical Conductivity, Conductometric Method. Polish Committee for Standardization: Warszawa, Poland, 1999.
  45. PN-ISO 7150-1:2002; Water Quality—Determination of Ammonium Ion, Manual Spectrophotometric Method. Polish Committee for Standardization: Warszawa, Poland, 2002.
  46. PN-82/C-04576.08; Water Quality—Nitrate Determination, Manual Spectrophotometric Method. Polish Committee for Standardization: Warszawa, Poland, 1982.
  47. PN-EN 26777:1999; Water Quality—Nitrite Determination, Manual Spectrophotometric Method. Polish Committee for Standardization: Warszawa, Poland, 1999.
  48. PN-ISO 9297:1994; Water Quality—Determination of Chlorides—Titration Method with Silver Nitrate in the Presence of Chromate as an Indicator (Mohr’s Method). Polish Committee for Standardization: Warszawa, Poland, 1994.
  49. PN-ISO 6059:1999; Water Quality—Determination of the Total Content of Calcium and Magnesium—Titration Method. Polish Committee for Standardization: Warszawa, Poland, 1999.
  50. PB/POŚ/06, 01.07.2011; Total Nitrogen from Calculations. Accredited Method. Research Services Laboratory of the Lublin Cooperative of Dairy Services in Lublin: Lublin, Poland, 2011.
  51. PN-EN ISO 6878:2006-7+Ap1:2010+Ap2:2010; Determination of Phosphorus, Spectrometric Method with Ammonium Molybdate. Polish Committee for Standardization: Warszawa, Poland, 2010.
  52. PN-EN ISO 17294-2:2016-11; Water Quality—Application of Inductively Coupled Plasma Mass Spectrometry (ICP-MS)—Part 2: Determination of Selected Elements, including Uranium Isotopes. Polish Committee for Standardization: Warszawa, Poland, 2016.
  53. Regulation of the Minister of Health of 7 December 2017 on the Quality of Water Intended for Human Consumption. Journal of Laws of 2017, Item 2294. Available online: https://isap.sejm.gov.pl/isap.nsf/DocDetails.xsp?id=WDU20170002294 (accessed on 14 April 2024).
  54. Report RPN. In Hydrological and Climatic Report for the Świerszcz Catchment for 2023, Typescript; Roztocze National Park: Zwierzyniec, Poland, 2023.
  55. Zdeb, M.; Zamorska, J.; Papciak, D.; Słyś, D. The Quality of Rainwater Collected from Roofs and the Possibility of Its Economic Use. Resources 2020, 9, 12. [Google Scholar] [CrossRef]
  56. Bogan, R.A.J.; Ohde, S.; Arakaki, T.; Mori, I.; McLeod, C.W. Changes in Rainwater pH associated with Increasing Atmospheric Carbon Dioxide after the Industrial Revolution. Water Air Soil Pollut. 2009, 196, 263–271. [Google Scholar] [CrossRef]
  57. Małecki, J.J.; Matyjasik, M.; Krogulec, E.; Porowska, D. Long-term trends and factors influencing rainwater chemistry in the Tatra Mountains, Poland. Geol. Geophys. Environ. 2022, 48, 19–38. [Google Scholar] [CrossRef]
  58. Chakraborty, B.; Gupta, A. Rainwater Quality Analysis in Selected Areas of Eastern and Northeastern India. Int. J. Environ. Eng. 2014, 1, 76–80. [Google Scholar]
  59. Fay, P.A.; Carlisle, J.D.; Knapp, A.K.; Blair, J.M.; Collins, S.L. Altering Rainfall Timing and Quantity in a Mesic Grassland Ecosystem: Design and Performance of Rainfall Manipulation Shelters. Ecosystems 2000, 3, 308–319. [Google Scholar] [CrossRef]
  60. Evans, C.; Coombes, P.; Dunstan, R. Wind, rain and bacteria: The effect of weather on the microbial composition of roof-harvested rainwater. Water Res. 2006, 40, 37–44. [Google Scholar] [CrossRef] [PubMed]
  61. Aiome, G.V.; Silva, P.C.J.; Sangeeth, F.; Ananda, S. Rainwater as a Source of Safe Water in North Central Province, Sri Lanka. In Proceedings of the International Conference on Water Security through Rain Water Harvesting, Colombo, Sri Lanka, 28–29 November 2018. [Google Scholar]
  62. Kozisek, F. Regulations for calcium, magnesium or hardness in drinking water in the European Union member states. Regul. Toxicol. Pharmacol. 2020, 112, 104589. [Google Scholar] [CrossRef] [PubMed]
  63. Chubaka, C.E.; Ross, K.E.; Edwards, J.W. Rainwater for drinking water: A study of household attitudes. WIT Trans. Ecol. Environ. 2017, 216, 299–311. [Google Scholar] [CrossRef]
  64. Krakowski, L.; Bartoszek, P.; Krakowska, I.; Olcha, P.; Piech, T.; Stachurska, A.; Brodzki, P. Serum amyloid protein (SAA) haptoglobin (Hp) and selected hematological and biochemical parameters in wild mares before and after parturition. Polish J. Vet. Sci. 2017, 20, 299–305. [Google Scholar] [CrossRef] [PubMed]
  65. Teixeira, C.A.; Ghisi, E. Comparative Analysis of Granular and Membrane Filters for Rainwater Treatment. Water 2019, 11, 1004. [Google Scholar] [CrossRef]
  66. Cheng, J.; Bi, J.; Gong, Y.; Cheng, X.; Yu, J.; Gan, H.; Wang, R.; Wang, K. Processes of nitrogen removal from rainwater runoff in bioretention filters modified with ceramsite and activated carbon. Environ Technol. 2023, 44, 3317–3330. [Google Scholar] [CrossRef]
  67. Zdeb, M.; Papciak, D. Disinfection of Rainwater for Economic Purposes. Sustainability 2023, 15, 16121. [Google Scholar] [CrossRef]
  68. Hamilton, K.; Reyneke, B.; Waso, M.; Clements, T.; Ndlovu, T.; Khan, W.; DiGiovanni, K.; Rakestraw, E.; Montalto, F.; Haas, C.N.; et al. A global review of the microbiological quality and potential health risks associated with roof-harvested rainwater tanks. NPJ Clean Water 2019, 2, 7. [Google Scholar] [CrossRef]
  69. Hamilton, K.A.; Parrish, K.; Ahmed, W.; Haas, C.N. Assessment of Water Quality in Roof-Harvested Rainwater Barrels in Greater Philadelphia. Water 2018, 10, 92. [Google Scholar] [CrossRef]
  70. Uyğun, M.; Fırat, M.K.; Antepli, O.; Bulat, F.N.; Hekimoğlu, M.A.; Bağcı, M.K.; Güleç, F.; Suzer, C.; Köse, I.; Saka, S.; et al. The Water Disinfection with Different Type UV Lamp Systems on Bacterial Load in Small Scale Recirculating Aquaculture Systems. Turk. J. Fish. Aquat. Sci. 2023, 24, TRJFAS23785. [Google Scholar] [CrossRef]
  71. Augsburger, N.; Rachmadi, A.T.; Zaouri, N.; Lee, Y.; Hong, P.-Y. Recent Update on UV Disinfection to Fulfill the Disinfection Credit Value for Enteric Viruses in Water. Environ. Sci. Technol. 2021, 55, 16283–16298. [Google Scholar] [CrossRef] [PubMed]
  72. Raeiszadeh, M.; Adeli, B. A Critical Review on Ultraviolet Disinfection Systems against COVID-19 Outbreak: Applicability, Validation, and Safety Considerations. ACS Photon. 2020, 7, 2941–2951. [Google Scholar] [CrossRef]
Figure 1. Location of the rainwater harvesting and utilisation system on the land cover map of the River Świerszcz catchment area in the RNP.
Sustainability 16 04709 g001
Figure 2. View of the garage (B1) and workshop (B2) in the Roztocze National Park Headquarters.
Sustainability 16 04709 g002
Figure 3. Schematic of the rainwater-harvesting system in the RNP Headquarters. The blue arrows show the direction of rainwater flow, the black arrows show the direction of sewage water outflow.
Sustainability 16 04709 g003
Figure 4. Photographs of cleanouts for removing dead leaves and debris from rainwater.
Sustainability 16 04709 g004
Figure 5. A schematic of the investigated rainwater treatment system. System components: 1—pump, 2A and 2B—water meters, 3—polypropylene filter for the removal of mechanical impurities with particles larger than 20 microns, 4—polypropylene filter for the removal of mechanical impurities with particles larger than 5 microns, 5—activated carbon filter, 6—germicidal UV lamp, A, B, C—UV lamp valves.
Sustainability 16 04709 g005
Figure 6. View of the investigated rainwater treatment system. System components: 1—UV lamp, 2—hydrophore, 3—filter set, 4—pump, 5—pressure washer.
Sustainability 16 04709 g006
Figure 7. Changes in the temperature of rainwater in the tank during the study period in relation to external air temperature, precipitation, and water consumption. The water temperature values at different depths show a strong correlation. The Pearson r correlation coefficient ranged from 0.989 (for the 0.5 m and 1.5 m levels) to 0.0998 (for the 0.5 m and 1 m levels). The greatest differences in water temperature at the individual tank depths occurred in the warm months (June–September), when the lowest temperature was obtained at the level close to the bottom of the tank, and the highest at the level of 1 m. The largest difference in water temperature (4.2 °C) between these levels was recorded on 10 July, when the water level in the tank was the lowest (1.5 m) after a long period of scanty rainfall.
Sustainability 16 04709 g007
Figure 8. The amount of rainwater that can be captured and its use in the analysed period of 2023.
Sustainability 16 04709 g008
Figure 9. Changes in selected physicochemical parameters of raw and treated rainwater over study time: (a) water colour and turbidity—changes in time; (b) boxplots for water colour and turbidity; (c) total hardness and pH—changes in time; (d) boxplots for total hardness and pH; (e) nitrogen compounds—changes in time; (f) boxplots for nitrogen compounds, RW—raw water, TW—treated water.
Sustainability 16 04709 g009aSustainability 16 04709 g009b
Figure 10. Efficiency of removal of selected chemical contaminants.
Sustainability 16 04709 g010
Figure 11. Changes in selected microbial parameters of water in tanks and after treatment over study time: (a) total microbial counts at 22 and 36 °C—changes in time; (b) boxplots for total microbial counts at 22 and 36 °C; (c) faecal enterococci and P. aeruginosa—changes in time; (d) boxplots for faecal enterococci and P. aeruginosa. RW—raw water, TW—treated water.
Sustainability 16 04709 g011
Figure 12. Efficiency of removal of selected microbial contaminants.
Sustainability 16 04709 g012
Table 1. Standards and procedures used in the water quality tests.
Test TypeParameterPolish Standards Number
Microbiological testsTotal microbial count at 36 °CPN-EN ISO 6222:2004 [36]
Total microbial count at 22 °C
ColiformsPN-EN ISO 9308-1:2014-12+A1:2017-04 [37]
Escherichia coli
Faecal enterococciPN-EN 7899-2: 2004 standard [38]
Pseudomonas aeruginosaPN-EN ISO 16266:2009 [39]
Organoleptic testsPresence of a foreign odourPN-EN 1622:2006 [40]
Threshold Odour Number (TON)
Physicochemical testsTurbidityPN-EN ISO 7027-1:2016-07 [41]
Colour PN-EN ISO 7887:2012 [42]
pHPN-EN ISO 10523:2012 [43]
Specific conductance at 25 °CPN-EN 27888-1999 [44]
Ammonium ionsPN-ISO 7150-1:2002 [45]
NitratesPN-82/C-045576.08 [46]
NitritesPN-EN 26777:1999 [47]
ChloridesPN-ISO 9297:1994 [48]
Total hardnessPN-ISO 6059:1999 [49]
Total nitrogenPB/POŚ/06, 01.07.2011 [50]
Total phosphorusPN-EN ISO 6878:2006-7+Ap1:2010+Ap2:2010 [51]
SilverPN-EN ISO 17294-2:2016-11 [52]
Copper
Sodium
Magnesium
Boron
Barium
Cobalt
Molybdenum
Zinc
Arsenic
Selenium
Antimony
Total Chrome
Total iron
Aluminium
Cadmium
Manganese
Nickel
Lead
Mercury
Table 2. Precipitation and air temperature in the study area in 2023. Study period: June–December 2023.
MonthIIIIIIIVVVIVIIVIIIIXXXIXII
Average air temperature [°C]−1.45.44.57.712.717.019.820.116.410.83.60.8
Precipitation [mm]90.262.563.158.158.443.1105.978.827.794.854.165.3
Table 3. Basic descriptive statistics of physicochemical parameters of rainwater.
Parameter
Unit
SampleMinMedianMeanMaxSDWilcoxon z
p-Value
TurbidityRW0.931.351.713.20.88z = 2.37
NTUTW0.590.981.142.20.51p = 0.018 *
ColourRW0.411.965.01.80z = 0.913
mg Pt/dm3TW0.41.32.45.01.86p = 0.361
pHRW6.36.8-7.8-z = 0.524
-TW6.56.8-7.5-p = 0.600
Specific conductance at 25 °CRW8.829.125.87349.17z = 2.206
µS/cmTW1432.931.565112.06p = 0.028 *
Ammonium ionsRW0.040.10.0960.150.035z = 2.18
mg/dm3TW0.0060.050.0510.10.028p = 0.028 *
NitratesRW0.241.981.783.231.21z = 2.031
mg/dm3TW0.211.381.312.530.841p = 0.043 *
NitritesRW0.0070.0110.0110.0230.0054z = 1.77
mg/dm3TW0.0030.010.00880.0150.0043p = 0.076
ManganeseRW0.0010.0030.00310.0080.0023z = 1.48
mg/dm3TW0.0010.0050.00490.0080.0030p = 0.138
Total ironRW0.00230.0230.02320.0460.0159z = 0.943
mg/dm3TW0.00140.0180.01650.0310.0103p = 0.345
ChloridesRW0.981.212.19941.416z = 1.05
mg/dm3TW0.8221.97731.029p = 0.295
Total hardnessRW1.021210.43155.15z = 1.77
mg/dm3TW0.981512.85216.75p = 0.076
Total nitrogenRW2.113.2353.354.230.78z = 0.524
mg/dm3TW3.113.4053.534.210.409p = 0.600
Total phosphorusRW0.0050.02450.02620.050.018z = 0.734
mg/dm3TW0.0030.03150.02570.0410.0149p = 0.463
CopperRW0.1120.3730.3650.70.209z = 0.943
mg/dm3TW0.1090.27950.35910.322p = 0.345
ZincRW0.0160.05850.0540.0790.021z = 2.20
mg/dm3TW0.0220.0680.0640.0850.022p = 0.028 *
* statistically significant differences between parameter values for raw water (RW) and treated water (TW).
Table 4. Basic descriptive statistics of microbiological parameters.
Parameter
Unit
SampleMinMedianMeanMaxSDWilcoxon z
p-Value
Total microbial count at 22 °CRW781603045.414,0005091.6z = 2.37
cfu/cm3TW0073.71420154.6p = 0.018 *
Total microbial count at 36 °CRW1206104314.323,0008342.0z = 2.37
cfu/cm3TW02591.57520190.2p = 0.018 *
ColiformsRW001.429103.780-
cfu/100 cm3TW0000-
Escherichia coliRW0000--
cfu/100 cm3TW0000-
Faecal enterococciRW11519.574817.99z = 2.37
cfu/100 cm3TW000.57141.511p = 0.018 *
Pseudomonas aeruginosaRW00143817.66z = 1.60
cfu/100 cm3TW0000-p = 0.109
* statistically significant differences between parameter values for raw water (RW) and treated water (TW).
Disclaimer/Publisher’s Note: The statements, opinions and data contained in all publications are solely those of the individual author(s) and contributor(s) and not of MDPI and/or the editor(s). MDPI and/or the editor(s) disclaim responsibility for any injury to people or property resulting from any ideas, methods, instructions or products referred to in the content.

