Article

Evaluation and Spatial–Temporal Pattern Evolution of Synergy Degree of Emergency Management for Urban Flood Disasters from the Perspective of Sustainable Development—The Case of Henan, China

1
Safety and Emergency Management Research Center, Henan Polytechnic University, Jiaozuo 454003, China
2
Laboratory of Emergency Management, Henan Polytechnic University, Jiaozuo 454003, China
3
School of Public Administration and Emergency Management, Jinan University, Guangzhou 510632, China
4
Emergency Management School, Jinan University, Guangzhou 510632, China
*
Author to whom correspondence should be addressed.
Sustainability 2024, 16(11), 4730; https://doi.org/10.3390/su16114730
Submission received: 8 May 2024 / Revised: 25 May 2024 / Accepted: 30 May 2024 / Published: 1 June 2024
(This article belongs to the Section Environmental Sustainability and Applications)

Abstract

:
The management of urban flood disasters is a systematic engineering project that requires a great amount of manpower, material resources, and financial resources, and the interaction and coordination degrees of various elements in the system deeply affect the efficiency of the final governance. According to the theories of synergy, composite systems, and sustainable development, this research first established an evaluation index system to determine the synergy degree of urban flood disaster emergency management from the four dimensions of prevention and preparation, monitoring and early warning, response and rescue, and recovery and reconstruction. Then, the synergy degree was explored by using the developed composite system synergy degree model on the basis of the panel data of 18 prefecture-level cities in Henan Province from 2013 to 2021, and synergy level change characteristics were analyzed from the perspectives of time and space. Finally, the obstacle degree model was applied to explore the obstacle factors affecting synergy degree development. The results showed that the overall level of the urban flood disaster emergency management coordination degree in Henan Province was relatively low, and there were significant differences in synergy among cities. Among them, 12 cities presented mild synergy, and 6 cities showed mild nonsynergy. The spatial correlation of the synergy degree was not stable, which revealed a lack of mature coordination mechanisms for flood disaster emergency management among cities. The analysis of obstacle factors showed that recovery and reconstruction subsystems were the main obstacle systems that affected the synergy degree.

1. Introduction

Due to the combined effect of global change and urbanization, extreme hydrometeorological events frequently strike around the world [1], seriously affecting the sustainable development of regional societies [2], and cities have become the forefront of disaster risk and the main battlefield to address the challenge of climate change [3]. Flood disasters are among the natural disasters that frequently occur around the world, with serious losses and great consequences [4]. Based on the statistics of the World Meteorological Organization, from 1970 to 2019, weather, climate, and water disasters accounted for 50% of all disasters and 74% of all economic losses, of which 44% were related to floods, which has presented an increasing trend [5,6]. Under the effect of a monsoon climate and complex terrain, heavy rains and floods have become concentrated and exert more serious effects in China [7]. The report of the Ministry of Water Resources of China revealed that flood disasters had caused a total of about USD 763.78 billion in financial losses and more than 61 thousand deaths from 1990 to 2020 [8]. Recently, “looking at the sea in the city” has become a common problem in the development of Chinese cities [9], attracting great attention from the scientific community and society. It has become a prominent weak spot in urban disaster prevention and reduction systems and a major constraint on the sustainable development of cities [10,11,12].
Traditional emergency management models, which rely on government departments as a single disaster relief force, have difficulty in effectively dealing with the new challenges brought by urban flood risk. Currently, the number of policy subjects involved in flood disaster management is increasing every day. Only under unified command can the advantages of various departments be brought into full play, synergistic effects of multi-governance subjects be formed, and comprehensive management ability of flood disasters be improved [13]. Hence, in urban flood disaster management processes in the future, it is essential in the field of public management to develop a collaborative governance relationship among various policy subjects to help them perform their respective duties and work together to improve flood disaster management effectiveness under the premise of cohesion. It is urgent and realistic to study the coordination degree of urban flood disaster emergency management.
Collaborative governance emphasizes effective collaboration among different governance entities to maximize overall governance efficiency [14]. Collaborative governance is a novel governance approach that has become an essential means to respond to disasters and is a hot topic in research on disaster theory [15,16,17]. Researchers have recognized the positive function of collaborative governance, generally assuming government departments as the main bodies of natural disaster emergency response and rescue work, and emphasized that it is necessary to fully understand and leverage the advantages and strengths of other social entities under the guidance of government departments, constantly strengthen the collaborations of multiple entities, and establish new collaborative governance models for natural disasters [18,19,20]. For example, Kyoo-Man Ha et al. found that it was difficult to effectively integrate and coordinate different resources by relying only on the works of different government departments [21]. Strader studied emergency management in tornado disasters and found that in terms of disaster emergency management, the US government and social institutions needed to cooperate effectively [22]. Waugh et al. considered synergy as a necessary foundation for responding to natural disasters, emphasizing the importance of cooperation and advocating for increasing collaboration numbers during rescue and managing them [23]. Carreras-Coch showed that in an information-based environment, communication technology was the key to emergency management [24]. Hence, it is necessary to provide necessary basic services as soon as possible and develop an efficient and rigorous emergency management information system to meet social needs.
Since the 1990s, Chinese researchers have performed extensive research on natural disaster synergy governance [25,26,27,28,29]. They unanimously believe that other governance entities, along with the government, play increasingly important roles in responding to natural disasters and have performed in-depth research on the coordination and cooperation of multiple entities participating in disaster governance [30,31,32]. Yang et al. showed that there were still some issues, such as weak awareness of disaster prevention and reduction, imperfect laws and regulations, and ineffective coordination and cooperation among government departments, which required improvement in the joint participation of multiple entities in natural disaster emergency management [33]. Wang et al. suggested that a joint urban flood prevention and control system had to be established in terms of forecast and early warning, joint dispatching of engineering systems, pre-rehearsal planning, decision making consultation, material allocation, and risk-avoidance measures [34]. Li et al. investigated regional flood characteristics, disaster characteristics, and the current flood control situation in the Chengdu Chongqing urban agglomeration and developed a collaborative response model for major urban flood disasters on the basis of the zoning of weak flood control points [35]. Based on the dilemma of urban flood disaster emergency management, Peng et al. investigated coordinated emergency measures among multiple agents in terms of both subject and process, combined with the four stages of crisis reduction, preparation, response, and recovery [36].
In relevant research works performed around the world, it can be seen that the participation of multiple stakeholders in the emergency management of flood disasters has been extensively studied. Researchers from around the world reached a consensus on the necessity of collaborative participation among multiple stakeholders in flood disaster management. Research on natural disaster management began earlier internationally, and the obtained results hold an important position in natural disaster synergy emergency management today, which is worth learning and referencing. Recently, Chinese researchers have paid increasing attention to natural disaster management, and experts in different fields have proposed a large number of feasible countermeasures for the collaborative management of natural disasters based on different role positions.
However, most of the current studies still focus on qualitative analyses from the perspective of government management and tend to make horizontal comparisons of multiple cases, lacking quantitative evaluation; therefore, the research depth needs to be further improved [36,37,38,39,40]. Few researchers have quantitatively investigated the synergistic effect of the flood disaster management process from the perspective of composite system synergy, and theoretical and experimental research on the synergistic evaluation of flood disaster management is relatively lacking. Therefore, this research used panel data from 18 prefecture-level cities in Henan Province from 2013 to 2021 to explore the flood disaster emergency management synergy degree according to the composite system synergy degree model and analyzed the changing characteristics of the coordination level in terms of time and space. Finally, the obstacle model was applied to investigate the factors constraining emergency management synergy development for flood disasters in Henan Province in order to provide a theoretical basis for the prevention, reduction, and sustainable development measures of urban disasters.

2. Research Methods

2.1. Evaluation Index System

Strengthening emergency synergy is a common requirement and an important trend in the current emergency management work of various countries. A high-quality emergency management process should be connected to a professional, information-based, and intelligent disposal network for the mutual coordination of various emergency entities. In addition to considering the connection between vertical departments of the government, the connection between the government and other organizations, such as the public and the media, as well as the horizontal connection between regions, is also crucial [41]. As a result, combined with the characteristics of flood disasters and the objectives of the emergency management system, this study evaluated the synergy of urban flood emergency management from the four levels of prevention and preparedness, monitoring and early warning, response and rescue, and recovery and reconstruction [42,43,44,45,46]. By analyzing the literature and consulting experts, the evaluation index system of urban flood emergency management containing 28 indices was obtained after removing redundant indices by correlation analysis (Table 1). This study used the entropy method to calculate the index weights [47,48], which is a widely used method of objective assignment when dealing with panel data, and averaged the index weights from 2013 to 2021 to obtain the index weights of this evaluation system (Table 1).

2.2. Evaluation Model

Synergy was proposed by renowned physicist Haken in 1971 [49]. The theory of synergy holds that a system contains many subsystems, and the subsystems contain different elements. The coordination within and among each subsystem promotes the development of the whole system from disorder to order. The synergy degree represents the degree of interrelation and interaction between the elements of subsystems and between subsystems. There is a strong positive correlation between synergy degree and synergy effect. The higher the synergy degree of the system, the stronger the overall function of the system and the better synergy effect. The synergy theory is widely applied in fields such as science and technology innovation, transportation logistics, social governance, urban development, etc. It shows that constructing the synergy degree model of composite system using synergetic principle can be used to study the collaborative development law of each subsystem within the composite system.

2.2.1. Order Degree Model of Subsystems

The composite system for collaborative management of urban flood disasters is defined as S, S = S 1 , S 2 , , S n , where n is the number of subsystems, n 1 , S i is a subsystem, and i 1 , n . x i j is the value of the j th index of subsystem. If m indices are selected for each subsystem, the order parameter of subsystem S i is defined as x i , x i = ( x i 1 , x i 2 , , x i j ) , j 1 , m . In composite systems, α i j and β i j represent, respectively, the maximum and minimum values of all data in the order parameter; then, β i j x i j α i j . Suppose that x i 1 , x i 2 , , x i ρ ( 1 ρ m ) are positive indices: the higher the index value is, the higher the order degree of the order parameter is. Suppose that x i ρ + 1 , x i ρ + 2 , , x i m are negative indices, and the larger the index value, the lower the order degree of the order parameter [50]. The order degree of the order parameter of the subsystem is
μ i x i j = x i j β i j α i j β i j ,     j 1 , ρ                 α i j x i j α i j β i j ,     j ρ + 1 , m
μ i x i j 0,1 ; the larger the value, the greater the contribution of the order parameter x i j to the order degree of the subsystem. The ordered contribution of order parameters to subsystems is represented by μ i x i , Its size is also related to the weight of the order parameter index and their combination form. This study adopted linear weighting method for integration:
μ i x i = j = 1 m w i j μ i x i j , w i j 0 , j = 1 m w i j = 1
w i j is the weight of the order parameter, μ i x i [ 0,1 ] ; the larger the value, the more ordered the subsystem is.

2.2.2. Synergy Degree Model of Composite System

The synergy degree of composite systems is a remeasurement of the order degree of subsystems from a dynamic perspective [51]. When there is no flood disaster, the emergency management system of urban flood disaster presents a disordered state, and each subsystem operates independently. When floods occur, the system changes, and all subsystems begin to coordinate and collaborate, leading to an orderly evolution of the entire system state [51]. Set a certain initial time t 0 ; the order degree of each subsystem is μ i 0 x i , then at another time t 1 , the order degree of each subsystem after the development and evolution of the whole system is μ i 1 x i . At this time, the synergy degree of the emergency management system for urban flood disasters is
D = θ i = 1 n μ i 1 x i μ i 0 x i n
This equation reveals the degree of collaboration and its changing trend in urban flood disaster emergency management system over a certain period of time. In the formula, μ i 1 x i μ i 0 x i is the change amplitude of the order degree of the sequence parameters of the subsystem in the period of t 0 ~ t 1 . D 1,1 , whose positive and negative values are determined by θ .
θ = 1 , μ i 1 x i μ i 0 x i > 0 1 , μ i 1 x i μ i 0 x i 0
D 1,0 ; the composite system is in a disordered and chaotic development state, and the closer the value is to 0, the lower the degree of disordered chaos. At this time, countermeasures should be taken to correct the problem of the composite system in order to strengthen the orderly development state. D 0,1 ; the composite system is in a state of ordered coordinated development, and the larger the value, the higher the degree of system collaboration. The level classification of synergy degree of composite system [52] is shown in Table 2.

2.2.3. Spatial Autocorrelation Model

In order to determine whether the synergy degree of emergency management for flood disasters in cities is spatially related and to deeply understand the geospatial correlation characteristics of the synergy degree of cities, this study adopted Queen’s Case method to construct the adjacent spatial weight matrix, calculated the Moran’s I, and conductd significance testing using the p-value of standardized Z-values. The calculation formula for the Moran’s I is as follows [53,54,55]:
I = n i = 1 n j = 1 n h i j x i x ¯ x j x ¯ i = 1 n j = 1 n h i j i = 1 n x i x ¯ 2
In the formula, n represents the number of regions; x i and x j are the synergy degree values of region i and region j , respectively , x ¯ is the sample mean; and h i j is the regional spatial weight. The range of values for I is [–1, 1]. I ( 0,1 ] means that there is a positive spatial correlation between the synergy degree of urban flood disaster emergency management in this region, and the spatial feature is agglomeration. I = 0 indicates that there is a spatial uncorrelation and spatial characteristics of randomness. I [ 1,0 ) indicates that there is a negative spatial correlation between the synergy degree of urban flood disaster emergency management in this region, and the spatial feature is scattered. The closer I is to 1 , the more significant the anisotropy [56].

2.2.4. Obstacle Degree Model

Analyzing and diagnosing the main obstacle factors affecting the synergy degree of emergency management for urban flood disasters are conducive to the development of targeted strategies for improving the coordination degree of urban flood resistance [57]. The specific methods are as follows:
U i j = 1 x i j
M j = W i j × U i j j m W i j × U i j
In the above formula, x i j ´ is the index value after extreme value standardization; U i j is the deviation degree of the index; and W i j is the factor contribution degree, namely, the index weight. M j is the obstacle degree of the index, and the larger its value, the higher the degree of restriction on the coordination degree of urban flood disaster emergency management, which also means the greater the degree of impact.

3. Study Area and Statistical Analysis

3.1. Study Area

Henan Province is located in the middle and lower reaches of the Yellow River in the middle east of China and the south of the North China Plain. With a total area of 167,000 square kilometers and a permanent population of 98.15 million, it is the only province in China that crosses the Huaihe River, Haihe River, the Yellow River, and the Yangtze River [58]. In retrospect, Henan has experienced many large-scale flood disasters with heavy losses, such as the great breach of the Huayuankou dike in 1938 [59], the Zhumadian extremely heavy rainstorm in 1975 [60], and the “July 20” extremely heavy rainstorm in Zhengzhou in 2021 [61]. Henan Province is located in two transitional zones from the north to the south climate and from the mountains to the plain, and the terrain decreases in steps from west to east. The western mountains form a natural barrier to the warm and humid airflow and water vapor brought by the southeast monsoon. Under the effect of topographic uplift, abundant terrain rain is formed, making Henan one of the three regions with the highest precipitation variability in China [62]. Secondly, Henan Province lacks effective flood discharge conditions. Most areas in Henan Province are plains with direct flood discharge, and there is a lack of large lakes and rivers that can divert and retain heavy rainfall. When the accumulated water is difficult to drain, it can cause flooding. The Yellow River is the most difficult-to-manage surface river in the world. When the Yellow River enters the North China Plain, the sediment silts up, raising the riverbed. So, the Yellow River in Henan Province not only fails to play the role of flood discharge but may also break its banks due to heavy rainfall. Therefore, although the average annual rainfall in Henan Province is not large, the frequency and severity of flood disasters are much greater than those in southern provinces. To sum up, the selection of Henan Province as a sample in this article is of great research significance. The research area diagram is shown in Figure 1.
The data selected in this article mainly come from the Henan Statistical Yearbook, Henan Water Conservancy Yearbook, the Henan Survey Yearbook, as well as the national economic and social development statistical bulletins of 18 cities.

3.2. Analysis of Subsystem Order Degree Results

According to the subsystem order degree model, the order degree of the subsystems of prevention preparation, monitoring and early warning, response and rescue, and recovery and reconstruction in each city from 2013 to 2021 was calculated. This study reflects the data characteristics of the subsystem order degree by calculating the mean and standard deviation, as shown in Figure 2, Figure 3, Figure 4 and Figure 5. The horizontal symbol in the figure is the abbreviation of the first letter of the city name, namely, Zhengzhou (ZZ), Kaifeng (KF), Luoyang (LY), Pingdingshan (PDS), Anyang (AY), Hebi (HB), Xinxiang (XX), Jiaozuo (JZ), Puyang (PY), Xuchang (XC), Luohe (LH), Sanmenxia (SMX), Nanyang (NY), Shangqiu (SQ), Xinyang (XY), Zhoukou (ZK), Zhumadian (ZMD), Jiyuan (JY).
In the prevention preparation subsystem, the highest annual mean value is in Jiyuan, the lowest is in Zhoukou, and the highest standard deviation is in Anyang, followed by Jiyuan, indicating that the order degree of these two cities’ subsystems fluctuates greatly over time.
In the monitoring and early warning subsystem, the highest annual average is in Zhengzhou, almost twice that of other cities, and the lowest is in Xinyang. The largest standard deviation is in Xinyang; it can be obviously seen that the subsystem order degree of Xinyang has been greatly improved. The cities with a relatively small standard deviation and stable development are Kaifeng, Anyang, Hebi, Xuchang, and Luohe.
In the response and rescue subsystem, Zhengzhou has the highest annual average value, and Shangqiu has the lowest, but Shangqiu has the highest standard deviation, indicating that the order degree of Shangqiu’s subsystems is low and unstable. There was a sudden drop in 2021, which requires special attention and investigation of the cause.
In the recovery and reconstruction subsystem, the highest annual average is in Nanyang, and the lowest is in Kaifeng. The largest standard deviation is in Anyang, Puyang, Nanyang, and Zhumadian, all of which are close to 0.08, and the smallest standard deviation is in Shangqiu.
Given the fluctuation degree of the mean line, it can be seen that the difference degree of the subsystem order degree among cities is most obvious in the monitoring and early warning subsystem, but it is not obvious in the restoration and reconstruction subsystem. Given the fluctuation degree of the standard deviation line, it can be seen that the difference degree of the subsystem order degree between cities over time is most obvious in the monitoring and early warning subsystem, which has two peaks in Puyang and Xinyang, while it is not obvious in the response and rescue subsystem, indicating that, basically, the subsystem order degree of each city changes little over time.

3.3. Analysis of the Results of Synergy Degree in Composite System

Taking 2013 as the base period, the results of subsystem order degree calculation were substituted into Formulas (3) and (4) to calculate the synergy degree of each city from 2014 to 2021. The calculation results are shown in Table 3.
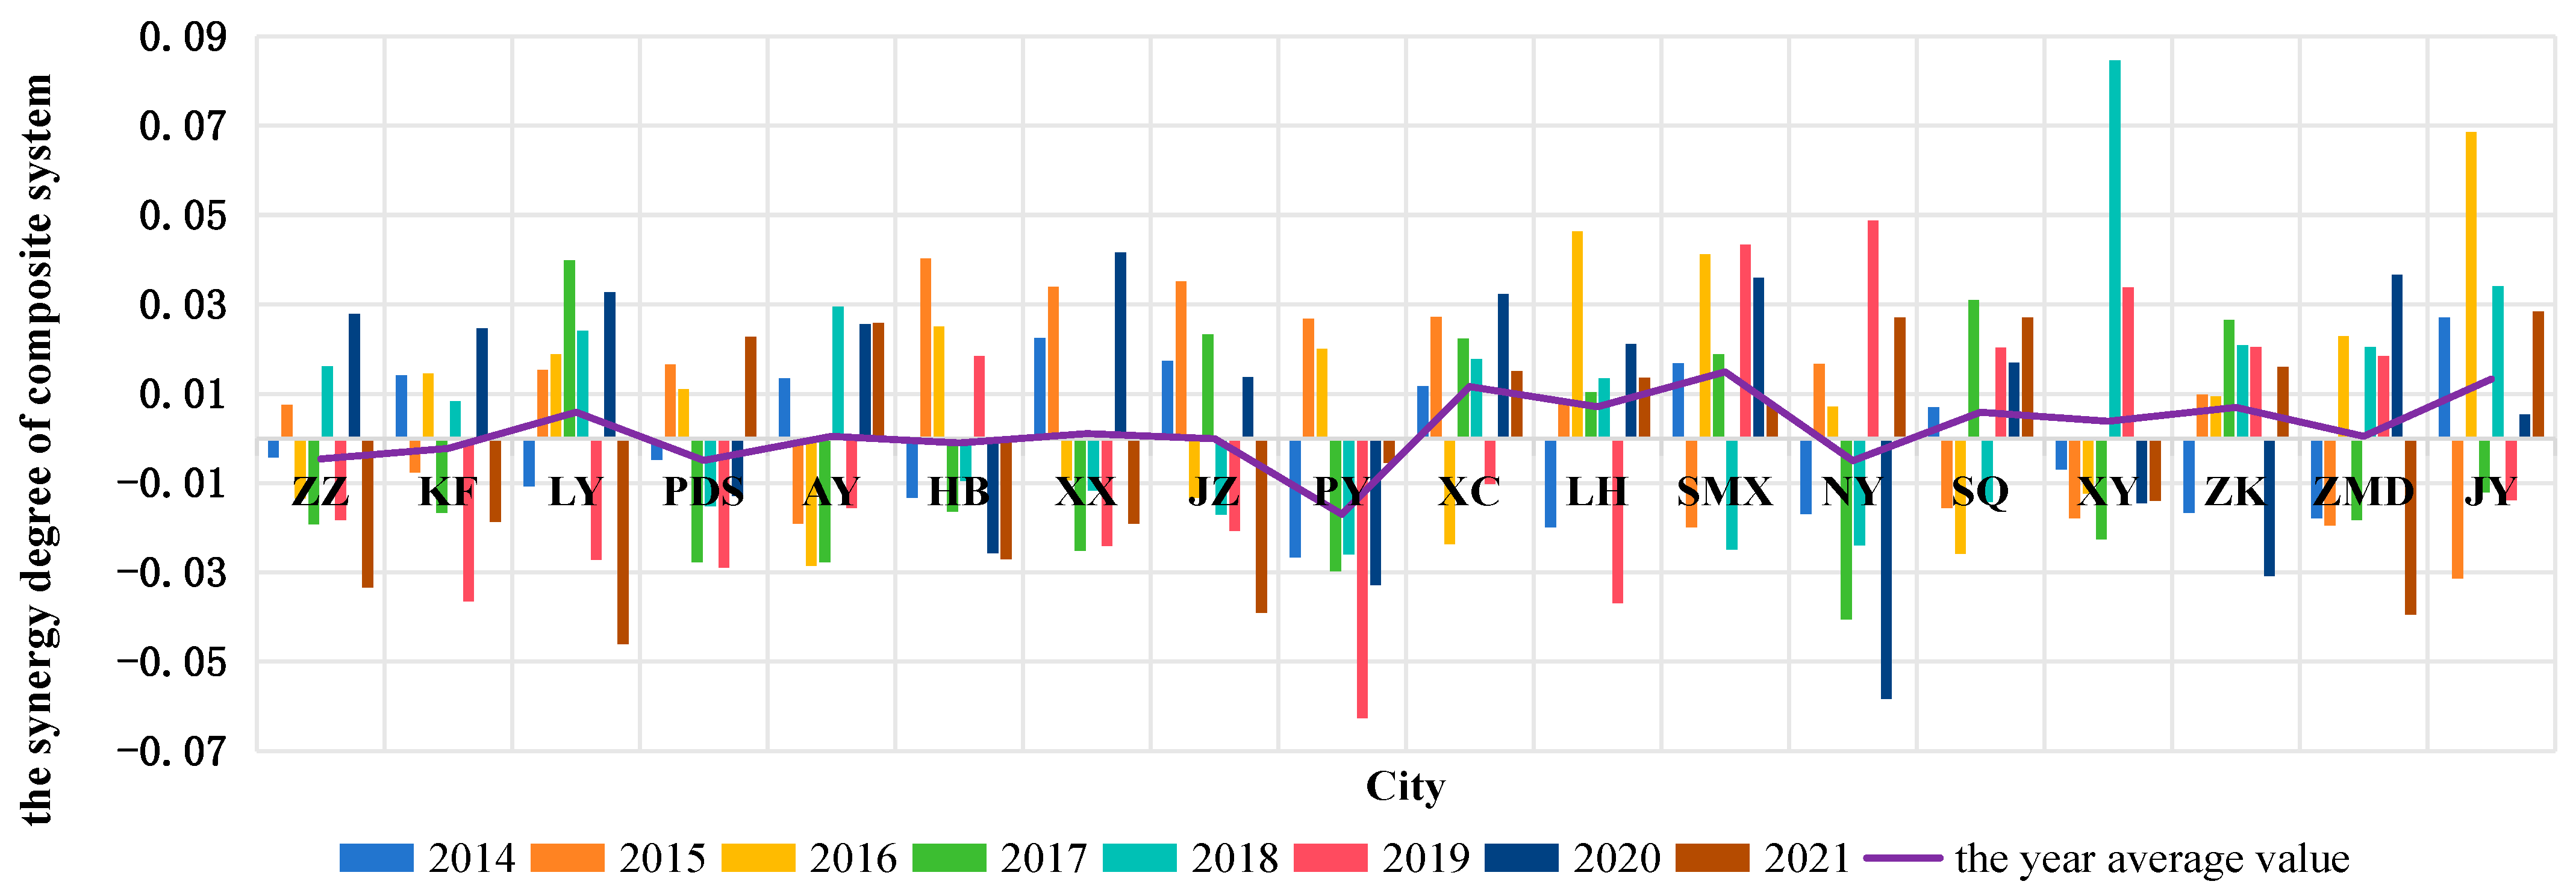
The collaborative degree of composite systems in various cities fluctuates greatly from mild nonsynergy to mild synergy. From 2014 to 2021, the average range of each city was 0.074, and the average standard deviation was 0.026. The average annual range and standard deviation of the synergy degree of the composite system were 0.087 and 0.029, respectively. By analyzing the mean value of the synergy degree of each city from 2014 to 2021 (Figure 6), it was found that 12 cities are in mild synergy, and 6 cities are in mild nonsynergy. Given the fluctuations of the line and the height changes of the column, it can be clearly seen that there are great differences in the synergy degree of composite systems among cities.

4. Verification of Model Evaluation Effectiveness

When an object is evaluated by indicators, the evaluation score and weight coefficient of each indicator will affect the size of the evaluation result. In this study, the weight coefficient of the index is changed only in a certain range, and the evaluation effect of the composite system synergy degree model is measured by the change scope of synergy degree results. The smaller the change scope is, the higher the stability of the model and the better the evaluation effect of the model.
This study took the synergy degree value of 18 cities in Henan Province in 2021 as an example. Two indicators were selected from any subsystem. The weight coefficients of one indicator were changed by 1%, 5%, and 10%, respectively, and the other indicator changed with it. Finally, the change scope of the synergy degree was calculated, as shown in Table 4.
It can be clearly seen in the data in the table that when the weight coefficient changes by 10%, although the change degree of the synergy degree value in Hebi and Nanyang is larger than that of other cities, the overall value of the synergy degree changes within 5%. In summary, the composite system synergy degree model is stable and effective in evaluating the coordination level of urban flood disaster emergency management.

5. Analysis of the Spatiotemporal Pattern Evolution

5.1. The Temporal Characteristics of the Synergy Degree

5.1.1. Analysis of Temporal Characteristics of Regional Synergy Degree

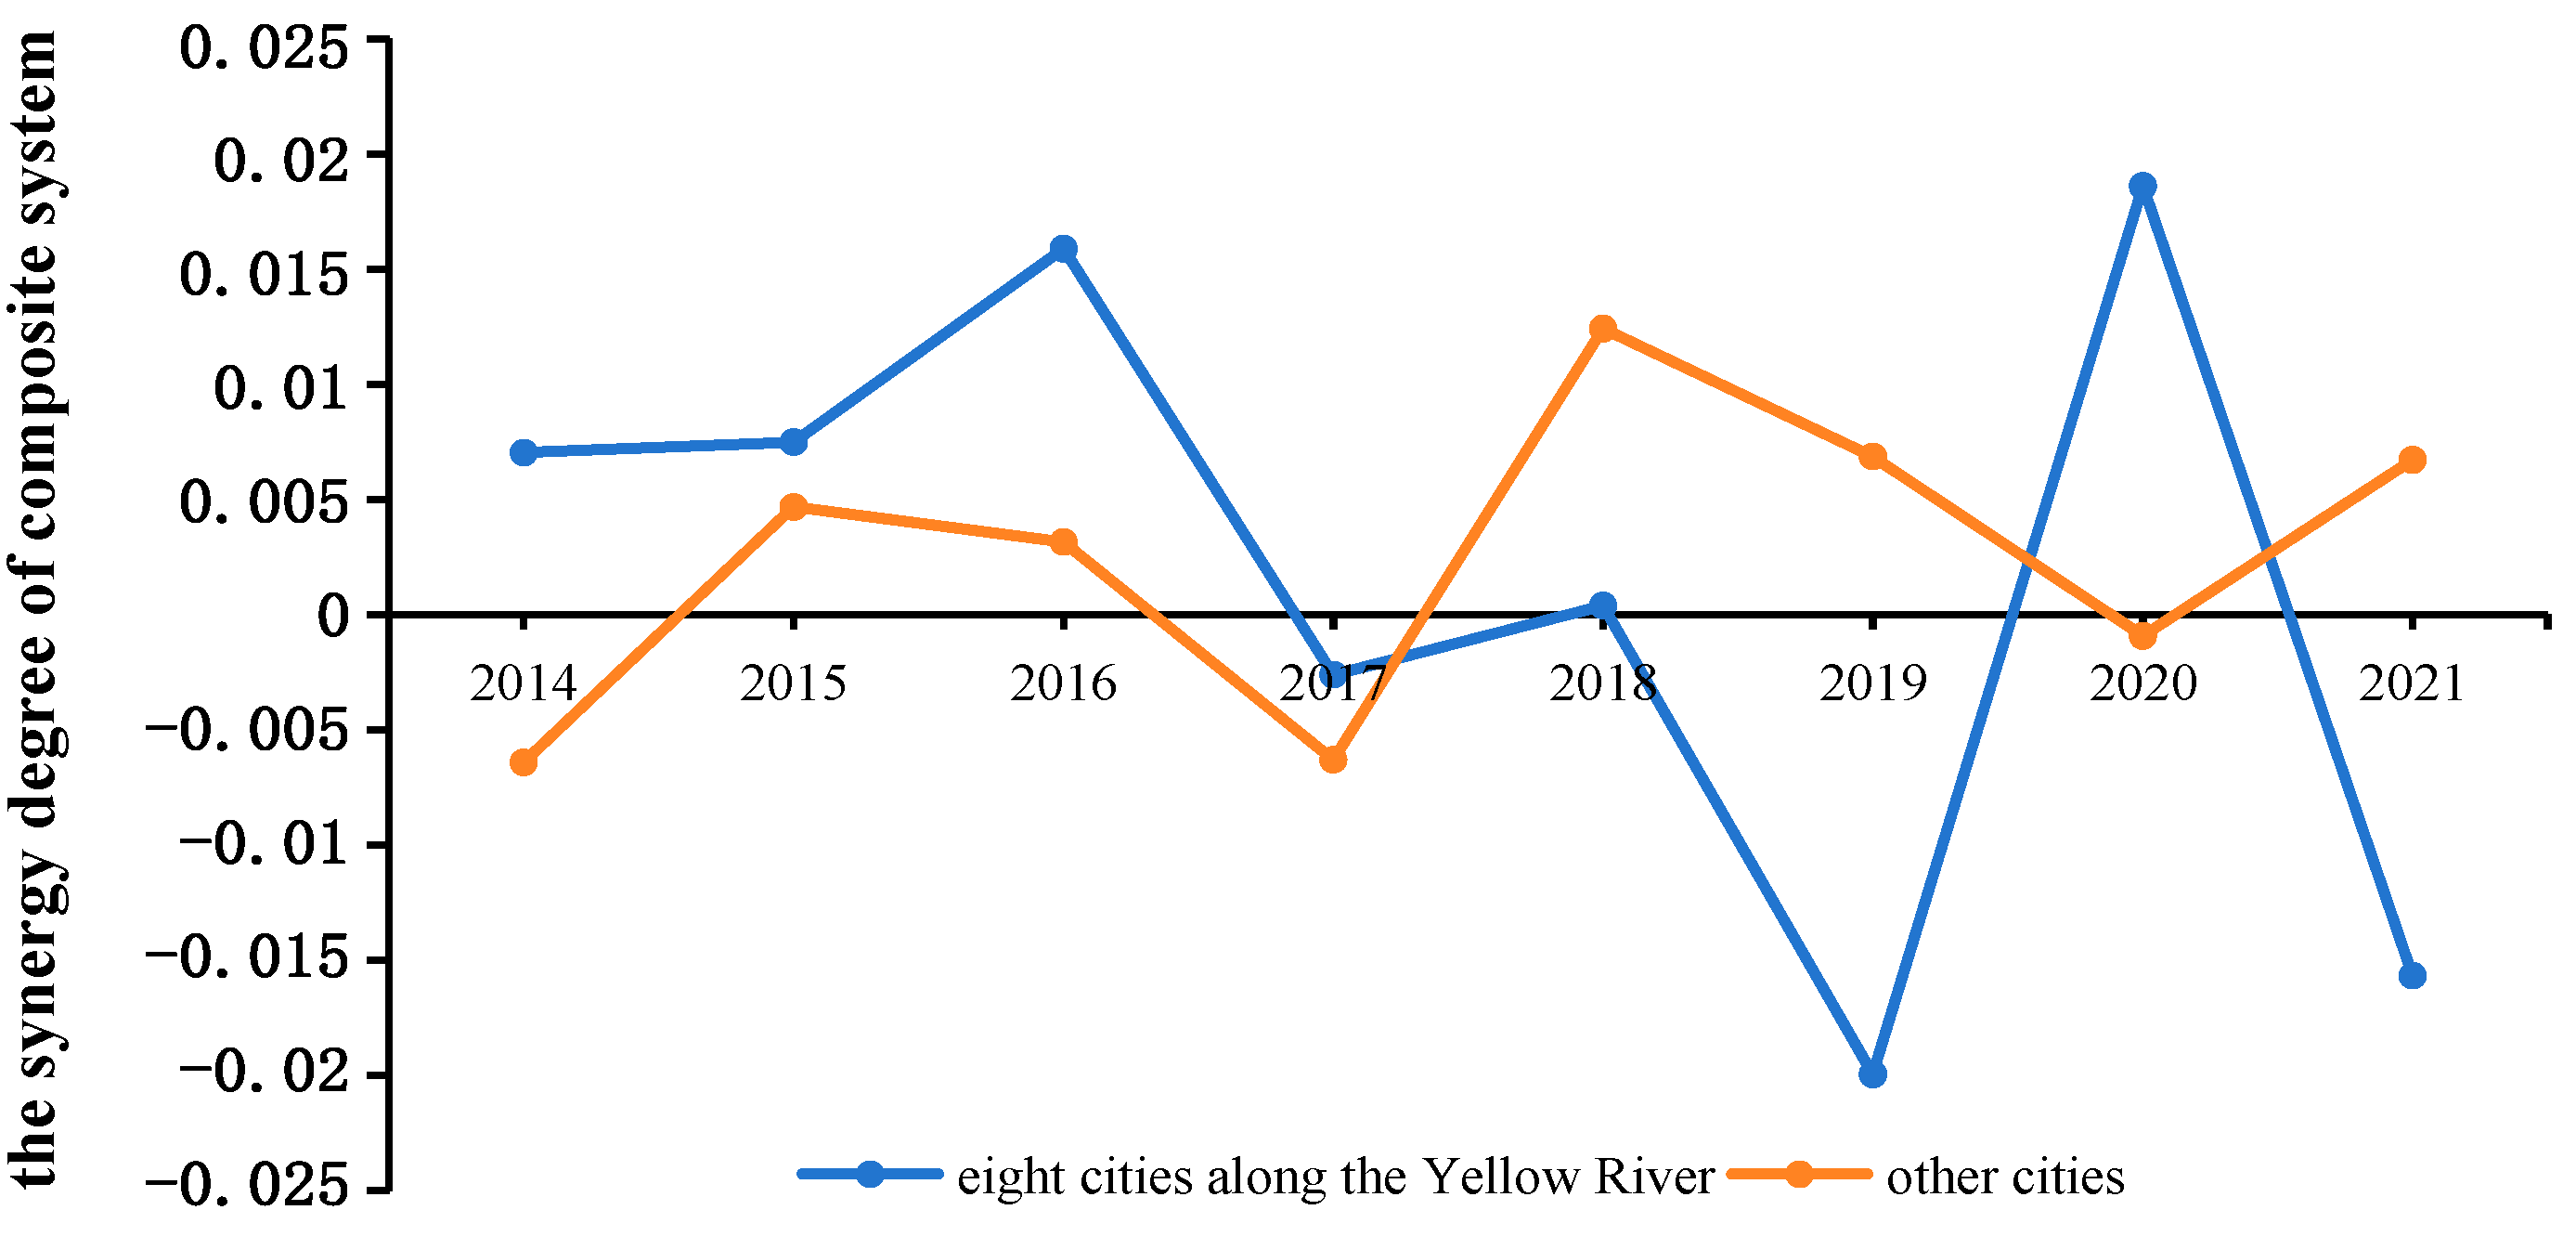
Overall, the synergy degree along the Yellow River region is slightly higher than that of other regions, and both have no obvious trend of change with the growth of time (Figure 7). Specifically, the synergy degree along the Yellow River region for five years is greater than that of other cities. This reflects that this region has more efficient emergency management in response to flood disasters compared to other regions, which is also consistent with the above conclusion that cities with higher levels of a subsystem order degree are mostly located near the Yellow River. The cities along the Yellow River are in areas prone to flood disasters, and these cities have achieved great results in emergency coordinated management. However, the high destructiveness of flood disasters can also easily cause heavy damage to the area and prevent rapid recovery. In contrast, the synergy degree of areas with fewer flood disasters appears to be more stable.

5.1.2. Analysis of Temporal Characteristics of Synergy Degree in Henan Province

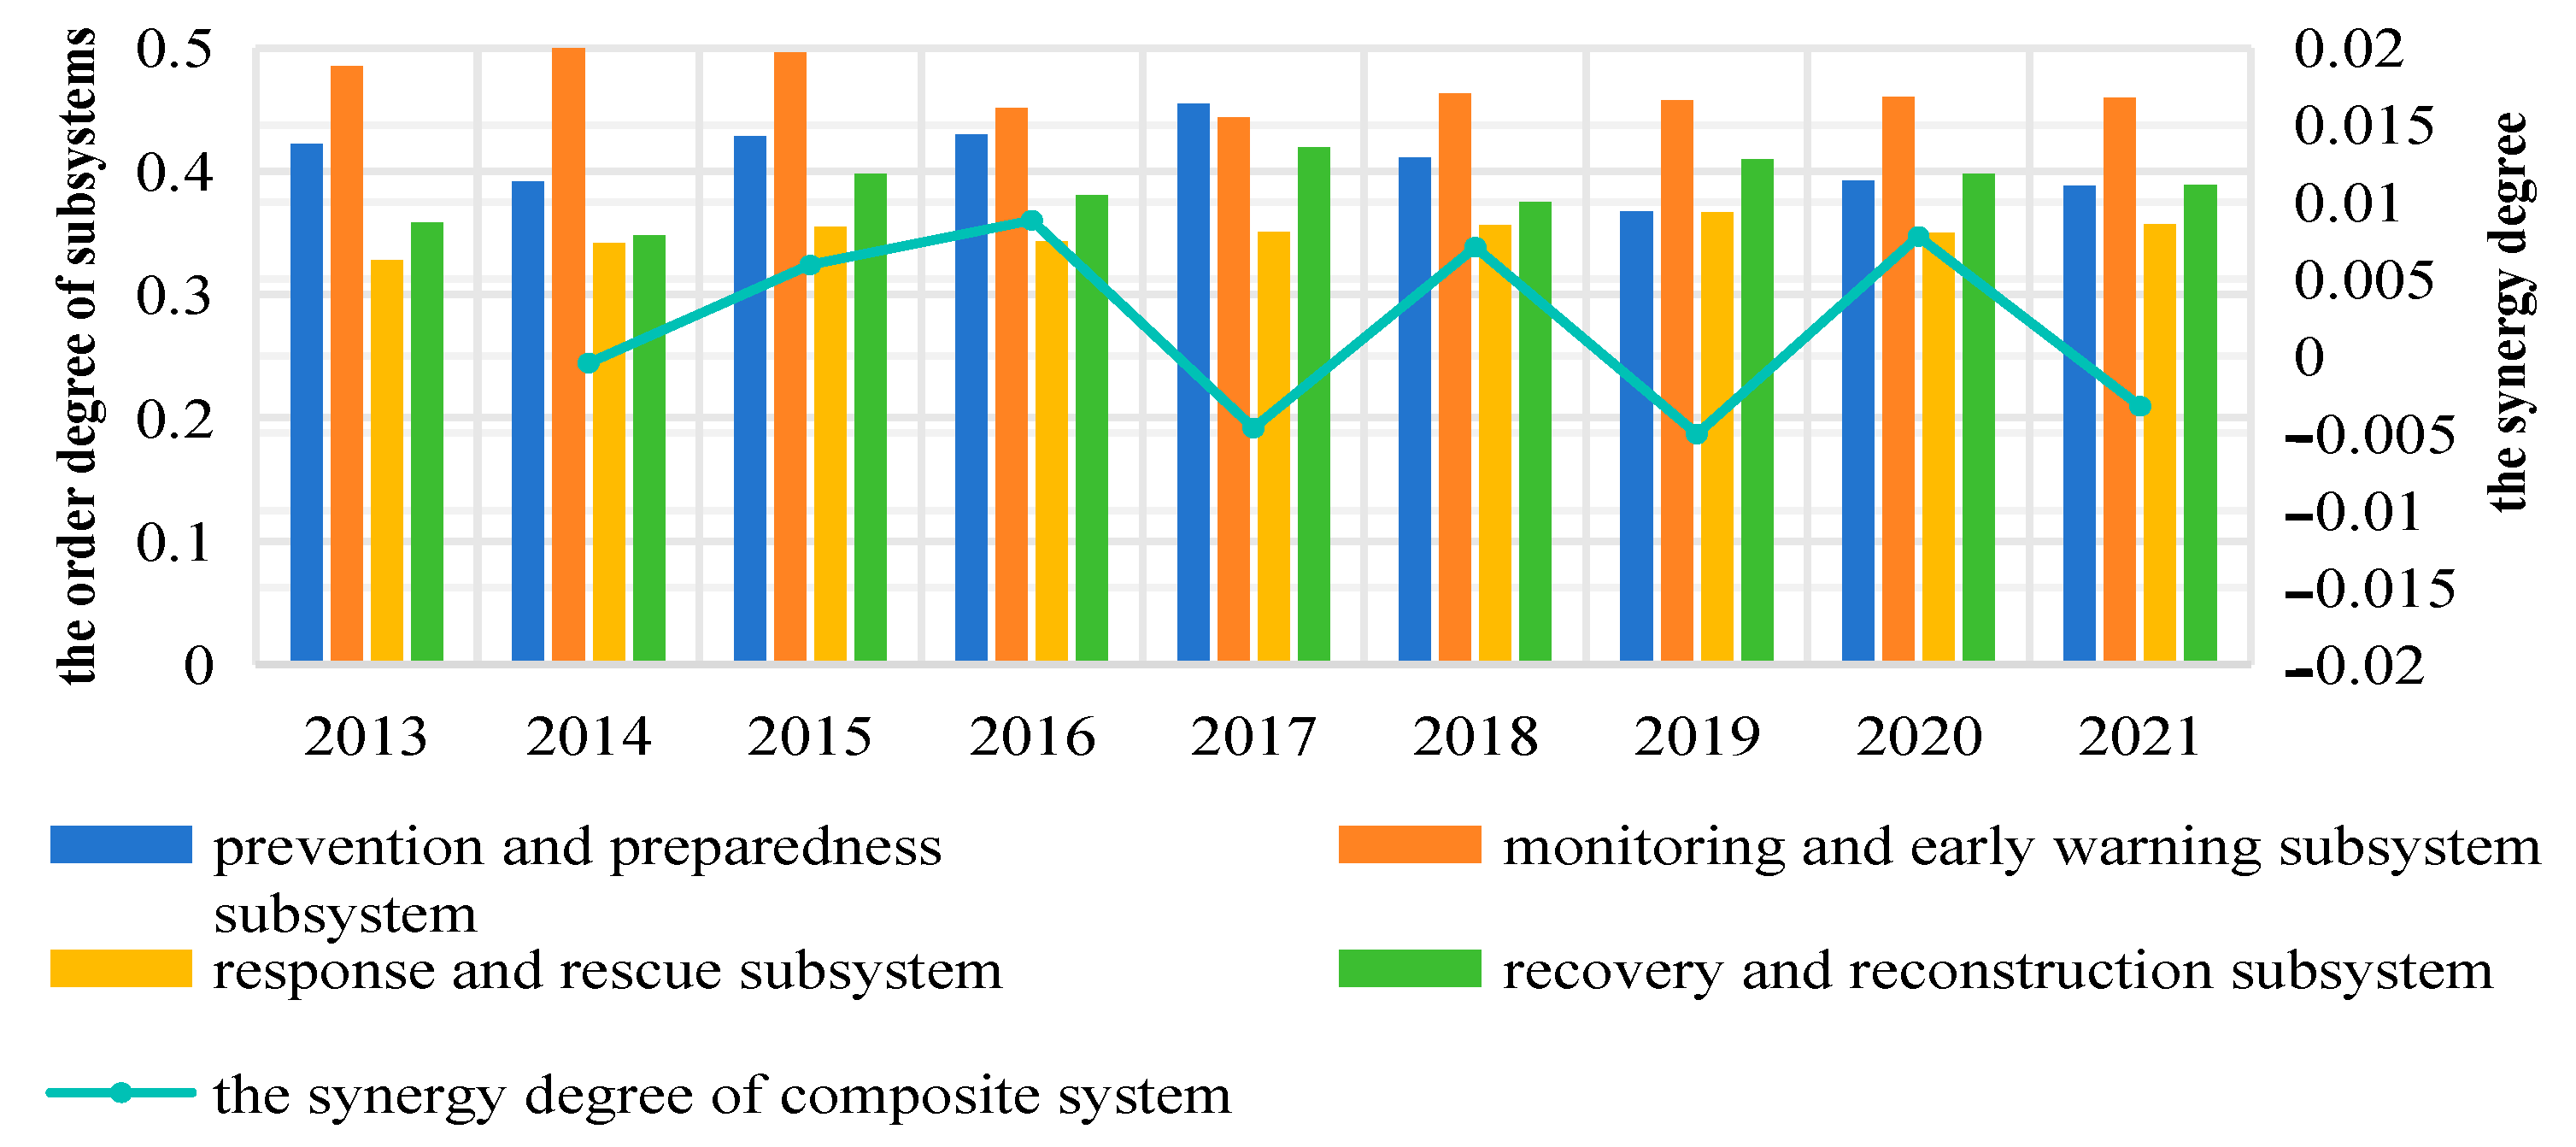
As shown in Figure 8, from 2013 to 2021, the order degree of the prevention preparation subsystem showed a general trend of first increasing and then decreasing. The monitoring and early warning subsystem had hardly changed before 2017 but showed a clear upward trend from 2017 to 2020, growing steadily from about 0.4 to about 0.5 and maintaining a medium orderly level. The order degree of the response rescue subsystem and the recovery and reconstruction subsystem had no obvious trend, fluctuating around 0.350 and 0.386, respectively. Moreover, the order degree of the response rescue subsystem almost remained unchanged, while the order degree of the recovery and reconstruction subsystem fluctuated greatly. On the whole, the order degree of the annual response and rescue subsystem was obviously lower than that of the other three subsystems, which reflects that the response and rescue subsystem is a relatively weak link in the emergency management of urban flood disasters. The synergy degree of the composite system was at a very low level and remained at around 0.002 in a sawtooth shape from 2013 to 2021. This shows that the cities in Henan Province have not paid much attention to the coordination of emergency management. With the reform of the emergency management system under the framework of great security and great emergency, there is still a long way to go for Henan Province to enter the stage of highly coordinated development in flood disaster emergency management.

5.2. The Spatial Characteristics of the Synergy Degree

5.2.1. Spatial Distribution Characteristics

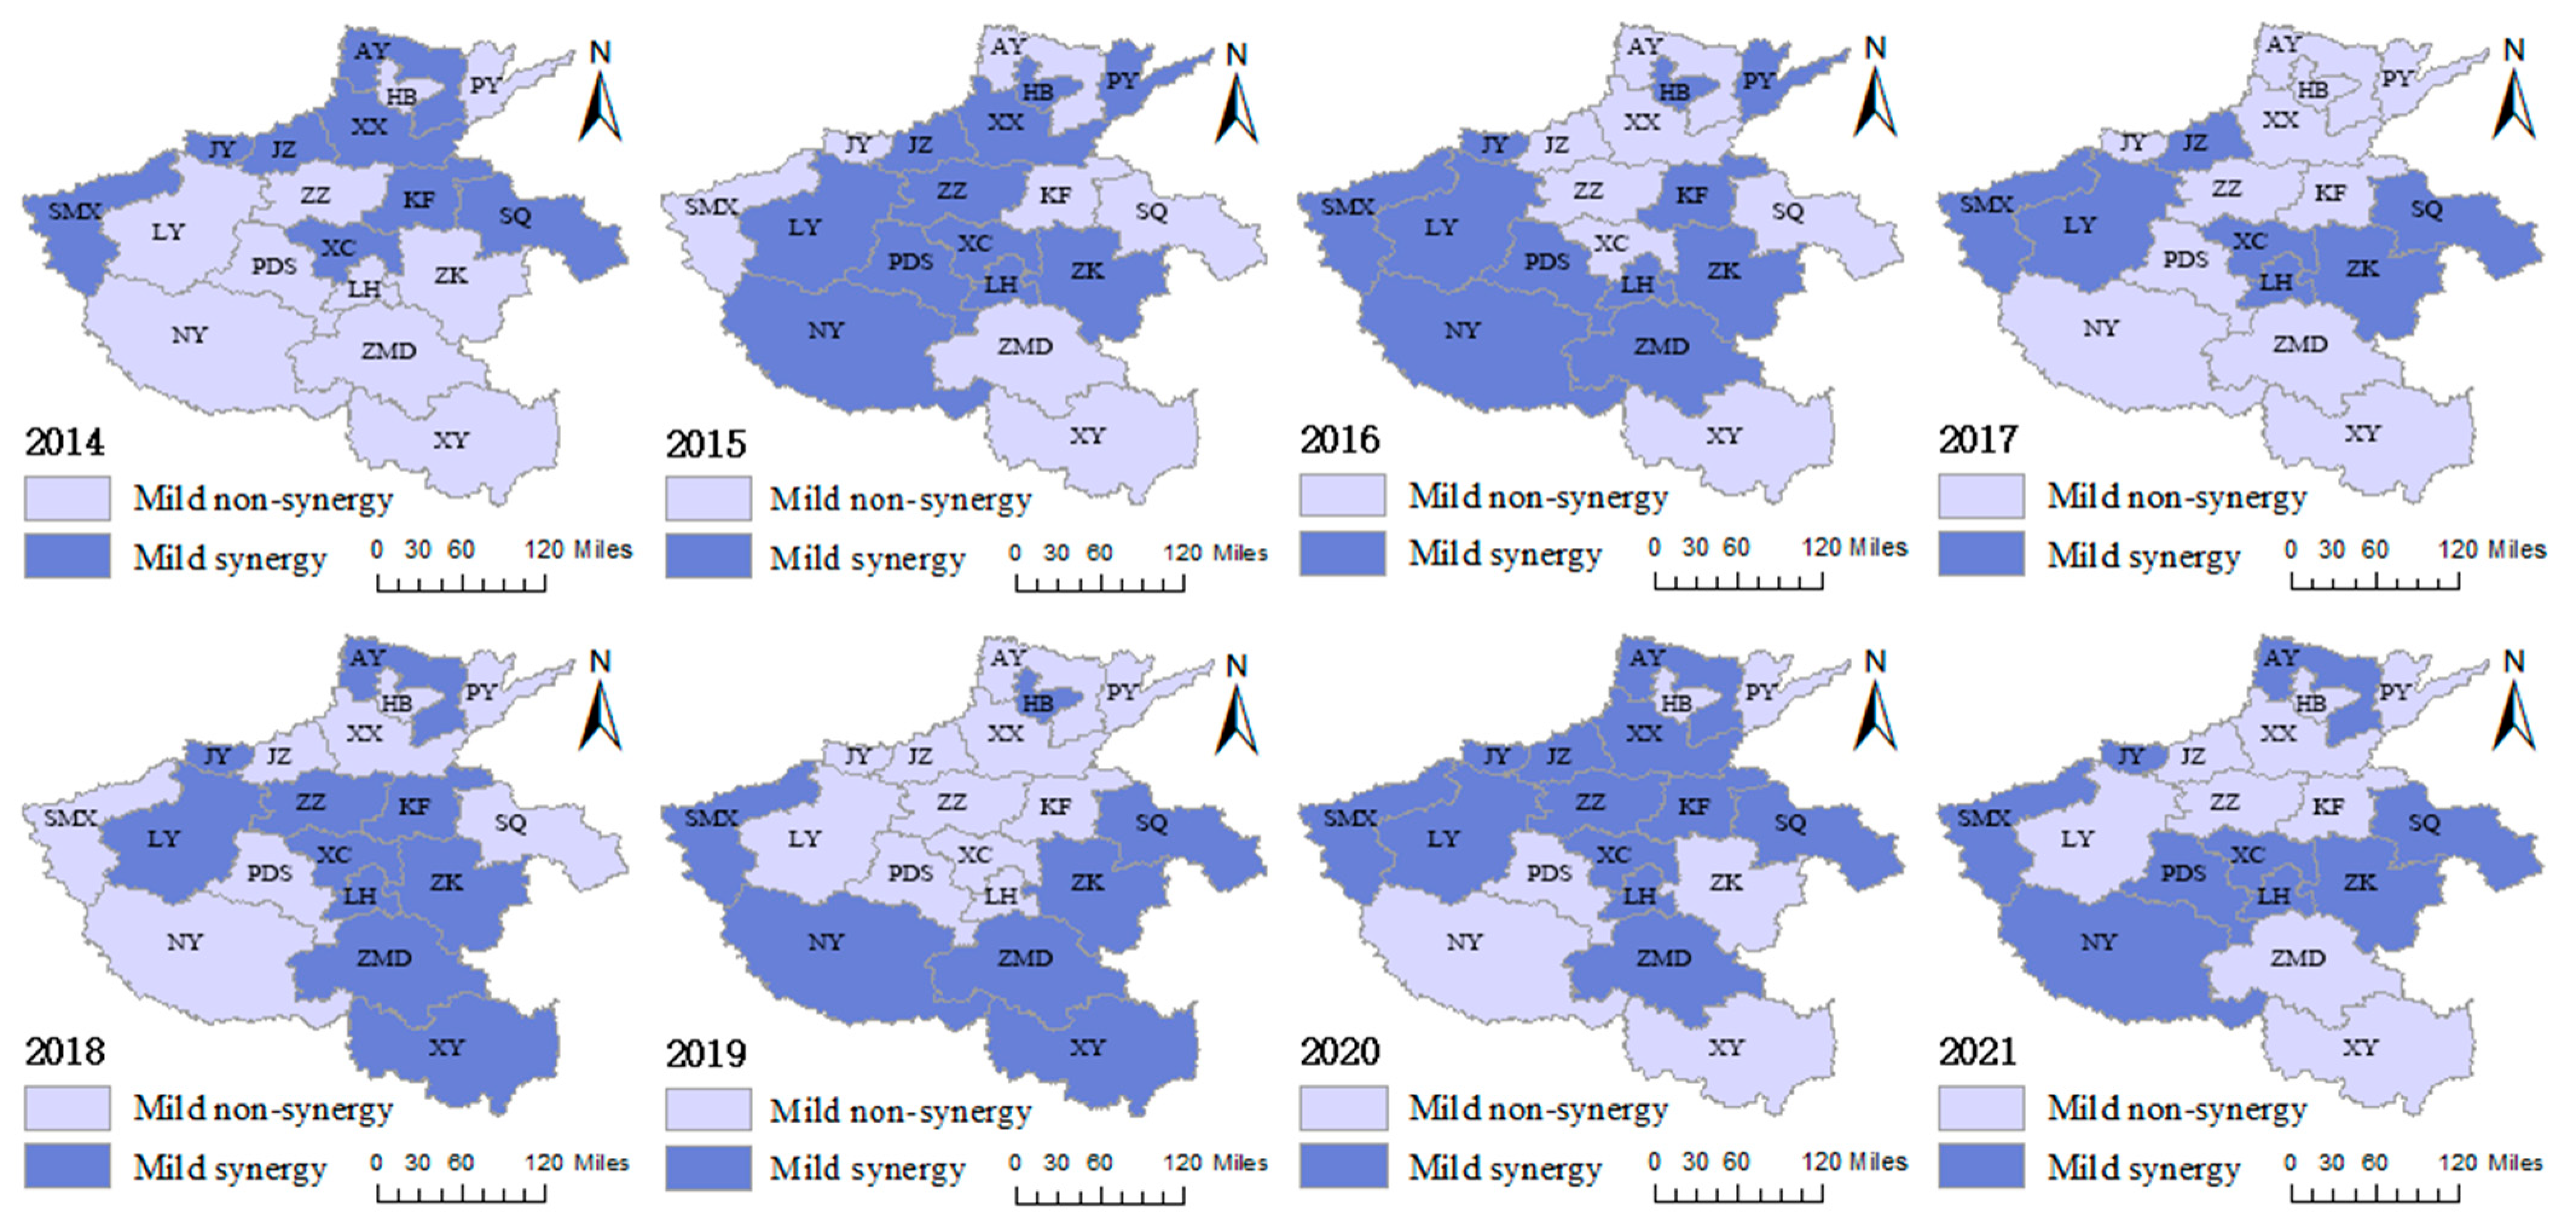
In order to comprehensively analyze the spatial characteristics of the synergy degree of urban flood disaster emergency management in Henan Province, ArcGIS software (ArcGIS10.8.1) was used to draw the spatial pattern distribution map of the collaborative degree of the composite system in each city (Figure 9). It was found that the synergy degree of various cities shows the following characteristics in spatial distribution: ① As time went by, more than half of the cities in 2014, 2017, and 2019 were in a state of mild nonsynergy, and half or more of the cities in 2015, 2016, 2018, 2020, and 2021 were in a state of mild synergy. However, the number of cities with mild synergy tended to be equal to that of cities with mild nonsynergy on the whole. In addition, the cities with mild synergy gradually increased from the north of Henan Province to the southwest, then moved to the southeast, and finally shifted to the north again. ② From the perspective of local cities, if cities that have been in a mild synergy state for 5 years or more are considered cities with relatively stable levels of emergency governance collaboration, then the relatively stable cities in Northern, Western, Central, and Eastern Henan are Jiyuan, Luoyang and Sanmenxia, Xuchang and Luohe, Zhoukou, and Shangqiu, respectively. The overall collaborative development in Southern Henan is not stable. Moreover, both Puyang and Xinyang have only been in a mild synergy state for two years, which shows they urgently need to strengthen their coordination and linkage with neighboring cities. ③ From the perspective of different river basins, most of the cities in the state of synergy are located in the Yellow River basin and the Huai River basin.

5.2.2. Global Spatial Autocorrelation

Based on the spatial autocorrelation model, the global Moran’s I of the synergy degree from 2014 to 2021 was calculated using ArcGIS software, as shown in Table 5.
The following conclusions can be drawn from Table 5: ① The global Moran’s I of the synergy degree in 2017 and 2019 was positive, but the synergy degree in 2017 did not pass the significance test, which reflects that the central city in this region has a weak radiative driving effect on flood disaster emergency management in surrounding cities, and the spatial agglomeration effect needs to be further improved. The synergy degree in 2019 passed the significance test, showing a significant spatial positive correlation. This indicates that cities gradually became cooperative in the emergency management of flood disasters from 2014 to 2019. ② The global Moran’s I of the synergy degree was negative in 2014, 2015, 2016, 2018, 2020, and 2021, which showed a certain spatial negative correlation. However, this relationship is not significant, indicating that the cooperation among cities in the emergency management of flood disasters is not strong, and there is a phenomenon of “individual governance”. ③ On the whole, the spatial correlation of the synergy degree of urban flood disaster emergency management is not stable, and the dispersion trend of the synergy degree is relatively obvious, which reflects that a mature synergy mechanism of flood disaster emergency management has not been formed among cities.

5.2.3. Local Spatial Autocorrelation

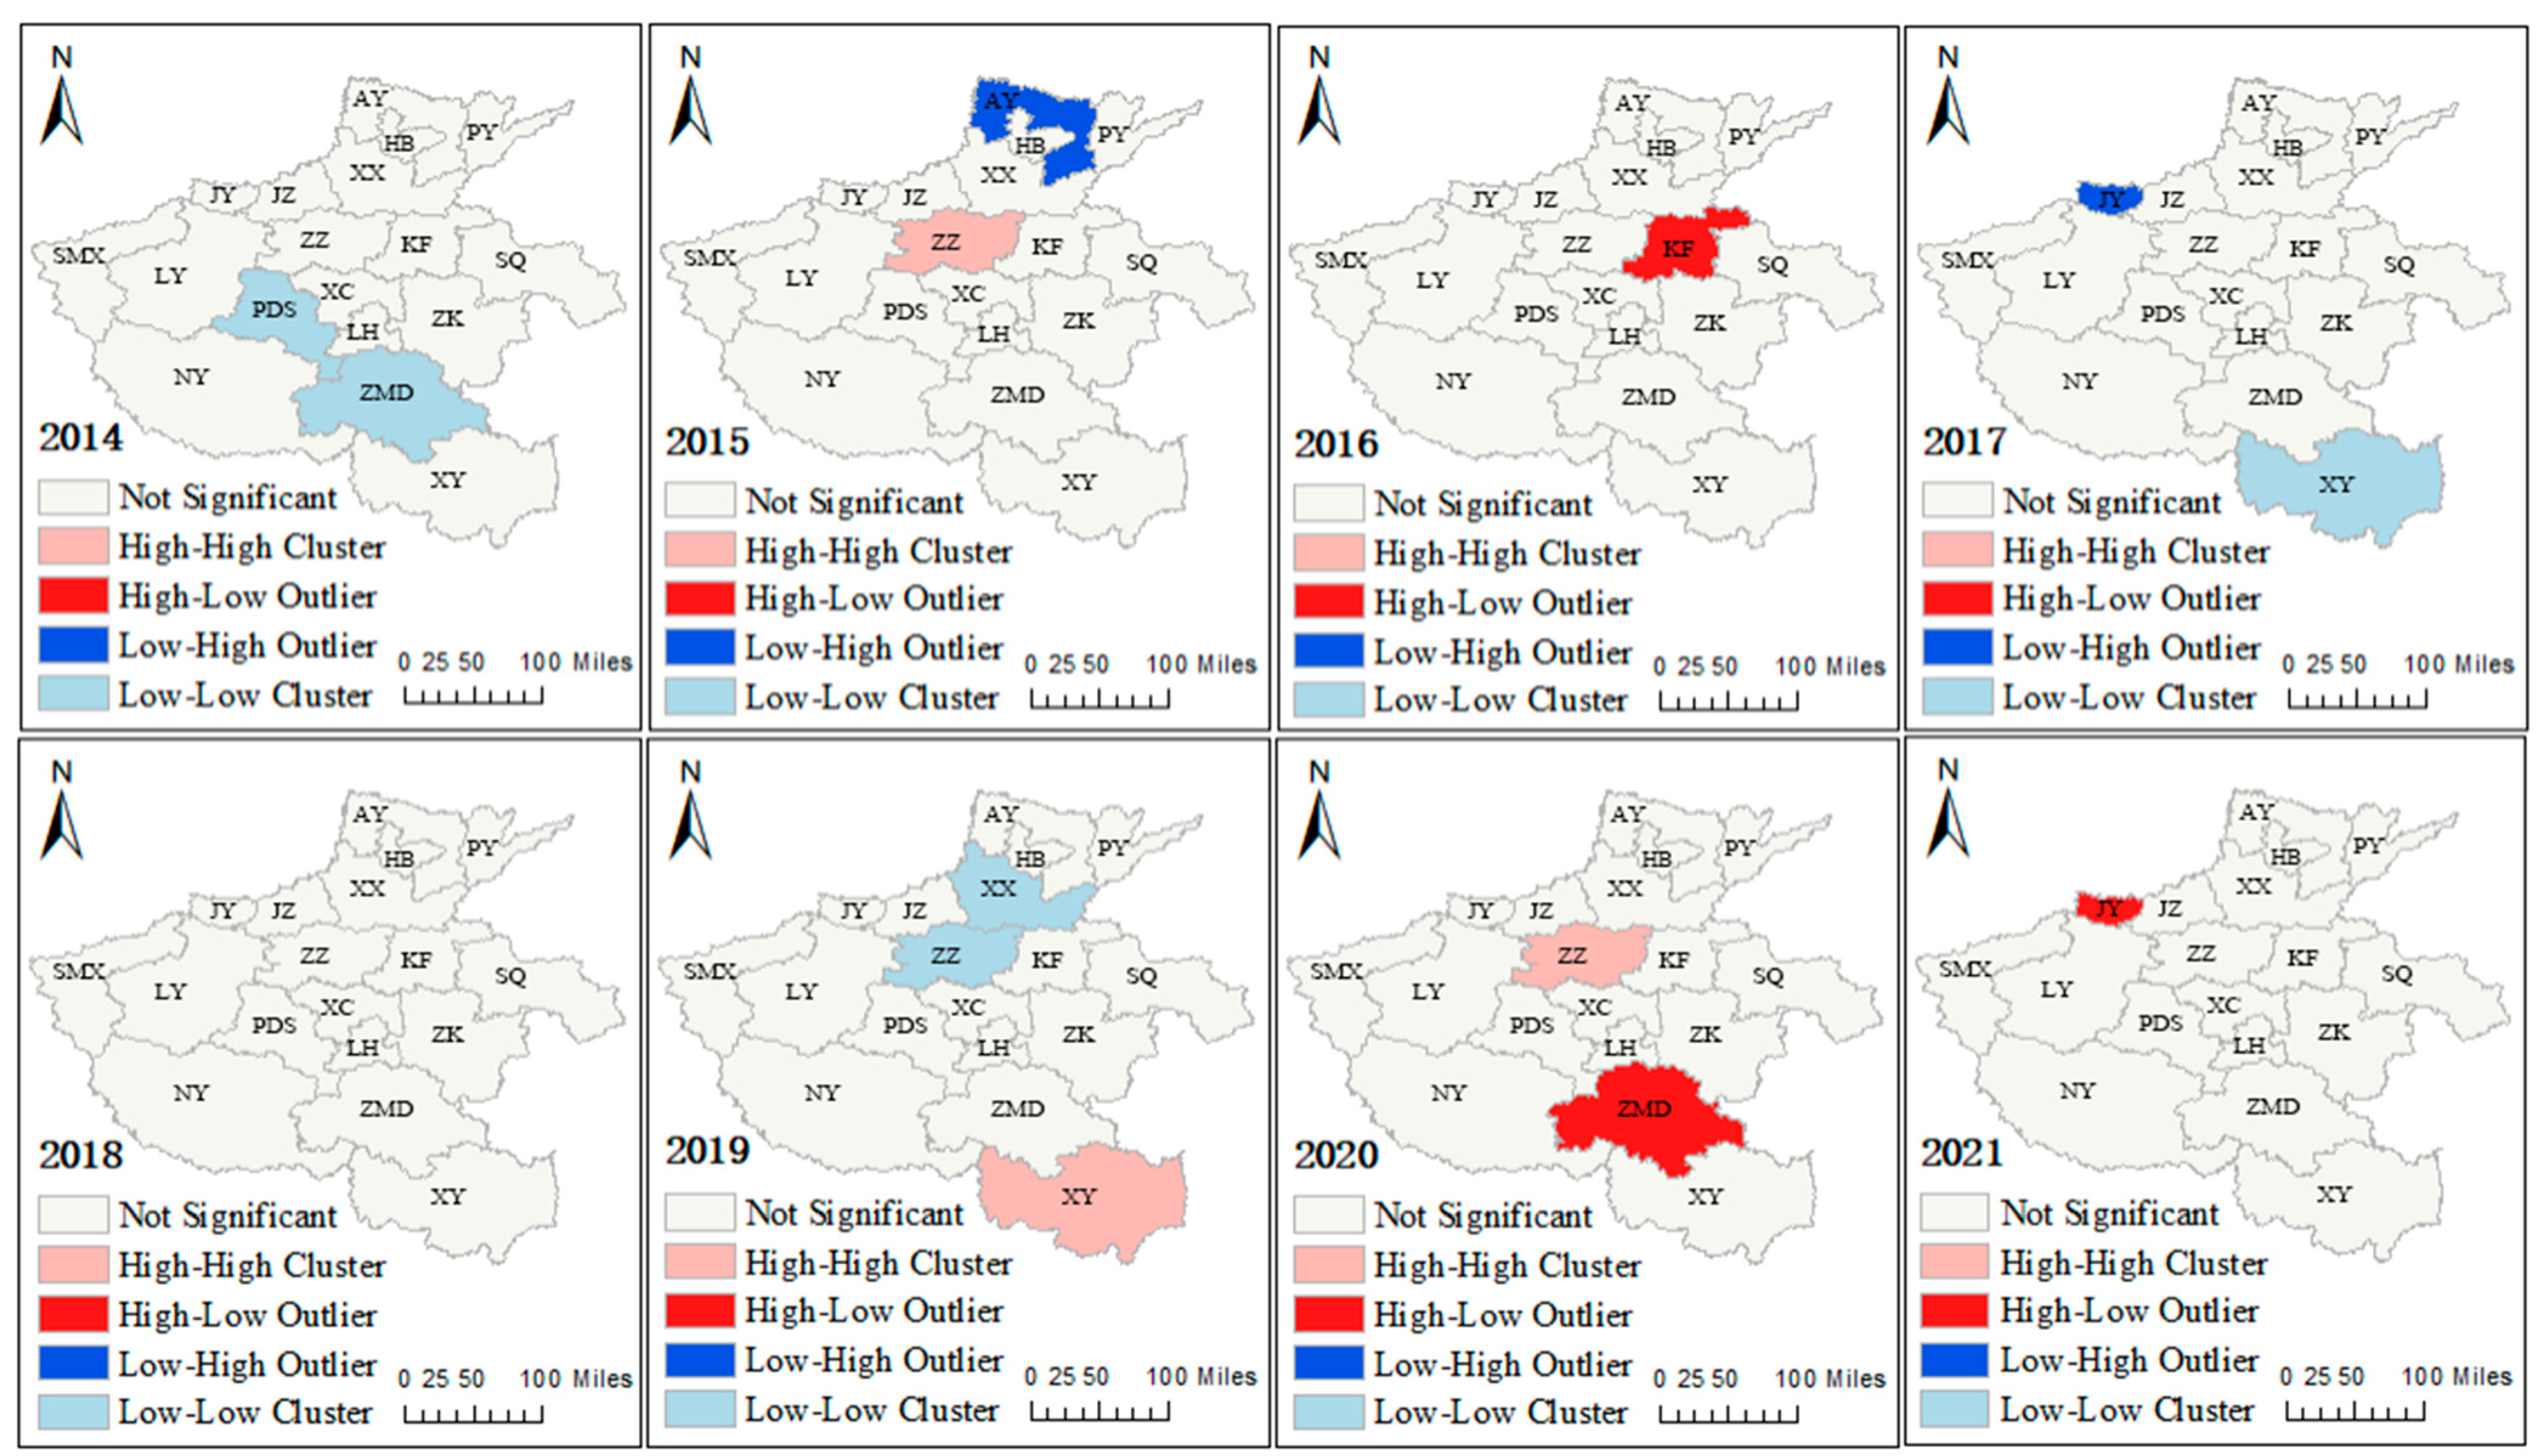
Given the above analysis, it can be seen that the synergy degree of emergency management for urban flood disasters presents spatial differentiation in local areas. However, the global Moran’s I cannot indicate the areas where the synergy degree exhibits high (or low) value clustering. Therefore, the LISA diagram was drawn to reveal the characteristics of local spatial agglomeration of the synergy degree, as shown in Figure 10. The LISA diagram can more intuitively reflect the spatial connections between regional units and their neighbors, which belong to the categories of high synergy–high synergy (HH), high synergy–low synergy (HL), low synergy–high synergy (LH), and low synergy–low synergy (LL) [63]. HH indicates a high value, and the surrounding areas are of high value. HL represents itself as a high value but surrounded by a low value; LH means that it is low but surrounded by high values; LL indicates that the value itself is low and the surrounding area is low. HH and LL represent positive spatial autocorrelation, indicating the clustering of similar values. HL and LH represent a negative spatial autocorrelation, indicating that there is spatial heterogeneity and a large spatial difference among study objects.
This study has found the following conclusions through analysis: ① In the past eight years, the local spatial autocorrelation of the synergy degree of urban flood disaster emergency management in Henan Province was unstable, and the spatial pattern of the synergy degree among different cities changed significantly, but the development law was not obvious. The synergy degree in 2019 did not generate agglomeration. In other years, Pingdingshan and Zhumadian only showed low–low clustering in 2014; Anyang only showed low–high clustering in 2015; Kaifeng only showed high–low clustering in 2016; Zhumadian only showed high–low clustering in 2020; Jiyuan showed low–high clustering in 2017 and high–low clustering in 2021; Xinyang showed low–low clustering in 2017 and high–high clustering in 2019; and Zhengzhou showed high–high clustering in 2015 and 2020 and low–low clustering in 2019, while there was no clustering in other years. ② In contrast, Zhengzhou is the city with the most agglomeration times and shows a positive spatial correlation, which indicates that this region makes Zhengzhou the radiation center to drive the coordinated development of other cities. Moreover, among cities with agglomeration in the past eight years, there are three high–high clusters, five low–low clusters, and five low–high (high–low) clusters, which reflects the collaborative capacity for emergency management of flood disasters between adjacent cities.

6. Analysis of Main Obstacle Factors for Synergy Degree

The overall level of the synergy degree of composite systems is very low, so further exploration of obstacle factors is of great help to improve the synergy degree in a targeted manner [57]. According to the calculation results of the obstacle degree model, only the top five obstacle factors are listed here from high to low, as shown in Table 6.
The main indicators that have a great impact on the synergy degree of emergency management for urban flood disasters in Henan Province are the number of beds for community service institutions and facilities per 10,000 people ( x 48 ), the number of unemployed insurance participants ( x 42 ), the proportion of fixed investment in public management, social security and social organizations ( x 45 ), the total number of posts and telecommunications services ( x 26 ), and the number of flood control projects ( x 36 ). From the perspective of years, the two indicators of the number of unemployed insurance participants ( x 42 ) and the proportion of fixed investment in public administration, social security, and social organizations ( x 45 ) from 2013 to 2021 have consistently ranked in the top three, which has a greater impact on the synergy degree. Furthermore, regarding the number of flood control projects ( x 36 ) from the top five to not in the top five to re-entering the top five, the influence on the synergy degree has a trend of first decreasing and then increasing [64]. Civil car ownership per 10,000 people ( x 16 ) has gradually increased from third to outside of the top five, and its influence is continuously declining. The obstacle factors ranked fourth and fifth have undergone greatly changes, but in terms of the frequency of occurrence, the impact of the total amount of postal and telecommunications business ( x 26 ) is greater. In most years, the three indices of the recovery and reconstruction subsystem ranked in the top five at least, indicating that the recovery and reconstruction subsystem is one of the main obstacle systems affecting the synergy degree of emergency management of urban flood disasters in Henan Province because it is the foundation for the sustainable development of the other three subsystems [65].

7. Conclusions

According to the panel data of 18 cities in Henan Province, this research conducted an empirical study on the urban flood disaster emergency management synergy degree and finally drew the following conclusions:
As a whole, the order degrees of the four subsystems in Henan Province were between 0.3 and 0.5, and those of the response and rescue subsystem were the lowest, which was found to be a weak subsystem that needed special attention and improvement. Secondly, the order degree and fluctuation degree over time of the intercity monitoring and early warning subsystem were the most obvious, indicating an imbalance of emergency information collaboration among different regions.
The synergy degree of cities repeatedly fluctuated from mild nonsynergy to mild synergy over time. The synergy degree of Henan Province remained at around 0.002, with a significant sawtooth shape from 2013 to 2021, and the highest level was in a mild synergy state, with a significant gap compared to high synergy.
The heterogeneity of the synergy degree among cities in Henan Province was obvious. Most cities in a synergy state were located in the Yellow River and Huai River basins. The coordination abilities of flood disaster emergency management among neighboring cities were mostly low or not quite equal (low–low, high–low).
On the whole, the two limiting factors with the greatest restricting effects on the synergy degree of flood disaster emergency management in Henan Province were, respectively, the “number of community service institutions and facility beds per 10,000 people” and the “number of participants in unemployment insurance”. The restoration and reconstruction subsystem was the main obstacle system that affected the synergy degree.

8. Discussion

Under the effect of global changes and urbanization, Chinese cities are prone to frequent flooding, which has become a difficult and painful challenge for current urban security with serious effects on urban public safety and sustainable development. The suddenness of rainstorms, uncertainty of floods, and severity of loss highlight the complexity of the urban flood problem. When flood disasters occur, the entire urban system is affected to varying degrees, and the impact is often cross-regional, cross-industrial, and cross-level. Hence, developing a cross-domain emergency management coordination mechanism is urgent. Starting from the current situation of urban flood disasters in China, this research constructed an evaluation index system of the urban flood disaster emergency management synergy degree according to the 4R theory proposed by American crisis management expert Robert Heath. Based on the panel data of 18 cities in Henan Province from 2013 to 2021, the composite system synergy degree model was applied for empirical evaluations, and synergy degree change characteristics were explored from in terms of time and space. Finally, the obstacle degree model was applied to diagnose the main obstacle factors restricting the coordinated development of urban flood disaster emergency management. This research helped explore the regularity of urban flood disaster collaborative management. Furthermore, this research used a composite system cooperation degree model to investigate the effect of flood disaster coordination management; expanded the application field of the model; and provided a new research perspective for current disaster emergency treatment and rescue to optimize comprehensive urban flood management systems, improve the scientific nature as well as the effectiveness of urban flood disaster management, and provide support for urban disaster prevention and reduction and sustainable development.
Of course, some limitations still exist. Firstly, the data in this research might not cover the factors affecting the coordination level of urban flood disaster emergency management, and more relevant data regarding emergencies should be added to more accurately reflect the actual situation. Secondly, this research focused on the static calculation of the emergency management synergy degree for urban flood disasters in different time series, ignoring the speed change characteristics of the dynamic evolution of system coordination, such as the measures of velocity states and trends [66,67]. In the future, we will continue to conduct in-depth studies on this issue, and we look forward to the joint participation of relevant researchers.

Author Contributions

Conceptualization, Y.H.; methodology, Y.H.; validation, C.W.; writing—original draft, C.W.; data curation, D.L.; supervision, D.L. and C.S.; editing, D.L.; resources, C.S. All authors have read and agreed to the published version of the manuscript.

Funding

This research is funded by the National Natural Science Foundation of China (NSFC)(52374196); Humanities and Social Sciences Foundation of Henan Polytechnic University (SKYJ2021-01); Philosophy and Social Science Innovation Team of Henan Province (2023-CXTD-06); Research Foundation of Humanities & Social of Henan Polytechnic University (SKJQ2020-01).

Institutional Review Board Statement

Not applicable.

Informed Consent Statement

Not applicable.

Data Availability Statement

Data are available from the authors upon reasonable request.

Conflicts of Interest

The authors declare no conflicts of interest.

References

  1. Zhang, W.; Villarini, G.; Vecchi, G.A.; Smith, J.A. Urbanization exacerbated the rainfall and flooding caused by hurricane Harvey in Houston. Nature 2018, 563, 384–388. [Google Scholar] [CrossRef] [PubMed]
  2. Song, X.M.; Zhang, J.Y.; Zhan, C.S.; Liu, C.Z. Review for impacts of climate change and human activities on water cycle. Shuili Xuebao/J. Hydraul. Eng. 2013, 44, 779–790. [Google Scholar]
  3. Tellman, B.; Sullivan, J.A.; Kuhn, C.; Kettner, A.J.; Slayback, D.A. Satellite imaging reveals increased proportion of population exposed to floods. Nature 2021, 596, 80–86. [Google Scholar] [CrossRef] [PubMed]
  4. Anand, D.T.; Prakash, M.M. A synergistic approach towards understanding flood risks over coastal multi-hazard environments: Appraisal of bivariate flood risk mapping through flood hazard, and socio-economic-cum-physical vulnerability dimensions. Sci. Total Environ. 2023, 901, 166423. [Google Scholar]
  5. Winsemius, H.C.; Aerts, J.C.J.H.; Van Beek, L.P.H.; Bierkens, M.F.P.; Bouwman, A.; Jongman, B.; Kwadijk, J.C.J.; Ligtvoet, W.; Lucas, P.L.; Van Vuuren, D.P.; et al. Global drivers of future river flood risk. Nat. Clim. Chang. 2016, 6, 381–385. [Google Scholar] [CrossRef]
  6. Wing, O.E.J.; Lehman, W.; Bates, P.D.; Sampson, C.C.; Quinn, N.; Smith, A.M.; Neal, J.C.; Porter, J.R.; Kousky, C. Inequitable patterns of US flood risk in the Anthropocene. Nat. Clim. Chang. 2022, 12, 156–162. [Google Scholar] [CrossRef]
  7. Zhang, J.Y.; Wang, Y.T.; He, R.M.; Hu, Q.; Song, X. Discussion on the urban flood and waterlogging and causes analysis in China. Adv. Water Sci. 2016, 27, 485–491. [Google Scholar]
  8. Liu, D.L.; Yang, Z.W.; Xu, X.Y.; Wu, S.Y.; Wang, Y.X. Assessment and influencing factors of urban residents’ flood emergency preparedness capacity: An example from Jiaozuo City, China. Int. J. Disaster Risk Reduct. 2024, 102, 104294. [Google Scholar] [CrossRef]
  9. Xu, Z.X.; Cheng, T.; Ren, M.F. When will “the city looks at the sea” stop-also on the function and role of sponge city. China Flood Drought Manag. 2017, 27, 64–66, 95. [Google Scholar]
  10. Song, X.M.; Zhang, J.Y.; He, R.M.; Zou, X.J.; Zhang, C.H. Urban flood and waterlogging and causes analysis in Beijing. Adv. Water Sci. 2019, 30, 153–165. [Google Scholar]
  11. Zhang, Q.X.; Hu, J.Y.; Song, X.P.; Li, Z.H.; Yang, K.H.; Sha, Y.Z. How does social learning facilitate urban disaster resilience? A systematic review. Environ. Hazards 2020, 19, 107–129. [Google Scholar] [CrossRef]
  12. Xu, Z.X.; Chen, H.; Ren, M.F.; Cheng, T. Progress on disaster mechanism and risk assessment of urban flood/waterlogging disasters in China. Adv. Water Sci. 2020, 31, 713–724. [Google Scholar]
  13. Hu, X.M.; Zou, T.T. Study on the characteristics and effectiveness of urban flood control policies in China. J. Guangzhou Univ. (Soc. Sci. Ed.) 2022, 21, 130. [Google Scholar]
  14. An, H.Y.; Huang, C.F.; Li, Y. The Collaborative Governance of Ethical Risks in Emerging Technologies. Sci. Technol. Prog. Policy 2024, 41, 21–30. [Google Scholar]
  15. Leidner, E.D.; Pan, G.; Pan, L.S. The role of IT in crisis response: Lessons from the SARS and Asian Tsunami disasters. J. Strateg. Inf. Syst. 2009, 18, 80–99. [Google Scholar] [CrossRef]
  16. Salmon, P.M.; Neville, A.S.; Jenkins, D.P. Coordination during multi-agency emergency response: Issue and solution. Disaster Prev. Manag. 2011, 20, 140–158. [Google Scholar] [CrossRef]
  17. Kapucu, N.; Arslan, T.; Demiroz, F. Collaborative emergency management and national emergency management network. Disaster Prev. Manag. 2010, 19, 452–468. [Google Scholar] [CrossRef]
  18. Comfort, L.K. Crisis Management in Hindsight: Cognition Communication Coordination and Control. Public Adm. Rev. 2007, 67, 189–197. [Google Scholar] [CrossRef]
  19. Mcguire, M.; Silvia, C. The Effect of Problem Severity, Managerial and Organizational Capacity, and Agency Structure on Intergovernmental Collaboration: Evidence from Local Emergency Management. Public Adm. Rev. 2010, 70, 279–288. [Google Scholar] [CrossRef]
  20. Carver, L.; Turoff, M. Human-computer interaction: The human and computer as a team in emergency management information systems. Commun. ACM 2007, 50, 33–38. [Google Scholar] [CrossRef]
  21. Ha, K.M.; Oh, H.M. Selective versus comprehensive emergency management in korea. Springerplus 2014, 3, 602. [Google Scholar] [PubMed]
  22. Strader, S.M.; Roueche, D.B.; Davis, B.M. Unpacking Tornado Disasters: Illustrating Southeastern US Tornado Mobile and Manufactured Housing Problem Using March 3, 2019 Beauregard-Smith Station, Alabama, Tornado Event. Nat. Hazards Rev. 2021, 22, 04020060. [Google Scholar] [CrossRef]
  23. Waugh, W.L.; Streib, G. Collaboration and Leadership for Effective Emergency Management. Public Admin. Rev. 2006, 66, 131–140. [Google Scholar] [CrossRef]
  24. Carreras-Coch, A.; Navarro, J.; Sans, C.; Zaballos, A. Communication technologies in emergency situations. Electronics 2022, 11, 1155. [Google Scholar] [CrossRef]
  25. Lu, Y.Z. China should improve its ability to resist flood and drought disasters—Summary of the Symposium on Flood disaster Research. Proc. Chin. Acad. Sci. 1991, 4, 340–341. [Google Scholar]
  26. Xiang, L.Y. Regional emergency network: Overall framework and operation mechanism. N Vis. 2009, 6, 64–66. [Google Scholar]
  27. Zhang, K.F.; Shang, J.J.; Liu, L.; Yan, S. Research on construction of water environment safety emergency system in Nansi Lake Basin. People’s Yangtze River 2017, 48, 16–20. [Google Scholar]
  28. He, H.X. Exploration of flood disaster population estimation method based on Remote sensing and mobile location service. Disaster Reduct. China 2019, 5, 40–43. [Google Scholar]
  29. Zhang, Z.J.; Yuan, D.P.; Huang, Z.J.; Yang, L.L. Hierarchical Collaborative response Emergency scheduling and path planning under urban flood disaster. China Saf. Prod. Sci. Technol. 2023, 19, 202–208. [Google Scholar]
  30. Lin, S. Endogenous demands of subject: Challenges and breakthroughs in China’s emergency resource management model. Seeking 2010, 4, 94–96. [Google Scholar]
  31. Li, H.Y. Definition and interaction of participants in emergency management of sudden water disaster events. Prog. Water Conserv. Hydropower Sci. Technol. 2013, 33, 31–35. [Google Scholar]
  32. Zhao, J. Research on disaster prevention and relief emergency and operation management mechanism of flood storage area from the perspective of multi-subject participation: A case study of flood storage area in Huaihe River Basin. Jiangxi J. Agric. 2014, 26, 116–120. [Google Scholar]
  33. Yang, W.W.; Liu, H.Z.; Zhou, Z.X. Research on the dilemma and countermeasures of multi-subject participation in natural disaster emergency management in China: A case study of Shandong Province against Typhoon Lekima. Guangzhou Inst. Soc. 2019, 19, 82–88. [Google Scholar]
  34. Wang, H. Establishing a framework of big security and big emergency to strengthen urban flood prevention and control. Disaster Reduct. China 2023, 1, 18–21. [Google Scholar]
  35. Li, C.W.; Shi, Y.; Liu, J.; He, Z.; Yu, Y.; Huang, M.; Qian, Z. Studies on collaborative response model for flood and waterlogging disasters in Chengdu-Chongqing Urban Agglomeration. China Water Resour. 2023, 9, 13–17. [Google Scholar]
  36. Peng, Y.Y.; Zhang, L.L. Research on urban flood disaster emergency management framework from the perspective of “multi-agents-whole process”. Henan Sci. 2022, 40, 2023–2030. [Google Scholar]
  37. Kapucu, N. Collaborative governance in international disasters: Nargis cyclone in Myanmar and Sichuan earthquake in China cases. Int. J. Emerg. Manag. 2011, 8, 1–25. [Google Scholar] [CrossRef]
  38. Lu, Y.L.; Yang, X.W. Construction of sustainable supply chain collaborative management model for sudden water pollution reduction project. People’s Yellow River 2024, 46, 99–104. [Google Scholar]
  39. Yu, F.; Fan, B. Information coordination structure of complex disaster management from the perspective of “scenario-structure-element”. Inf. Theory Pract. 2024, 1–13. Available online: https://kns.cnki.net/kcms2/article/abstract?v=a2GKbg6fW_amv4Wc4AKxwakOQKJCUFbcp2ejbK7ATWDTgf12e0Uy67PBIbHECxD0sEwjTd_ak2guGsLfJLbY7capQpo4SGpDNxdHRYyvUW5GoWj9zSOKwR6d0725t-wrK7q7L8Kfr-8=&uniplatform=NZKPT&language=CHS (accessed on 25 May 2024).
  40. Wu, F.P.; Wang, R.F.; Ji, Y.W. The idea of coordinated management mechanism for disaster warning and emergency response of transboundary rivers in China. China Popul. Resour. Environ. 2023, 33, 208–217. [Google Scholar]
  41. Liu, J.; Tao, L.; Yang, Y. Cause analysis of the “21·7” sustained rainstorm in Henan Province. Hydrol. Lancet 2023, 5, 69–75. [Google Scholar]
  42. Wang, J.C.; Lin, J.X.; Zhang, F. Research on coordination degree of emergency management based on ISM two-dimensional cloud model. J. Saf. Sci. Technol. 2019, 15, 38–44. [Google Scholar]
  43. Zhu, C.Y.; Tang, S.F.; Fu, H.; Yuan, S.W. Analysis on the collaborative development of China’s medical service system and public health system based on the model of complex system synergy degree. Chin. Hosp. 2023, 27, 31–34. [Google Scholar]
  44. Li, D.Z.; Hong, J.Z.; Zhu, S.X.; Cui, P. Evolution mechanism of urban flood resilience based on complex adaptive system: A case study of Kunshan City. J. Syst. Sci. 2019, 31, 63–68+116. [Google Scholar]
  45. Li, Y.L.; Lan, Z.Q.; Zhang, L.; Kuang, Y.H. Evaluation of flood disaster emergency capability based on AHP fuzzy comprehensive evaluation method. J. North China Inst. Sci. Technol. 2022, 19, 56–61. [Google Scholar]
  46. Yang, X.D.; Li, Z.W.; Zhang, J.Y.; Li, H.L. Sustainable development perspective of urban toughness of space-time evaluation. J. Urban Probl. 2021, 3, 29–37. [Google Scholar]
  47. Zhang, Y.; Qiu, D.Y.; Zhang, B.; Chen, Y. Comprehensive evaluation of DC-DC converters based on Analytic Hierarchy Process Entropy Method. J. Beihang Univ. 2023, 1–14. [Google Scholar] [CrossRef]
  48. Wang, C.F.; Wu, X.R. Evaluation of Maintenance Station Site Selection for Third Party Aviation Maintenance Enterprises: TOPSIS Analysis Based on Entropy CRITIC Composite Weighting. Technol. Ind. 2023, 23, 214–220. [Google Scholar]
  49. Haken, H. Synergetics: Introduction and Advanced Topics; Springer: Berlin, Germany, 2004; pp. 24–45. [Google Scholar]
  50. He, W.J.; Li, Q.; Chen, X.; Zhang, W. Study on industrial synergy degree measurement and influencing factors of Chang-Zhu-Tan urban agglomeration. J. Hunan Univ. Technol. (Soc. Sci. Ed.) 2020, 25, 37–46. [Google Scholar]
  51. Huang, J.; Hou, Z.Q. Research on the synergetic development of Yunnan regional logistics and low-carbon economy by the model of composite system coordinating degree. J. Chongqing Univ. Technol. (Soc. Sci.) 2020, 7, 106–121. [Google Scholar]
  52. Wu, C.X. Research on the Synergistic Effect of Low-carbon Economy in China. Manag. World 2021, 5, 105–117. [Google Scholar]
  53. Li, Y.; Feng, X. Is Poverty Concentrated in Shanghai? Spatial Patterns in Social Housing and Their Implications for Social Equality in Chinese Cities. Sustainability 2024, 16, 2009. [Google Scholar] [CrossRef]
  54. Chen, Z.; Sun, W.J.; Tan, C.C.; Zhang, W.; Yang, R.D.; Li, Q. Spatial correlation analysis of agricultural land use in Guangdong Province based on Moran’s I. Guangdong Econ. 2023, 38–42. [Google Scholar]
  55. Cui, H.R.; Wang, Z.Z. Regional Differences, spatial correlation and convergence of inclusive green development efficiency in China’s eight comprehensive economic Zones. Ecol. Econ. 2019, 39, 30–38+84. [Google Scholar]
  56. Weng, G.M.; Tang, Y.B.; Pan, Y.; Mao, Y.Q. Spatiotemporal Evolution and Spatial Difference of Tourism-Ecology-Urbanization Coupling Coordination in Beijing-Tianjin-Hebei Urban Agglomeration. Econ. Geogr. 2021, 9, 196–204. [Google Scholar]
  57. Shi, Y.F.; Zhang, T.L. Study on the coupling coordination and obstacle degree of ecological protection and high-quality development in the Yellow River Basin. People Yellow River 2024, 46, 8–15. [Google Scholar]
  58. Regional Introduction to Henan Province. Available online: https://baike.baidu.com/item/%E6%B2%B3%E5%8D%97%E7%9C%81/59474?fr=ge_ala25.55 (accessed on 25 April 2024).
  59. 1938 Huayuankou Levee Breach. Available online: https://baike.baidu.com/item/%E8%8A%B1%E5%9B%AD%E5%8F%A3%E5%86%B3%E5%A0%A4/8511019?fr=ge_ala (accessed on 2 December 2023).
  60. 1975 Heavy Rainstorm in Zhumadian, Henan Province. Available online: https://baike.baidu.com/item/1975%E6%B2%B3%E5%8D%97%E9%A9%BB%E9%A9%AC%E5%BA%97%E7%89%B9%E5%A4%A7%E6%9A%B4%E9%9B%A8/145579?fr=ge_ala (accessed on 2 December 2023).
  61. The “July 20” Extremely Heavy Rainstorm in Zhengzhou in 2021. Available online: https://baike.baidu.com/item/7%C2%B720%E9%83%91%E5%B7%9E%E7%89%B9%E5%A4%A7%E6%9A%B4%E9%9B%A8/58047836?fr=ge_ala (accessed on 2 December 2023).
  62. Zhang, C.K.; Li, H.; Zhang, Y.J.; Yang, L.L. Financial technology and the digital village coupled coordination: Temporal and spatial evolution and driving factors. J. Stat. Theory Pract. 2023, 9, 52–58. [Google Scholar]
  63. Li, D.Z.; Nie, X.; Zhu, S.Y.; Zhou, S.H. Quantitative Evaluation and Spatial-temporal Evolution of County-level Flood resilience: A Case Study of Jiangsu Province. J. Catastrophology 2023, 38, 99–106. [Google Scholar]
  64. Yi, B.; Shi, K. Study on the coupling coordination relationship and obstacle factors between scientific and technological innovation and regional economy in Chang-Zhu-Tan urban Agglomeration. J. Huaiyin Norm. Univ. (Philos. Soc. Sci. Ed.) 2023, 45, 580–587+601+647–648. [Google Scholar]
  65. Xie, G.G.; Jiang, S.Q.; Zhao, C.Y. Study on resilience evaluation, early warning and obstacle factors of digital industry innovation ecosystem in Anhui Province. J. Heihe Univ. 2019, 14, 70–74+98. [Google Scholar]
  66. Chen, H.; Li, M.Q.; Li, J.Q. Patent intensive intellectual property management synergy and evolution. Sci. Res. 2022, 40, 652–664. [Google Scholar]
  67. Chen, W.; Yang, Z.L.; Li, J.Q. Empirical study on regional Intellectual property management system collaboration and its Evolution. Sci. Sci. Sci. Technol. Manag. 2016, 37, 30–41. [Google Scholar]
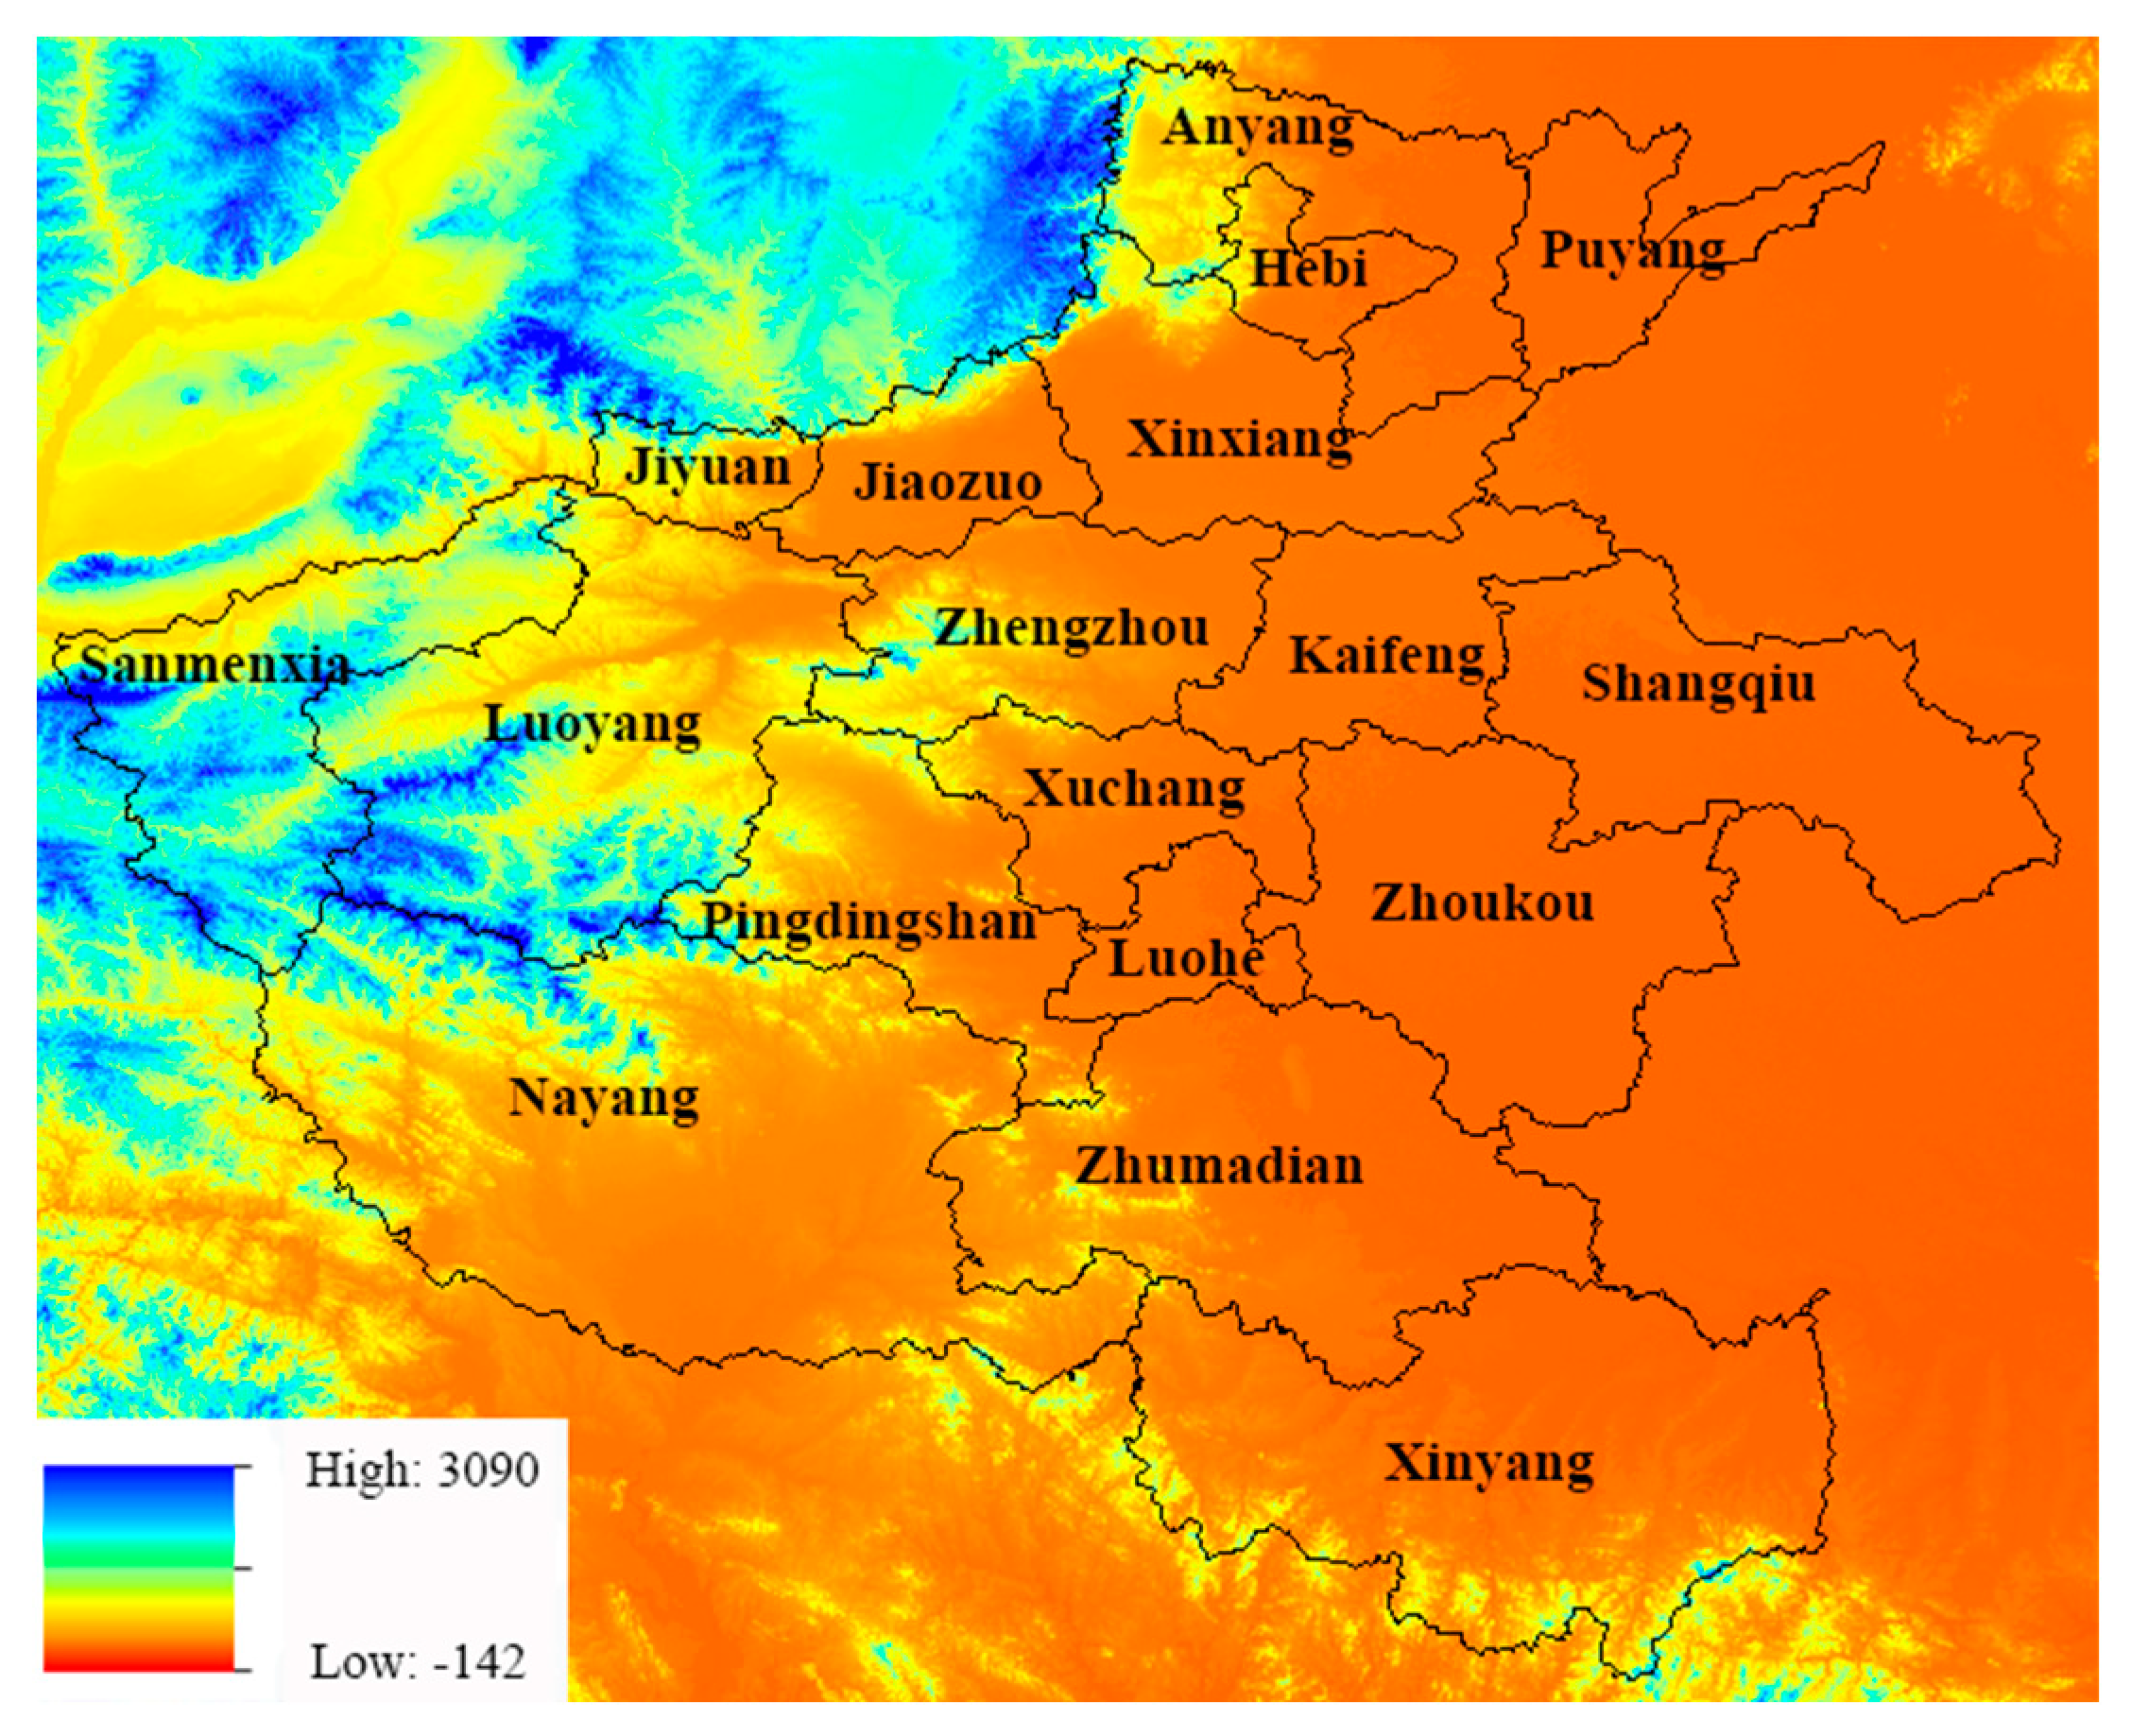
Figure 1. The research area diagram.
Sustainability 16 04730 g001
Figure 2. The order degree of preventive preparation subsystem.
Sustainability 16 04730 g002
Figure 3. The order degree of monitoring and early warning subsystem.
Sustainability 16 04730 g003
Figure 4. The order degree of response rescue subsystem.
Sustainability 16 04730 g004
Figure 5. The order degree of recovery and reconstruction subsystem.
Sustainability 16 04730 g005
Figure 6. Synergy degree of cities from 2014 to 2021 and the year’s average value.
Sustainability 16 04730 g006
Figure 7. Synergy degree of composite systems in two different regions.
Sustainability 16 04730 g007
Figure 8. Order degree of subsystem and synergy degree of composite system.
Sustainability 16 04730 g008
Figure 9. Spatial distribution of synergy degree from 2014 to 2021.
Sustainability 16 04730 g009
Figure 10. LISA clustering distribution of local spatial autocorrelation.
Sustainability 16 04730 g010
Table 1. Evaluation index system for urban flood emergency management.
Primary IndicesSecondary IndicesTertiary IndicesWeight
Composite system for urban flood emergency management
S
Prevention and preparednesssub
system
S 1
Comprehensive   production   capacity   of   daily   water   supply   per   person   x 11 0.141
Share   of   fixed   investment   in   transportation ,   storage ,   and   postal   industry   x 12 0.103
Share   of   fixed   investment   in   water   conservancy ,   environment ,   and   utilities   management   sec tor   x 13 0.148
Share   of   public   sec urity   expenditures   x 14 0.140
Food   self - sufficiency   per   10,000   people   x 15 0.082
Vehicle   ownership   per   10,000   population   x 16 0.182
GDP   per   capita   x 17 0.203
Monitoring and early warning subsystem
S 2
Fixed - line   telephone   penetration   x 21 0.153
Mobile   phone   penetration   x 22 0.166
Television   coverage   of   population   x 23 0.104
Broadcast   population   coverage   x 24 0.071
Internet   user   x 25 0.219
Total   post   and   telecommunications   business   x 26 0.287
Response and rescue subsystem
S 3
Number   of   health   workers   per   10,000   population   x 31 0.180
Number   of   beds   in   medical   and   health   institutions   per   10,000   people   x 32 0.142
Urbanization   rate   x 33 0.210
Share   of   resident   population   aged   15 64   years   x 34 0.100
Drainage   density   in   built - up   areas   x 35 0.162
Number of flood protection projects (cumulative number of urban reservoirs ,   sluices ,   ponds   and   dams )     x 36 0.206
Recovery and reconstruction subsystem
S 4
Number   of   participants   in   basic   medical   insurance   x 41 0.084
Number   of   insured   individuals   with   unemployment   insurance   x 42 0.169
Share   of   expenditure   on   social   security   and   employment   x 43 0.046
Share   of   fixed   investment   in   health   and   casework   x 44 0.092
Share   of   fixed   investment   in   public   administration ,   social   security ,   and   social   organizations   x 45 0.133
Per   capita   disposable   income   of   households   x 46 0.086
Number   of   medical   assistance   funds   per   capita   x 47 0.076
Number   of   beds   in   community   service   institutions   and   facilities   per   10,000   people   x 48 0.187
Overall   labor   productivity   x 49 0.127
Table 2. Division interval of synergy degree.
Synergy DegreeType
−1 ≤ D < −0.666High lack of synergy
−0.666 ≤ D < −0.333Moderate lack of synergy
−0.333 ≤ D < 0Mild nonsynergy
0 ≤ D < 0.333Mild synergy
0.333 ≤ D < 0.666Moderate synergy
0.666 ≤ D ≤ 1High synergy
Table 3. Results of synergy degree of complex system in 18 cities.
City20142015201620172018201920202021
Zhengzhou−0.00420.0075−0.0134−0.01920.0161−0.01820.0279−0.0334
Kaifeng0.0141−0.00760.0145−0.01660.0083−0.03650.0246−0.0187
Luoyang−0.01070.01530.01890.03980.0241−0.02710.0327−0.0460
Pingdingshan−0.00480.01650.0110−0.0277−0.0151−0.0289−0.01290.0227
Anyang0.0134−0.0191−0.0285−0.02770.0295−0.01550.02560.0259
Hebi−0.01330.04020.0251−0.0164−0.00950.0185−0.0256−0.0270
Xinxiang0.02250.0340−0.0094−0.0251−0.0116−0.02400.0415−0.0191
Jiaozuo0.01730.0351−0.01330.0233−0.0170−0.02070.0137−0.0390
Puyang−0.02660.02680.0201−0.0297−0.0259−0.0626−0.0328−0.0054
Xuchang0.01170.0272−0.02360.02240.0178−0.01020.03230.0151
Luohe−0.01980.00810.04630.01030.0135−0.03680.02120.0136
Sanmenxia0.0168−0.01990.04110.0189−0.02480.04330.03600.0077
Nanyang−0.01690.01670.0071−0.0405−0.02390.0487−0.05830.0271
Shangqiu0.0070−0.0155−0.02580.0310−0.01420.02030.01700.0271
Xinyang−0.0069−0.0178−0.0123−0.02250.08460.0338−0.0145−0.0139
Zhoukou−0.01660.00980.00940.02650.02090.0205−0.03080.0160
Zhumadian−0.0178−0.01940.0229−0.01830.02050.01840.0367−0.0394
Jiyuan0.0271−0.03130.0685−0.01210.0341−0.01380.00540.0284
Table 4. The change rate of synergy degree when the weight coefficient of an index changes by %1, 5%, and 10%, respectively (%).
City1%5%10%City1%5%10%
Zhengzhou0.04310.21510.4288Xuchang0.00380.01880.0375
Kaifeng0.03420.17130.3434Luohe0.08500.42280.8403
Luoyang0.00560.02810.0563Sanmenxia0.01300.06500.1300
Pingdingshan0.01240.06190.1237Nanyang0.18400.93051.8880
Anyang0.05800.29090.5843Shangqiu0.03140.15690.3130
Hebi0.25691.26532.4849Xinyang0.00380.01910.0382
Xinxiang0.06450.32110.6391Zhoukou0.00040.00220.0044
Jiaozuo0.00790.03950.0790Zhumadian0.00970.04840.0970
Puyang0.01270.06340.1267Jiyuan0.00200.01020.0205
Table 5. The global Moran’s I of synergy degree of composite system.
TimeMoran’s Ip ValueZ-Test ValueVariance
2014−0.05980.9948−0.00650.0252
2015−0.14800.5737−0.56260.0251
2016−0.12050.6879−0.40170.0236
20170.17240.14511.45700.0252
2018−0.14200.5656−0.57460.0209
20190.26860.03632.09320.0245
2020−0.29230.1311−1.50970.0239
2021−0.16080.5220−0.64030.0254
Table 6. Main obstacle factors and obstacle degree of complex system.
Time12345
2013 x 48 17.773 x 36 5.351 x 16 4.944 x 33 4.816 x 26 4.647
2014 x 48 17.167 x 42 5.759 x 45 5.558 x 36 4.949 x 26 4.697
2015 x 42 7.676 x 26 6.185 x 36 5.898 x 48 5.625 x 15 5.154
2016 x 42 8.128 x 45 7.439 x 26 6.143 x 44 5.398 x 36 5.281
2017 x 42 8.947 x 26 8.078 x 36 5.705 x 17 5.441 x 16 5.372
2018 x 42 8.183 x 26 6.443 x 45 5.873 x 17 5.524 x 48 5.496
2019 x 42 8.577 x 48 6.875 x 17 6.801 x 26 5.642 x 49 5.305
2020 x 45 11.440 x 42 9.263 x 48 6.519 x 13 4.673 x 47 4.671
2021 x 42 9.381 x 45 7.507 x 48 6.459 x 26 5.792 x 36 5.182
Disclaimer/Publisher’s Note: The statements, opinions and data contained in all publications are solely those of the individual author(s) and contributor(s) and not of MDPI and/or the editor(s). MDPI and/or the editor(s) disclaim responsibility for any injury to people or property resulting from any ideas, methods, instructions or products referred to in the content.