
Empowering Urban Public Transport Planning Process for Medium-Sized Cities in Developing Countries: Innovative Decision Support Framework for Sustainability


Abstract
1. Introduction
2. Literature Review
2.1. SUPTM Application
2.2. KonSULT KB Application
2.3. Hybrid Multiple-Attribute Decision Making (HMADM)

| Objectives | Applications | Applied * | Fuzzy Environment | Area (Year) | References |
|---|---|---|---|---|---|
| To introduce KonSULT, a decision support tool, which identifies synergistic combinations of policy instruments to generate effective policy packages. | Generating and ranking of SULT policy measure | Weighting and scoring methods | - | Europe (2012) | [17] |
| To introduce a decision support procedure for analyzing and generating consensus among various stakeholders in a transit development. | Utilization of the decision support procedure | FAHP and interval AHP | ✓ | Turkey (2019) | [52] |
| To examines the sustainable benchmarking of a public transport system. | Practical implementation of public transportation | Fuzzy logic and AHP | ✓ | India (2019) | [53] |
| To prioritizing failures for corrective actions in the BRT system. | The maintenance of public transportation | AHP and TOPSIS | - | Turkey (2019) | [54] |
| To prioritize public transportation projects in Kırıkkale, to enhance urban livability and facilitate transparent decision making for developing cities. | Public transportation planning | AHP and TOPSIS | - | Turkey (2020) | [41] |
| To develop and implement effective mobility measures for sustainable transport systems. | Promoting sustainable mobility | COPRAS, TOPSIS, ARAS, EDAS, and WAM | - | Lithuania (2020) | [42] |
| To select electric buses for sustainable transportation. | Selection of sustainable transportation | AHP and TOPSIS | - | Turkey (2020) | [43] |
| To determine the criteria of the public transport infrastructure that have the most influence on passenger satisfaction. | Urban public transportation planning | Delphi and TOPSIS | - | Lithuania (2020) | [55] |
| To determine the significant supply quality criteria of public transportation. | Public transportation planning | AHP and BWM | - | Jordan (2020) | [56] |
| To provide a comprehensive method of evaluation for public transportation in Ciudad Juárez, Chihuahua. | Public transportation evaluation | CODAS and Pythagorean fuzzy sets | ✓ | Mexico (2021) | [57] |
| To evaluate sustainable public transportation in Tehran. | Public transportation evaluation | FBWM and MABAC | ✓ | Iran (2021) | [58] |
| To assess the quality of public transport services in Budapest, Hungary. | Public transport decision making | FAHP and FTOPSIS | ✓ | Hungary (2021) | [59] |
| To assess public transport modes in Kampala, Uganda, from a transportation operator’s perspective. | Public transportation planning | ANP, and ÉLECTRE III | - | Uganda (2022) | [60] |
| To investigate performance measures and propose recommendations for the sustainable public transport sector in India. | Evaluating the quality of public transport | TOPSIS, VIKOR, ÉLECTRE, Delphi, and FAHP | ✓ | India (2022) | [35] |
| To enhance public bus transport, prioritize improvements for citizen welfare and government investments. | Enhancement of public transportation | AHP and ANP | - | Hungary (2023) | [61] |
| To assess and enhance public transportation in Budapest, Hungary. | Public transportation evaluation | BWM, AHP, and MOORA | - | Hungary (2023) | [62] |
| To prioritize policy measure options for SULT planning and development in small-town areas of developing countries. | Prioritization of SULT policy measures | AHP and TOPSIS | - | Thailand (2023) | [44] |
| To determine the most suitable LRT for urban transportation systems and create efficient vehicle fleets. | Selection of public transportation | BWM and WASPAS’PH | - | Turkey (2024) | [63] |
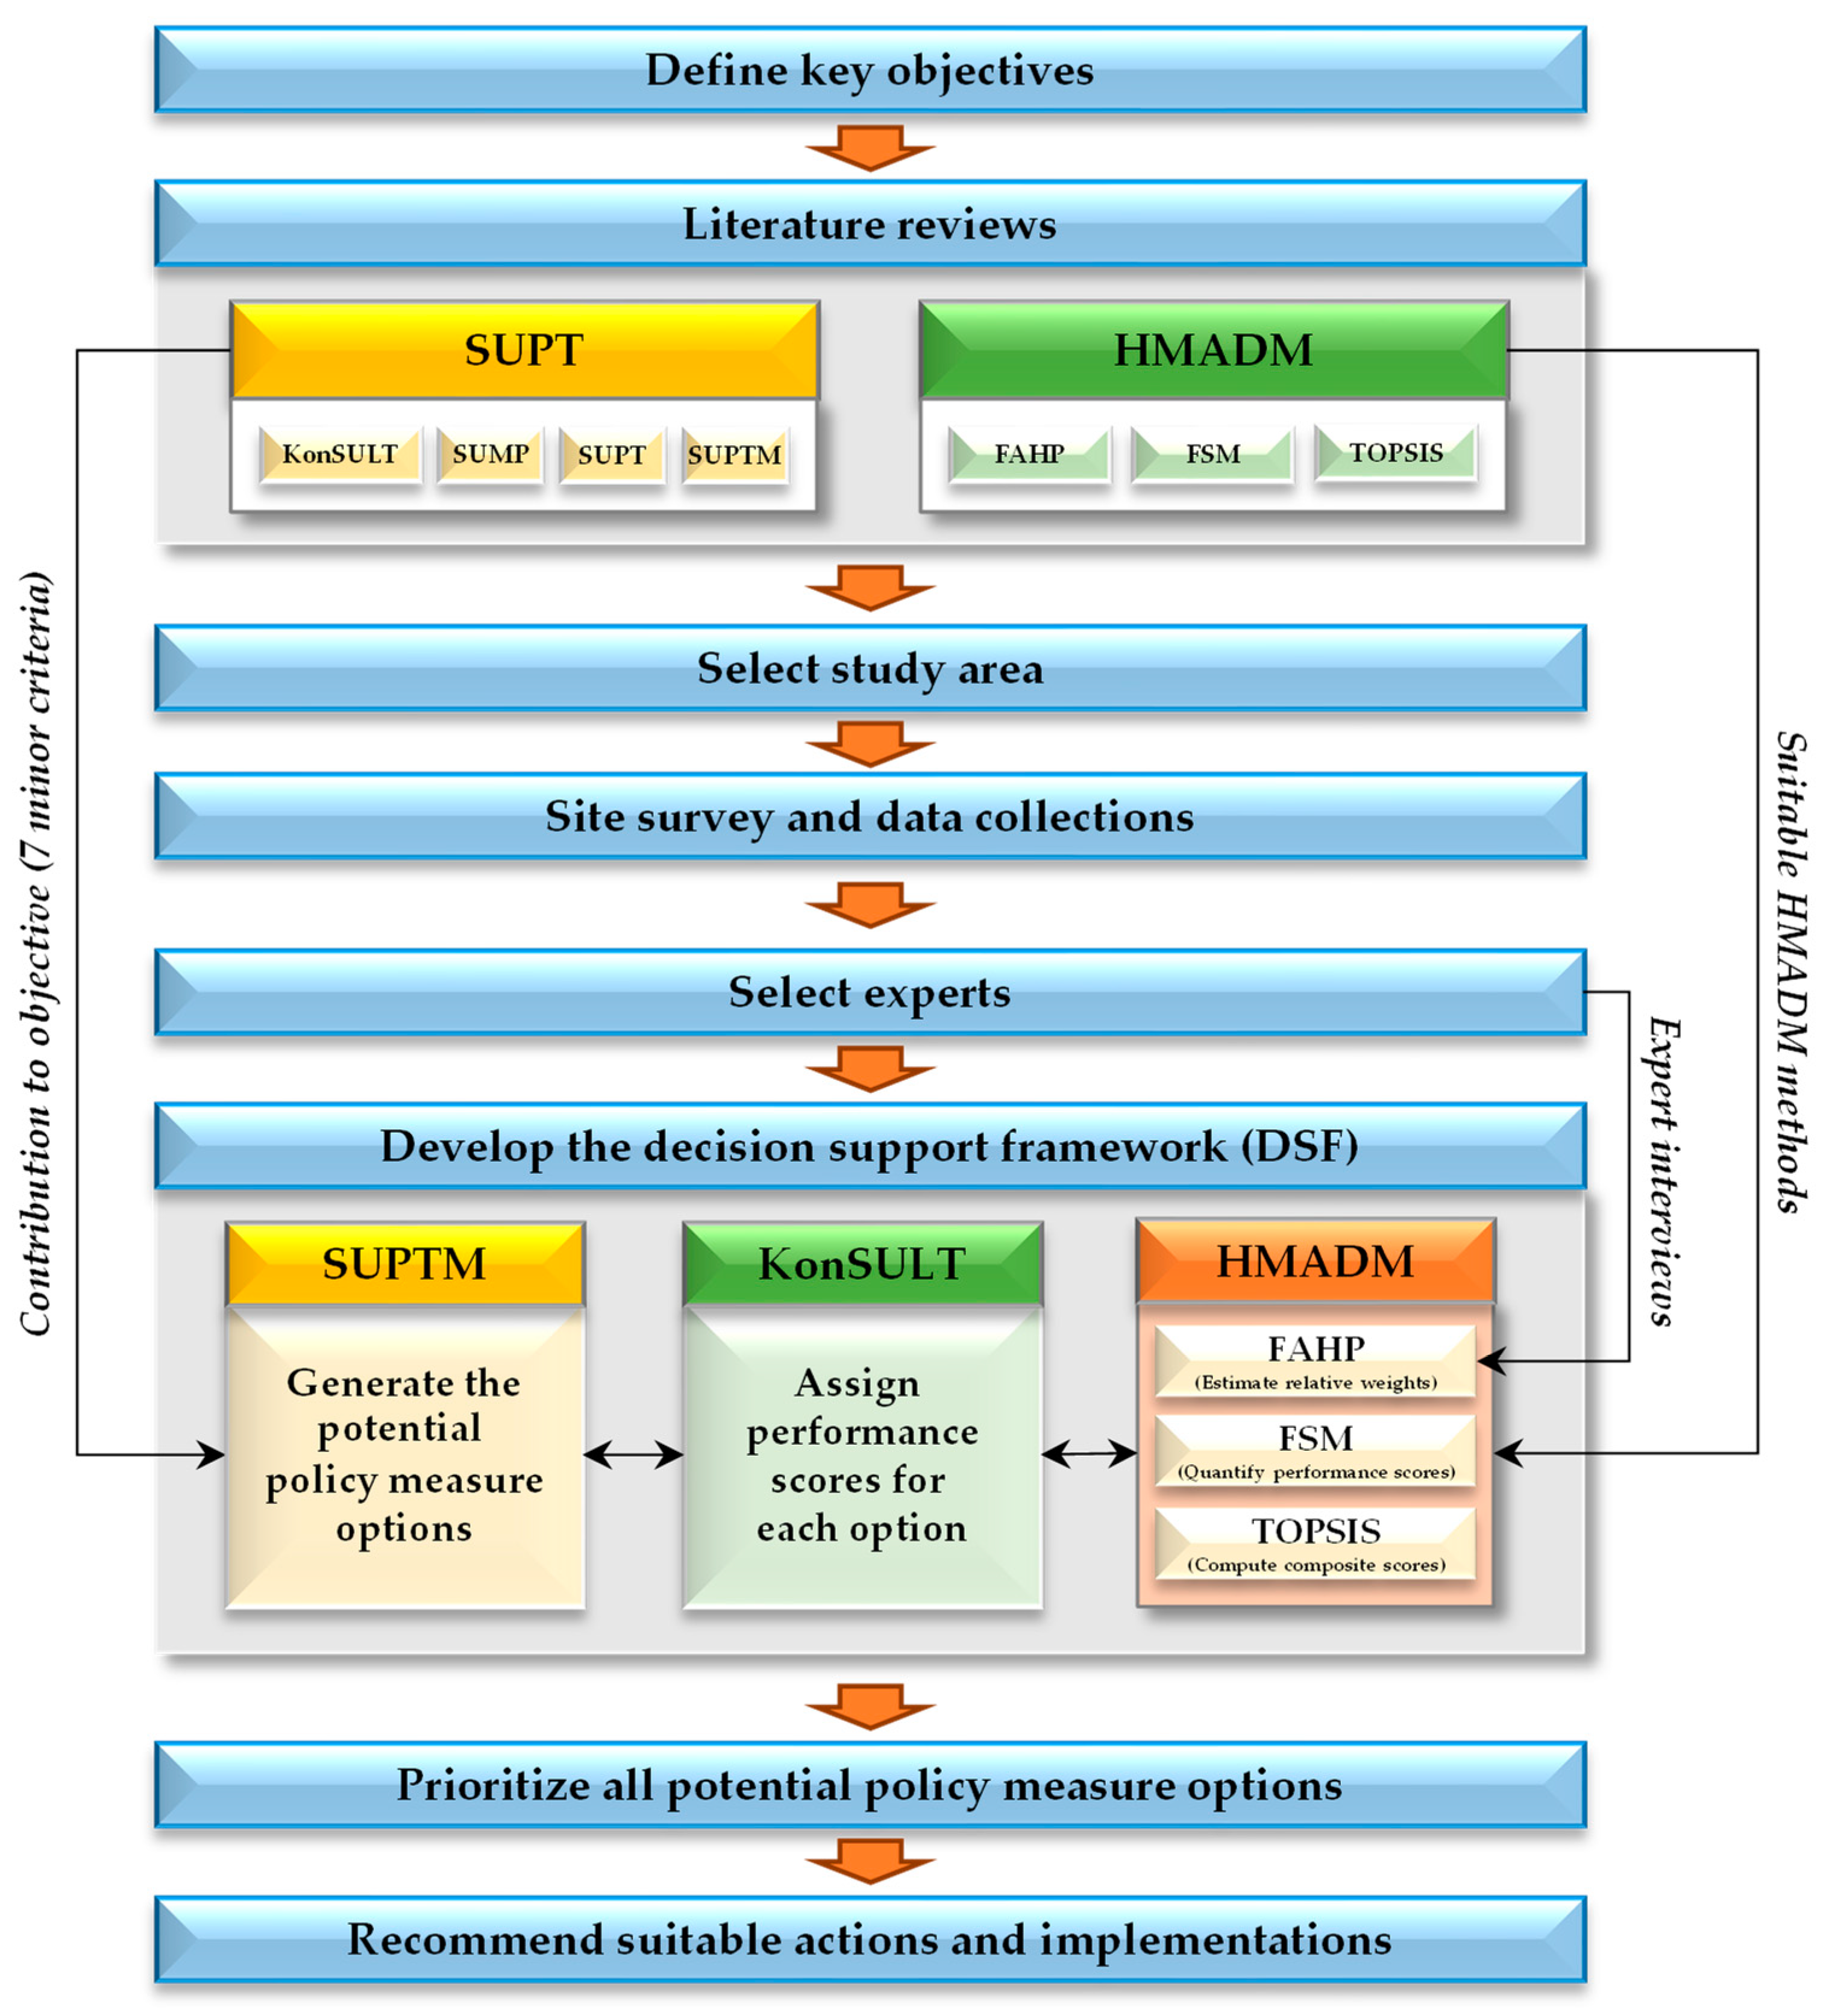
3. Materials and Case Study
3.1. Research Methodology
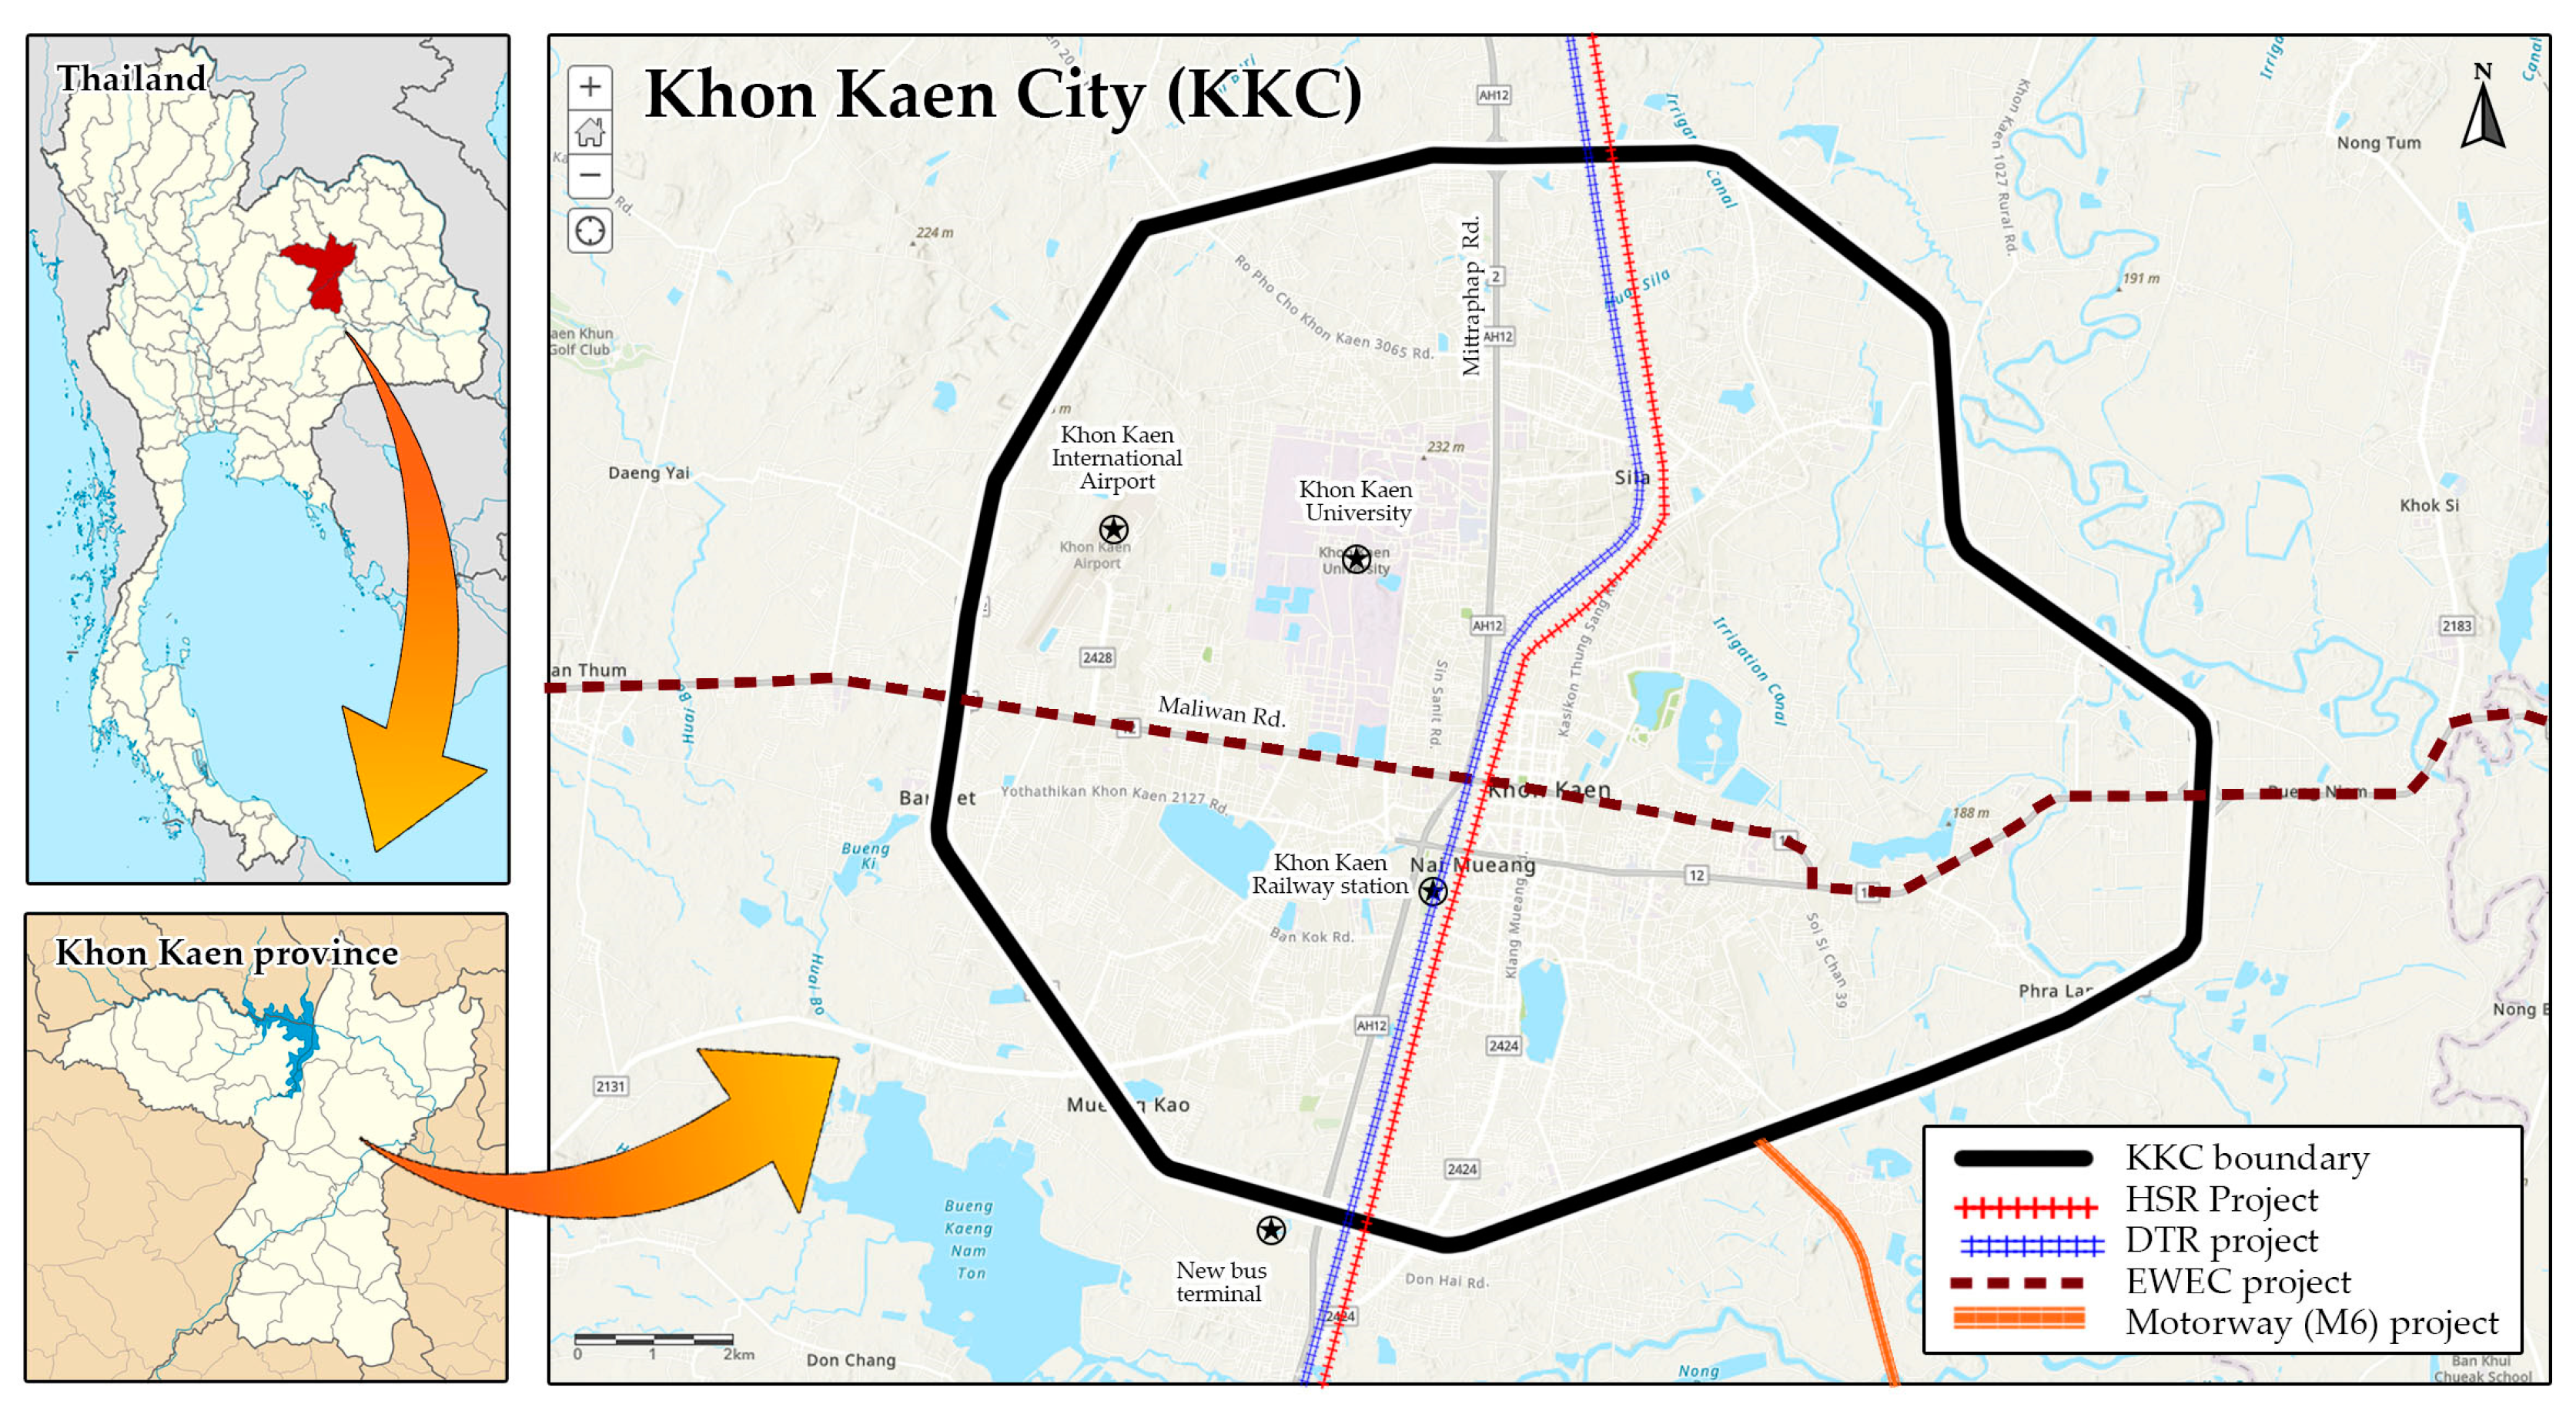
3.2. Selection of the Study Area
3.3. Site Survey and Data Collection
| Options Categories | SUPTM Policy Options [20] | SUPT Policy Options [32,70,71,72,73,74,75] | Implementation Stages * | Final Stages *** | ||
|---|---|---|---|---|---|---|
| COI | BI | OP | ||||
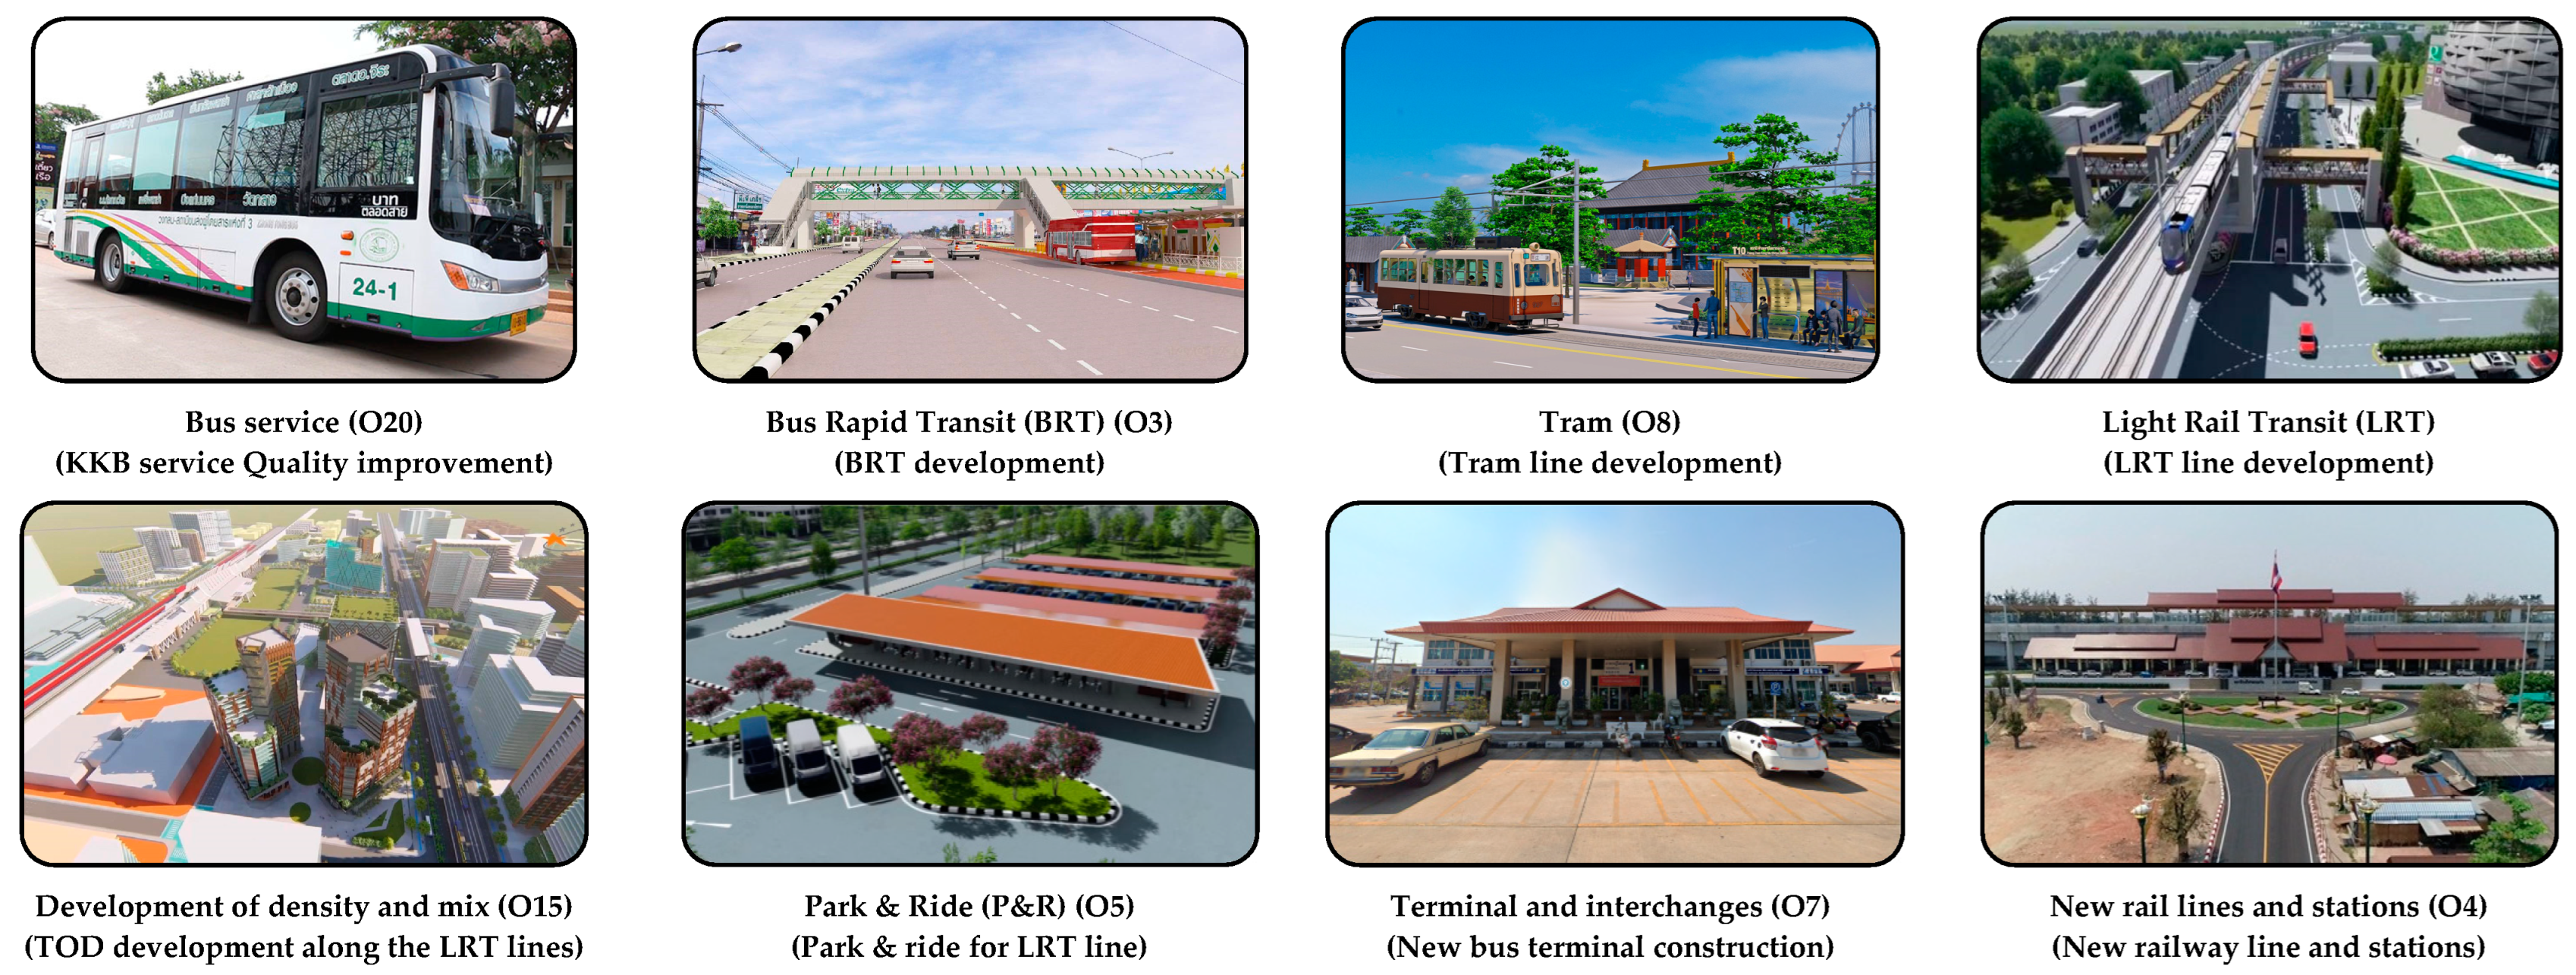
| Attitudinal and behavior | Promotional activities (O1) | Education, campaigning, and public relations for KKB, BRT, LRT, and Tram promotion | ⨯ | - | - | COI |
| Telecommunications (O2) | Internet of Things (IoT) for KKB, BRT, LRT, and Tram | - | ⨯ | - | BI | |
| Infrastructure | Bus rapid transit (BRT) (O3) | BRT development | - | - | ⨯ | OP |
| New rail stations and lines (O4) | New railway line and stations | ⨯ | - | - | COI | |
| Park and ride (O5) | Park and ride for BRT, LRT, and Tram | - | - | ⨯ | OP | |
| Pedestrian areas and routes (O6) | Provision of pedestrian routes and networks | - | ⨯ | - | BI | |
| Terminals and interchanges (O7) | New bus terminal construction | ⨯ | - | - | COI | |
| Trams and light rail transit (LRT) (O8) | LRT line development | - | - | ⨯ | OP | |
| Information provision | Barrier-free Mobility (O9) | Use of the barrier-free mobility vehicles for KKB | ⨯ | - | - | OP |
| Use of the barrier-free mobility vehicles for BRT, LRT, and Tram | - | - | ⨯ | |||
| Conventional signs and markings (O10) | Installation of typical traffic signs and markings | ⨯ | - | - | COI | |
| Conventional timetable and service information (O11) | Timetables and services information for KKB | ⨯ | - | - | OP | |
| Timetable and service information for BRT, LRT, and Tram | - | - | ⨯ | |||
| Crowd sourcing (O12) | Mobile application for LRT | - | - | ⨯ | OP | |
| Mobile application for KKB | ⨯ | - | - | |||
| In-vehicle guidance systems (O13) | In-vehicle navigation and tracking system for KKB | ⨯ | - | - | OP | |
| In-vehicle navigation and tracking system for BRT, LRT, and Tram | - | - | ⨯ | |||
| Real-time passenger information (O14) | Real time traveler information systems for KKB | ⨯ | - | - | OP | |
| Real time traveler information systems for BRT, LRT, and Tram | - | - | ⨯ | |||
| Land use | Development density and mix (O15) | TOD development along the LRT lines | - | - | ⨯ | OP |
| Land use to support public transport (O16) | Land use control to support LRT development | - | - | ⨯ | OP | |
| Management and service | Bus fleet management systems (O17) ** | Bus routes and services management | - | ⨯ | - | BI |
| Bus priorities (O18) ** | Installation of KKB, BRT, LRT, and Tram priority system | - | - | ⨯ | OP | |
| Bus regulation (O19) ** | Establishment of the Khon Kaen transit system (KKTS) organization to regulate KKB, BRT, LRT, and Tram | ⨯ | - | - | COI | |
| Bus services (O20) ** | KKB service quality improvement | ⨯ | - | - | OP | |
| Provision of BRT, LRT, and Tram services | - | - | ⨯ | |||
| Conventional traffic management (O21) | Traditional traffic management | ⨯ | - | - | COI | |
| Cycle parking and storage (O22) | Provision of cyclist facilities | - | ⨯ | - | BI | |
| Intelligent transport systems (ITSs) (O23) | ITS signals installations | - | ⨯ | - | BI | |
| New rail services (O24) | New tram service development | - | - | ⨯ | OP | |
| Parking controls (O25) | Parking controls | ⨯ | - | - | COI | |
| Pedestrian crossing facilities (O26) | Provision of pedestrians crossing facilities | - | ⨯ | - | BI | |
| Physical restrictions (O27) | Road space reduction | - | - | ⨯ | OP | |
| Urban traffic control (O28) | Urban traffic control | - | ⨯ | - | BI | |
| Pricing | Fare levels (O29) | Fare levels for BRT, LRT, and Tram | - | - | ⨯ | OP |
| Fare level for KKB | ⨯ | - | - | |||
| Fare structures (O30) | Fare structures for BRT, LRT, and Tram | - | - | ⨯ | OP | |
| Fare structure for KKB | ⨯ | - | - | |||
| Fuel taxes (O31) | - | - | - | - | - | |
| Integrated ticketing (O32) | Integrated ticketing for LRT | - | - | ⨯ | OP | |
| Parking charges (O33) | - | - | - | - | - | |
| Road user charging (O34) | - | - | - | - | - | |
| Total | 34 | 31 | ||||
3.4. Selection of Experts
3.5. Development of an Innovative Decision Support Framework
3.5.1. The SUPT Policy Option Generation
3.5.2. The Options’ Performance Score Evaluation
3.5.3. The HMADM Technique
- The fundamental basis of the fuzzy set theory
- 2.
- The concept of fuzzy numbers
- 3.
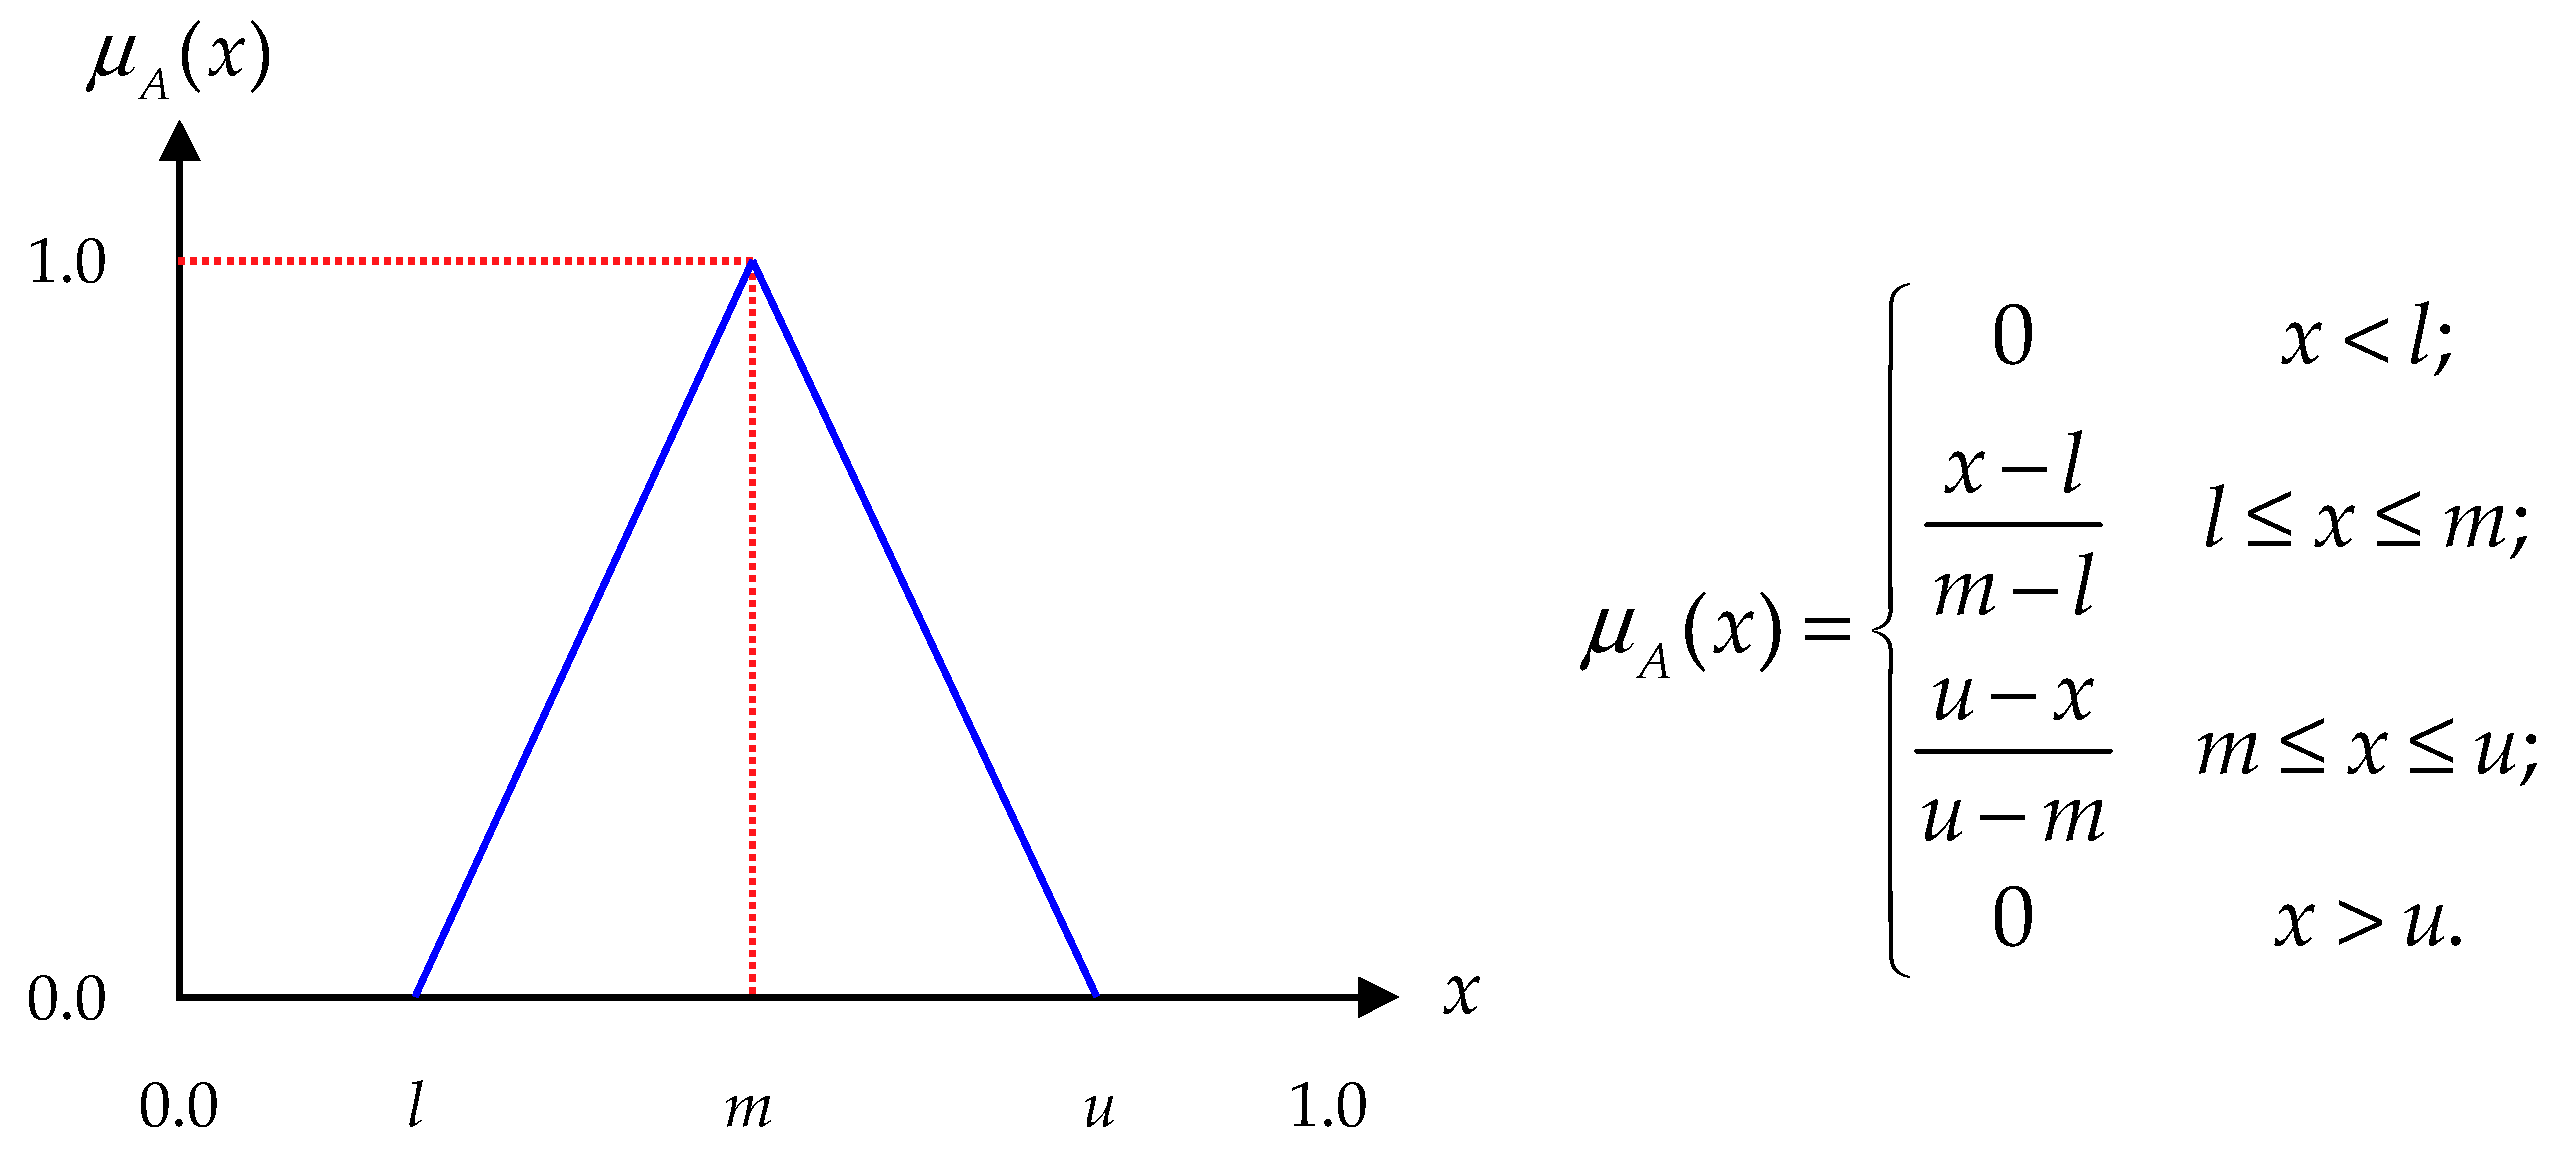
- Fuzzy Analytical Hierarchy Process (FAHP)
| n | 3 | 4 | 5 | 6 | 7 | 8 | 9 |
|---|---|---|---|---|---|---|---|
| RCI | 0.52 | 0.89 | 1.11 | 1.25 | 1.35 | 1.40 | 1.45 |
- 4.
- The Fuzzy Scoring Method (FSM)
- 5.
- TOPSIS Method
4. Results
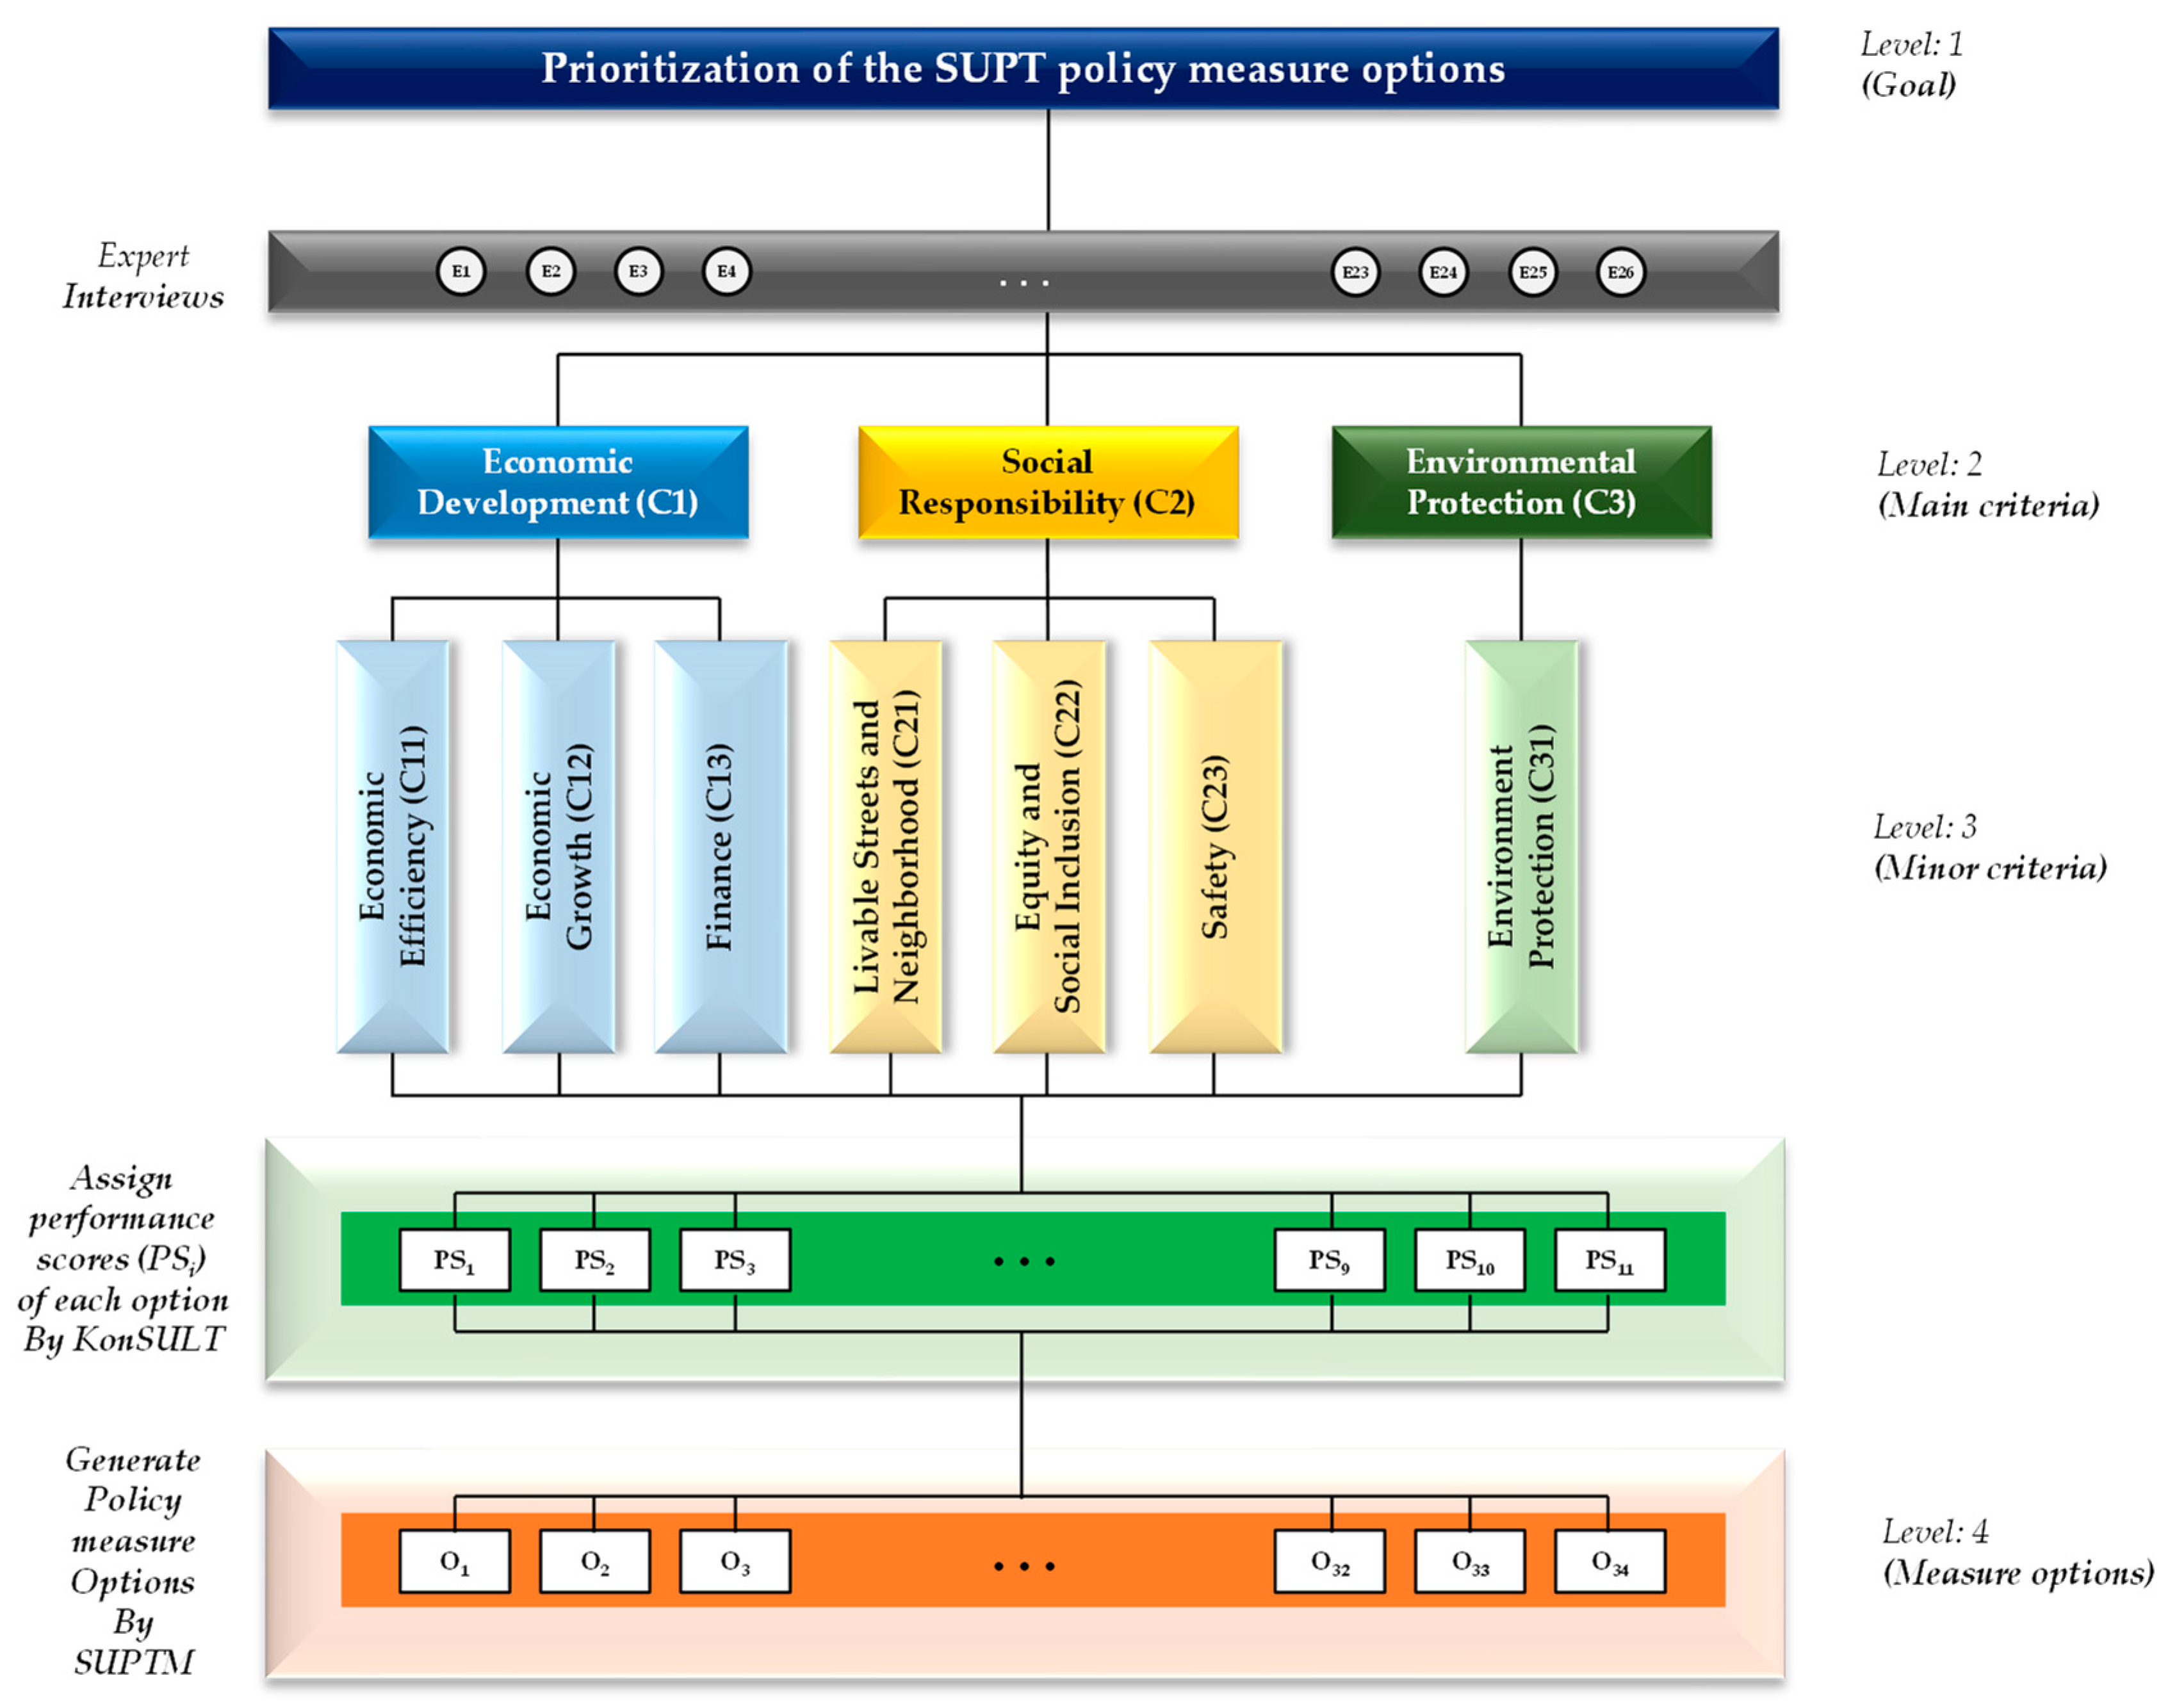
4.1. Application of the FAHP to Determine the Relative Weights of All Criteria
4.1.1. Organization of Decision Elements into a Hierarchical Structure
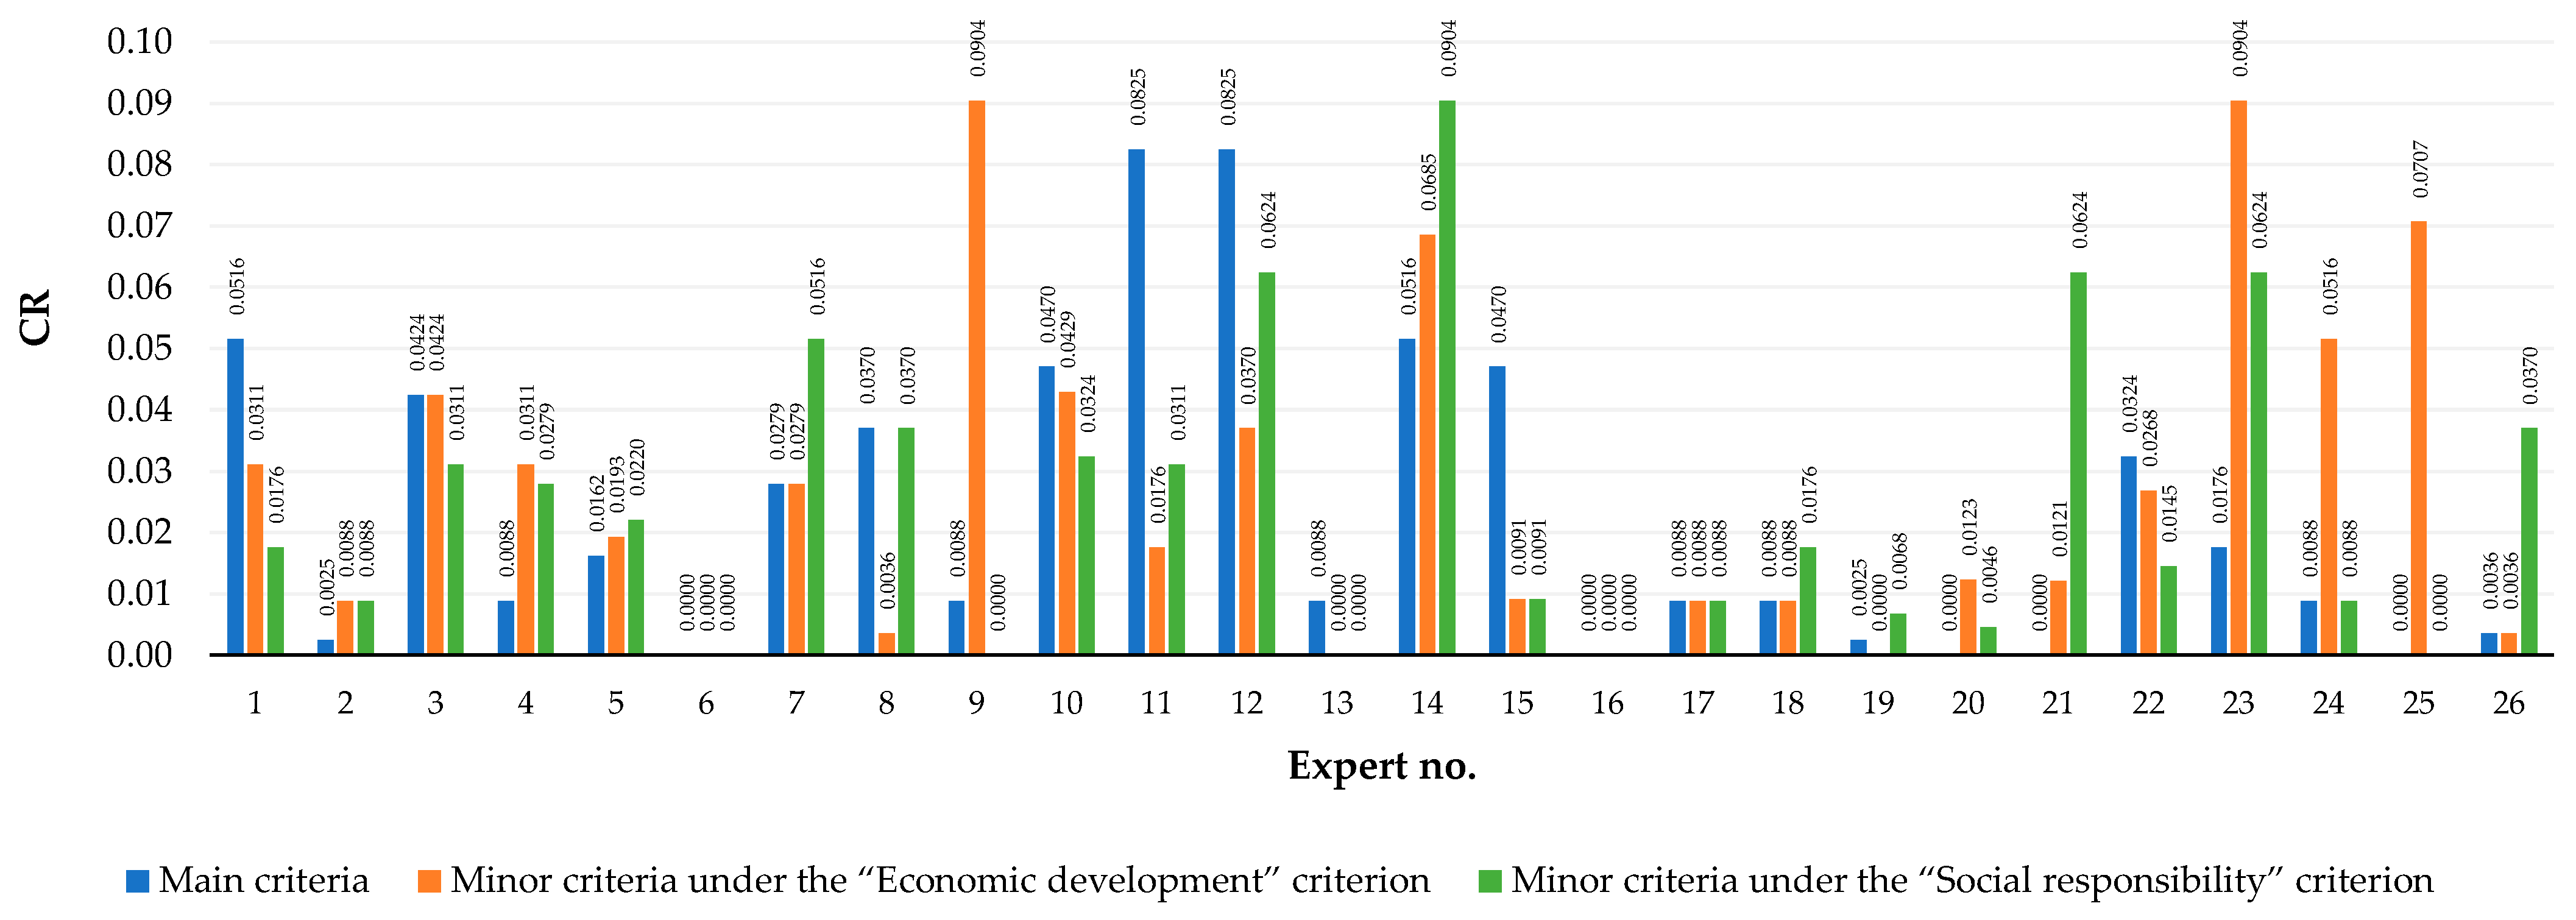
4.1.2. Estimations of Relative Weights of Both Main and Minor Criteria
4.1.3. Determination of the Global Relative Weights of All Criteria
4.2. Performance Scores of the Potential Policy Measure Options for All Minor Criteria
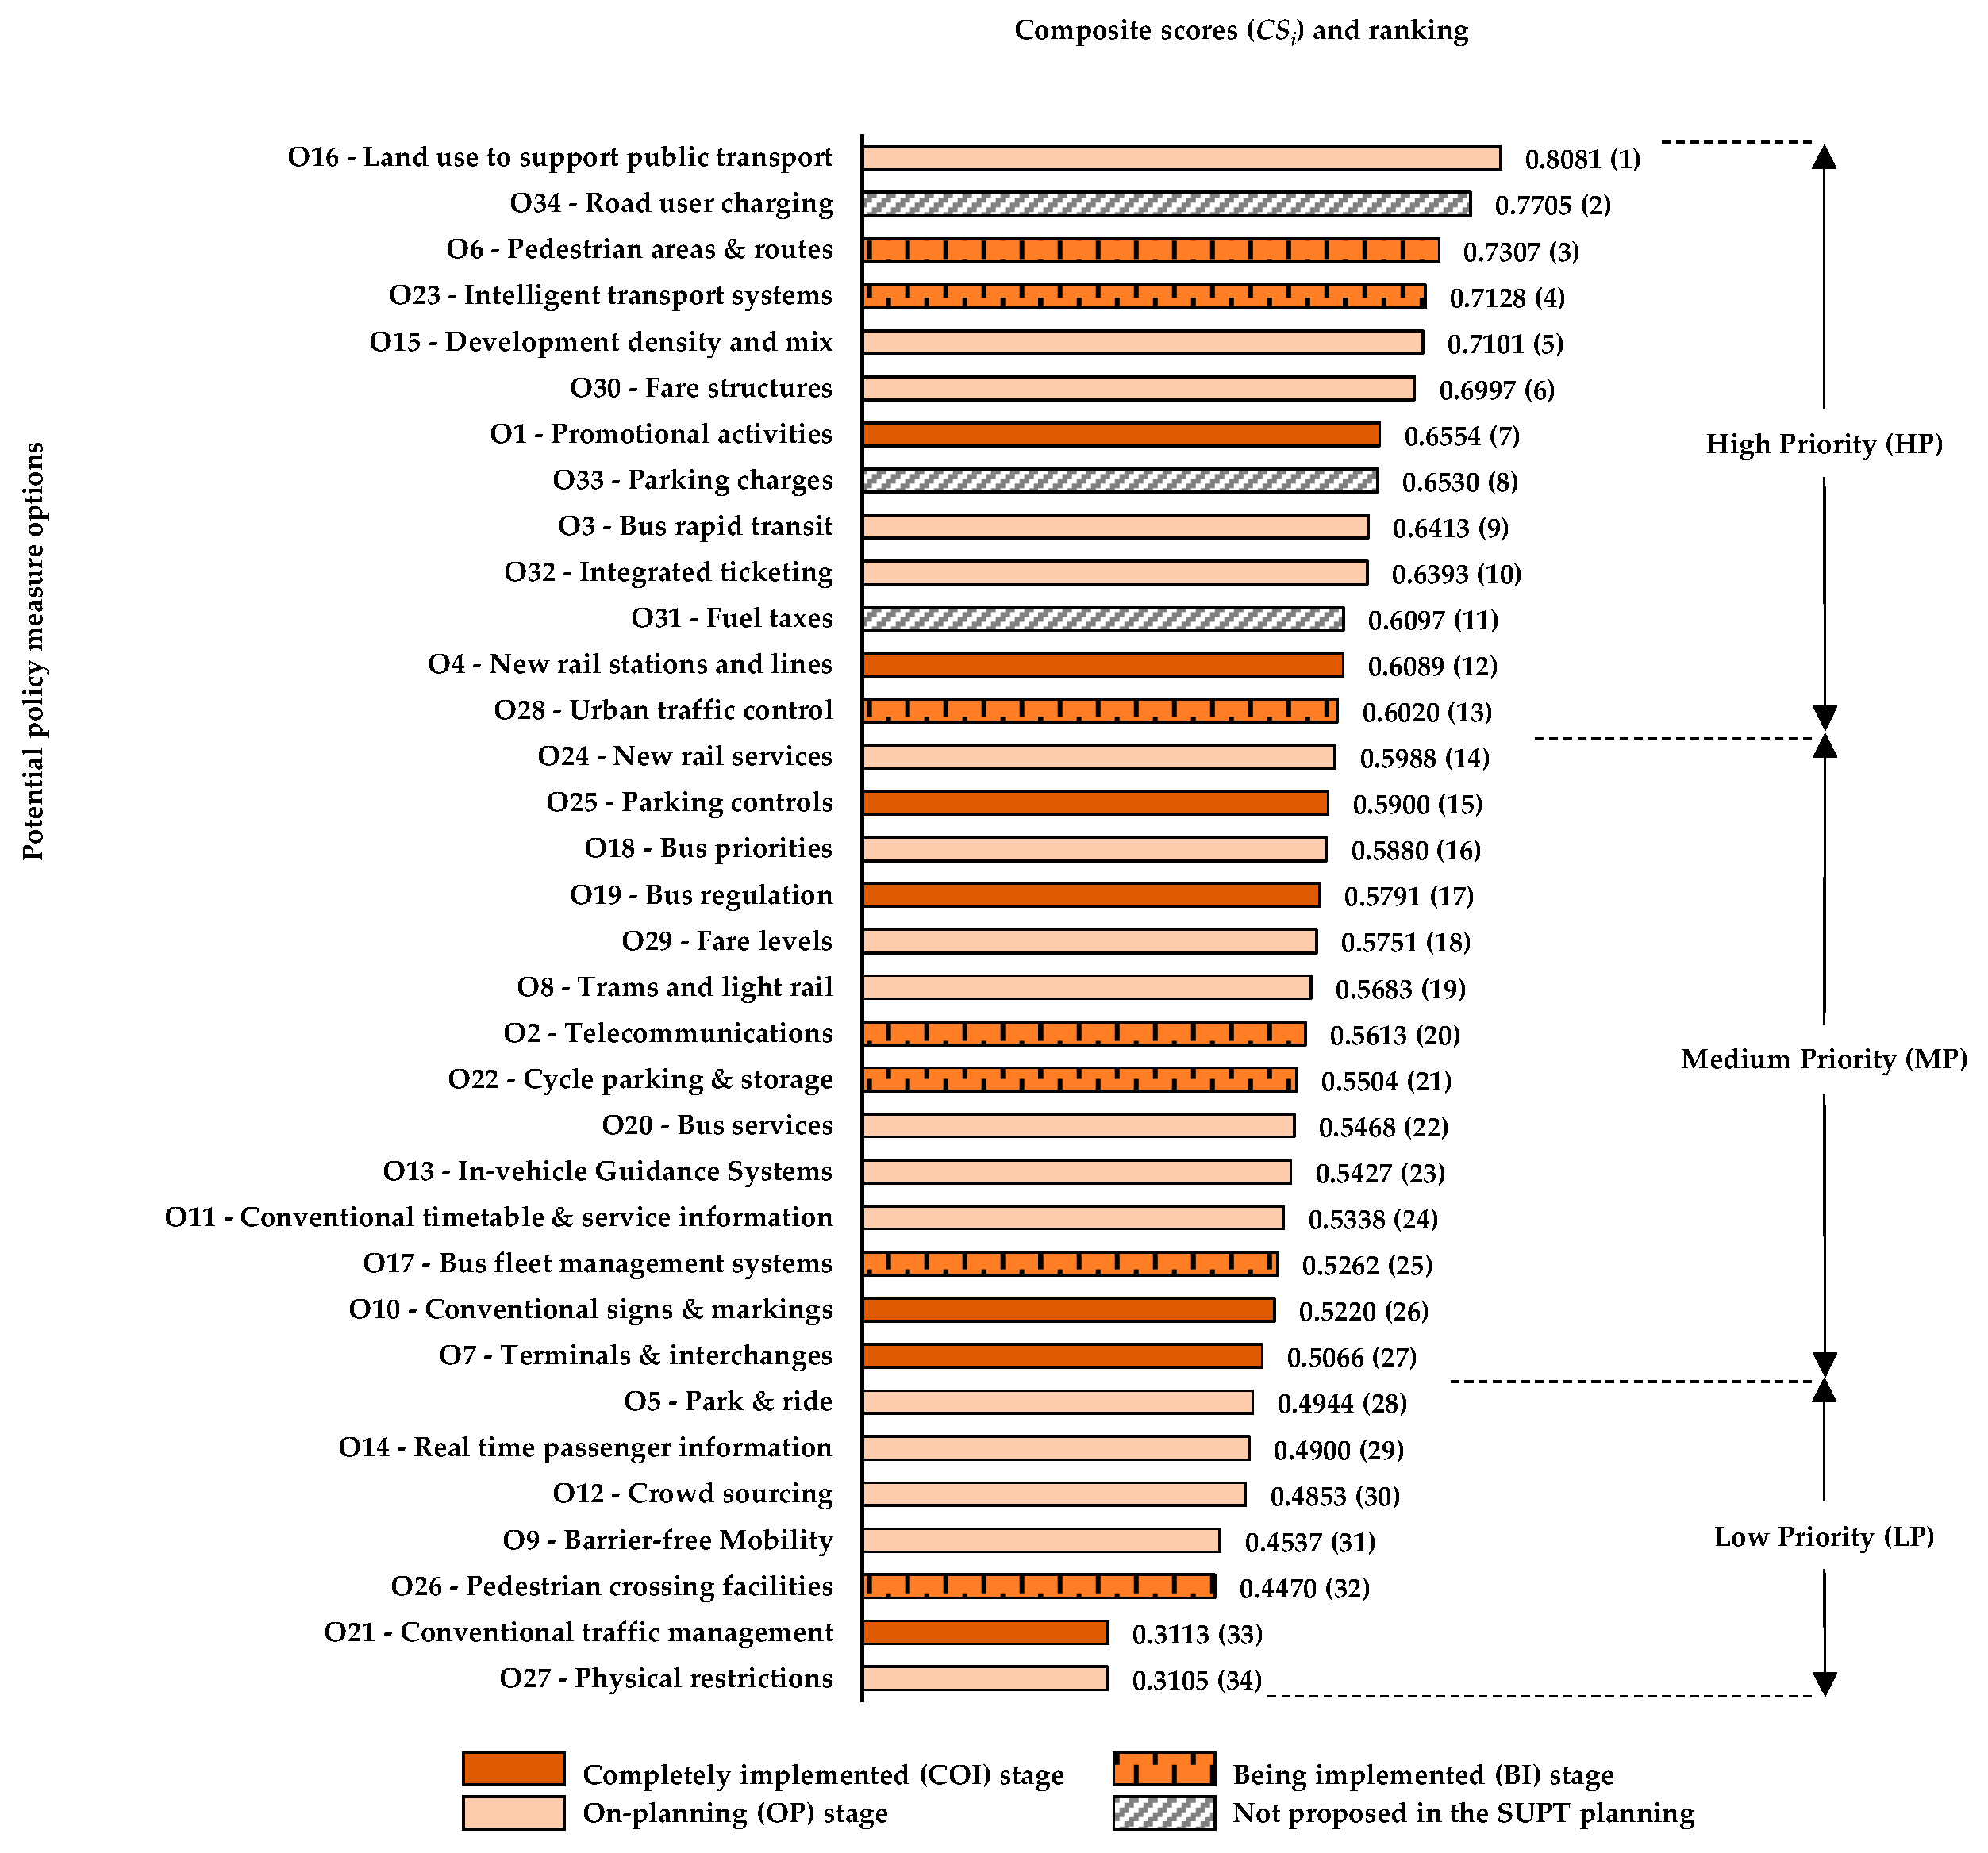
4.3. Prioritization of All Options Using TOPSIS
5. Discussion
6. Conclusions
Author Contributions
Funding
Institutional Review Board Statement
Informed Consent Statement
Data Availability Statement
Acknowledgments
Conflicts of Interest
Appendix A. List of Abbreviations
| Abbreviations | Full Names |
|---|---|
| AHP | Analytic Hierarchy Process |
| ANP | Analytic Network Process |
| ARAS | Additive Ratio Assessment |
| BI | Being Implemented |
| BNP | Best Non-fuzzy Priority |
| BRT | Bus Rapid Transit |
| BWM | Best Worst Method |
| CI | Consistency Index |
| COI | Completely Implemented |
| CODAS | A New Combinative Distance-Based Assessment |
| COPRAS | Complex Proportional Assessment |
| CR | Consistency Ratio |
| DSF | Decision Support Framework |
| EDAS ÉLECTRE | Evaluation Based on Distance from Average Solution ÉLimination Et Choix Traduisant la REalité |
| EWM | Entropy Weight Method |
| FAHP | Fuzzy Analytic Hierarchy Process |
| FBWM | Fuzzy Best Worst Method |
| FSM FTOPSIS | Fuzzy Scoring Method Fuzzy Technique for Order of Preference by Similarity to Ideal Solution |
| GCR | Group Consistency Ratio |
| HMADM | Hybrid Multi-Attribute Decision Making |
| KB | Knowledge-Based |
| KKB | Khon Kaen City Bus |
| KKC | Khon Kaen City |
| KonSULT | Knowledgebase on Sustainable Urban Land Use and Transport |
| LRT | Light Rail Transit |
| MABAC | Multi-Attributive Border Approximation Area Comparison |
| MADM | Multi-Attribute Decision Making |
| MOORA | Multi-Objective Optimization on the Basis of Ratio Analysis |
| NIS | Negative Ideal Solution |
| OP | On-Planning |
| OTP | Office of Transport and Traffic Policy and Planning |
| PIS | Positive Ideal Solution |
| RCI SD | Random Consistency Index Sustainable Development |
| SULT | Sustainable Urban Land Use and Transport |
| SUMPs | Sustainable Urban Mobility Plans |
| SUPT | Sustainable Urban Public Transport |
| SUPTM | Sustainable Urban Public Transport Manual |
| TFNs | Triangular Fuzzy Numbers |
| TOD | Transit-Oriented Development |
| TOPSIS VIKOR | Technique for Order of Preference by Similarity to Ideal Solution VIseKriterijumska Optimizacija I Kompromisno Resenje |
| WAM | Weighted Average Method |
| WASPAS’PH | Power–Heronian Weighted Aggregated Sum Product Assessment |
References
- Shahbaz, M.; Loganathan, N.; Muzaffar, A.T.; Ahmed, K.; Ali Jabran, M. How Urbanization Affects CO2 Emissions in Malaysia? The Application of STIRPAT Model. Renew. Sustain. Energy Rev. 2016, 57, 83–93. [Google Scholar] [CrossRef]
- UN DESA. World Urbanization Prospects 2018: Highlights (ST/ESA/SER.A/421); United Nations: New York, NY, USA, 2019. [Google Scholar]
- UN DESA. World Population Prospects 2022; United Nations: New York, NY, USA, 2022. [Google Scholar]
- Breithaupt, M. Concept of Sustainable Transport and Integrated Land Use Planning—An Overview; GIZ: Bonn, Germany, 2015. [Google Scholar]
- Al Suleiman, S.; Cortez, A.; Monzón, A.; Lara, A. How to Improve Public Transport Usage in a Medium-Sized City: Key Factors for a Successful Bus System. Eur. Transp. Res. Rev. 2023, 15, 47. [Google Scholar] [CrossRef]
- Newman, P.; Kenworthy, J.R. Sustainability and Cities: Overcoming Automobile Dependence; Island Press: Washington, DC, USA, 1999. [Google Scholar]
- Rupprecht Consult. Guidelines for Developing and Implementing a Sustainable Urban Mobility Plan, 2nd ed.; Rupprecht Consult–Forschung & Beratung GmbH: Cologne, Germany, 2019. [Google Scholar]
- May, A.D. Measure Selection for Urban Transport Policy. In Integrating Human Health into Urban and Transport Planning; Nieuwenhuijsen, M., Khreis, H., Eds.; Springer International Publishing AG: Cham, Switzerland, 2019. [Google Scholar]
- May, A.D. CH4LLENGE Measure Selection Manual—Selecting the Most Effective Packages of Measures for Sustainable Urban Mobility Plans; European Commission: Brussels, Belgium, 2016. [Google Scholar]
- Sundberg, R. Manual on the Integration of Measures and Measure Packages in a SUMP; ICLEI–Local Governments for Sustainability, European Secretariat: Freiburg, Germany, 2018. [Google Scholar]
- Shergold, I.; Parkhurst, G. The Economic Benefits of Sustainable Mobility Measures (Independent Review of Evidence: Report); West of England: Bristol, UK, 2016. [Google Scholar]
- University of Leeds KonSULT, the Knowledgebase on Sustainable Urban Land Use and Transport. Available online: http://www.konsult.leeds.ac.uk/ (accessed on 19 May 2020).
- May, A.D.; Khreis, H.; Mullen, C. Option Generation for Policy Measures and Packages: An Assessment of the KonSULT Knowledgebase. Case Stud. Transp. Policy 2018, 6, 311–318. [Google Scholar] [CrossRef]
- May, A.D.; Taylor, M.A.P. KonSULT—An International Knowledgebase on Urban Transport Policy Instruments. Transp. Eng. Aust. 2003, 9, 35–43. [Google Scholar]
- May, A.D.; Kelly, C.; Shepherd, S. The Principles of Integration in Urban Transport Strategies. Transp. Policy 2006, 13, 319–327. [Google Scholar] [CrossRef]
- Kelly, C.; May, A.D.; Jopson, A. The Development of an Option Generation Tool to Identify Potential Transport Policy Packages. Transp. Policy 2008, 15, 361–371. [Google Scholar] [CrossRef]
- May, A.D.; Kelly, C.; Shepherd, S.; Jopson, A. An Option Generation Tool for Potential Urban Transport Policy Packages. Transp. Policy 2012, 20, 162–173. [Google Scholar] [CrossRef]
- Asian Development Bank. A New Paradigm for Sustainable Urban Transport; Asian Development Bank: Manila, Philippines, 2008. [Google Scholar]
- Emberger, G.; Pfaffenbichler, P.; Jaensirisak, S.; Timms, P. “Ideal” Decision-Making Processes for Transport Planning: A Comparison between Europe and South East Asia. Transp. Policy 2008, 15, 341–349. [Google Scholar] [CrossRef]
- The Office of Transport and Traffic Policy and Planning (OTP). Final Report: Development of Master Plan for Public Transport Development in Regional City; King Mongkut’s University of Technology Thonburi, Khon Kaen University and Suranaree University of Technology: Bangkok, Thailand, 2016.
- Mardani, A.; Zavadskas, E.K.; Khalifah, Z.; Jusoh, A.; Nor, K.M.D. Multiple Criteria Decision-Making Techniques In Transportation Systems: A Systematic Review of The State of The Art Literature. Transport 2015, 31, 359–385. [Google Scholar] [CrossRef]
- Mardani, A.; Zavadskas, E.K.; Khalifah, Z.; Zakuan, N.; Jusoh, A.; Nor, K.M.; Khoshnoudi, M. A Review of Multi-Criteria Decision-Making Applications to Solve Energy Management Problems: Two Decades from 1995 to 2015. Renew. Sustain. Energy Rev. 2017, 71, 216–256. [Google Scholar] [CrossRef]
- Mardani, A.; Jusoh, A.; Zavadskas, E.K. Fuzzy Multiple Criteria Decision-Making Techniques and Applications—Two Decades Review from 1994 to 2014. Expert Syst. Appl. 2015, 42, 4126–4148. [Google Scholar] [CrossRef]
- Tzeng, G.H.; Huang, J.J. Multiple Attribute Decision Making: Methods and Applications; CRC Press: Boca Raton, FL, USA, 2011. [Google Scholar]
- Klungboonkrong, P.; Taylor, M.A.P. An Integrated Planning Tool for Evaluating Road Environmental Impacts. Comput.-Aided Civil Infrastruct. Eng. 1999, 14, 335–345. [Google Scholar] [CrossRef]
- van Laarhoven, P.J.M.; Pedrycz, W. A Fuzzy Extension of Saaty’s Priority Theory. Fuzzy Sets Syst. 1983, 11, 229–241. [Google Scholar] [CrossRef]
- Chen, S.-J.; Hwang, C.-L. Fuzzy Multiple Attribute Decision Making; Lecture Notes in Economics and Mathematical Systems; Springer: Berlin/Heidelberg, Germany, 1992; Volume 375, ISBN 978-3-540-54998-7. [Google Scholar]
- Yoon, K.P.; Hwang, C.-L. Multiple Attribute Decision Making: An Introduction; Sage: Thousand Oaks, CA, USA, 1995. [Google Scholar]
- Hwang, C.L.; Yoon, K. Multiple Attribute Decision Making, Methods and Applications. In Lecture Notes in Economics and Mathematical Systems Volume 186; Springer: Now York, NY, USA, 1981. [Google Scholar]
- Tyagi, M.; Kumar, P.; Kumar, D. A Hybrid Approach Using AHP-TOPSIS for Analyzing e-SCM Performance. In Proceedings of the Procedia Engineering; Elsevier Ltd.: Amsterdam, The Netherlands, 2014; Volume 97, pp. 2195–2203. [Google Scholar]
- Chang, C.-T.; Tan, K.-H.; Lu, H.-C. Multiple Criteria Decision Making Theory, Methods, and Applications in Engineering. Math. Probl. Eng. 2014, 2014, 431037. [Google Scholar] [CrossRef]
- SIRDC. The Study on Detail Design of Public Transport System and Environmental Impact Assessment (EIA) in Khon Kaen City; SIRDC: Khon Kaen, Thailand, 2016. [Google Scholar]
- PROSPECT. Procedures for Recommending Sustainable Planning of European City Transport Systems; European Commission: Brussels, Belgium, 2003. [Google Scholar]
- May, A.D.; Anders, K.; Nick, M.; Bryan, M.; Harald, M.; Andres, M.; Matthew, P.; Paul, P.; Simon, S. Developing Sustainable Urban Land Use and Transport Strategies A Decision Makers’ Guidebook; Institute for Transport Studies, University of Leeds: Leeds, UK, 2005. [Google Scholar]
- Goyal, S.; Agarwal, S.; Singh, N.S.S.; Mathur, T.; Mathur, N. Analysis of Hybrid MCDM Methods for the Performance Assessment and Ranking Public Transport Sector: A Case Study. Sustainability 2022, 14, 15110. [Google Scholar] [CrossRef]
- Broniewicz, E.; Ogrodnik, K. A Comparative Evaluation of Multi-Criteria Analysis Methods for Sustainable Transport. Energies 2021, 14, 5100. [Google Scholar] [CrossRef]
- Borza, S.; Inta, M.; Serbu, R.; Marza, B. Multi-Criteria Analysis of Pollution Caused by Auto Traffic in a Geographical Area Limited to Applicability for an Eco-Economy Environment. Sustainability 2018, 10, 4240. [Google Scholar] [CrossRef]
- Chang, T.H. Fuzzy VIKOR Method: A Case Study of the Hospital Service Evaluation in Taiwan. Inf. Sci. 2014, 271, 196–212. [Google Scholar] [CrossRef]
- Opricovic, S.; Tzeng, G.H. Compromise Solution by MCDM Methods: A Comparative Analysis of VIKOR and TOPSIS. Eur. J. Oper. Res. 2004, 156, 445–455. [Google Scholar] [CrossRef]
- Macharis, C.; Bernardini, A. Reviewing the Use of Multi-Criteria Decision Analysis for the Evaluation of Transport Projects: Time for a Multi-Actor Approach. Transp. Policy 2015, 37, 177–186. [Google Scholar] [CrossRef]
- Hamurcu, M.; Eren, T. Strategic Planning Based on Sustainability for Urban Transportation: An Application to Decision-Making. Sustainability 2020, 12, 3589. [Google Scholar] [CrossRef]
- Damidavičius, J.; Burinskiene, M.; Antuchevičiene, J. Assessing Sustainable Mobility Measures Applying Multicriteria Decision Making Methods. Sustainability 2020, 12, 6067. [Google Scholar] [CrossRef]
- Hamurcu, M.; Eren, T. Electric Bus Selection with Multicriteria Decision Analysis for Green Transportation. Sustainability 2020, 12, 2777. [Google Scholar] [CrossRef]
- Mesa, P.; Klungboonkrong, P.; Faiboun, N. Prioritization of Sustainable Urban Land Use and Transport Policy Measures for a Small-Town Area in a Developing Country. Eng. Appl. Sci. Res. 2023, 50, 202–212. [Google Scholar] [CrossRef]
- Saaty, T.L. The Analytic Hierarchy Process; McGraw-Hill: Suffolk, VA, USA, 1980; ISBN 0070543712. [Google Scholar]
- Saaty, T.L. Decision Making with the Analytic Hierarchy Process. Int. J. Serv. Sci. 2008, 1, 83. [Google Scholar] [CrossRef]
- Azhar, N.A.; Radzi, N.A.M.; Wan Ahmad, W.S.H.M. Multi-Criteria Decision Making: A Systematic Review. Recent Adv. Electr. Electron. Eng. Former. Recent Pat. Electr. Electron. Eng. 2021, 14, 779–801. [Google Scholar] [CrossRef]
- Kubler, S.; Robert, J.; Derigent, W.; Voisin, A.; Le Traon, Y. A State-of the-Art Survey & Testbed of Fuzzy AHP (FAHP) Applications. Expert Syst. Appl. 2016, 65, 398–422. [Google Scholar] [CrossRef]
- Sahoo, S.K.; Goswami, S.S. A Comprehensive Review of Multiple Criteria Decision-Making (MCDM) Methods: Advancements, Applications, and Future Directions. Decis. Mak. Adv. 2023, 1, 25–48. [Google Scholar] [CrossRef]
- Auttha, W.; Klungboonkrong, P. Evaluation of the Transport Environmental Effects of an Urban Road Network in a Medium-Sized City in a Developing Country. Sustainability 2023, 15, 16743. [Google Scholar] [CrossRef]
- Behzadian, M.; Khanmohammadi Otaghsara, S.; Yazdani, M.; Ignatius, J. A State-of the-Art Survey of TOPSIS Applications. Expert Syst. Appl. 2012, 39, 13051–13069. [Google Scholar] [CrossRef]
- Moslem, S.; Ghorbanzadeh, O.; Blaschke, T.; Duleba, S. Analysing Stakeholder Consensus for a Sustainable Transport Development Decision by the Fuzzy AHP and Interval AHP. Sustainability 2019, 11, 3271. [Google Scholar] [CrossRef]
- Jasti, P.C.; Ram, V.V. Sustainable Benchmarking of a Public Transport System Using Analytic Hierarchy Process and Fuzzy Logic: A Case Study of Hyderabad, India. Public Transport 2019, 11, 457–485. [Google Scholar] [CrossRef]
- Erdogan, M.; Kaya, I. Prioritizing Failures by Using Hybrid Multi Criteria Decision Making Methodology with a Real Case Application. Sustain. Cities Soc. 2019, 45, 117–130. [Google Scholar] [CrossRef]
- Ušpalytė-Vitkūnienė, R.; Šarkienė, E.; Žilionienė, D. Multi-Criteria Analysis of Indicators of the Public Transport Infrastructure. Promet-Traffic Transp. 2020, 32, 119–126. [Google Scholar] [CrossRef]
- Moslem, S.; Alkharabsheh, A.; Ismael, K.; Duleba, S. An Integrated Decision Support Model for Evaluating Public Transport Quality. Appl. Sci. 2020, 10, 4158. [Google Scholar] [CrossRef]
- Pérez-Dominguez, L.; Durán, S.-N.A.; López, R.R.; Pérez-Olguin, I.J.C.; Luviano-Cruz, D.; Gómez, J.A.H. Assessment Urban Transport Service and Pythagorean Fuzzy Sets CODAS Method: A Case of Study of Ciudad Juárez. Sustainability 2021, 13, 1281. [Google Scholar] [CrossRef]
- Keshavarz-Ghorabaee, M.; Amiri, M.; Hashemi-Tabatabaei, M.; Ghahremanloo, M. Sustainable Public Transportation Evaluation Using a Novel Hybrid Method Based on Fuzzy BWM and MABAC. Open Transp. J. 2021, 15, 31–46. [Google Scholar] [CrossRef]
- Kutlu Gündoğdu, F.; Duleba, S.; Moslem, S.; Aydın, S. Evaluating Public Transport Service Quality Using Picture Fuzzy Analytic Hierarchy Process and Linear Assignment Model. Appl. Soft Comput. 2021, 100, 106920. [Google Scholar] [CrossRef]
- Kalifa, M.; Özdemir, A.; Özkan, A.; Banar, M. Application of Multi-Criteria Decision Analysis Including Sustainable Indicators for Prioritization of Public Transport System. Integr. Environ. Assess. Manag. 2022, 18, 25–38. [Google Scholar] [CrossRef]
- Moslem, S.; Solieman, H.; Oubahman, L.; Duleba, S.; Senapati, T.; Pilla, F. Assessing Public Transport Supply Quality: A Comparative Analysis of Analytical Network Process and Analytical Hierarchy Process. J. Soft Comput. Decis. Anal. 2023, 1, 124–138. [Google Scholar] [CrossRef]
- Çelikbilek, Y.; Moslem, S.; Duleba, S. A Combined Grey Multi Criteria Decision Making Model to Evaluate Public Transportation Systems. Evol. Syst. 2023, 14, 1–15. [Google Scholar] [CrossRef]
- Görçün, Ö.F.; Pamucar, D.; Küçükönder, H. Selection of Tramcars for Sustainable Urban Transportation by Using the Modified WASPAS Approach Based on Heronian Operators. Appl. Soft Comput. 2024, 151, 111127. [Google Scholar] [CrossRef]
- Sudhipongpracha, T.; Dahiya, B. City Profile: Khon Kaen, Thailand. Environ. Urban. ASIA 2019, 10, 271–289. [Google Scholar] [CrossRef]
- Asian Development Bank. Greater Mekong Subregion Cross-Border Transport Facilitation Agreement: Instruments and Drafting History; Asian Development Bank: Manila, Philippines, 2011; ISBN 9789290924814. [Google Scholar]
- Department of Airports. Khon Kaen Airport Development Project. Available online: https://www.airports.go.th/post/view/680 (accessed on 5 March 2024).
- Department of Highway. The 20-Year Intercity Motorway Development Master Plan (2017–2036); Department of Highway: Bangkok, Thailand, 2016. [Google Scholar]
- State Railway of Thailand SRT. Double Track Railway—Nakhon Ratchasima (Chira Junction) to Khon Kaen; State Railway of Thailand SRT: Bangkok, Thailand, 2019. [Google Scholar]
- Van Ninh, T.; Waisurasingha, C. A Comparative Study of Applying Maximum Likelihood and Support Vector Machine Classifiers to Analyze Landsat Imagery for Evaluating Land Use Changes in Khon Kaen City, Thailand. KKU Res. J. Grad. Study 2017, 17, 49–60. [Google Scholar]
- Khon Kaen Governor’s Office. Smart City Development Plan “Khon Kaen Smart City”; Khon Kaen Governor’s Office: Khon Kaen, Thailand, 2021.
- Khon Kaen Municipality. Local Development Plan (2023–2027) Khon Kaen Municipality; Khon Kaen Municipality: Khon Kaen, Thailand, 2022. [Google Scholar]
- S6-5 Group. Designing Low-Carbon Transport System for Khon Kaen City: Manual for Estimation of CO2 Emission Reduction; Nihon University: Tokyo, Japan, 2014. [Google Scholar]
- SIRDC. BRT Study Project in Regional Cities for Sustainable Traffic Safety, Case Study of Khon Kaen Province; SIRDC: Khon Kaen, Thailand, 2012. [Google Scholar]
- TSRI Railway for Cities—Railway for Thailand. Crafting Business Models through the Development of City Railway Transportation: A Case Study of Kaen Nakorn Lake Area, Khon Kaen; TSRI Railway for Cities—Railway for Thailand: Khon Kaen, Thailand, 2020. [Google Scholar]
- OTP. A Study on Transit Oriented Development in Thailand Executive Summary Report Khon Kaen TOD Prototype; OTP: Bangkok, Thailand, 2022. [Google Scholar]
- Zadeh, L.A. Fuzzy Sets. Inf. Control 1965, 8, 338–353. [Google Scholar] [CrossRef]
- Alyamani, R.; Long, S. The Application of Fuzzy Analytic Hierarchy Process in Sustainable Project Selection. Sustainability 2020, 12, 8314. [Google Scholar] [CrossRef]
- Balli, S.; Korukoğlu, S. Operating System Selection Using Fuzzy AHP and Topsis Methods. Math. Comput. Appl. 2009, 14, 119–130. [Google Scholar] [CrossRef]
- Rezaei, J.; Fahim, P.B.M.; Tavasszy, L. Supplier Selection in the Airline Retail Industry Using a Funnel Methodology: Conjunctive Screening Method and Fuzzy AHP. Expert Syst. Appl. 2014, 41, 8165–8179. [Google Scholar] [CrossRef]
- Ayhan, M.B.; Kilic, H.S. A Two Stage Approach for Supplier Selection Problem in Multi-Item/Multi-Supplier Environment with Quantity Discounts. Comput. Ind. Eng. 2015, 85, 1–12. [Google Scholar] [CrossRef]
- Chang, D.-Y. Applications of the Extent Analysis Method on Fuzzy AHP. Eur. J. Oper. Res. 1996, 95, 649–655. [Google Scholar] [CrossRef]
- Buckley, J.J. Fuzzy Hierarchical Analysis. Fuzzy Sets Syst. 1985, 17, 233–247. [Google Scholar] [CrossRef]
- Liu, Y.; Eckert, C.M.; Earl, C. A Review of Fuzzy AHP Methods for Decision-Making with Subjective Judgements. Expert Syst. Appl. 2020, 161, 113738. [Google Scholar] [CrossRef]
- Liu, S.Y.; Chen, J.G. Development of a Machine Troubleshooting Expert System via Fuzzy Multi-attribute Decision-Making Approach. Expert Syst. Appl. 1995, 8, 187–201. [Google Scholar] [CrossRef]
- Awasthi, A.; Chauhan, S.S.; Omrani, H. Application of Fuzzy TOPSIS in Evaluating Sustainable Transportation Systems. Expert Syst. Appl. 2011, 38, 12270–12280. [Google Scholar] [CrossRef]
- Keršuliene, V.; Turskis, Z. Integrated Fuzzy Multiple Criteria Decision Making Model for Architect Selection. Technol. Econ. Dev. Econ. 2011, 17, 645–666. [Google Scholar] [CrossRef]

| Saaty’s Ratio Scale | Definitions | TFNs | Reciprocal TFNs |
|---|---|---|---|
| 1 | Equal | (1, 1, 1) | (1, 1, 1) |
| 3 | Moderate | (2, 3, 4) | (1/4, 1/3, 1/2) |
| 5 | Strong | (4, 5, 6) | (1/6, 1/5, 1/4) |
| 7 | Very strong | (6, 7, 8) | (1/8, 1/7, 1/6) |
| 9 | Extremely strong | (9, 9, 9) | (1/9, 1/9, 1/9) |
| 2 | Intermediate scales | (1, 2, 3) | (1/3, 1/2, 1) |
| 4 | (3, 4, 5) | (1/5, 1/4, 1/3) | |
| 6 | (5, 6, 7) | (1/7, 1/6, 1/5) | |
| 8 | (7, 8, 9) | (1/9, 1/8, 1/7) |
| Main Criteria | (C1) | (C2) | (C3) |
|---|---|---|---|
| Economic Development (C1) | (1, 1, 1) | (0.802, 1.052, 1.344) | (1.016, 1.415, 1.934) |
| Social Responsibility (C2) | (0.744, 0.951, 1.248) | (1, 1, 1) | (1.140, 1.507, 1.878) |
| Environmental Protection (C3) | (0.517, 0.707, 0.985) | (0.532, 0.664, 0.877) | (1, 1, 1) |
| Minor Criteria | (C11) | (C12) | (C13) |
|---|---|---|---|
| Economic Efficiency (C11) | (1, 1, 1) | (1.594, 2.038, 2.566) | (1.782, 2.399, 3.020) |
| Economic Growth (C12) | (0.390, 0.491, 0.627) | (1, 1, 1) | (0.972, 1.370, 1.843) |
| Finance (C13) | (0.331, 0.417, 0.561) | (0.543, 0.730, 1.029) | (1, 1, 1) |
| Minor Criteria | (C21) | (C22) | (C23) |
|---|---|---|---|
| Livable Streets and Neighborhood (C21) | (1, 1, 1) | (0.621, 0.789, 0.998) | (0.303, 0.378, 0.498) |
| Equity and Social Inclusion (C22) | (1.002, 1.267, 1.611) | (1, 1, 1) | (0.354, 0.451, 0.596) |
| Safety (C23) | (2.009, 2.649, 3.299) | (1.678, 2.219, 2.827) | (1, 1, 1) |
| Main and Minor Criteria | Si Lower | Si Medium | Si Upper | Main Criteria | Minor Criteria | ||||
|---|---|---|---|---|---|---|---|---|---|
| BNP | Final Weight | Rank | BNP | Final Weight | Rank | ||||
| Economic Development (C1) | 0.250 | 0.373 | 0.552 | 0.393 | 0.375 | 1 | |||
| Economic efficiency (C11) | 0.345 | 0.520 | 0.765 | 0.543 | 0.194 | 3 | |||
| Economic growth (C12) | 0.188 | 0.276 | 0.405 | 0.290 | 0.103 | 4 | |||
| Finance (C13) | 0.148 | 0.205 | 0.299 | 0.217 | 0.078 | 6 | |||
| Social Responsibility (C2) | 0.256 | 0.372 | 0.532 | 0.385 | 0.367 | 2 | |||
| Livable streets and neighborhoods (C21) | 0.148 | 0.205 | 0.299 | 0.210 | 0.074 | 7 | |||
| Equity and social inclusion (C22) | 0.149 | 0.201 | 0.279 | 0.263 | 0.092 | 5 | |||
| Safety (C23) | 0.181 | 0.251 | 0.356 | 0.572 | 0.201 | 2 | |||
| Environmental Protection (C3) | 0.182 | 0.255 | 0.369 | 0.271 | 0.258 | 3 | |||
| Environmental protection (C31) | 0.182 | 0.255 | 0.369 | - | 0.258 | 1 | |||
| Sum | - | 1.000 | - | 1.000 | - | ||||
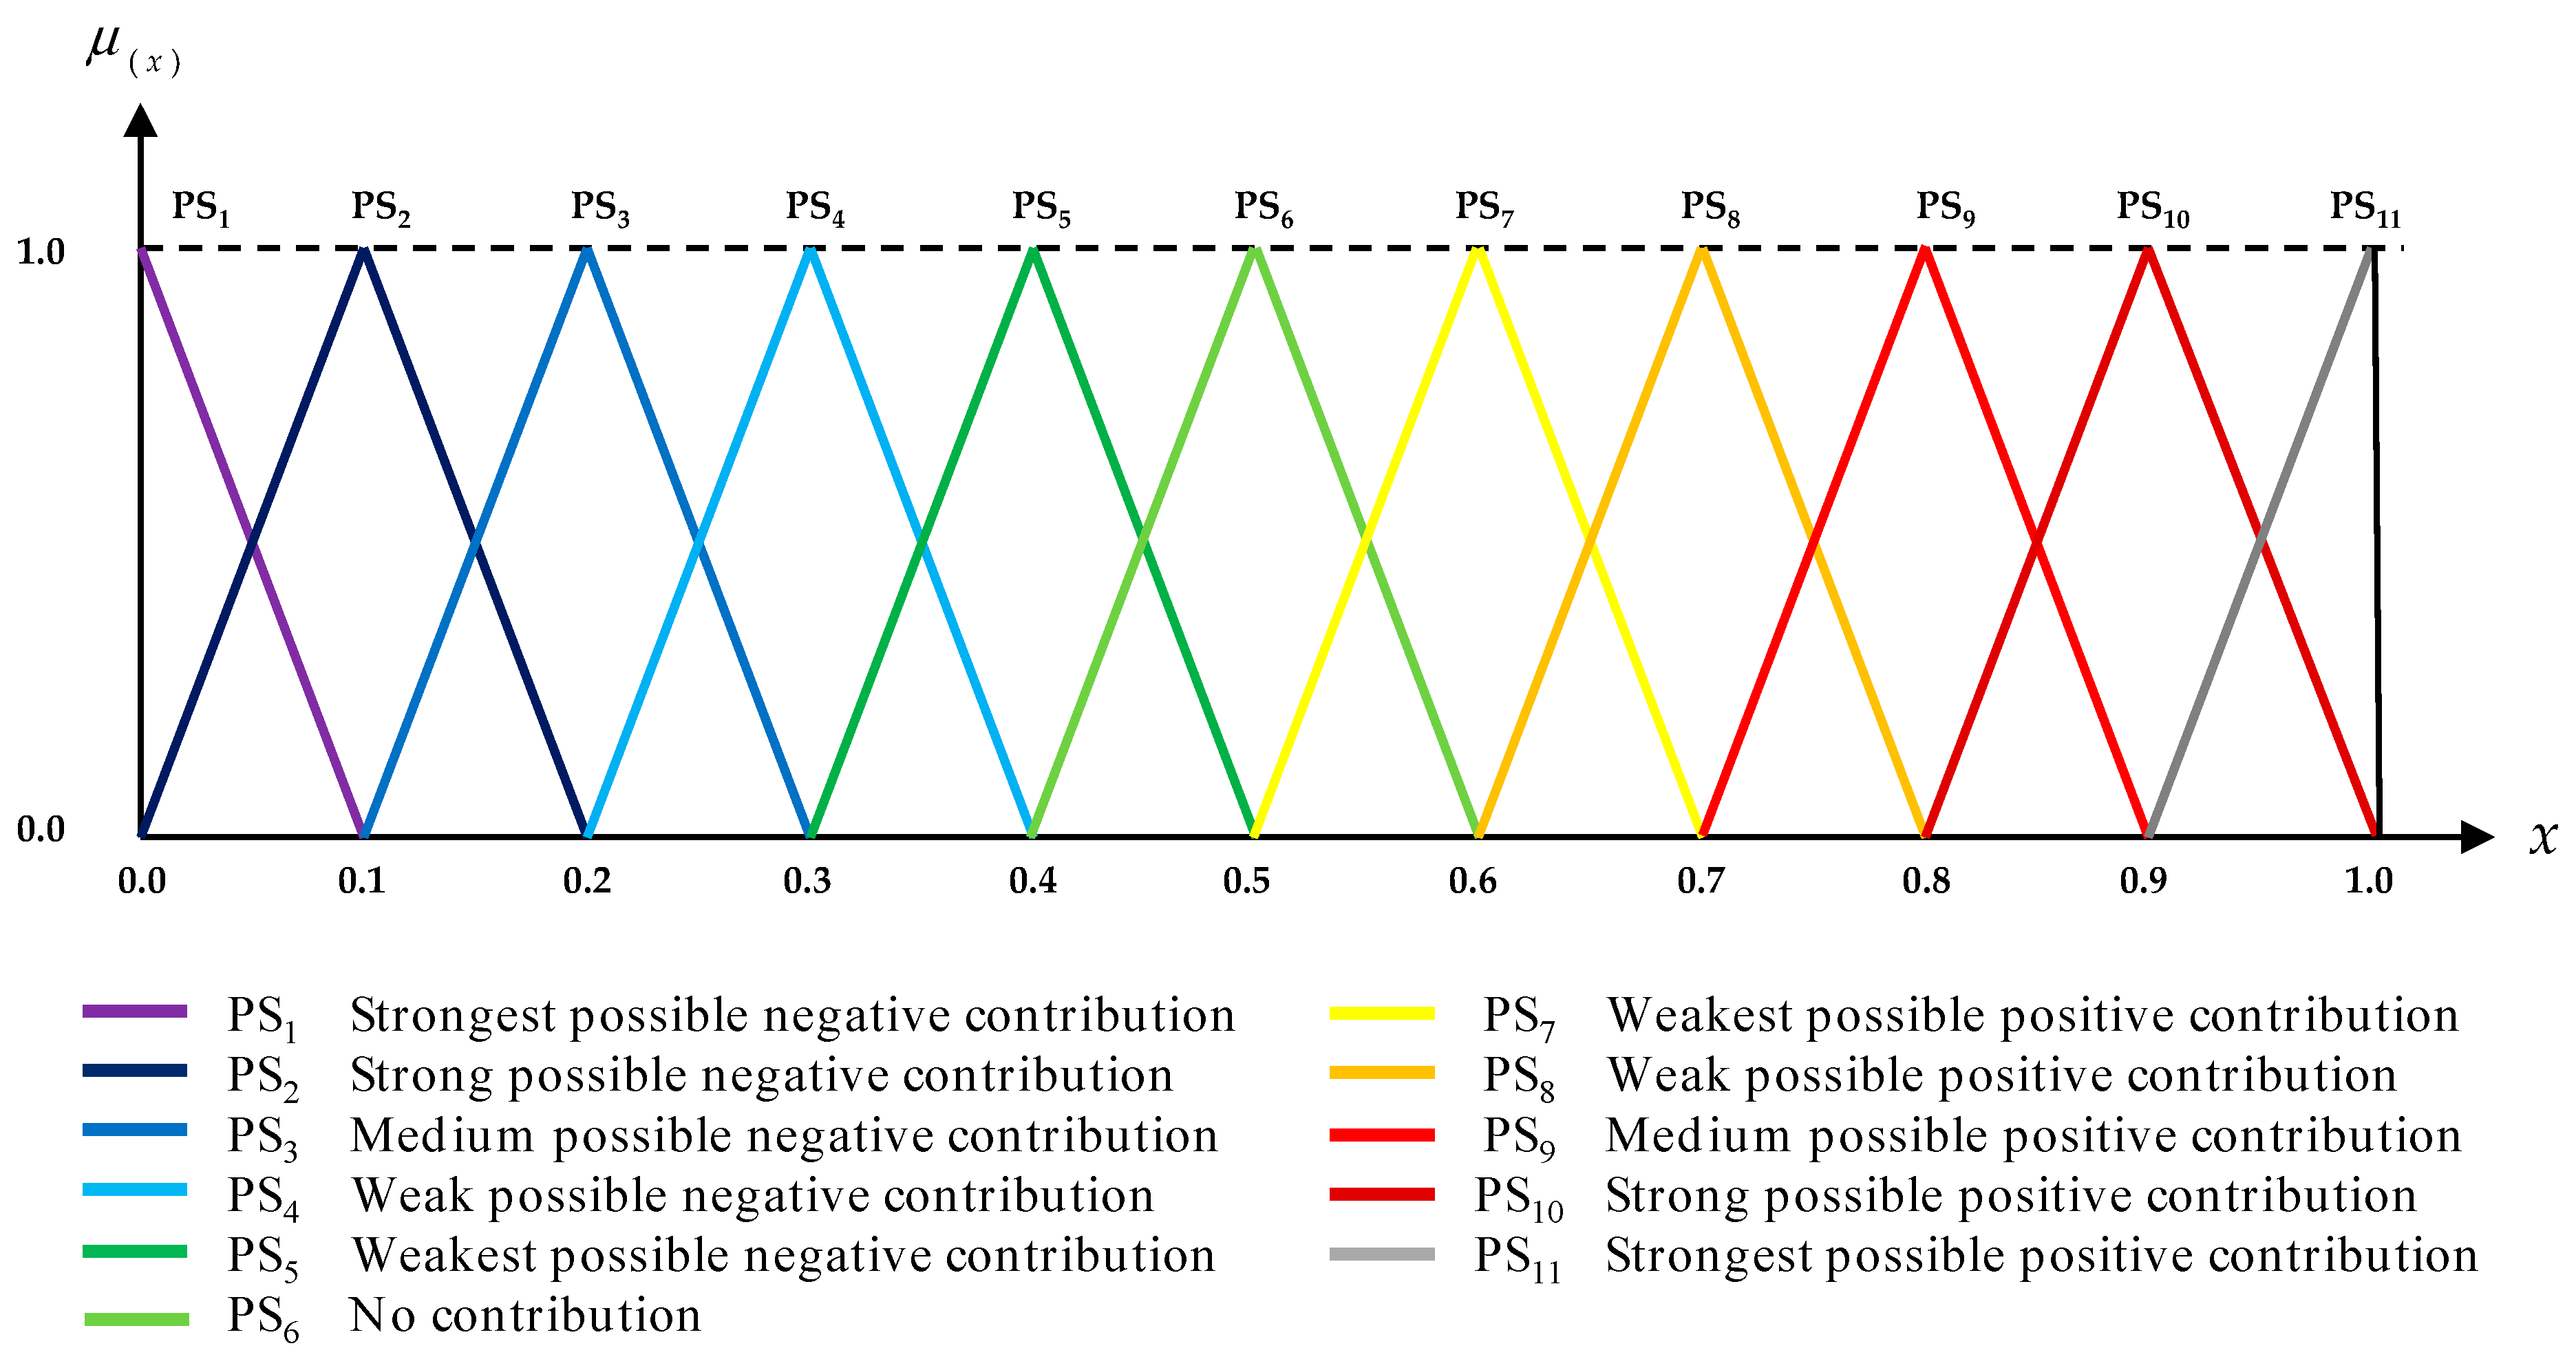
| Performance Scores (PSi) | Linguistic (Fuzzy) Scores | Components of MTFN(i) | Total Utility Scores | Normalized | ||
|---|---|---|---|---|---|---|
| l | m | u | ||||
| PS1 | Strongest possible negative contribution | 0.0 | 0.0 | 0.1 | 0.0455 | 0.0476 |
| PS2 | Strong possible negative contribution | 0.0 | 0.1 | 0.2 | 0.1364 | 0.1429 |
| PS3 | Medium possible negative contribution | 0.1 | 0.2 | 0.3 | 0.2273 | 0.2381 |
| PS4 | Weak possible negative contribution | 0.2 | 0.3 | 0.4 | 0.3182 | 0.3333 |
| PS5 | Weakest possible negative contribution | 0.3 | 0.4 | 0.5 | 0.4091 | 0.4286 |
| PS6 | No contribution | 0.4 | 0.5 | 0.6 | 0.5000 | 0.5238 |
| PS7 | Weakest possible positive contribution | 0.5 | 0.6 | 0.7 | 0.5909 | 0.6190 |
| PS8 | Weak possible positive contribution | 0.6 | 0.7 | 0.8 | 0.6818 | 0.7143 |
| PS9 | Medium possible positive contribution | 0.7 | 0.8 | 0.9 | 0.7727 | 0.8095 |
| PS10 | Strong possible positive contribution | 0.8 | 0.9 | 1.0 | 0.8636 | 0.9048 |
| PS11 | Strongest possible positive contribution | 0.9 | 1.0 | 1.0 | 0.9545 | 1.0000 |
| Option Codes | Names of Options | Performance (Contribution) Scores of Each Option for All Minor Criteria (Objectives) * | ||||||
|---|---|---|---|---|---|---|---|---|
| C11 | C12 | C13 | C21 | C22 | C23 | C31 | ||
| O1 | Promotional activities | 0.7143 | 0.5238 | 0.4286 | 0.7143 | 0.7143 | 0.6190 | 0.9048 |
| O2 | Telecommunications | 0.8095 | 0.5238 | 0.4286 | 0.7143 | 0.5238 | 0.5238 | 0.7143 |
| O3 | Bus rapid transit | 0.9048 | 0.6190 | 0.3333 | 0.7143 | 0.7143 | 0.7143 | 0.7143 |
| O4 | New rail stations and lines | 0.8095 | 0.7143 | 0.2381 | 0.7143 | 0.7143 | 0.7143 | 0.7143 |
| O5 | Park and ride | 0.7143 | 0.5238 | 0.3333 | 0.8095 | 0.5238 | 0.6190 | 0.6190 |
| O6 | Pedestrian areas and routes | 0.8095 | 0.8095 | 0.5238 | 1.0000 | 1.0000 | 0.9048 | 0.7143 |
| O7 | Terminals and interchanges | 0.8095 | 0.7143 | 0.2381 | 0.6190 | 0.7143 | 0.5238 | 0.6190 |
| O8 | Trams and light rail | 0.7143 | 0.7143 | 0.1429 | 0.7143 | 0.7143 | 0.7143 | 0.7143 |
| O9 | Barrier-free mobility | 0.5238 | 0.5238 | 0.5238 | 0.5238 | 0.9048 | 0.8095 | 0.5238 |
| O10 | Conventional signs and markings | 0.7143 | 0.5238 | 0.5238 | 0.5238 | 0.5238 | 0.7143 | 0.6190 |
| O11 | Conventional timetable and service information | 0.7143 | 0.5238 | 0.6190 | 0.6190 | 0.7143 | 0.6190 | 0.6190 |
| O12 | Crowd sourcing | 0.8095 | 0.5238 | 0.7143 | 0.5238 | 0.4286 | 0.6190 | 0.5238 |
| O13 | In-vehicle guidance systems | 0.7143 | 0.5238 | 0.4286 | 0.3333 | 0.6190 | 0.6190 | 0.7143 |
| O14 | Real-time passenger information | 0.7143 | 0.5238 | 0.3333 | 0.6190 | 0.6190 | 0.6190 | 0.6190 |
| O15 | Development density and mix | 0.8095 | 0.8095 | 0.5238 | 0.9048 | 0.9048 | 0.8095 | 0.7143 |
| O16 | Land use to support public transport | 0.8095 | 0.7143 | 0.7143 | 0.9048 | 0.7143 | 0.8095 | 0.9048 |
| O17 | Bus fleet management systems | 0.7143 | 0.5238 | 0.6190 | 0.6190 | 0.6190 | 0.6190 | 0.6190 |
| O18 | Bus priorities | 0.6190 | 0.6190 | 0.5238 | 0.7143 | 0.7143 | 0.7143 | 0.7143 |
| O19 | Bus regulation | 0.7143 | 0.7143 | 0.6190 | 0.6190 | 0.8095 | 0.7143 | 0.6190 |
| O20 | Bus services | 0.6190 | 0.5238 | 0.4286 | 0.6190 | 0.8095 | 0.6190 | 0.7143 |
| O21 | Conventional traffic management | 0.7143 | 0.5238 | 0.4286 | 0.2381 | 0.3333 | 0.8095 | 0.2381 |
| O22 | Cycle parking and storage | 0.7143 | 0.6190 | 0.3333 | 0.8095 | 0.7143 | 0.5238 | 0.7143 |
| O23 | Intelligent transport systems | 0.9048 | 0.7143 | 0.3333 | 0.5238 | 0.7143 | 0.9048 | 0.8095 |
| O24 | New rail services | 0.7143 | 0.7143 | 0.3333 | 0.6190 | 0.8095 | 0.7143 | 0.7143 |
| O25 | Parking controls | 0.7143 | 0.7143 | 0.3333 | 0.7143 | 0.6190 | 0.7143 | 0.7143 |
| O26 | Pedestrian crossing facilities | 0.5238 | 0.7143 | 0.3333 | 0.8095 | 0.7143 | 0.8095 | 0.5238 |
| O27 | Physical restrictions | 0.3333 | 0.5238 | 0.4286 | 0.6190 | 0.4286 | 0.5238 | 0.5238 |
| O28 | Urban traffic control | 1.0000 | 0.5238 | 0.2381 | 0.5238 | 0.7143 | 0.6190 | 0.7143 |
| O29 | Fare levels | 0.7143 | 0.6190 | 0.3333 | 0.7143 | 0.8095 | 0.6190 | 0.7143 |
| O30 | Fare structures | 0.8095 | 0.7143 | 0.9048 | 0.7143 | 0.7143 | 0.7143 | 0.7143 |
| O31 | Fuel taxes | 0.7143 | 0.6190 | 0.7143 | 0.6190 | 0.4286 | 0.7143 | 0.7143 |
| O32 | Integrated ticketing | 0.9048 | 0.5238 | 0.3333 | 0.6190 | 0.9048 | 0.7143 | 0.7143 |
| O33 | Parking charges | 0.8095 | 0.4286 | 0.7143 | 0.7143 | 0.7143 | 0.7143 | 0.7143 |
| O34 | Road user charging | 0.9048 | 0.5238 | 0.9048 | 0.8095 | 0.8095 | 0.7143 | 0.8095 |
| 0.0476 | =PS1 | =Strongest possible negative contribution | 0.6190 | =PS7 | =Weakest possible positive contribution |
| 0.1429 | =PS2 | =Strong possible negative contribution | 0.7143 | =PS8 | =Strongest possible negative contribution |
| 0.2381 | =PS3 | =Medium possible negative contribution | 0.8095 | =PS9 | =Weak possible positive contribution |
| 0.3333 | =PS4 | =Weak possible negative contribution | 0.9048 | =PS10 | =Strong possible positive contribution |
| 0.4286 | =PS5 | =Weakest possible negative contribution | 1.0000 | =PS11 | =Strongest possible positive contribution |
| 0.5238 | =PS6 | =No contribution |
| Minor Criteria (Objectives) | Relative Weights (wj) | Normalized Values (nij) | Performance Scores (PSij) | Weighted Normalizeded Values (wnij) | Ideal Solutions | (wnij − Pj+)2 | (wnij − Nj−)2 | ||
|---|---|---|---|---|---|---|---|---|---|
| (Pj+) | (Nj−) | ||||||||
| Economic efficiency (C11) | 0.194 | 0.184 | 0.8095 | 0.036 | 0.044 | 0.015 | 0.000071 | 0.000443 | |
| Economic growth (C12) | 0.103 | 0.199 | 0.7143 | 0.020 | 0.023 | 0.012 | 0.000007 | 0.000067 | |
| Finance (C13) | 0.078 | 0.244 | 0.7143 | 0.019 | 0.024 | 0.004 | 0.000026 | 0.000231 | |
| Livable streets and neighborhoods (C21) | 0.074 | 0.228 | 0.9048 | 0.017 | 0.019 | 0.004 | 0.000003 | 0.000155 | |
| Equity and social inclusion (C22) | 0.092 | 0.174 | 0.7143 | 0.016 | 0.022 | 0.007 | 0.000041 | 0.000073 | |
| Safety (C23) | 0.201 | 0.199 | 0.8095 | 0.040 | 0.045 | 0.026 | 0.000022 | 0.000200 | |
| Environmental protection (C31) | 0.258 | 0.226 | 0.9048 | 0.057 | 0.058 | 0.015 | 0.000000 | 0.001853 | |
| Total | 0.000170 | 0.003022 | |||||||
| Separation values | Di+ = 0.0131 | Di− = 0.0550 | |||||||
Disclaimer/Publisher’s Note: The statements, opinions and data contained in all publications are solely those of the individual author(s) and contributor(s) and not of MDPI and/or the editor(s). MDPI and/or the editor(s) disclaim responsibility for any injury to people or property resulting from any ideas, methods, instructions or products referred to in the content. |
© 2024 by the authors. Licensee MDPI, Basel, Switzerland. This article is an open access article distributed under the terms and conditions of the Creative Commons Attribution (CC BY) license (https://creativecommons.org/licenses/by/4.0/).
Share and Cite
Faiboun, N.; Klungboonkrong, P.; Udomsri, R.; Jaensirisak, S. Empowering Urban Public Transport Planning Process for Medium-Sized Cities in Developing Countries: Innovative Decision Support Framework for Sustainability. Sustainability 2024, 16, 4731. https://doi.org/10.3390/su16114731
Faiboun N, Klungboonkrong P, Udomsri R, Jaensirisak S. Empowering Urban Public Transport Planning Process for Medium-Sized Cities in Developing Countries: Innovative Decision Support Framework for Sustainability. Sustainability. 2024; 16(11):4731. https://doi.org/10.3390/su16114731
Chicago/Turabian StyleFaiboun, Natthapoj, Pongrid Klungboonkrong, Rungsun Udomsri, and Sittha Jaensirisak. 2024. "Empowering Urban Public Transport Planning Process for Medium-Sized Cities in Developing Countries: Innovative Decision Support Framework for Sustainability" Sustainability 16, no. 11: 4731. https://doi.org/10.3390/su16114731
APA StyleFaiboun, N., Klungboonkrong, P., Udomsri, R., & Jaensirisak, S. (2024). Empowering Urban Public Transport Planning Process for Medium-Sized Cities in Developing Countries: Innovative Decision Support Framework for Sustainability. Sustainability, 16(11), 4731. https://doi.org/10.3390/su16114731