Abstract
To promote the green and resilient development of urban transportation and the sustainable development of cities, we developed a technique that can be used to evaluate the level of urban green transportation development. First, the toughness evaluation indexes were integrated according to the connotation requirements of green transportation development, and the evaluation index system was constructed using the hierarchical analysis method. Second, subjective and objective weighting methods, such as the G1, entropy weighting, and “addition” integration methods, which provide a simple and easy-to-use evaluation method that can improve evaluation accuracy, were adopted. Finally, Harbin, a typical city in the north, was chosen as a representative city to verify the method effectiveness. The study findings can be used to evaluate the current level of green development of a city as well as for future planning, providing a basis for formulating sustainable urban transportation development strategies. We will continue to conduct comparative studies on different evaluation methods and cities to improve the generalizability of the method.
1. Introduction
1.1. Research Background and Significance
In recent years, countries around the world have reached an international consensus on actively addressing climate change and promoting the sustainable development of human society. As of the end of 2021, 136 countries worldwide issued carbon-neutral pledges [1]. Approximately half of the countries that have made carbon-neutral commitments are from the “Belt and Road” region, and these economies account for 65% of global carbon emissions and 70% of the total global economic output. Therefore, promoting green and low-carbon transformation and development of the countries along the “Belt and Road” region can help in realizing the “dual-carbon” goal as well as contribute to their economic recovery in the post-pandemic era (PPE).
The promotion of the Belt and Road initiative has encouraged countries in this region to make important progress in infrastructure construction. The transportation industry has become a major artery for the economic and social development of these countries. On 16 March 2022, China, as a responsible large country, issued the document “Opinions on the Advancement of Co-construction of ‘One Belt, One Road’ Green Development” [2]. This document urges the coordination of green development through international cooperation.
Urban transportation significantly contributes to carbon dioxide emissions, with several environmental repercussions [3]. Notably, the following [4]:
Vehicle exhaust is a primary urban air pollutant. Recently, concerns regarding COVID-19 have led to increased private car ownership in China, exacerbating pollution. Currently, transportation is responsible for approximately 10% of China’s total carbon emissions.
Traffic contributes to noise pollution. In Harbin’s international transport hub, the road traffic noise level reached 67.4 dB in 2021, surpassing the regional ambient noise level of 56.6 dB [5]. This not only impairs the health of city residents but also has potential long-term effects on economic growth and land value.
The expansion of urban transport infrastructure adversely affects the social fabric. For instance, traffic congestion is increasingly recognized as a significant societal concern.
Green transportation is very important for promoting sustainable urban development and improving the quality of life of residents [6]. It reduces private car travel, effectively eases urban traffic congestion, and improves traffic efficiency by optimizing the traffic structure and improving the attractiveness of public transport [7]. Additionally, it pays more attention to saving and recycling of resources; reduces transportation energy consumption and carbon emissions through the adoption of energy-saving technologies, the promotion of green travel modes, and other measures; reduces environmental pollution; and promotes the sustainable development of cities. Moreover, it provides residents with a more convenient, comfortable, and safe traveling environment; improves their quality of life and sense of well-being; and promotes sustainable urban development. However, green transportation has encountered certain challenges in the development process owing to social, economic, and environmental factors. With the acceleration of urbanization and car ownership, traffic congestion has radically increased. Congestion not only wastes time and energy but also increases the risk of traffic accidents. Owing to historical reasons and irrational urban planning, the transport infrastructure in many cities is unable to meet the growing demand for transportation, including problems such as insufficient road capacity, inadequate public transport facilities, and lack of parking facilities. Despite the obvious environmental and social benefits of green transportation, public awareness and acceptance is still limited. Many people are accustomed to traveling by private car and are skeptical of green modes of travel such as public transportation, walking, and cycling. To overcome these challenges, governments, businesses, and communities need to work together to adopt measures that promote green urban transportation.
Therefore, objectively evaluating the level of green development of urban transportation, accurately locating the short boards constraining the green and sustainable development of urban transportation, and formulating policies and measures in line with the development of green transportation according to local conditions are critical for the construction of people-oriented and sustainable urban transportation, promotion of green city development, and realization of the carbon peaking and carbon neutrality (double carbon) goal.
The purpose of this study is to develop a method that can be used to evaluate the development level of urban green transportation and for future planning, promoting the green development of urban transportation and sustainable development of cities. This research includes elaborating the connotations of green transportation, constructing an evaluation index system, and developing and applying an evaluation method to determine the development level of urban green transportation in a city. This evaluation method is key to moving green transportation from theory into practice; it will establish the influencing factors of green transportation, select evaluation indexes based on local practice, apply evaluation methods to conduct research, scientifically assess the level of development of green transportation in cities, and determine the shortcomings in the development process of green transportation, providing a basis for the further development of green transportation.
1.2. Current Research on Green Transportation Evaluation Methods
Extensive research has been conducted in China and abroad on evaluation indices for green transportation. Multi-criteria decision-making [8] refers to the consideration of multiple criteria or objectives in the decision-making process, and the comprehensive consideration of various factors to select the best decision-making program, and therefore is often applied to urban planning. Urban green transportation systems are multi-objective, multi-constraint, multi-level, and dynamic, with many complicated influencing factors related to socioeconomics, resources and energy, ecological environment, etc. Therefore, many scholars have used multi-criteria decision-making to evaluate green transportation systems. Compared with the traditional trade-off method, the multi-criteria decision-making method has more powerful functions. It can synthesize multiple weights, enabling decision makers to clearly distinguish key factors and better deal with ambiguity and uncertainty. Because the multi-criteria decision-making method has many advantages such as high efficiency, reliability, and controllability, it is becoming an important means for analyzing complex decision problems. Common methods include the analytic hierarchy process (AHP) [9] and complex proportional assessment method. Zhu et al. [10] developed an evaluation index system that assesses attributes taken from road and traffic engineering. Gao et al. [11] integrated “dual-carbon” characteristics into the driver–pressure–state–impacts–response (DPSIR) modeling framework to design a national central-city green transportation evaluation system that employs intuitionistic fuzzy analytic hierarchical processing and entropy weighting. Yan [12] evaluated the development level of urban green transportation in Zhoushan City with the political–economic–social–technological–environmental–legal hierarchical analysis method and the technique for order preference by similarity to find an ideal solution decision-making method. Zhang [13] used the AHP method to establish an evaluation index system based on traffic safety, traffic function, and environmental impact; this green fuzzy comprehensive judgment model was employed to evaluate the development of green transportation in Beijing. Wang et al. [14] used the AHP and the information entropy method to determine the factor and combination weights of the indicators in the green evaluation index system for urban transportation. Xu et al. [15] established an evaluation index system for green transportation systems based on the AHP-value function method. Jin and Dong [16] established a DPSIR model for the evaluation of urban green transportation development in response to the system correlation. In addition, the value function method [17], cloud-object meta-analysis technique [18], and other approaches have been introduced in the field of green transportation evaluation.
However, the existing research on the evaluation of the level of urban green transportation has the following shortcomings:
- 1.
- The index-construction process is mostly based on quantifiable indicators rather than qualitative/connotative ones;
- 2.
- The tenacity of transportation in the PPE has not been considered;
- 3.
- The selection of evaluation methods has not been closely integrated with the indicator characteristics themselves.
1.3. Research Content
This study addresses these limitations in the following manner. To analyze the connotations of urban green transportation, a combination of the characteristics of resident trips in the PPE and the requirements of the “dual-carbon” goal are considered. Full consideration is given to the requirements for the development of green, low-carbon, and tenacious urban transportation. The selection of evaluation indicators considers the connotations of a green transport system: safety, high efficiency, greenness, conservation, wisdom, tenacity, and toughness. These considerations are embodied in the evaluation indicators used in the analytical method of constructing the evaluation index. The infrastructure, transport equipment, transport organization, intelligent equipment, information management, green energy saving, and other parts of urban green transport systems are assessed in terms of these connotative indicators. The importance of transport for the development of the urban economy is considered: enhancing transport toughness can significantly reduce the impacts of natural disasters and emergencies on the operation of society. Therefore, transportation safety, applicability, and other tenacity requirements [19] are included in the indicator system. Comprehensive weight assignment is conducted, using the ordinal relationship analysis (G1) method for subjective assignment and the entropy method for objective assignment. This method improves the evaluation accuracy and is simple and easy to implement. The resulting value function is then utilized to perform a comprehensive evaluation of the urban green transportation system.
This system can be employed for the evaluation of the current development situation and for the mandatory evaluation of planning schemes. Notably, the system facilitates the development of sustainable strategies for urban transportation under the “dual-carbon” goal in the PPE.
The rest of the paper is structured as follows. Section 2 describes the urban green transportation indicator system, which includes the connotations of urban green transportation, construction of the indicator system, and evaluation criteria of the indicators. Section 3 details the evaluation methodology, which includes the methodology principle and calculation steps. Section 4 presents the evaluation of the development level of urban green transportation and suggests improvements, using Harbin City as an example. Finally, Section 5 provides the conclusions of the present study.
2. Urban Green Transportation Indicator System
“The Belt and Road Initiative”, known as the Silk Road Economic Belt and the 21st Century Maritime Silk Road, is a major cooperation initiative proposed by China. The initiative actively develops economic cooperation with countries along the route, and builds a community of interests, future objectives, and responsibility with mutual political trust, economic integration, and cultural tolerance. In promoting the construction of the Belt and Road, sustainable development is emphasized, as is environmental protection and green development. Therefore, in terms of transportation infrastructure construction and connectivity, green transportation has become one of the important development directions in this area. Promoting the development of green transportation through promoting clean energy vehicles, optimizing the transportation structure, improving the energy use efficiency, and other measures will help reduce environmental pollution, improve the energy use efficiency, and achieve sustainable economic and social development. Simultaneously, this promotes an important goal of the “Belt and Road” initiative: to promote the common development of countries along the route. The recently concluded 2023 Guiyang International Forum on Ecological Civilization reached a consensus that promoting green and low-carbon development is essential, emphasizing the determination of all countries to firmly follow the path of green transportation development. China and 31 co-located countries launched the Belt and Road Green Development Partnership Initiative [20]. The goals of the initiative include the realization of green and sustainable economic recovery, as well as the promotion of PPE, low-carbon, resilient, and inclusive economic growth. Urban green transport has thus entered the optimal period of its development; it contributes effectively to the sustainable development of resilient transport.
2.1. Connotations of Urban Green Transportation
The concept of green transportation was first explored in the 1990s. A Canadian scholar, Chris Bradshaw, first proposed the concept of green transportation systems in 1994. Since then, green transportation has become a hot topic for scholars at home and abroad, but the research perspectives and focuses of various scholars are different, and there is no clear and unified definition at present [21]. Huapu [22] understands green transportation from both narrow and broad perspectives, and proposes that green transportation is an integrated urban transportation system that aims to reduce traffic congestion, lower energy consumption, promote environmental friendliness, and reduce construction and maintenance costs. Ouyang Bin et al. [23] states that green transportation should use minimal energy and resources, reduce ecological and environmental costs, and meet residents’ transportation needs, ultimately leading to a sustainable transportation system. It further examines the definition of green transportation from five perspectives: all fields, all elements, all staff participation, all processes, and all aspects.
During the past 20 years, the state has aimed to build a green transportation system. Public transportation has been the main component of this system, and nonmotorized transportation has been a support system. State support includes introduction of policies, infrastructure, transportation equipment, and management measures. However, in the past three years, the COVID-19 pandemic has changed the structure of urban transportation and travel, causing a decline in public transportation use. Increasing public transportation use is difficult because there is a greater concern for travel safety, hygiene, efficiency, and quality; self-driving has become the favored transportation method. However, this increases urban congestion and environmental pollution. The development of green transportation facilities and equipment has also been hampered by a decline in infrastructure development due to the economic impact of the pandemic. However, this decline has also brought about opportunities and new development directions for the development of urban green transportation. For example, improving the health of residents by promoting walking, bike travel, and other green travel modes can be an impetus for increasing the construction of slow traffic facilities. During the pandemic, transportation applications for online cars and bike sharing increased rapidly, allowing companies to access data to improve customer experiences and leading to higher levels of application intelligence and service quality. Consequently, residents are now more interested in personalized travel, allowing more customizable travel service products to be launched. These changes show that the government needs to actively respond to the new challenges and opportunities to meet the higher requirements for urban green transportation construction in the PPE by developing resilient urban transportation systems that have the capacity to withstand, cope with, and recover from disasters [24,25].
This paper argues that urban green transportation under the “dual-carbon” goal in the PPE should be founded on sustainable development. The increasing popular demand for efficient, high-quality urban transportation and travel should be met while focusing on saving resources and protecting the environment, promoting social equity, and improving the resilience of the urban transportation system. This development requires advocating green trips and giving priority to public transportation and slow-moving private transportation (such as walking and bicycling). The result should be a harmonious and sustainable urban transportation system for all elements of society that protects the environment, conserves resources, and helps the economy. It should involve safety, high efficiency, greenness, economy, wisdom, and tenacity [26,27].
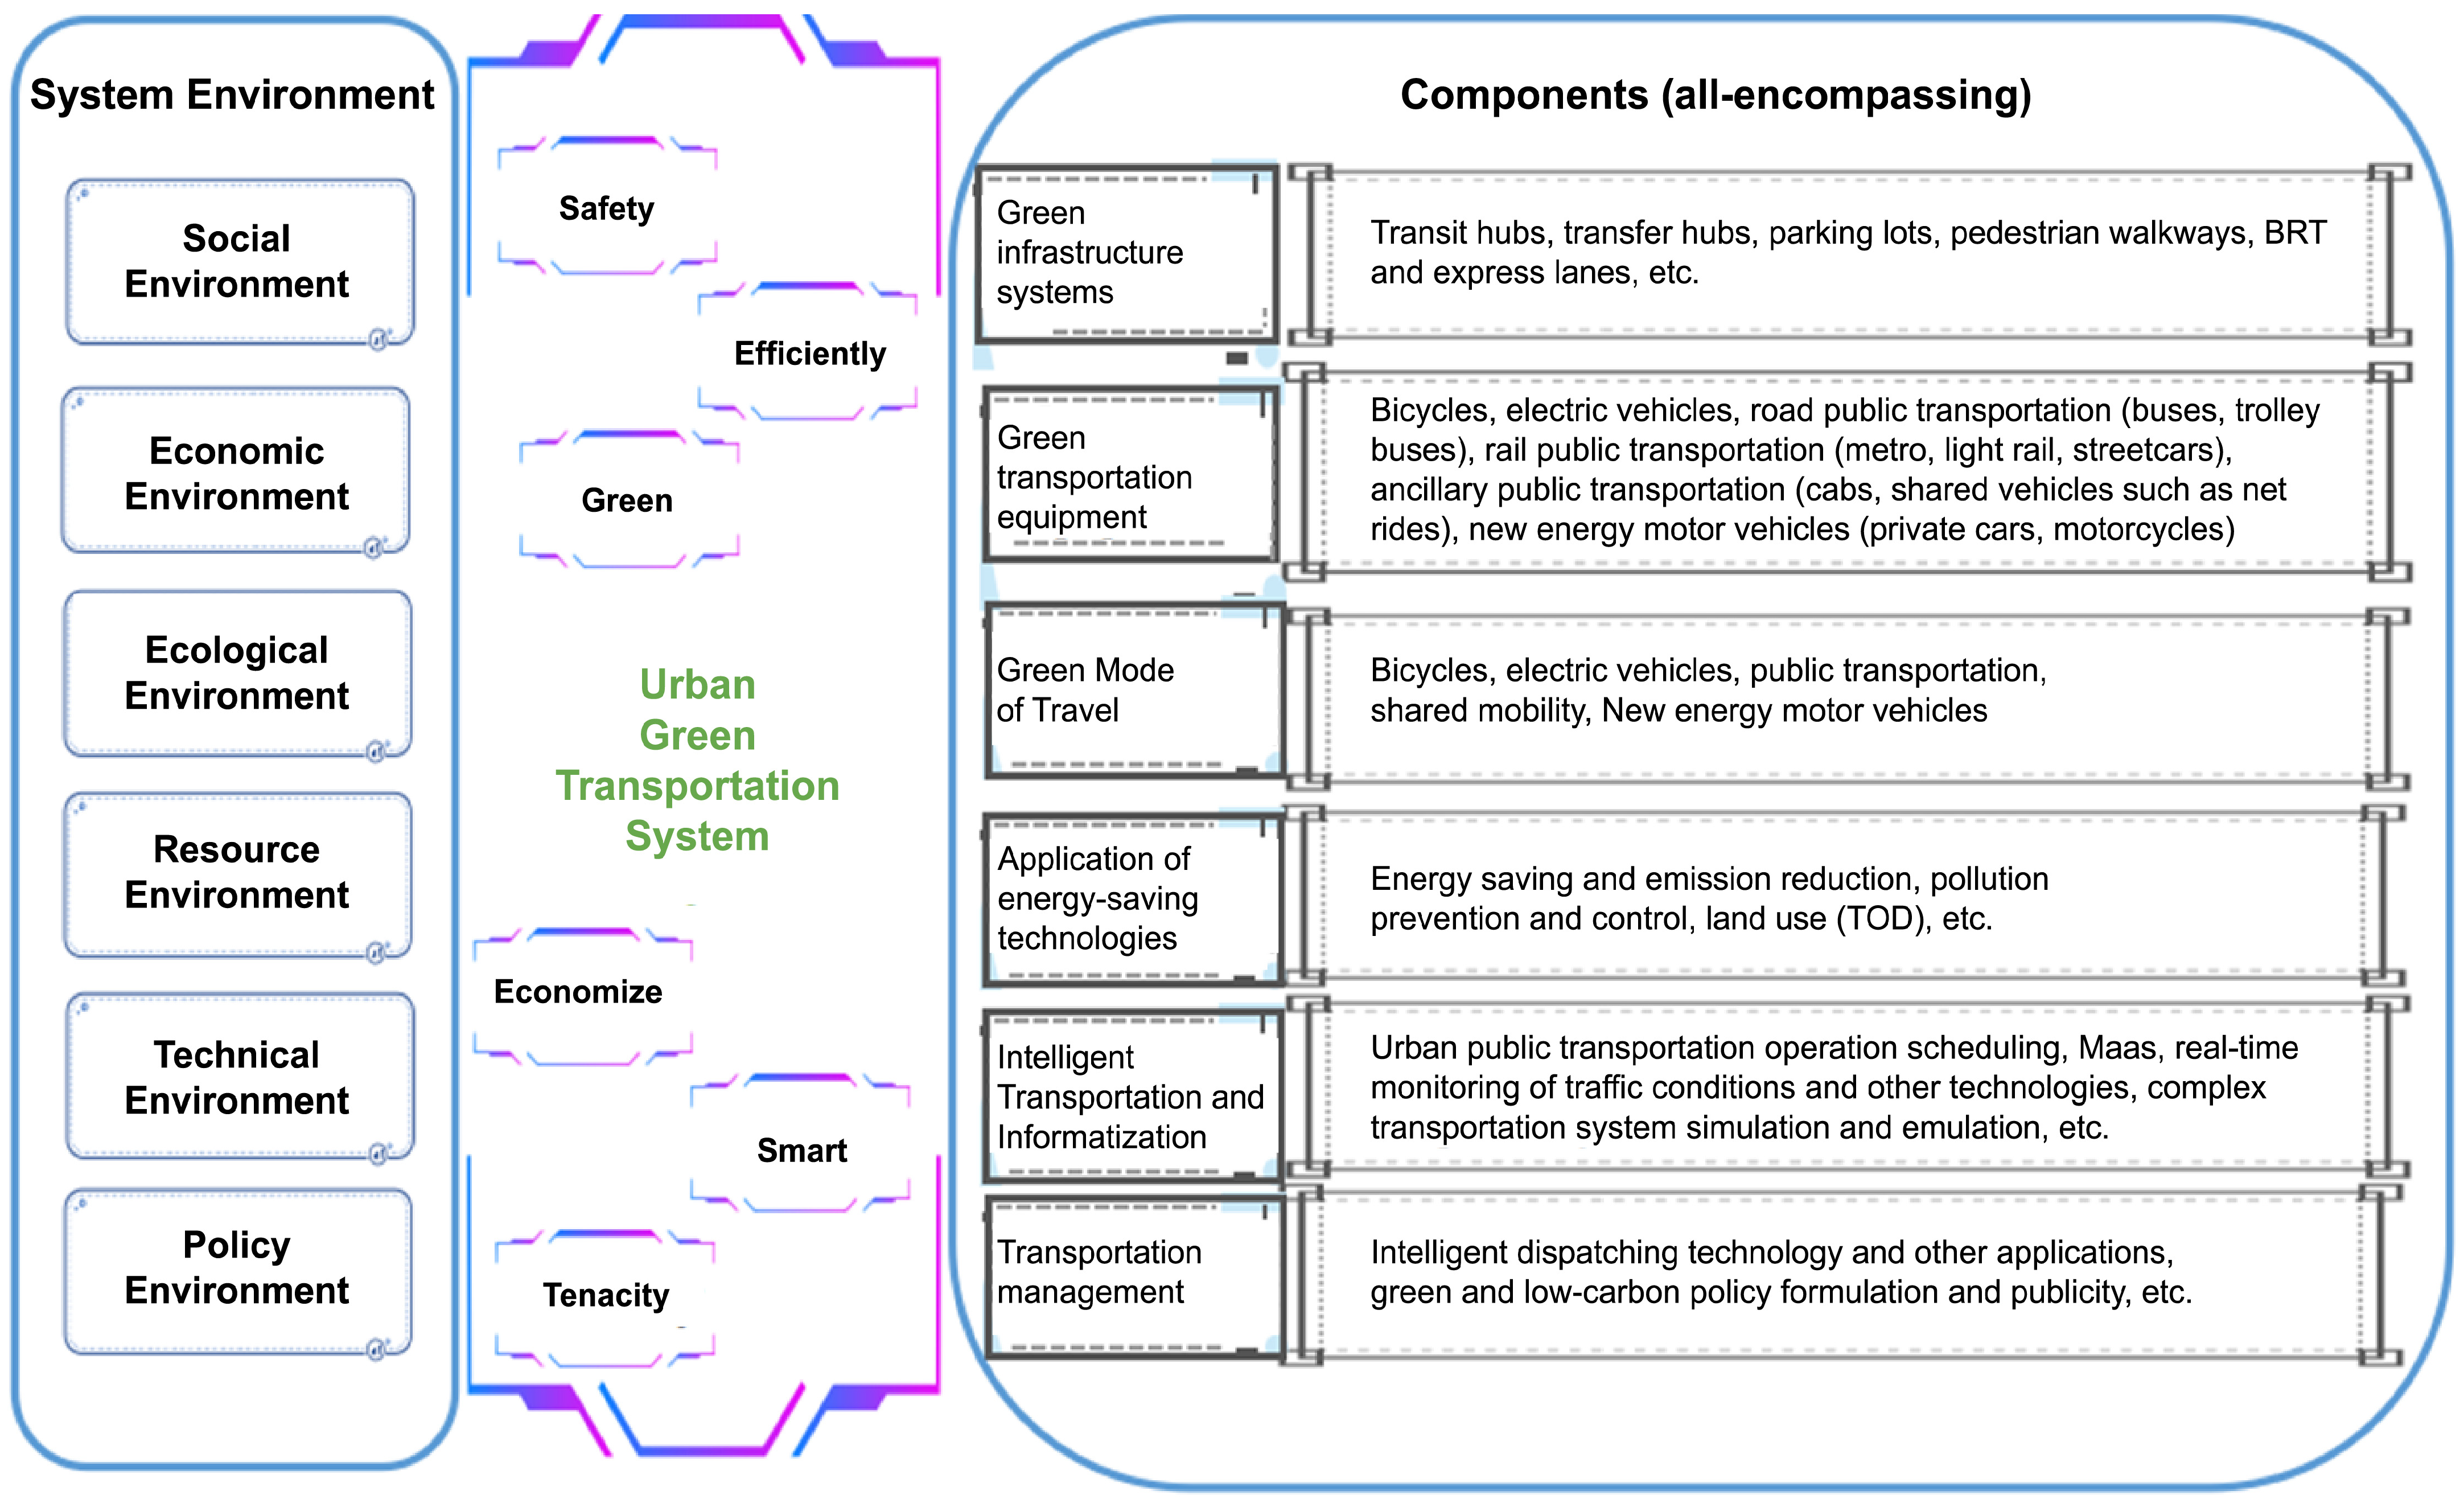
An urban green transport system has rich connotations and involves many elements. According to system theory and the principle of total quality control, urban green transport is a systematic development concept. As shown in Figure 1, from the perspective of system theory, this system includes multiple subsystems of society, economy, ecology, resources, technology, and policy. The basic composition of the urban transportation system can be divided into multiple subsystems such as green infrastructure, green transportation equipment, green travel organization, energy-saving and environmental protection technology, and transportation management services. These multiple subsystems play a relevant role and must be developed together to achieve a green transportation system with the following characteristics: safety, high efficiency, green (low carbon, ecological), conservation/economy, wisdom, and tenacity. The concept of green transport should run through the entire process of planning, designing, constructing, operating, maintaining, and managing [28]. It should lead to a sustainable development system promoted by the government and acted on by the public, as shown in Figure 1.
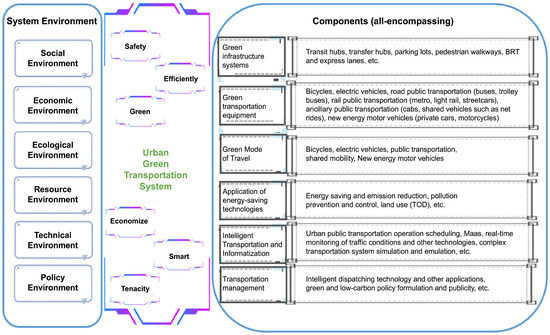
Figure 1.
Schematic diagram of connotations and composition of urban green transportation.
2.2. Connotation-Based Evaluation Indicators
An index system can be used to describe and evaluate green, low-carbon, and sustainable development of urban transportation and to find the weak links and development potential affecting the green development of a city [29]. Thus, it can facilitate the implementation of specific programs to ensure that urban transportation develops safely, conveniently, efficiently, greenly, wisely, and economically.
In the process of setting the indices, quantitative calculation and qualitative analysis should be conducted on all aspects affecting the development level of urban green transportation. This paper combines the Evaluation Indicator System for the Construction of a Transportation-Powerful Country [30], the Carbon Peak Action Program by 2030 [31], and the Chinese government standard for urban comprehensive transport system planning [32] and establishes an evaluation indicator system for urban green transportation using the target and hierarchical analysis methods.
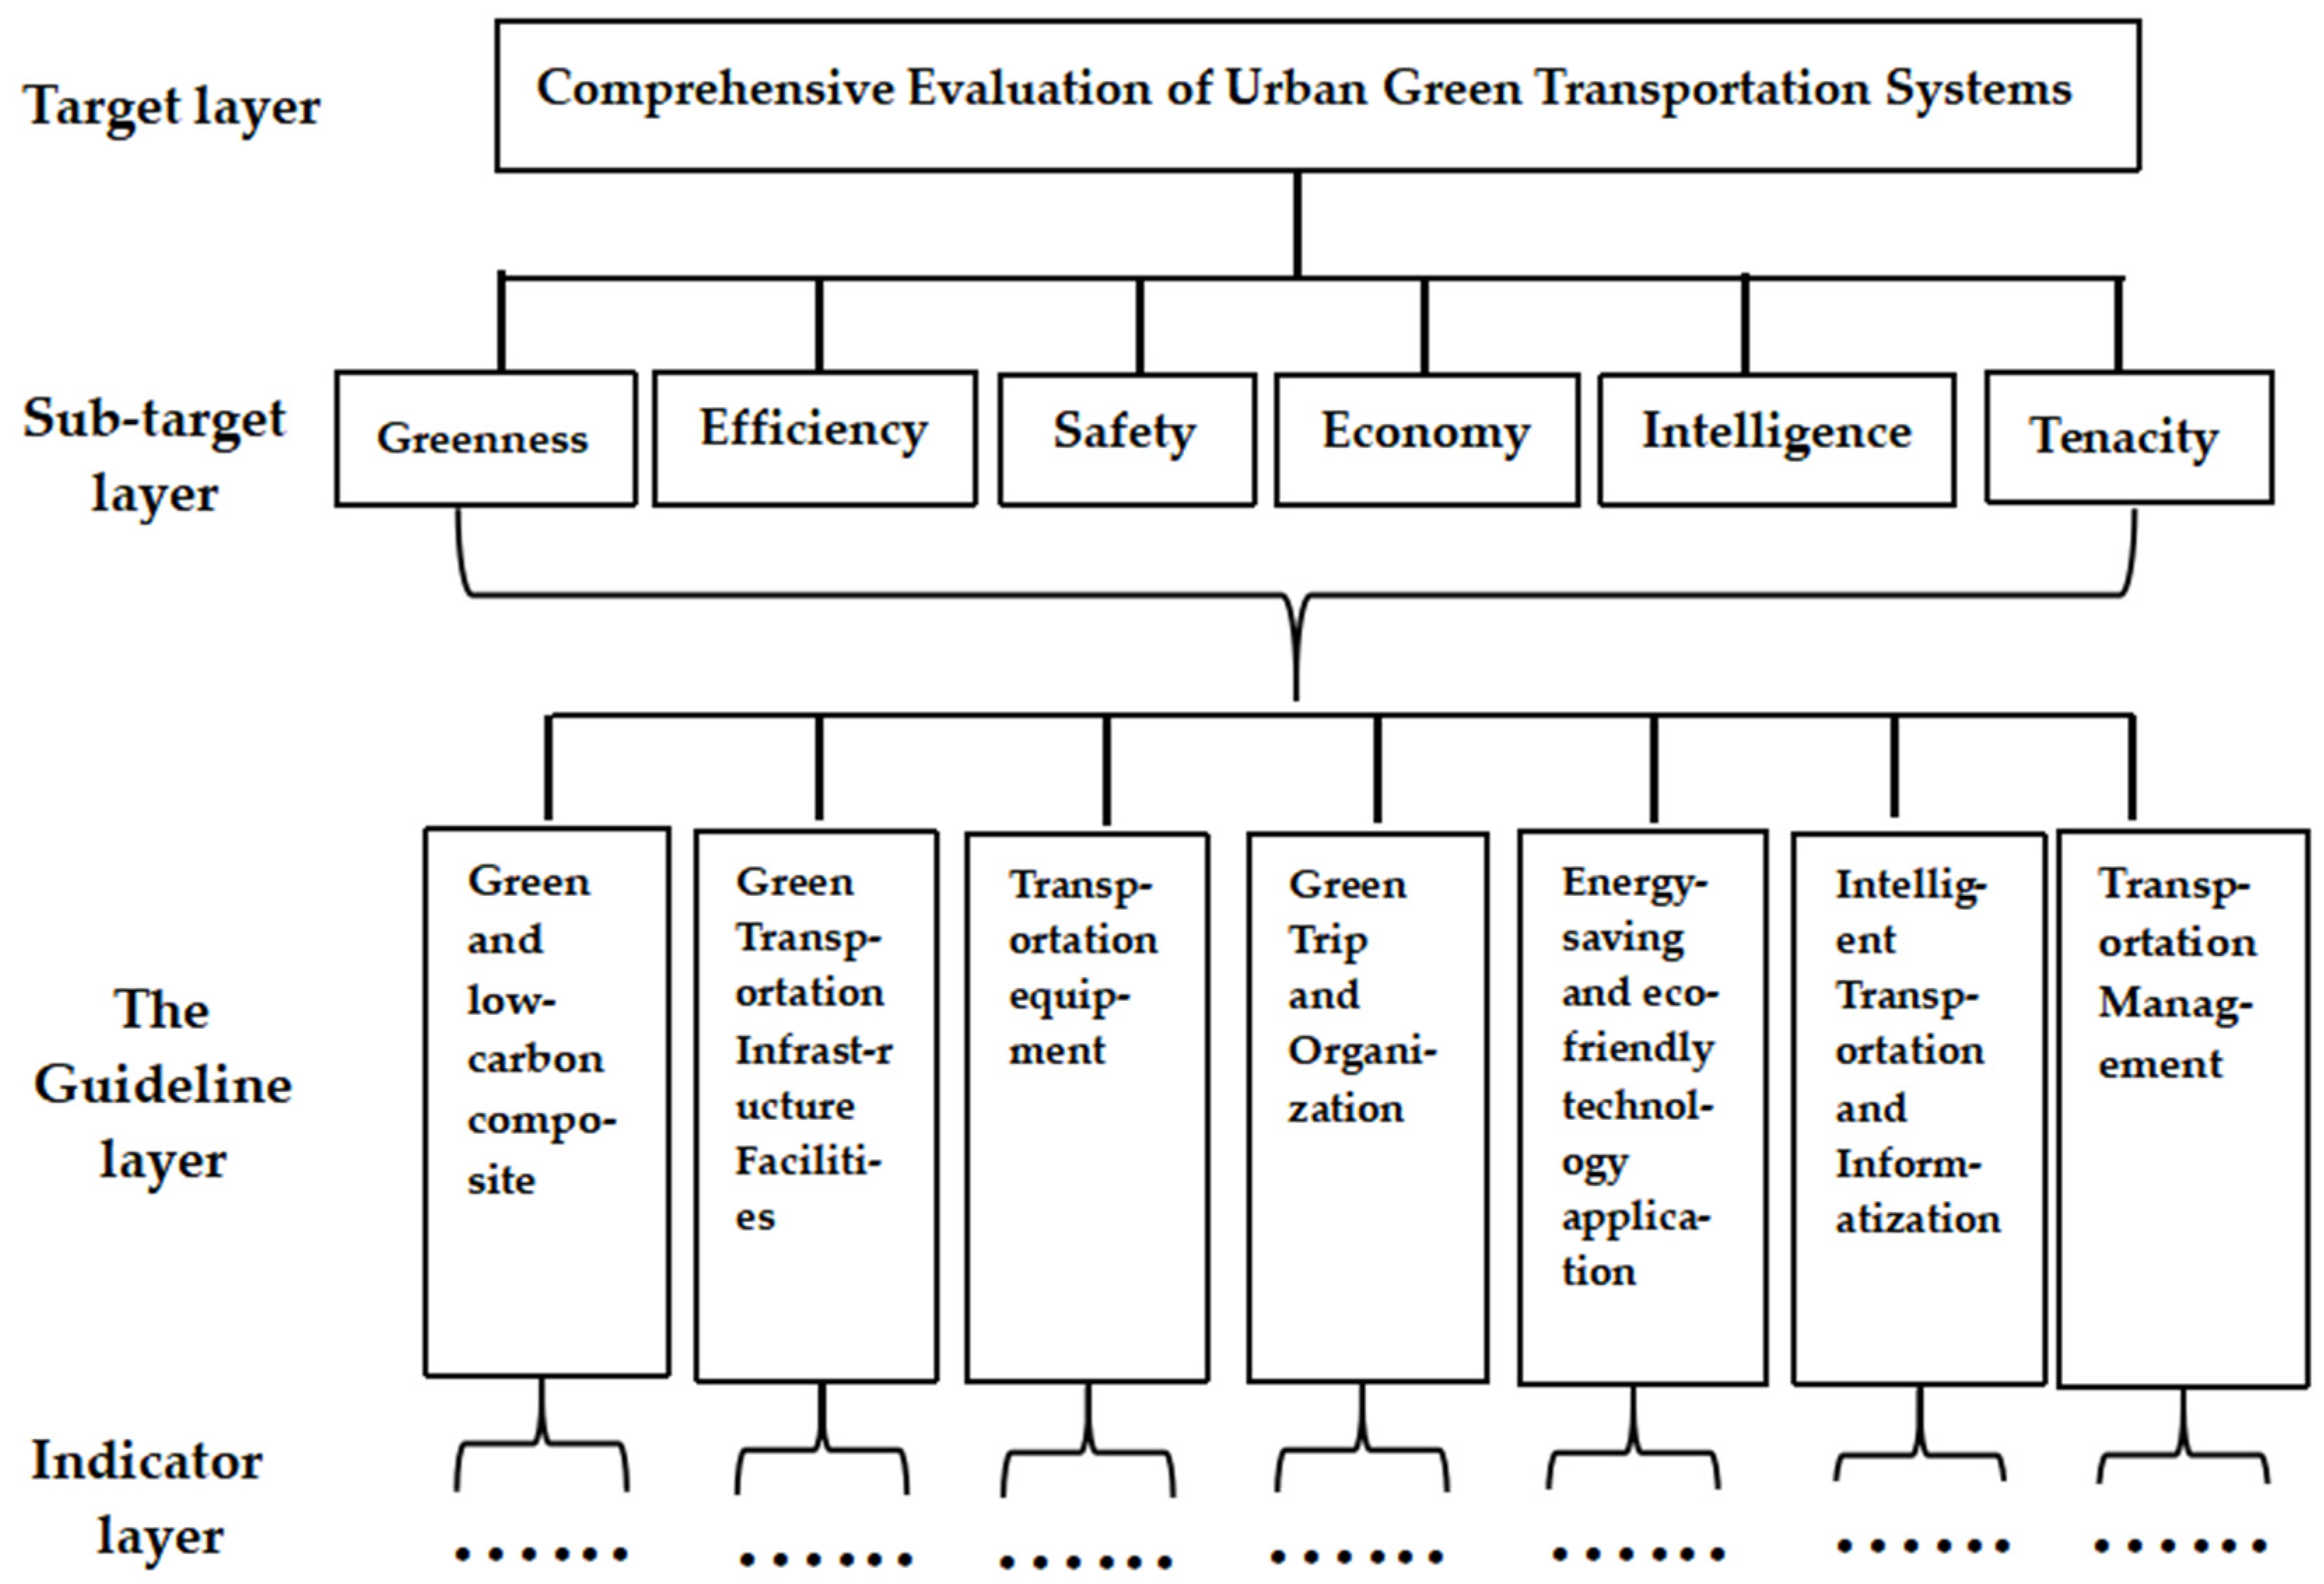
First, using the objective method, a comprehensive evaluation of the urban green transportation system is identified as the evaluation objective. Second, by employing the hierarchical analysis method, the evaluation objective is divided into various sub-objective layers according to the connotations of urban green transportation: safety, high efficiency, greenness, conservation/economy, wisdom, and tenacity. These are further subdivided into several parts (subsystems) based on the composition of the urban green transportation system, that is, on the guideline objectives, which are green and low-carbon comprehensive indicators, green transportation infrastructure, green transportation equipment, green-trip organization modes, energy-saving and environmental protection technology, intelligent transportation and informatization, and transportation management [29]. Finally, the indicator layer is formulated according to the interrelated influences and affiliations among factors, thus establishing a comprehensive evaluation index system, as shown in Figure 2 and Table 1, Table 2, Table 3, Table 4, Table 5, Table 6, Table 7.
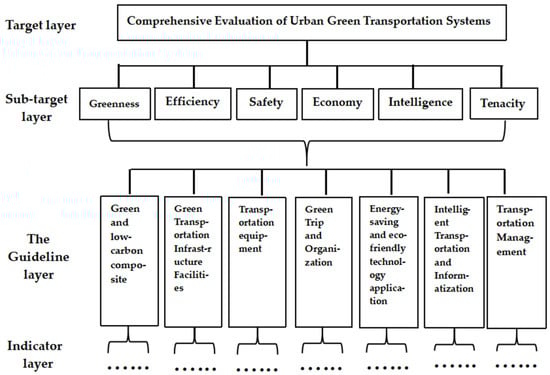

Table 1.
Green and low-carbon composite indicators A (under second node of guideline layer in Figure 2).
Table 2.
Green transportation infrastructure facility indicators (under second node of Guideline layer in Figure 2).
Table 3.
Transportation-equipment indicators (under third node of Guideline layer in Figure 2).
Table 4.
Green travel and organization indicators (under fourth node of Guideline layer in Figure 2).
Table 5.
Energy-saving and environmentally friendly technology application indicators (under fifth node of Guideline layer in Figure 2).
Table 6.
Intelligent transportation and informatization indicators (under sixth node of Guideline layer in Figure 2).
Table 7.
Transportation management indicator (under seventh node of Guideline layer in Figure 2).
The composition of the indicators included in each guideline layer is presented in Table 1, Table 2, Table 3, Table 4, Table 5, Table 6 and Table 7 [33], and the content of the indicators is described below.
- 1.
- Green and low-carbon composite indicators A (as shown in Table 1):
- (a)
- Energy intensity indicators (e.g., A1, A2, and A3): These indicators reflect the level of comprehensive energy consumption of the urban transportation system. The combined energy consumption per unit of transport turnover by each transport mode equals the vehicle energy consumption per transport mode divided by the vehicle-transport turnover volume.
- (b)
- Carbon-emission intensity indicators (e.g., A4, A5, and A6) [34]: These indicators reflect the level of carbon-emission intensity of urban transportation. The CO2 emissions per unit of turnover by each transport mode equals the CO2 emission volume from vehicles divided by the vehicle-transport volume by transport mode.
- (c)
- Pollutant control indicators (e.g., A7): These indicators reflect the pollution of the environment by urban transportation.
- 2.
- Green transportation infrastructure facility indicators B (as shown in Table 2):
- (a)
- Density of the city bus network (km/km2) (B1): This indicator reflects the proximity of residents to bus routes. It is the length of the urban bus network divided by the urban area.
- (b)
- Bus stop coverage rate (500 m) (%) (B2): This indicator reflects the capacity of bus services. It is the ratio of the 500 m coverage area of public stops in built-up areas divided by the built-up area.
- (c)
- Urban Bus Rapid Transit (BRT) km per 10,000 population (including bus lanes and rail transit) (km per 10,000 population) (B3): This indicator reflects the BRT and rail transit service capacity. It is obtained by adding the BRT and rail transit miles and dividing by the population.
- (d)
- Construction of urban bicycle lanes (B4): This study used the bicycle lane network density divided by the total urban area; indicators such as the bicycle lane width or service radius could also be selected.
- (e)
- Construction of urban pedestrian walkways (B5): This indicator reflects the construction of both general pedestrian walkways within the built-up area of the city and walkways connecting with stations such as urban bus stops and rail transit stations. This study used the pedestrian–facility network density (i.e., the pedestrian trail length divided by the urban area); the sidewalk width and service radius of the fitness trail could also be used.
- (f)
- Urban traffic signal operational efficiency (B6): The efficiency of vehicular traffic at traffic light junctions on urban roads within the built-up areas of cities can be evaluated by using such indicators as the number of traffic signals, average waiting time for pedestrians to cross the street, number of vehicles passing in the peak hour, and delayed waiting time at the junction.
- (g)
- Construction of natural-gas-filling and charging stations (B7): This indicator reflects the ease of vehicle refueling or charging. Indicators such as service radius and floor space can be used for evaluation.
- (h)
- Construction of urban comprehensive transportation hubs (B8): This indicator reflects the convenience of transportation hubs. Parking lot and transfer hub ownership or area can be selected for evaluation.
- 3.
- Transportation equipment indicators C (as shown in Table 3):
- (a)
- The proportion of energy-saving and green operating vehicles (%) (C1): This indicator is the total percentage of operating vehicles that are natural-gas-powered, hybrid, or electric powered. It could be subdivided into further categories, such as private vehicles, buses, and cabs.
- (b)
- Number of standardized buses per 10,000 people (standardized buses/10,000 people) (C2): This indicator reflects the level of public transport development and the traffic structure situation.
- 4.
- Green trip and organization indicators D (as shown in Table 4):
- (a)
- Public transport travel sharing rate (%) (D1): This indicator reflects the degree of public transport priority development; it is an important indicator for measuring the development and rationality of public transport. It is the number of urban residents who choose public transportation (including regular buses and rail transit) as their mode of travel divided by the total number of trips.
- (b)
- Proportion of slow-transportation trips (%) (D2): This indicator reflects the level of development of slow transportation (walking and biking) in the city.
- (c)
- Ratio of full/empty bus routes throughout the day (%) (D3): This indicator reflects the utilization of bus service, the rationality of bus route planning, and the level of operational scheduling. The full load factor is one of the important bases for rationalizing capacity. The maximum line load factor is the ratio of the sum of peak-hour high-one-way, high-cross-section retention to the sum of hourly crews.
- (d)
- Public transport punctuality (%) (D4): This indicator is the proportion of on-time trips.
- (e)
- Cab mileage utilization rate (%) (D5): This indicator reflects the capacity of cab services. It is defined as (total number of miles traveled minus empty miles)/total miles traveled.
- (f)
- Development of shared transportation (D6): This indicator reflects urban shared mobility; for example, the use of carpools, shuttles, and school buses. The proportion of such trips can be used as an evaluation indicator.
- (g)
- Promotion of public bicycles (D7): This indicator reflects the promotion of shared bicycles by city organizations. The shared bicycle ownership and usage rate in the city can be counted as evaluation indicators.
- (h)
- Traffic congestion index/running speed (D8): This indicator comprehensively reflects the smoothness or congestion of the road network and measures travel efficiency and happiness index.
- (i)
- The 10,000-vehicle accident rate (%) (D9): This indicator reflects urban traffic safety. These data are usually available through the city’s statistical yearbook.
- (j)
- Average interchange coefficient (%) (D10): This indicator reflects bus operation conditions, analyzes the degree of passenger satisfaction in different areas according to the passenger transfer coefficient, and measures the convenience and level of bus service. It is defined as the ratio of the sum of ride-sharing trips and transfers to the number of ride-sharing trips.
- 5.
- Energy-saving and environmentally friendly technology application indicators E (as shown in Table 5):
- (a)
- Degree of land use alignment (E1): This indicator reflects the degree of alignment of the green transportation plan with the city’s master plan.
- (b)
- Energy-saving and emission-reduction technology promotion (E2): This indicator includes the application of technology, the development of publicity and training, and energy-saving and emission-reduction monitoring and statistics. The application of energy-saving and emission-reduction technology in the entire process of design, construction, operation, and management can be evaluated.
- (c)
- Application of public transportation-oriented development concepts in urban planning (E3): This indicator reflects the promotion of the “public transportation priority” policy of the city.
- 6.
- Intelligent transportation and informatization indicators F (as shown in Table 6):
- (a)
- Public travel information service system (F1): This indicator represents a platform that includes a public travel service system, a geographic information system, and other components.
- (b)
- Application of intelligent dispatching system for urban public transportation and cabs (F2): This indicator includes the information service system, geographic information system, coordinated dispatching system, and emergency handling system.
- 7.
- Transportation management indicator G (as shown in Table 7)
This indicator can be used to consider the level of urban transportation services comprehensively in terms of travel quality, safety, efficiency, and other aspects. Specifically, the public travel satisfaction rate (%) (G1) can be used to characterize the degree of satisfaction of the public with urban travel in terms of infrastructure, service level, and convenience.
2.3. Criteria for Defining the Hierarchy of Evaluation Indicators
According to the relevant national norms and the Action Program for the Creation of Green Mobility by the Ministry of Transportation and National Development and Reform Commission [35], the indicators and the comprehensive evaluation standard values in the urban green transportation system comprise five levels: excellent (level 1), good (level 2), medium (level 3), general (level 4), and poor (level 5); specific criteria for the definition of these grades have been established.
In the process of defining the criteria for grading evaluation indicators, attention should be paid to distinguishing between qualitative and quantitative indicators. For quantitative indicators, specific graded standard values are determined in accordance with national norms and planning, whereas for qualitative indicators, experts are invited to standardize the indicators in the light of the actual situation in each region by means of set value iteration, expert scoring, and other subjective methods. Taking the city of Harbin in China as an example, the suggested value ranges for some evaluation indexes at various levels are shown in Table 8.
Table 8.
Suggested ranges for levels of selected evaluation indicators.
3. Evaluation Methodology Based on Comprehensive and Integrated Empowerment Method
In a comprehensive evaluation, the central problem is weight determination. The weight quantifies the importance of each evaluation index and transforms qualitative analysis into quantitative analysis, making the results more objective and reasonable. The determination of weights should consider not only the characteristics of the evaluation indices but also the environment and subjective information from the decision-makers about urban transportation as a part of the socioeconomic system. Therefore, integrating subjective and objective methods in calculating the indicator weights leads to a more scientific evaluation process and yields more objective and accurate results.
In this study, we selected the G1 method as the subjective empowerment method and the entropy value method as the objective empowerment method to calculate the evaluation index weights. We then employed the additive integration method to obtain the final weights. The principles and calculation steps of the two methods are described below.
3.1. Basic Principles and Calculation Steps of the G1 Method
The G1 method, also known as ordinal relationship analysis, is a subjective empowerment method improved from the AHP, and is a new method of determining the weights of indicators [36,37]. It does not require consistency tests, either in the case of inconsistency in the judgment matrix in the method of characteristic roots, which makes it impossible to perform the evaluation, or in the hierarchical method of determining the existence of different conclusions in different matrices. The process of calculating indicator weight coefficients using the G1 method is as follows.
3.1.1. Evaluation of the Determination of Ordinal Relationships of Indicators
Assume that there are evaluation indicators x1, x2, …, xm and an evaluation guideline. Decision-makers rank attributes in descending order of importance based on their own judgment. Then, the following relationship exists among the re-labeled evaluation indicators: . The evaluation indicators are then said to have an ordinal relationship with each other in accordance with “”. is the ith indicator for which the evaluation indicator has been reordered according to the ordinal relationship “”.
Usually, we invite a certain number of experts to establish the relationship between the set order of evaluation indicators in the following way:
First, from the set of indicators {x1, x2, …, xm}, the experts select the one considered to be the most important for the evaluation guideline and label it x1*. Next, the experts select what they consider to be the most important of the remaining indicators and label it x2*. This process is repeated until the least important indicator has been identified by elimination and labeled xm*.
3.1.2. Comparative Judgment between Indicators xk–1 and xk
For any two evaluation indicators and , the ratio of the degree of importance assigned by the experts can be expressed as , as shown in Equation (1). Typically, a larger indicates that is more important than .
The judgment ratio rk of the degree of importance of evaluation indicators xk–1 and xk is explained in Table 9 [36]. It is defined for k = m, m − 1, m − 2 … 3, 2. The following relationship should also be satisfied:
Table 9.
Assigning a reference table [36].
3.1.3. Calculation of Weight Values for Each Indicator
The calculation of the weight values for each indicator depends on the ri determined by the expert. The subjective weights of the evaluation indicators can be found as follows:
3.2. Basic Principles and Steps of Entropy Value Method
Entropy is a measure of uncertainty in information theory. For a large amount of information, the uncertainty, and therefore the entropy, are small, and vice versa. In the entropy value method, the entropy of the indicator is used to determine the weight. Generally, the set of evaluation objects is recorded as {Ai} {i = 1, 2, …, m}, the set of indicators used for evaluation is recorded as {Xj} {j = 1, 2, …, n}, and the original value of the j-th indicator of the i-th program is recorded as xij [38]. The calculation steps of the entropy value method are as follows:
- 1.
- First, xij is normalized. Since the units of measurement of different indicators may be different, it is necessary to remove the influence of the units, which is commonly known as dimensionless processing. In the green transportation evaluation, contains all evaluation scores, so this step may be skipped.
- 2.
- The share pij of the i-th option of the j-th indicator is calculated as
- 3.
- The entropy value ej of the j-th metric is calculated as
- 4.
- The coefficient of variation gj for the j-th indicator is calculated. Subsequently, based on the entropy value of each indicator, the coefficient of variation is calculated. When the original values of each indicator of each program are equal, , then indicator has no role in the comparison between the evaluated objects. In general, the greater the difference from the original value of the indicator , the smaller , and the greater the role of the indicator; the converse is also true [38]. Therefore, the coefficient of variation is defined as
A larger gj value indicates that the indicator is more useful and should be emphasized.
- 5.
- The coefficients of variation are normalized to obtain the objective weights, and the weights of the indicators are calculated as
3.3. “Additive” Integration Method for Determining Final Weights
Let pj and qj be the weight coefficients of the indicator xj generated by the G1 method and entropy value method, respectively. Then,
is the weight coefficient obtained from the integration of subjective and objective information. Here, k1 > 0 and k2 > 0 satisfy one of the normalization conditions k1 + k2 = 1 or k12 + k22 = 1 [36,37]. is , which is obtained in Section 3.1.
4. Urban Green Transportation Evaluation and Suggested Improvements
4.1. Example of Evaluation of Urban Green Transportation System
4.1.1. Status of Green Transportation Development in Harbin
This study focused on Harbin City. According to the statistical data [39], at the end of 2021, the urban population of Harbin City was 5.52 million. It had 93,994 ha of land for transportation in the administrative area; the urban area was 10,198 km2. The city had 372 bus lines (operating line length 8562.5 km), a bus stop 500 m coverage rate of 99.7%, and a line network density of 2.82 km/km2.
The public transportation fleet of the city included 6981 vehicles, of which 94% were new energy vehicles, with 13 buses per 10,000 people. The total number of passengers was 480 million, the average daily passenger volume was 2.4 million, and the share rate of public transportation was 56.2%. There were three rail-transit lines, with a total operating length of 78.08 km and a total passenger volume of 398 million trips. Harbin City had a total of 62 running stations and four transfer stations. The average bus transfer walking distance was <800 m, and the transfer coefficient was 1.28 [40]. The regular bus and rail-transit–station connection rate was 93.0%. There were 15,353 cabs and 47,633 network cars, and the average daily passenger volume of the taxi industry was ~1.12 million.
4.1.2. G1 Method
The 2021 Harbin City data provide information about some of the indicators in Table 8: x1 (B1), x2 (B2), x3 (C1), x4 (C2), x5 (D1), x6 (D10), and x7 (E1). A panel of experts (professional transportation researchers from major Chinese universities) determined the ordinal relationship among x1, x2, x3, x4, x5, x6, and x7 by the set value iteration method:
Moreover, according to (1),
According to (2),
Therefore, .
Thus, according to (3),
Similarly, w5* = w4* = 0.1492, w3* = w2* = 0.1791, and w1* = 0.2149.
From the ordinal relations:
Therefore, the weighting coefficients of the evaluation indicators were
The results of the above parameters are shown in Table 10.
Table 10.
List of parameters used to calculate indicator weights using G1 method.
4.1.3. Entropy Value Method
The entropy value method was utilized to determine the factor scores of each indicator. According to Table 8, the evaluation indicators hierarchical delimitation of the proposed value was divided into five levels to score the indicators. Levels 1, 2, 3, 4, and 5 were assigned to scores of 5, 4, 3, 2, and 1, respectively, and the scoring results are shown in Table 11.
Table 11.
Evaluation table of factor indicators.
The score of the urban green transportation system in Harbin was calculated as follows: where Sj is the score for the j-th indicator.
The weight of each indicator based on (5)–(8) is shown in Table 12.
Table 12.
Calculation of indicator weights using entropy method.
4.1.4. Integration Method for Determining Final Weights
Subjective and objective factors were fully considered; therefore, in (9), k1 = k2 = 0.5 was assumed. The results of calculating the comprehensive weight wi of the evaluation indicators were as follows, as shown in Table 13.
Table 13.
List of parameters used to calculate indicator weights using “additive” method of integration.
4.1.5. Analysis of Evaluation Results
The comprehensive score of the urban green transportation system in Harbin was calculated from
The five levels of the comprehensive evaluation were defined as Level 1 [4, 5], Level 2 [3, 4), Level 3 [2, 3), Level 4 [1, 2), and Level 5 [0, 1). The results show that the comprehensive evaluation grade of the urban green transportation system in Harbin is Level 2, that is, “good”.
Harbin City adheres to the implementation of its public transport priority development strategy. The public bus environment continues to be optimized for travel efficiency, the construction of new bus stations and bus electronic stops facilitates the overall promotion of the convenience and comfort of bus travel, and the level of intelligent technology use has increased significantly.
The results of the evaluation and analysis of the urban green transportation system established in this study are consistent with the predicted trend of urban low-carbon transportation in Harbin City (based on the fuzzy evaluation perspective) by Zhang et al. [41], and the actual level of development of Harbin City in 2020, which proves that the method is effective.
4.2. Suggestions for Further Sustainable Development in Harbin
The third-level B1, C2, and D10 scores and fourth-level E1 score in Table 10 reflect weaknesses in the development of green transportation in Harbin City. Public transportation services need further improvement, the public is inconvenienced in some areas (in particular, the problem of interchange is not fully solved, and some special groups continue to experience travel inconveniences), and intelligent information technology is underutilized. Proposed countermeasures for these problems are as follows:
- Improving the configuration of green transport facilities and equipment. In the PPE, the service capacity of urban green transportation must be improved in terms of safety, efficiency, convenience, and economy. Green travel modes must be integrated into intelligent transportation systems, slow-moving transportation infrastructure and transportation equipment must be deployed (Figure 3), and stronger guidance for green travel must be provided.
 Figure 3. Bicycle-sharing equipment in Harbin.
 - Prioritizing urban public transportation. A public rail and rapid-transit system that is supplemented by other types of regular public transportation, special public transportation, and rental cars must be constructed. For example, the aims of the 14th Five-Year Plan for Transportation in Harbin City include seeking approval from the higher government levels for subway planning, optimizing the layout of public transportation grids.
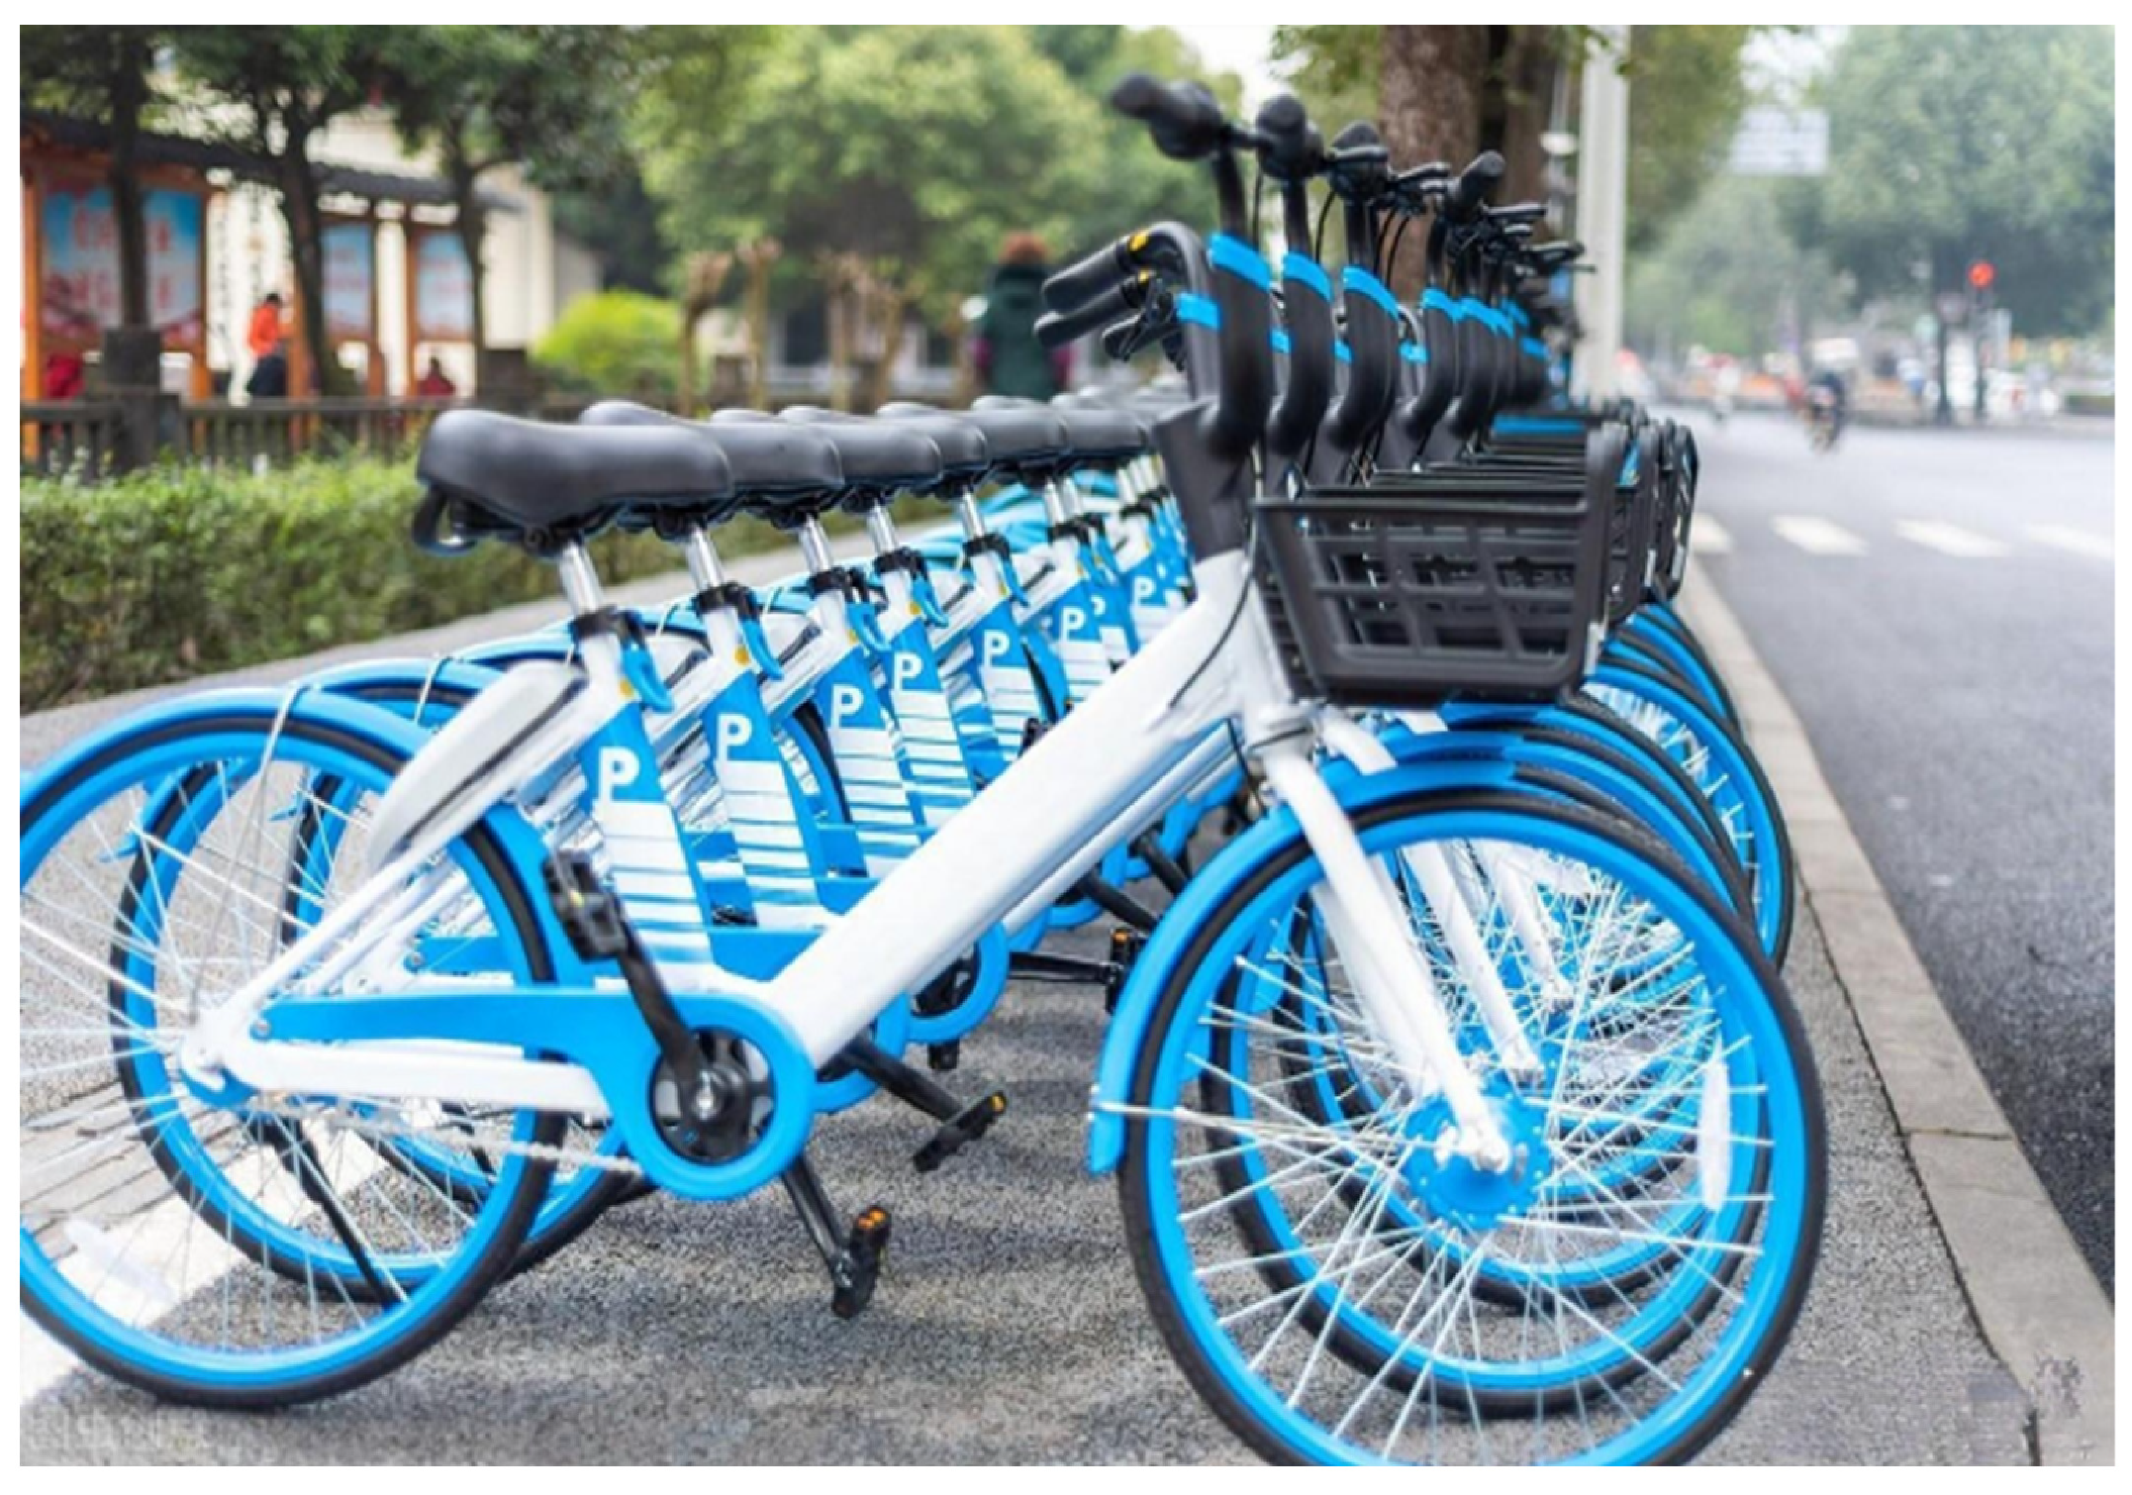
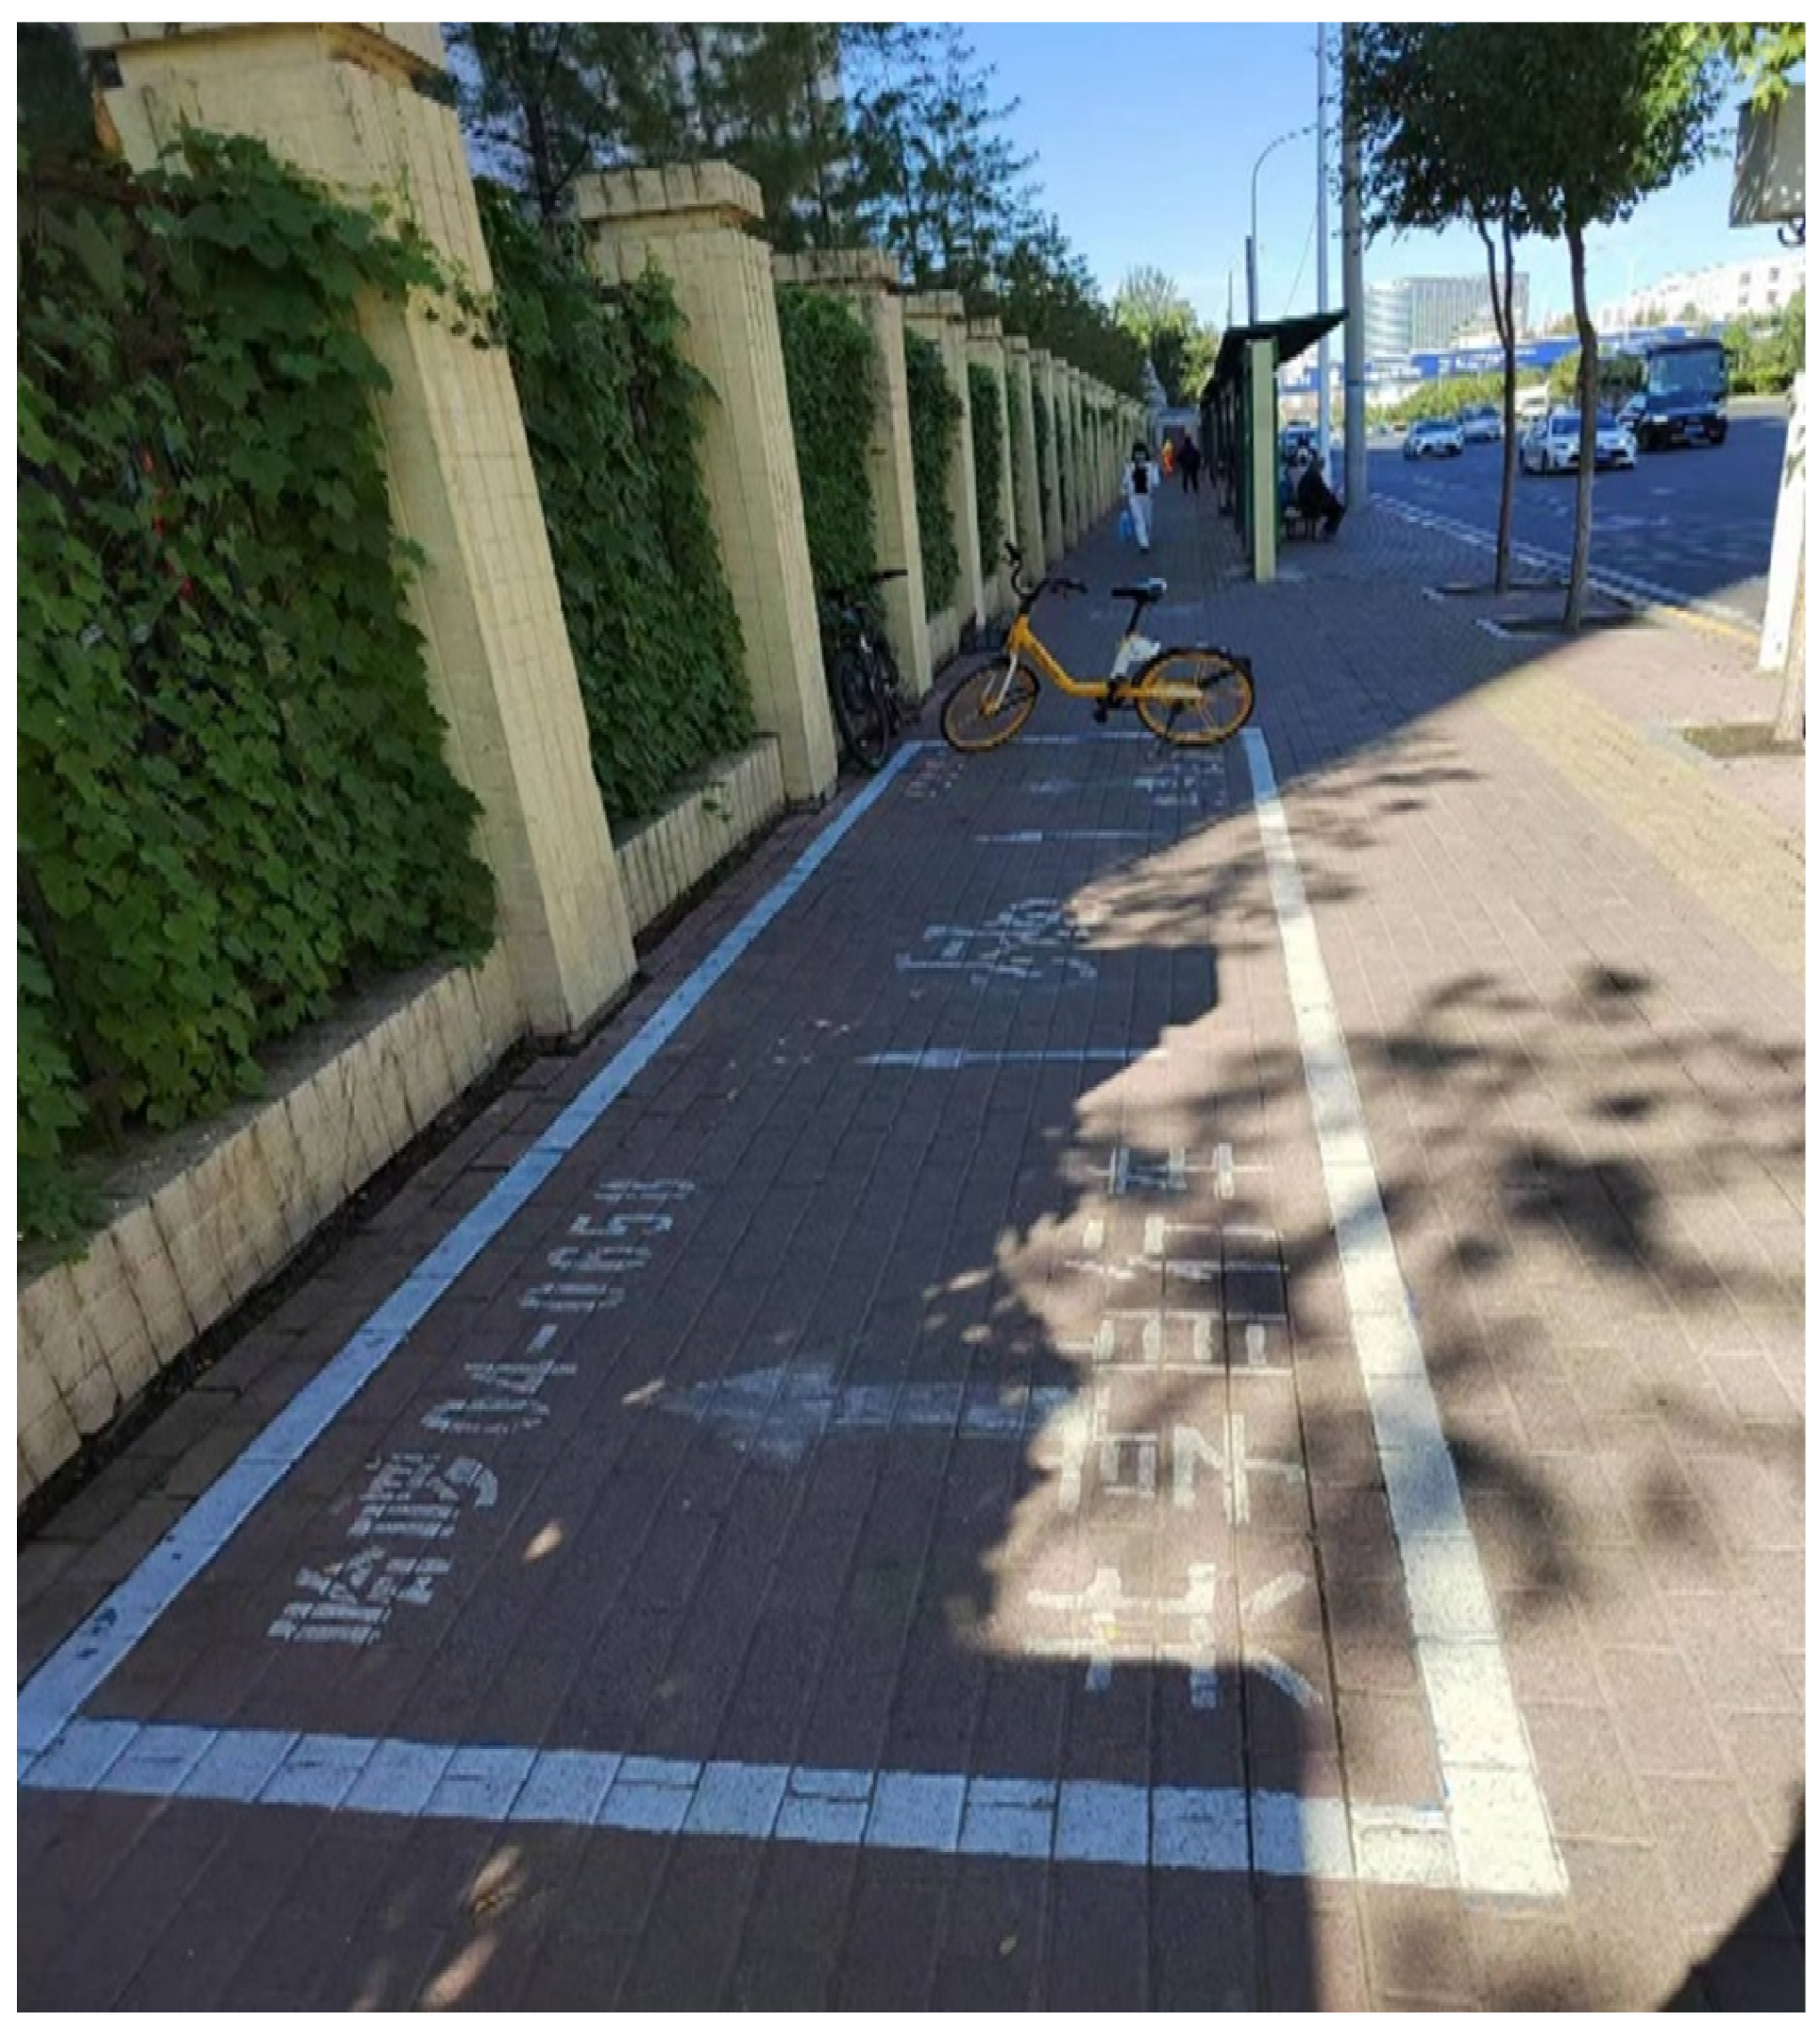
- Solving the “last-mile” (distance from a rail or bus stop to home) problem. Shared transport modes, including net buses (a mode of public transportation through online reservation services) (Figure 4), online car rentals, time-share rentals, and shared bicycles (a dockless bicycle sharing service based on mobile Internet technology, which provides bicycle rental services through placing bicycles in areas such as subway stations, bus stops and public service areas, etc., and provides bicycle rental services through a mobile APP or related platform) (Figure 5), offer flexible and convenient point-to-point services that improve travel efficiency, reduce walking distances, and help to solve the “last-mile” problem in the interchange process [42].
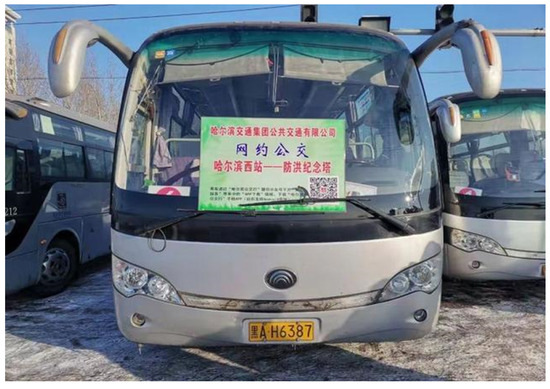 Figure 4. Net buses for commuter traffic in Harbin.
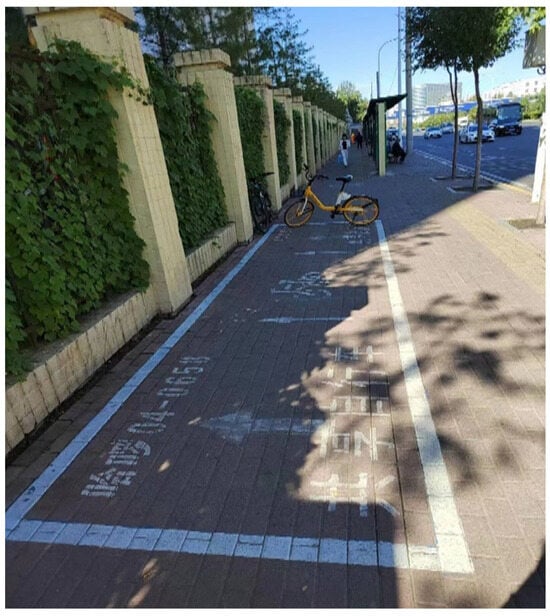 Figure 5. Shared bike parking area set up next to a bus stop in Harbin.
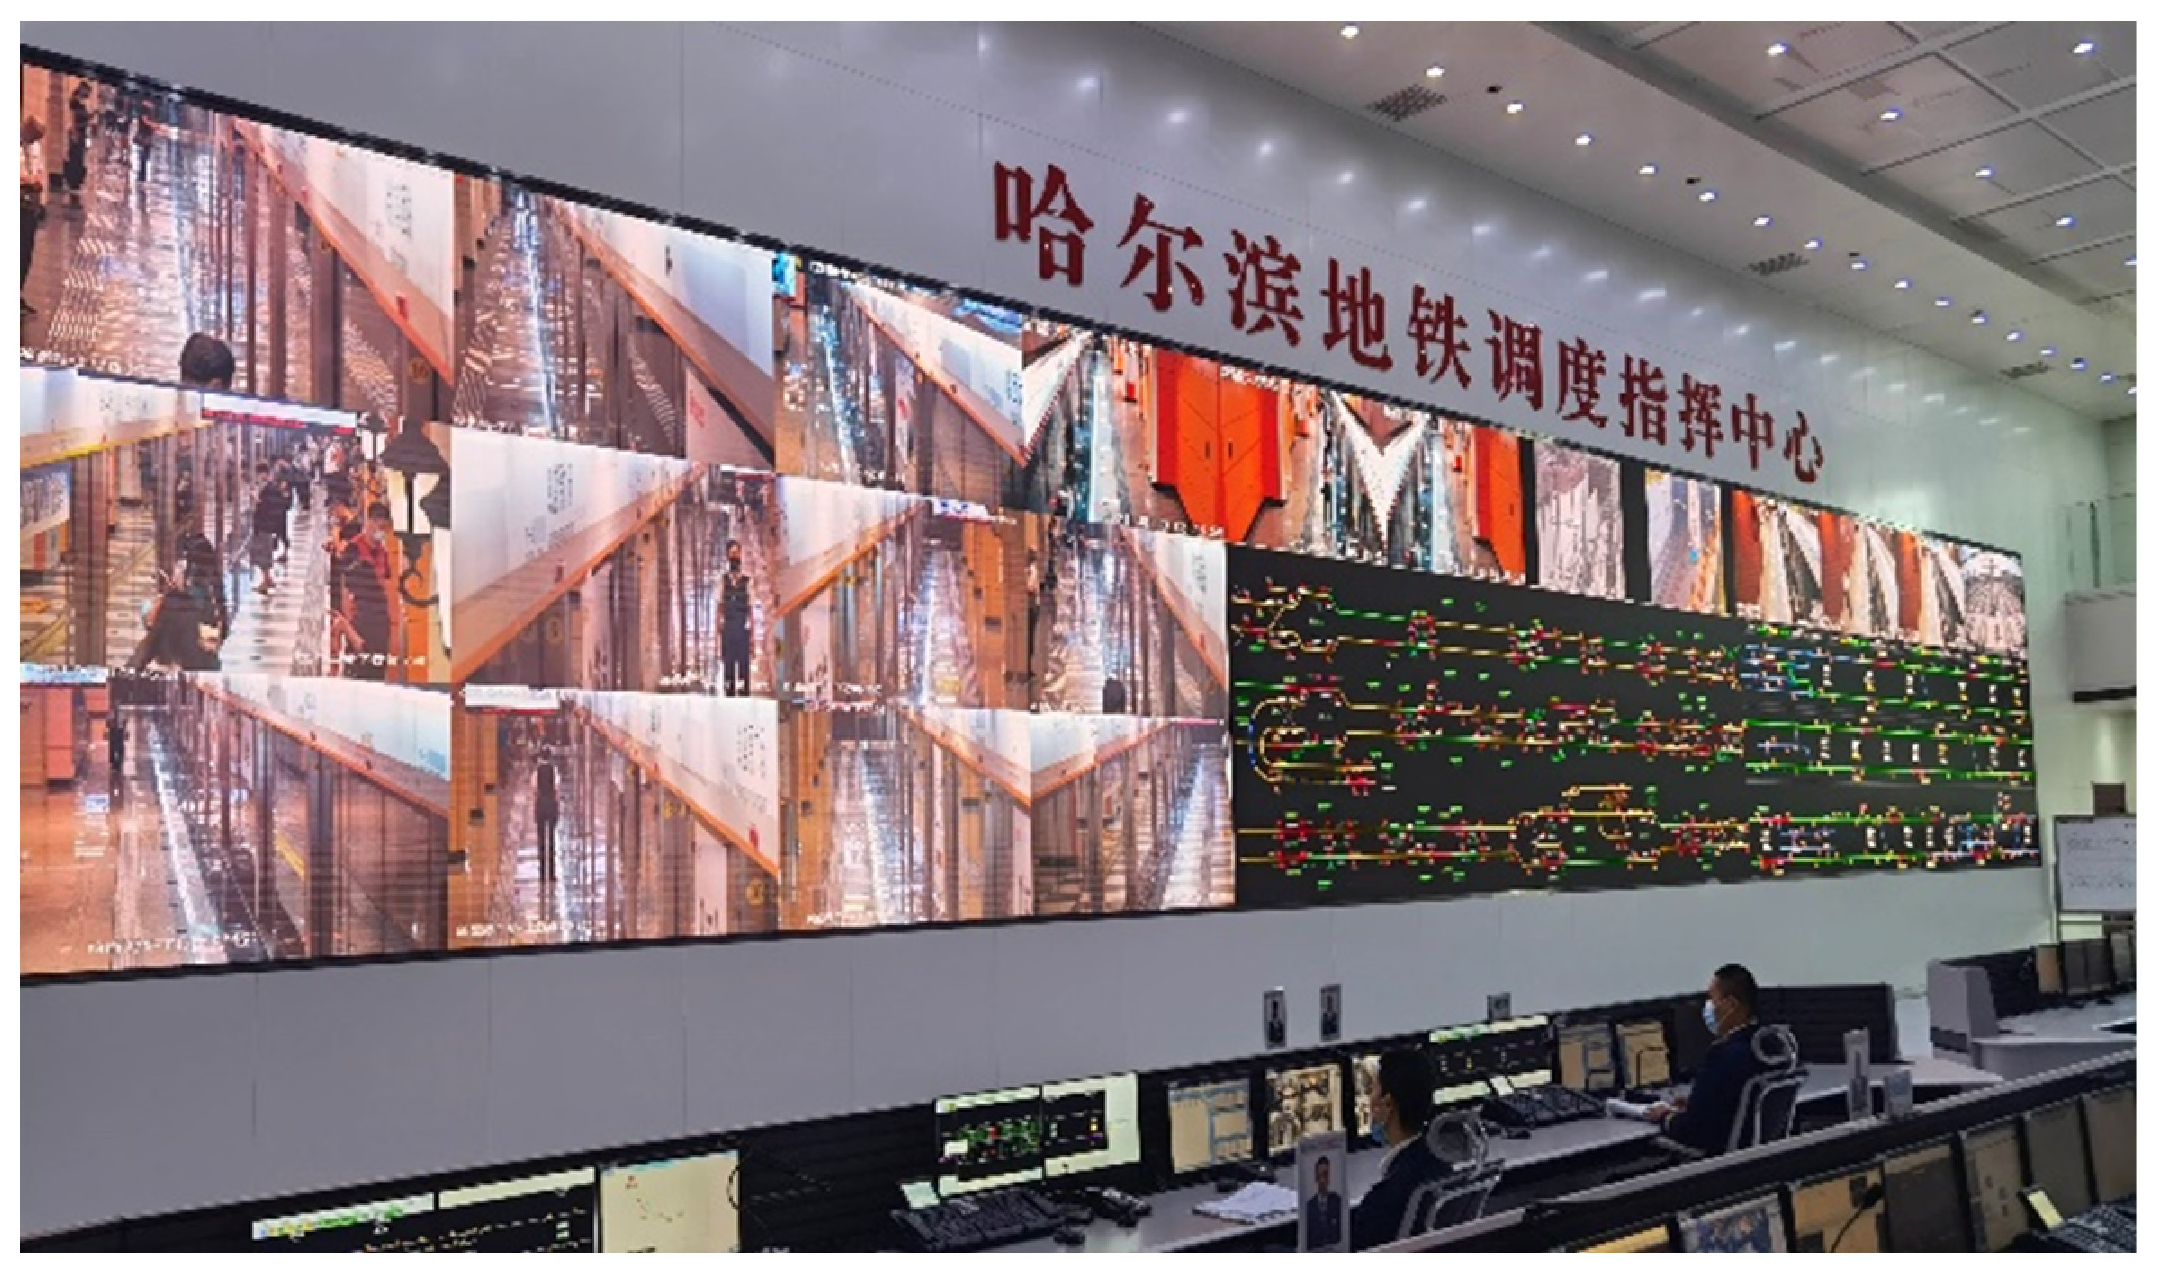
 - Improving transportation resilience and reducing carbon through intelligence and information technology. In addition to active promotion of the universal use of new energy vehicles, various modes of transportation should be integrated through information technology, such as creating a “model as a service (MaaS)” ([43] service platform, to improve the efficiency of travel by reducing aggregation. Moreover, intelligent scheduling (a comprehensive management platform integrating a variety of advanced technologies and functions) (Figure 6) and simulation and forecasting technology [44] should be used to improve traffic resilience in major emergencies.
 Figure 6. Harbin subway informatization scheduling command platform.
With the gradual reduction in the negative impact of the pandemic and the positive promotion of the “dual-carbon” goal, the level of urban green transport in Harbin will improve further.
5. Conclusions
The main work accomplished in this study is as follows:
First, this study developed a technique that can be used to assess the development level of urban green transportation. An index system was constructed using the AHP method and tenacity evaluation indexes, ensuring the characteristics of a multi-targeted, multi-level, and dynamic green transportation system and aptly reflecting the development requirements of such systems.
Second, for the evaluation method, a weighting system that combines subjective and objective weights was adopted, and the weights obtained from the G1 and entropy weighting methods were integrated using the “additive method”, which provided a balanced method that can improve the accuracy of urban green transportation evaluation.
Third, using Harbin, a typical northern city, as an example, we verified the effectiveness and convenience of the proposed method. Harbin is an important transportation and international cooperation hub in Northeast Asia and its experience in green transportation development is highly applicable to other northern cities and cities with similar climatic conditions.
Finally, the research results of this study can be used to assess the current level of green transportation development in a city, and can also be used to assess the current technology for future planning, promote the green development of urban transportation, and help the sustainable development of cities.
It is important to note that the research presented in this paper has the following limitations: First, the study mainly used Harbin City data for analysis. However, these data are mostly from statistical and research sources. Therefore, these data collection techniques may be incomplete or untimely. Second, this study used a simplified weighting method that was not compared with different weighting methods to explore the differences between methods. Finally, different cities have different levels of green transportation development, and the indicators selected in this study do not cover the different levels of urban transportation systems at different development stages, nor are they further validated in multiple cities.
Therefore, in the future, we will perform evaluation studies in different cities, apply different decision analysis methods to facilitate the development of methods and comparative analyses under different urban transportation conditions, and improve the evaluation index system with the improvement level of green development in cities to adapt to the rapid development of urban transportation.
Author Contributions
Conceptualization, Z.S.; data curation, C.D. and J.W.; formal analysis, C.D., Z.S. and B.C.; investigation, C.D. and J.W.; resources, Z.S. and B.C.; methodology, J.W. and C.D.; writing—original draft, C.D. and B.C.; writing—review and editing, Z.S., B.C. and J.W. All authors have read and agreed to the published version of the manuscript.
Funding
This research was funded by the [Ordos City Social Science Project: Research on Urban Transportation Emergency Protection and Management under Major Public Emergencies] grant number [2023p493].
Institutional Review Board Statement
Not applicable.
Informed Consent Statement
Not applicable.
Data Availability Statement
The authors do not have permission to share data. The datasets presented in this article are not readily available because the data are part of an ongoing study. Requests to access the datasets should be directed to dcy19900726@163.com.
Acknowledgments
The authors would like to thank the Shitu Research Service Platform and University Literature Service Center for their assistance with the literature as well as the data collection and organization process. Thanks to the support of Ordos City Social Science Project: Research on Emergency Security and Management of Urban Transportation under Major Public Emergencies (Project No. 2023p493).
Conflicts of Interest
Author Bo Chi was employed by Heilongjiang Longjian Road & Bridge Co., Ltd. The remaining authors declare that the research was conducted in the absence of any commercial or financial relationships that could be construed as a potential conflict of interest.
References
- Dai, H.L.; Su, Y.M.; Liu, J.Z.; Gu, D.J.; Kuang, L.C.; Zou, C.N. Reflections on China’s energy development strategy under the goal of carbon neutrality. J. Beijing Pet. Manag. Cadre Coll. 2022, 29, 12–19. Available online: https://kns.cnki.net/kcms2/article/abstract?v=lQz6UQjnwp-2I5W850nfPL4kAHjlZVBjp9WZaFX_r9F4oa-NW6glKDYvxO65ot5XG9kH57khcQG1xZpWJaR6xh82qcBpgOA1gY16jAIJSiIQube8eQvzGE0s4e91_Lln9wY7vGbKk3Tb0EftCoiVjA==&uniplatform=NZKPT&language=CHS%W CNKI (accessed on 20 July 2023).
- National Development Reform Commission of the People’s Republic of China. Opinions of the National Development and Reform Commission and Other Departments on Promoting the Green Development of the Joint Construction of the Belt and Road Initiative. 2022. Available online: https://www.gov.cn/zhengce/zhengceku/2022-03/29/content_5682210.htm (accessed on 3 April 2023).
- Yang, T.; Sun, X.L. Transportation development strategies for large cities under the constraints of climate warming and “dual-carbon” targets. Transp. Harb. Navig. 2021, 8, 3–7. [Google Scholar] [CrossRef]
- Wang, M.L. Research on Comprehensive Evaluation of Green Transportation Based on Sustainable Development Theory. Master’s Thesis, Chongqing Jiaotong University, Chongqing, China, 2016. [Google Scholar]
- Fu, L.H.; Liu, A.H. (Eds.) China Statistical Yearbook; China Statistical Press: Beijing, China, 2022. [Google Scholar] [CrossRef]
- Shah, K.J.; Pan, S.Y.; Lee, I.; Kim, H.; You, Z.; Zheng, J.M.; Chiang, P.C. Green transportation for sustainability: Review of current barriers, strategies, and innovative technologies. J. Clean. Prod. 2021, 326, 129392. [Google Scholar] [CrossRef]
- Chen, J.; Chang, Z. Rethinking urban green space accessibility: Evaluating and optimizing public transportation system through social network analysis in megacities. Landsc. Urban Plan. 2015, 143, 150–159. [Google Scholar] [CrossRef]
- Awasthi, A.; Chauhan, S.S.; Omrani, H. Application of fuzzy TOPSIS in evaluating sustainable transportation systems. Expert Syst. Appl. 2011, 38, 12270–12280. [Google Scholar] [CrossRef]
- Ma, F.; He, J.; Ma, J. Evaluation of urban green transportation planning based on central point triangle whiten weight function and entropy-AHP. Transp. Res. Proc. 2017, 25, 3634–3644. [Google Scholar] [CrossRef]
- Zhu, X.D.; Xue, D.X.; Gao, J.N.; Luo, R.Q. Research on green transportation index system. Urban Road Bridge Flood Control 2019, 10, 156–160. [Google Scholar] [CrossRef]
- Gao, Y.; Ma, Z.L.; Liu, J. Evaluation method of green transportation level in national central cities under the goal of “double carbon”. Transp. Res. 2022, 8, 30–41. [Google Scholar] [CrossRef]
- Yan, J.Y. Research on Urban Comprehensive Transportation Planning under Green Transportation Concept. Master’s Thesis, Zhejiang Ocean University, Zhoushan, China, 2017. [Google Scholar]
- Zhang, Y. Research on Green Fuzzy Comprehensive Evaluation of Urban Green Transportation. Master’s Thesis, Guizhou University of Finance and Economics, Guiyang, China, 2017. [Google Scholar]
- Wang, M.; Lin, X.; Yu, L. Comprehensive evaluation of green transportation in Chongqing main urban area based on sustainable development theory. Syst. Sci. Control Eng. 2019, 7, 369–378. [Google Scholar] [CrossRef]
- Xu, M.M.; Zhu, L.M.; Zhang, S.Y. Research on comprehensive evaluation of green transportation system based on AHP-value function method. J. Jiamusi Vocat. Coll. 2022, 36, 263–264. [Google Scholar]
- Jin, D.; Dong, X. Research on the evaluation of urban green transportation development based on DPSIR model. Ecol. Econ. 2018, 34, 79–85. [Google Scholar]
- Zhang, Z.F. Evaluation of urban green transportation planning based on value function. Transp. Energy Sav. Environ. Prot. 2015, 11, 52–55. [Google Scholar]
- Li, L.; Zhao, X.; Du, X.W. Comprehensive evaluation of urban green transportation development evaluation research. J. East China Jiaotong Univ. 2021, 38, 51–60. [Google Scholar] [CrossRef]
- Jiang, C.; Yin, S.; Yao, Z.; He, J.; Jiang, R.; Jiang, Y. Safety evaluation of mixed traffic flow with truck platoons equipped with (cooperative) adaptive cruise control, stochastic human-driven cars and trucks on port freeways. Phys. A Stat. Mech. Appl. 2024, 643, 129802. [Google Scholar] [CrossRef]
- Zhou, W.; Luo, F.; Wu, X. Jointly Building a Green “Belt and Road” to Promote Low-Carbon Development in Countries along the Route. In Xinhua News Agency. 2023. Available online: https://www.yidaiyilu.gov.cn/p/0MA16OF6.html (accessed on 3 April 2023).
- Bradshaw, C. The Valuing of Trips. In The Walk n Roll City, Second Car-Free Cities Conference, Toronto, January 1992; Revised Sep 1994, Prepared for Ottwalk and the Transportation Working Committee of the Ottawa–Carleton Round-Table on the Environment; Transportation & Infrastructure Committee: Toronto, ON, Canada, 1994. [Google Scholar]
- Huapu, L. Ways to realize urban green transportation. Urban Transport. 2009, 7, 23–27. [Google Scholar] [CrossRef]
- Ouyang, B.; Guo, J.; Zhang, H.; Feng, Z. Exploratory study on green transportation development index. J. Manag. Cadre Coll. Minist. Transport. Commun. 2017, 27, 11–15. [Google Scholar]
- Liu, J.; Zhang, L.; Shi, Z.; Wang, Y. A review of transportation system resilience research. Sci. Ind. 2020, 20, 47–52. [Google Scholar] [CrossRef]
- Pang, Z.; Xie, B. Connotation, characteristics and development strategy of urban green transportation—Thinking based on foreign practical experiences. Planner 2020, 36, 20–25, 37. [Google Scholar]
- Jiang, C.; He, J.; Zhu, S.; Zhang, W.; Li, G.; Xu, W. Injury-Based Surrogate Resilience Measure: Assessing the Post-Crash Traffic Resilience of the Urban Roadway Tunnels. Sustainability 2023, 15, 6615. [Google Scholar] [CrossRef]
- Wang, S.P. Research on Building Urban Green Transportation System. Master’s Thesis, Chang’an University, Xi’an, China, 2018. [Google Scholar]
- Guo, J.; Li, Z.K.; Zhang, H.Y.; Feng, Z.H. Evaluation of the Implementation Effect of Green Transportation Cities; People’s Transportation Publishing House: Beijing, China, 2020; pp. 2–27. [Google Scholar]
- Hu, Q.Z.; Deng, W. Optimization Model and Evaluation Method of Urban Conventional Public Transportation System; China Science Press: Beijing, China, 2009; pp. 105–122. [Google Scholar]
- Ministry of Transport of the People’s Republic of China. The Evaluation Indicator System for the Construction of a Transportation Powerful Country. 2022. Available online: https://www.gov.cn/zhengce/zhengceku/2022-03/18/content_5679638.htm (accessed on 3 April 2023).
- State Council of the People’s Republic of China. The Carbon Peak Action Program by 2030. 2021. Available online: https://www.gov.cn/zhengce/zhengceku/2021-10/26/content_5644984.htm (accessed on 3 April 2023).
- GB/T 51328–52018; Planning Standards for Urban Comprehensive Transportation System. China Construction Industry Press: Beijing, China, 2018.
- Hu, J.Q.; Xu, J.X.; Jiang, X.L. Research on evaluation index system of green cycle and low-carbon transportation. Highw. Veh. Transp. 2018, 20–22, 26. [Google Scholar]
- Liu, X. Research on Urban Low-Carbon Transportation Development Approach and Regulation Policies. Doctoral Dissertation, Tianjin University, Tianjin, China, 2016. Available online: https://kns.cnki.net/kcms2/article/abstract?v=l-44aStnccBfEmizAEfTHDDgtPxJHv6gC2wF0qm1qv84htI4ONDMq3I3U1Rmd07JsxFR5GgI3AHE8jB-qFk3e_c7nSJ2f16mngullFGq67MejZx64SIgcikQyAClhBNJ8hu9oLcKnJScrwxqQMWImA==&uniplatform=NZKPT&language=CHS (accessed on 10 July 2023).
- Ministry of Transport and National Development and Reform Commission of the People’s Republic of China. Green Travel Creation Action Program. 2022. Available online: https://www.gov.cn/zhengce/zhengceku/2020-07/26/content_5530095.htm (accessed on 3 April 2023).
- Guo, Y.J. Comprehensive Evaluation Theory, Methods and Applications; Science Press: Beijing, China, 2008. [Google Scholar]
- Xu, W.Y.; Dang, C.Y.; Liu, B.Y. Evaluation of public transportation system in Harbin city based on comprehensive integrated empowerment method. J. Dalian Jiaotong Univ. 2013, 34, 34–39. [Google Scholar] [CrossRef]
- Ye, Y.C.; Ke, L.H.; Huang, D.Y. Comprehensive Evaluation Technology of Systems; Metallurgical Industry Press: Beijing, China, 2006. [Google Scholar]
- Harbin City Bureau of Statistics. Harbin City Statistical Yearbook; China Statistics Press: Beijing, China, 2022. Available online: https://wap.harbin.gov.cn/haerbin/c104570/navlist.shtml (accessed on 20 July 2023).
- Gaode Maps. 2020 Annual Traffic Analysis Report of Major Cities in China; Gaode Maps: Beijing, China, 2021. [Google Scholar]
- Zhang, L.L.; Tong, Q.; Guo, Y.N.; Zhang, Y.J. Study on the effectiveness of urban low-carbon transportation under the construction of “double-carbon” target based on fuzzy evaluation perspective. Highw. Transp. Sci. Technol. 2023, 40, 256–263. [Google Scholar]
- Wang, Y.Y. Research on Countermeasures for Urban Green Transportation Development. Master’s Thesis, Chang’an University, Xi’an, China, 2015. [Google Scholar]
- Ye, J.H.; Zheng, J.Q. Shared mobility: A new driving force for reshaping sustainable transportation. J. Sustain. Econ. 2020, 9, 16–18. [Google Scholar]
- Cheng, S.; Wang, Q.; Su, J.Y.; Li, Y.M.; Sun, D.N.; Song, C.J. Harbin City transportation sustainable development model based on green transportation concepts. Transp. Energy Sav. Environ. Prot. 2018, 14, 56–58. [Google Scholar]

Disclaimer/Publisher’s Note: The statements, opinions and data contained in all publications are solely those of the individual author(s) and contributor(s) and not of MDPI and/or the editor(s). MDPI and/or the editor(s) disclaim responsibility for any injury to people or property resulting from any ideas, methods, instructions or products referred to in the content. |
© 2024 by the authors. Licensee MDPI, Basel, Switzerland. This article is an open access article distributed under the terms and conditions of the Creative Commons Attribution (CC BY) license (https://creativecommons.org/licenses/by/4.0/).