Article

Assessment of the Effect of Meteorological Conditions on the Concentration of Suspended PM2.5 Particulate Matter in Central Europe

by
Agnieszka Ziernicka-Wojtaszek
1,*,
Zbigniew Zuśka
1 and
Joanna Kopcińska
2
1
Department of Ecology, Climatology and Air Protection, Faculty of Environmental Engineering and Land Surveying, University of Agriculture in Kraków, St. Mickiewicza 24–28, 30-059 Kraków, Poland
2
Department of Applied Mathematics, Faculty of Environmental Engineering and Land Surveying, University of Agriculture in Kraków, St. Balicka 253 C, 30-198 Kraków, Poland
*
Author to whom correspondence should be addressed.
Sustainability 2024, 16(11), 4797; https://doi.org/10.3390/su16114797
Submission received: 4 April 2024 / Revised: 17 May 2024 / Accepted: 27 May 2024 / Published: 4 June 2024

Abstract

:
The purpose of this study was to use principal component analysis to determine the effect of meteorological elements on the concentration of PM2.5 particulate matter in Krakow, the capital of the Lesser Poland Voivodeship in southern Poland. Daily values for selected meteorological elements measured in spring, summer, autumn, and winter over a 10-year period, obtained from the Institute of Meteorology and Water Management—National Research Institute, were adopted as variables explaining PM2.5 concentrations. Data on particulate air pollution were obtained from the air monitoring station in Krakow. In spring, autumn, and winter, the first factor significantly influencing the PM2.5 concentration was the maximum, minimum, and average temperature. In summer, the average and maximum temperatures were significant. The second factor in spring was precipitation and wind speed, and the third was relative humidity. In summer, the second factor was atmospheric pressure, and the third was relative humidity. The second factor in autumn was atmospheric pressure and precipitation, and the third was relative humidity. In winter, the second factor was wind speed, and the third was precipitation and relative humidity. Throughout the study, the annual mean PM2.5 concentrations exceeded acceptable and target levels defined by the Regulation of the Minister of the Environment, and even further exceeded the level recommended by the WHO.

1. Introduction

Compared to Europe as a whole, Poland has exceptionally poor air quality, largely due to excessive concentrations of PM2.5 and PM10 particulate matter. Studies of PM2.5 particulate pollution in Europe show that the annual average PM2.5 concentrations in southern Poland are among the highest. The northern industrialized part of Italy also has a large number of stations recording concentrations exceeding levels recommended by the WHO [1,2]. The spatial distribution of emissions of pollutants in Poland is highly varied. The highest levels of pollution are noted in large metropolitan areas and major industrial districts [3]. The World Health Organization classified Krakow as the 11th most polluted city in the European Union in 2016 [4].
Analysis of the maximum annual average concentrations of PM2.5 particulate matter in six European cities, i.e., Brussels, Krakow, Milan, Ostrava, Sofia and Stuttgart, shows that the level recommended by the WHO was exceeded in each of them. The limit defined in Directive 2008/50/EC was not exceeded in 2016 only in Brussels, Sofia, and Stuttgart. The level was highest in Krakow, where almost no progress was observed in relation to 2009 [5].
Air protection programmes have been implemented in Krakow in recent years, and a decline in emissions of particulate matter from the most environmentally harmful industrial plants has been observed. Nevertheless, the concentration of particulate matter is still high and exceeds the limits defined in the regulation of the Minister of the Environment of 24 August 2012 [6,7,8].
The main sources of particulate matter in the air emitted due to human activity include the burning of fossil fuels—in the municipal, industrial, and transport sectors—and emissions from production processes and agriculture. Primary particulate matter emitted to the atmosphere can undergo chemical and physical changes [9,10].
Particulate matter under 2.5 μm in diameter (PM2.5) comes mainly from gaseous pollutants, such as sulfur and nitrogen oxides. When these oxides are emitted to the atmosphere, they undergo chemical transformations, changing from gas to liquid to form acidic aerosol, and subsequent transformations produce nitrates and sulfates [11,12]. Suspended particulate matter appearing in the atmosphere in this way is secondary pollution. Thus, the concentration of PM2.5 particulate matter is to some extent determined by air pollution in the form of gaseous pollutants, hydrocarbons, metal ions (including heavy metals), and nanoparticles [13]. Fine particulate matter is often a source of dangerous heavy metals, such as lead, cadmium, and mercury [14]. Xu et al. [15] reported that most particulate mercury (PHg) was concentrated in finer PM2.5 particles. Average mercury concentrations in PM2.5 in urban, rural, and remote locations throughout the sampling period were nearly equal in spring, autumn, and winter, but approximately twice as high as in summer.
Suspended PM has a significant impact on human health [10,16,17]. Its presence is an indicator of air quality, as stated in the Environmental Protection Act of 27 April 2001, which establishes acceptable concentrations of pollutants and thus an air quality standard. This standard can be the basis for estimating the health effects of air pollution.
People spending time in air polluted with PM2.5 particulate matter experience various pathological reactions depending on how long they are exposed to the pollution. Suspended particulate matter is a carcinogenic agent [18]. When it enters the respiratory tract it leads to the development of cancer, mainly of the larynx. Suspended particulate matter can also lead to the development of tumours in the lower respiratory tract (lungs) [19,20]. Moreover, it significantly affects the circulatory system [21,22].
PM2.5 levels exceeding WHO guidelines in the European Union caused about 400,000 premature deaths in 2011 and about 220,000 in 2020 [23]. According to the WHO [13], at an annual average PM2.5 concentration of 10 µg/m3, long-term exposure increases rates of cardiopulmonary and lung cancer, with more than 95% confidence. WHO guidelines from 2021 define the acceptable annual average PM2.5 concentration as 5 µg/m3 and the acceptable 24-h average as 15 µg/m3, which can be exceeded 3–4 days a year [24].
Air pollution levels are influenced not only by current emissions associated with the municipal and housing sector, transport, and industry, but also by meteorological conditions (air temperature, precipitation, and wind speed) and the type of atmospheric circulation [25,26,27,28,29,30]. Atmospheric circulation is one of the most important factors determining weather conditions, due to the temperature inversion occurring during anticyclonic circulation [31], when pollutant concentrations increase. This study focused on the concentrations of PM2.5 particulate matter in Krakow, the capital and largest city of the Lesser Poland Voivodeship. The aim of the study was to determine which meteorological elements influence the PM2.5 concentration in Krakow in the calendar seasons—spring, summer, autumn, and winter—and to what extent. The scope of this work fits within the subject of improving air quality, which is associated with sustainable development addressed in strategic documents. Among specific actions that can improve air quality, we can distinguish relevant legislation and cleaner production, i.e., the use of technologies that generate less pollution. In addition, it is important for people to act in accordance with environmental awareness, i.e., an understanding of the mechanisms of nature and the limits of its exploitation [24].

2. Materials and Methods

Air pollution was presented on the basis of daily average PM2.5 concentrations obtained from the measuring point of the air monitoring station on ul. Bujaka in Krakow (urban background station; Φ 50.010575, λ 19.949189, 223 m a.s.l.; Figure 1).
Data on PM2.5 concentrations were made available by the State Environmental Monitoring Service, which was established by the Environmental Protection Inspection Act of 20 July 1991 [32]. Measurements were made in accordance with EN 14907:2005 Ambient air quality—Standard gravimetric measurement method for the determination of the PM2.5 mass fraction of suspended particulate matter. According to Directive 2008/50/EC of the European Parliament and of the Council of 21 May 2008 on ambient air quality and cleaner air for Europe, for particulate matter and substances analysed in it (e.g., lead), the measurement volume refers to ambient temperature and atmospheric pressure on the day of measurement [33]. According to the Köppen classification, this area is within a cold climate zone (Dfb) with a warm summer and no dry season [34].
Daily average values for meteorological elements, i.e., average air temperature (T), maximum temperature (TM), minimum temperature (Tm), relative humidity (RH), precipitation totals (PP), atmospheric pressure at the level of the station (PKrakow), and wind speed (V), were obtained from the Institute of Meteorology and Water Management—National Research Institute. The research period covered spring (March–May), summer (June–August), autumn (September–November), and winter (December–February) in the decade from 2010 to 2019.
The dependence of the concentration of particulate matter on meteorological factors was analysed using principal component analysis (PCA) [35], a method derived from factor analysis. This method can be used to reduce the number of variables influencing concentrations of particulate matter and to determine new components (PCs), independent of one another, which to a large extent explain the variability in the PM2.5 concentration.
The variables adopted were Tm, TM, T, HR, V, PP, and PKrakow. These will be meteorological elements of the principal components (PCs), each designated PCx, where x is the number of the component.
Three PCs were chosen for the analysis, as their eigenvalues of the correlation matrix were greater than one (the Kaiser criterion). In each component, only the variables with the highest correlation (absolute value) were considered.
The calculations were made using Statistica 13.

3. Results and Discussion

3.1. PM2.5 Levels—Seasonal Variation

Based on the calendar of circulation types for southern Poland created by T. Niedźwiedź [36,37], the anticyclonic circulation type was determined to have occurred on 58.7% of days in winter, 45.4% in spring, 53.5% in summer, and 56.9% in autumn during the study period. Comparison of the average temperature in each season during the study period with the long-term average (1991–2020) for that season revealed that the temperature in the study period was higher than the long-term average: by 0.1°C in winter, by 0.3 °C in spring, and by 0.5 °C in summer and autumn.
Measurements of the concentration of PM2.5 particulate matter at the urban background station in Krakow on ul. Bujaka in the years 2010–2019 varied between 25 μg/m3 (annual average in 2019) and 41 μg/m3 (annual average in 2012) (Table 1). These values exceeded the acceptable and target levels defined in the Regulation of the Minister of the Environment of 2012. The causes of the excessive levels were emissions associated with vehicular traffic in the city centre, emissions from industrial plants, heating plants, and power plants, and emissions associated with private heating of buildings, the specific local conditions of the spread of pollutants, and unfavourable climatic conditions [38,39,40].
In each of the years analysed, the annual average PM2.5 concentrations exceeded the level of 10 µg/m3 recommended by the WHO [13], and even more so the level of 5 µg/m3 recommended by the WHO [24].
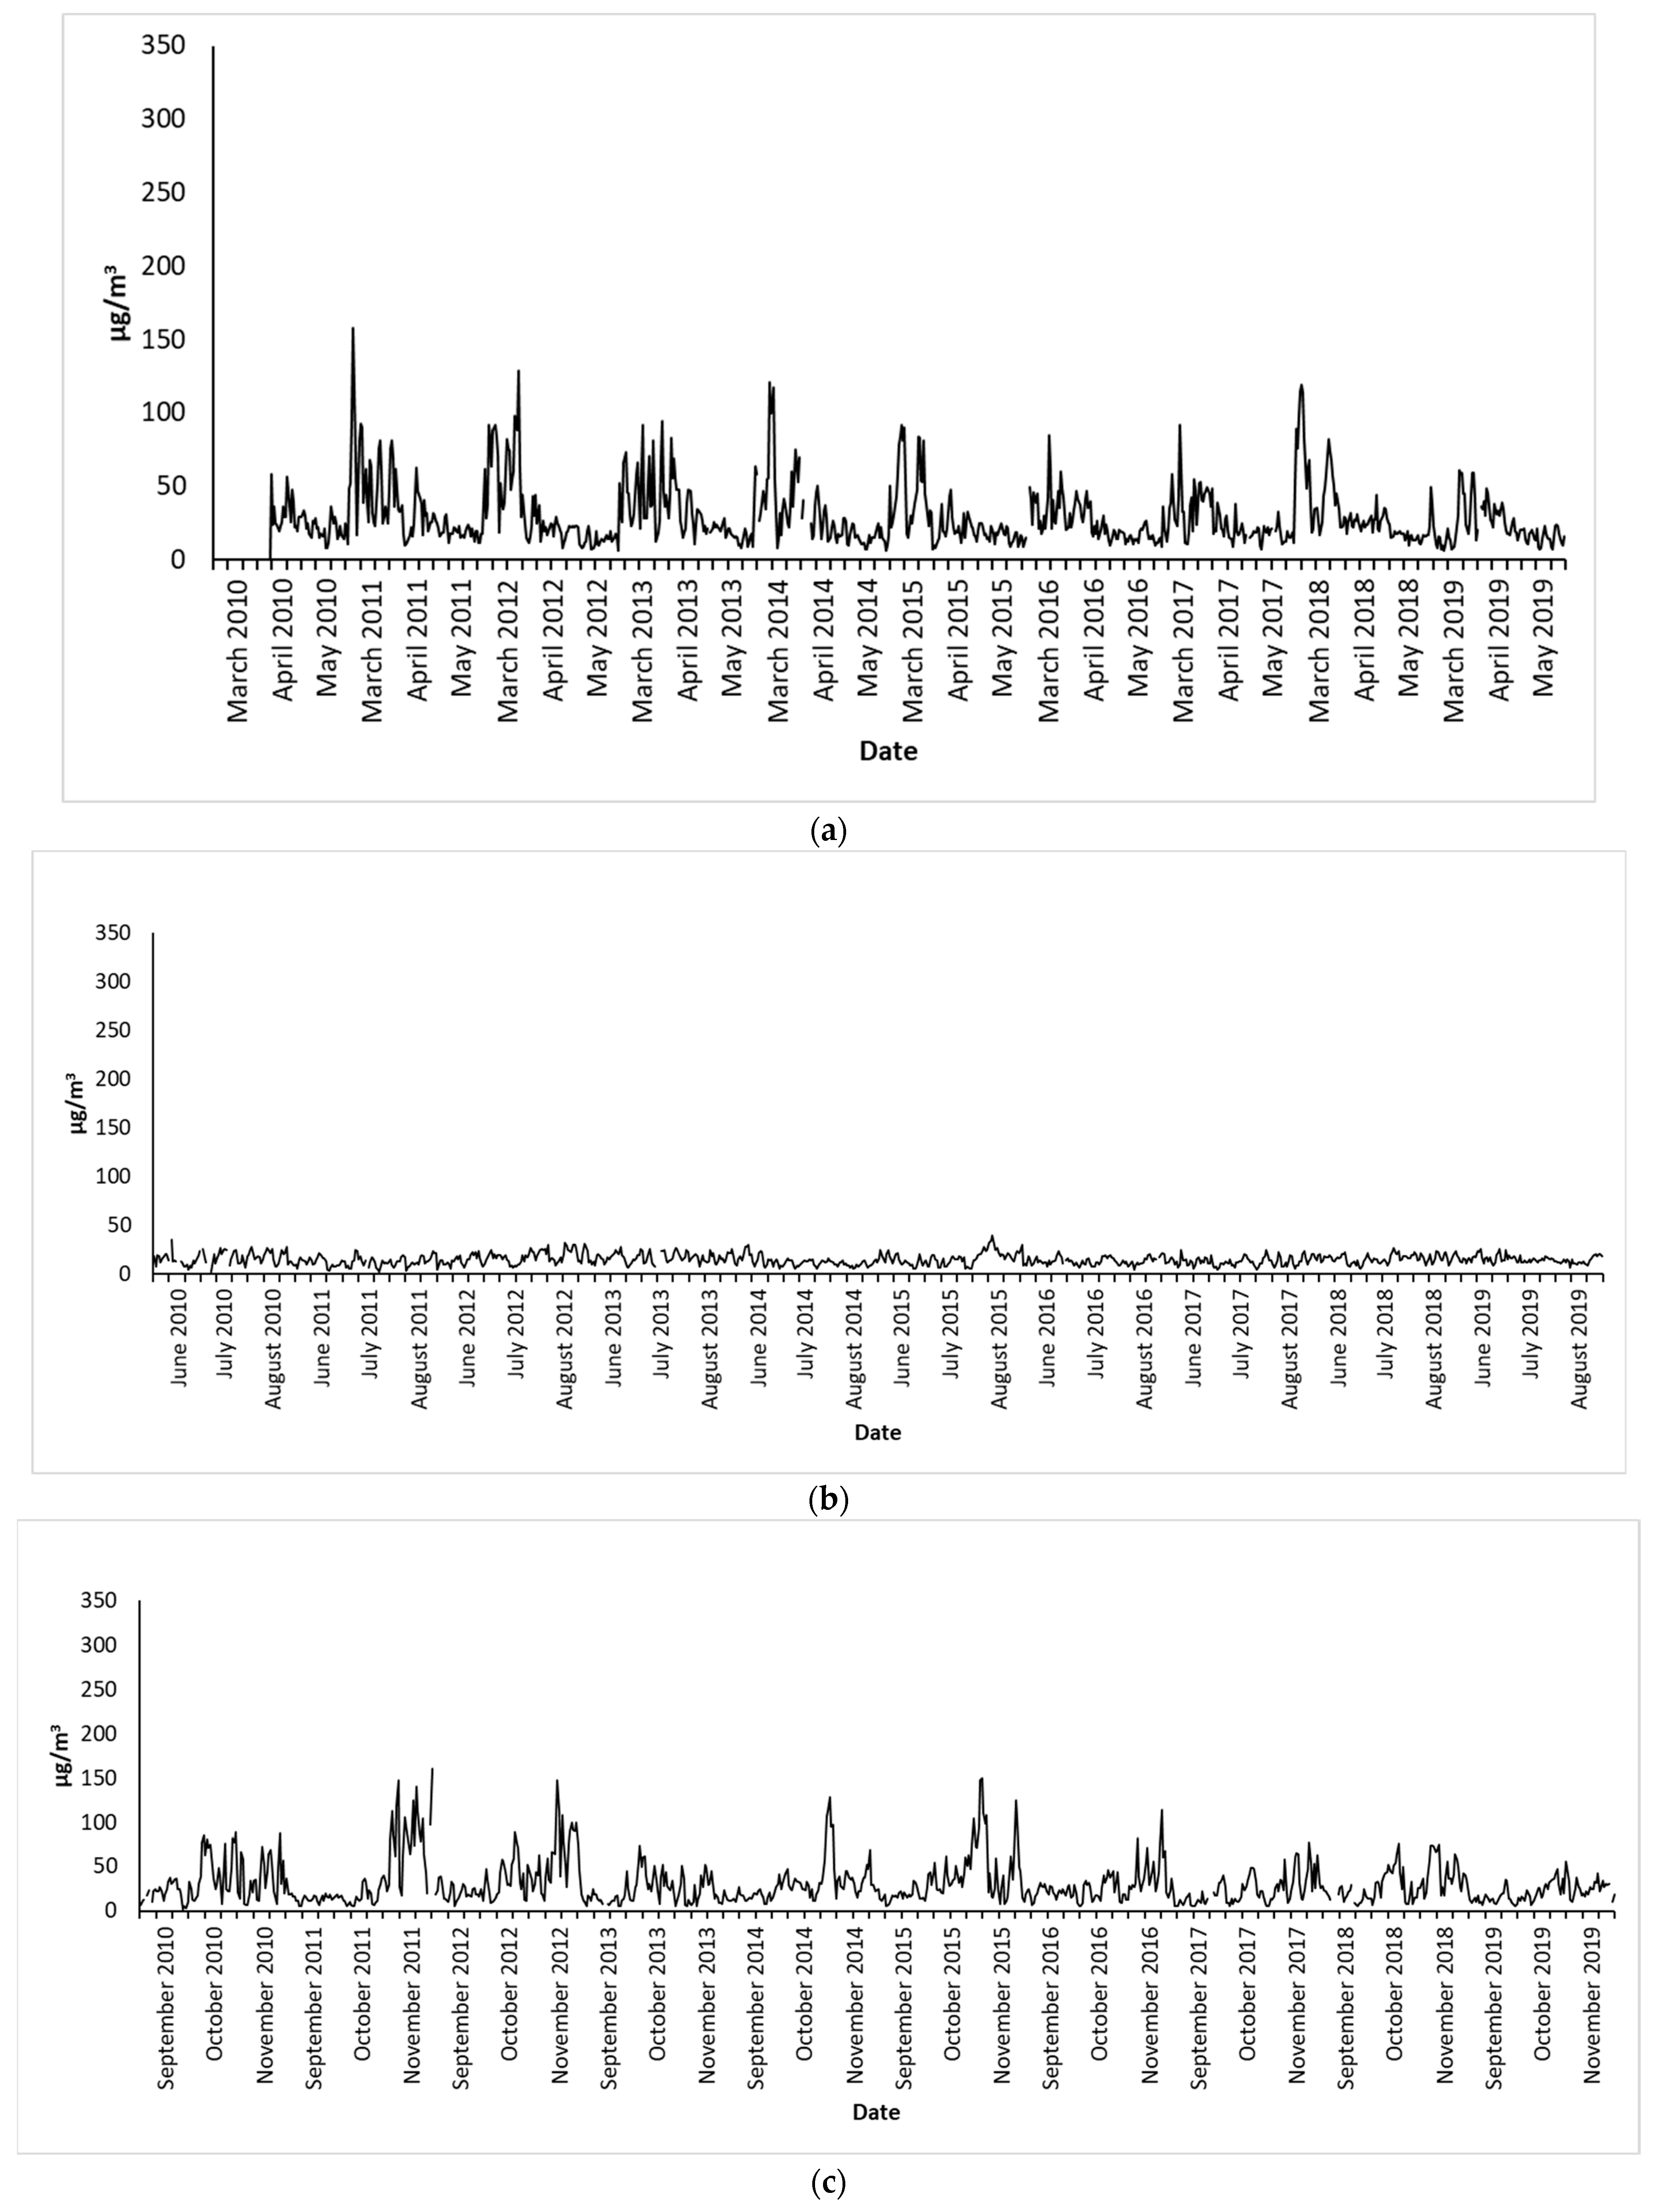
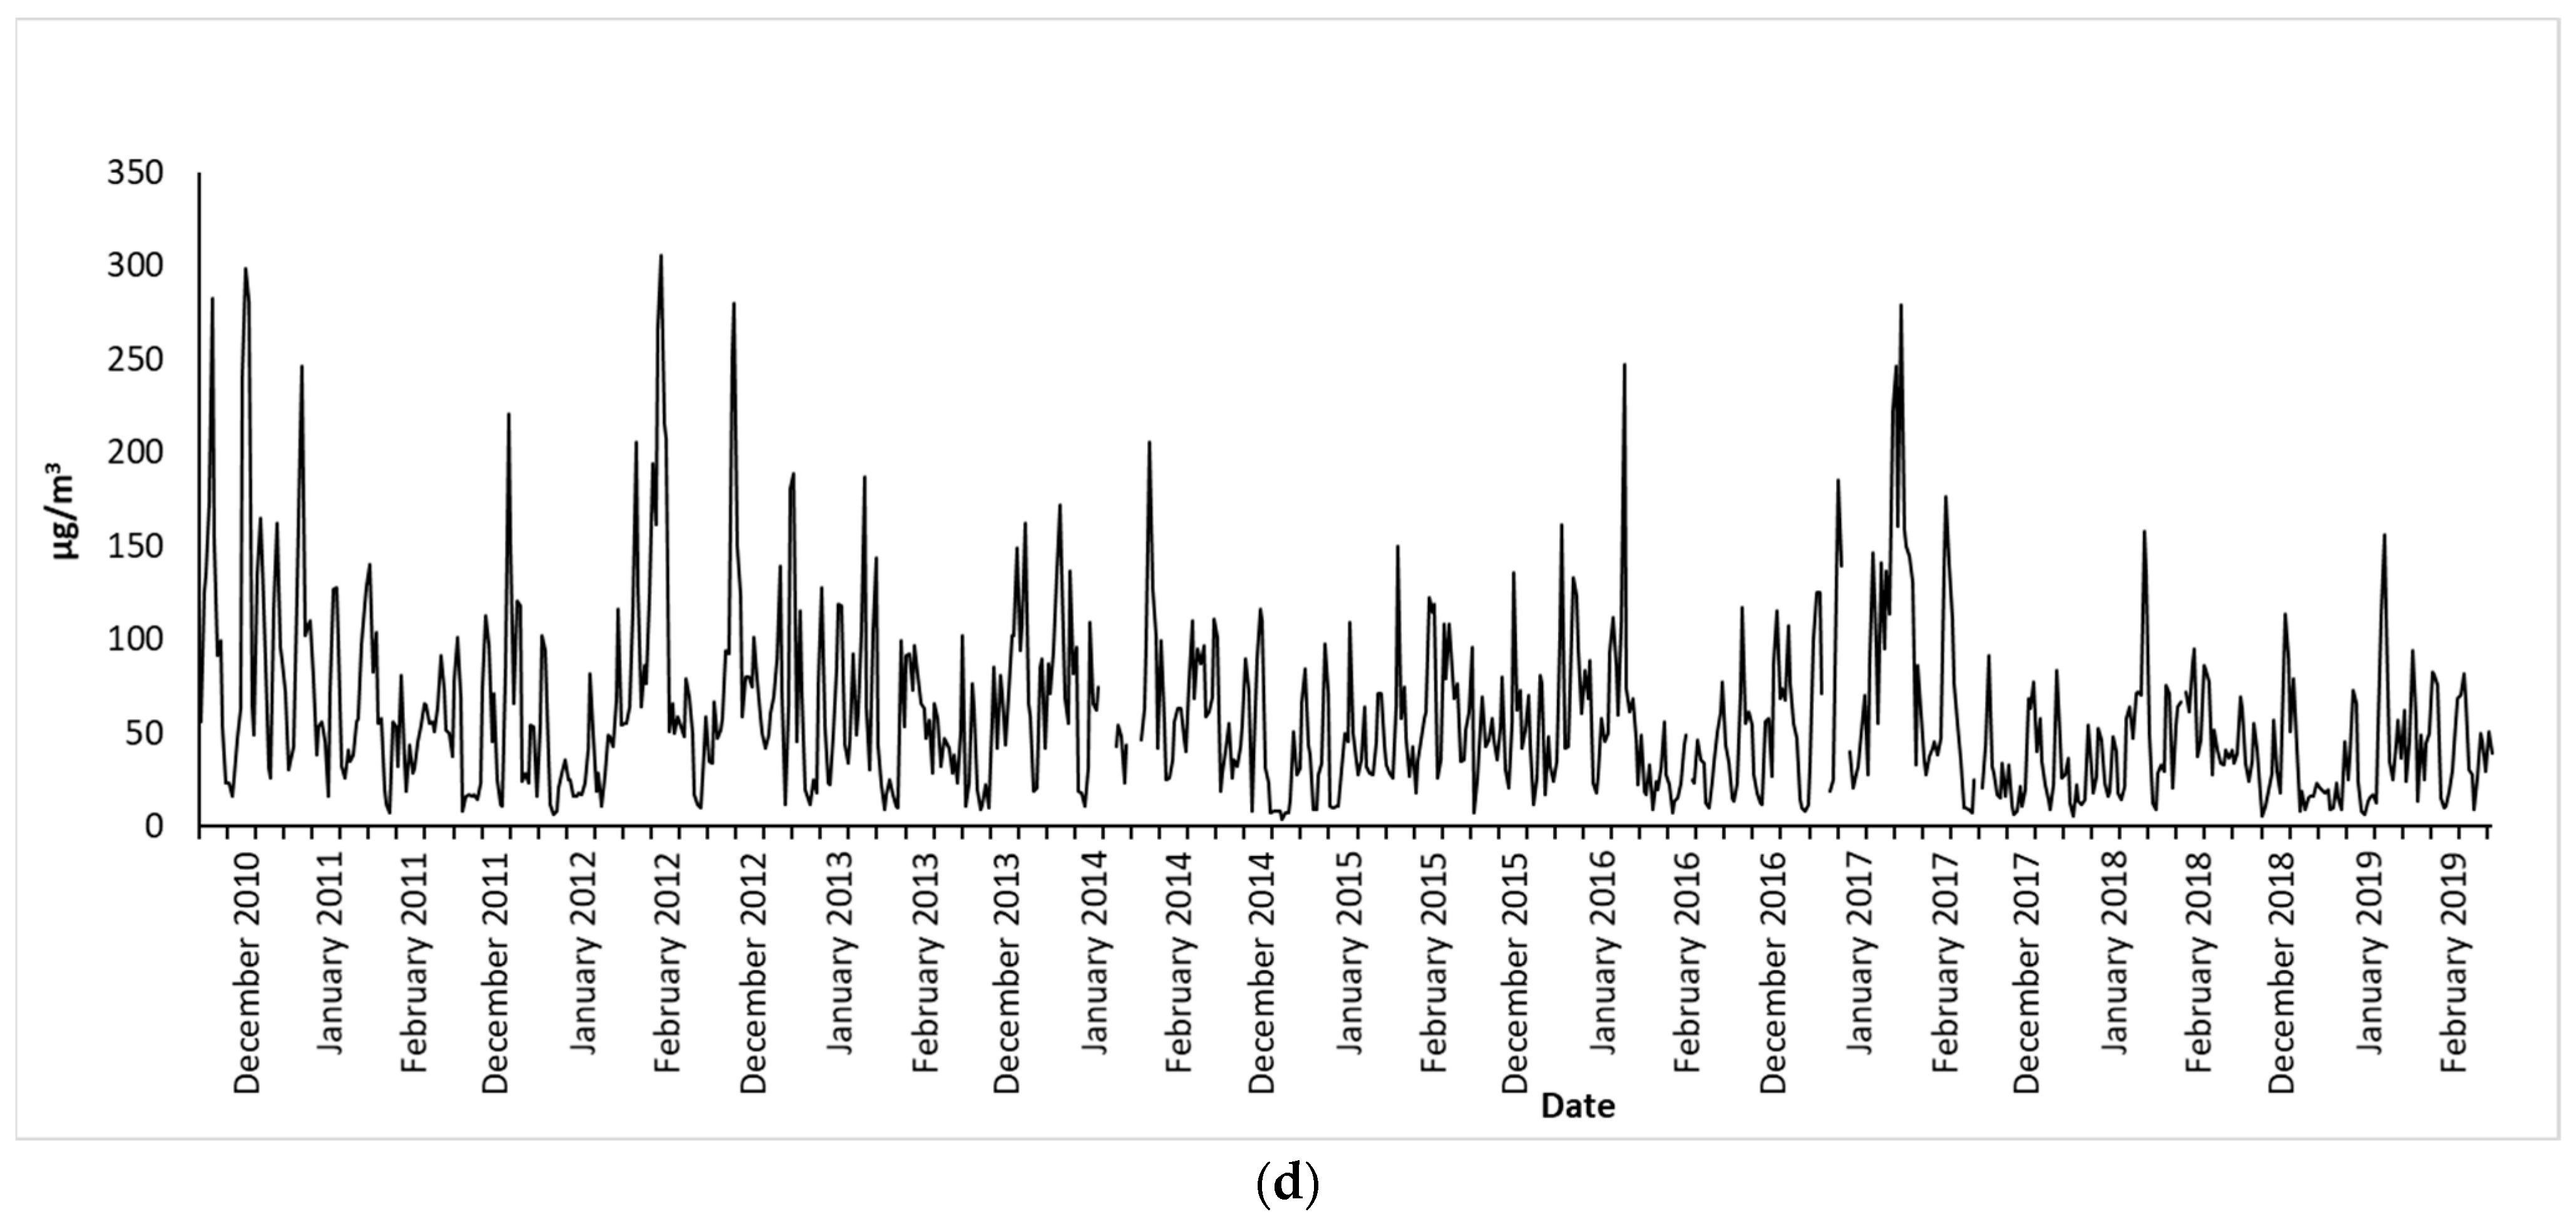
The highest concentrations were noted in the winters, when the 24-h concentrations ranged from 4 to 306 µg/m3. The 24-h concentration of PM2.5 recommended by the WHO in 2005, amounting to 25 µg/m3, was exceeded on average on 22 days in each winter month, while the level recommended by the WHO in 2021 (15 µg/m3) was exceeded on 26 days. In the spring periods, the 24-h concentrations ranged from 6 to 158 µg/m3. The 24-h concentration of PM2.5 recommended by the WHO in 2005 was exceeded on average on 12 days in each spring month, while the level recommended by the WHO in 2021 was exceeded on 24 days. In summer, the 24-h concentrations ranged from 3 to 40 µg/m3. The 24-h concentration of PM2.5 recommended by the WHO in 2005 was exceeded on average on one day in each summer month, while the level recommended by the WHO in 2021 was exceeded on 12 days. In autumn, the 24-h concentrations ranged from 2 to 161 µg/m3 (Figure 2). The 24-h concentration of PM2.5 recommended by the WHO in 2005 was exceeded on average on 13 days in each autumn month, while the level recommended by the WHO in 2021 was exceeded on 21 days (Figure 2). It is often the case that the highest concentrations of PM2.5 are noted during winter months. This is due to a combination of factors related to weather conditions and human activity [41].

3.2. PCA Analysis

The correlation matrix between factors (Table 2) clearly shows that the variables (meteorological elements) were interdependent. This was the reason for choosing PCA analysis, which can be used to determine linearly independent principal components as combinations of meteorological elements.
The correlation matrix eigenvalues indicated that three PCs were sufficient to explain the variability in the concentration of particulate matter in spring, as they explained 79.01% of the variability. Three principal components were also sufficient in summer (77.70% of the variability), autumn (80.13%) and winter (78.66%) (Table 3).
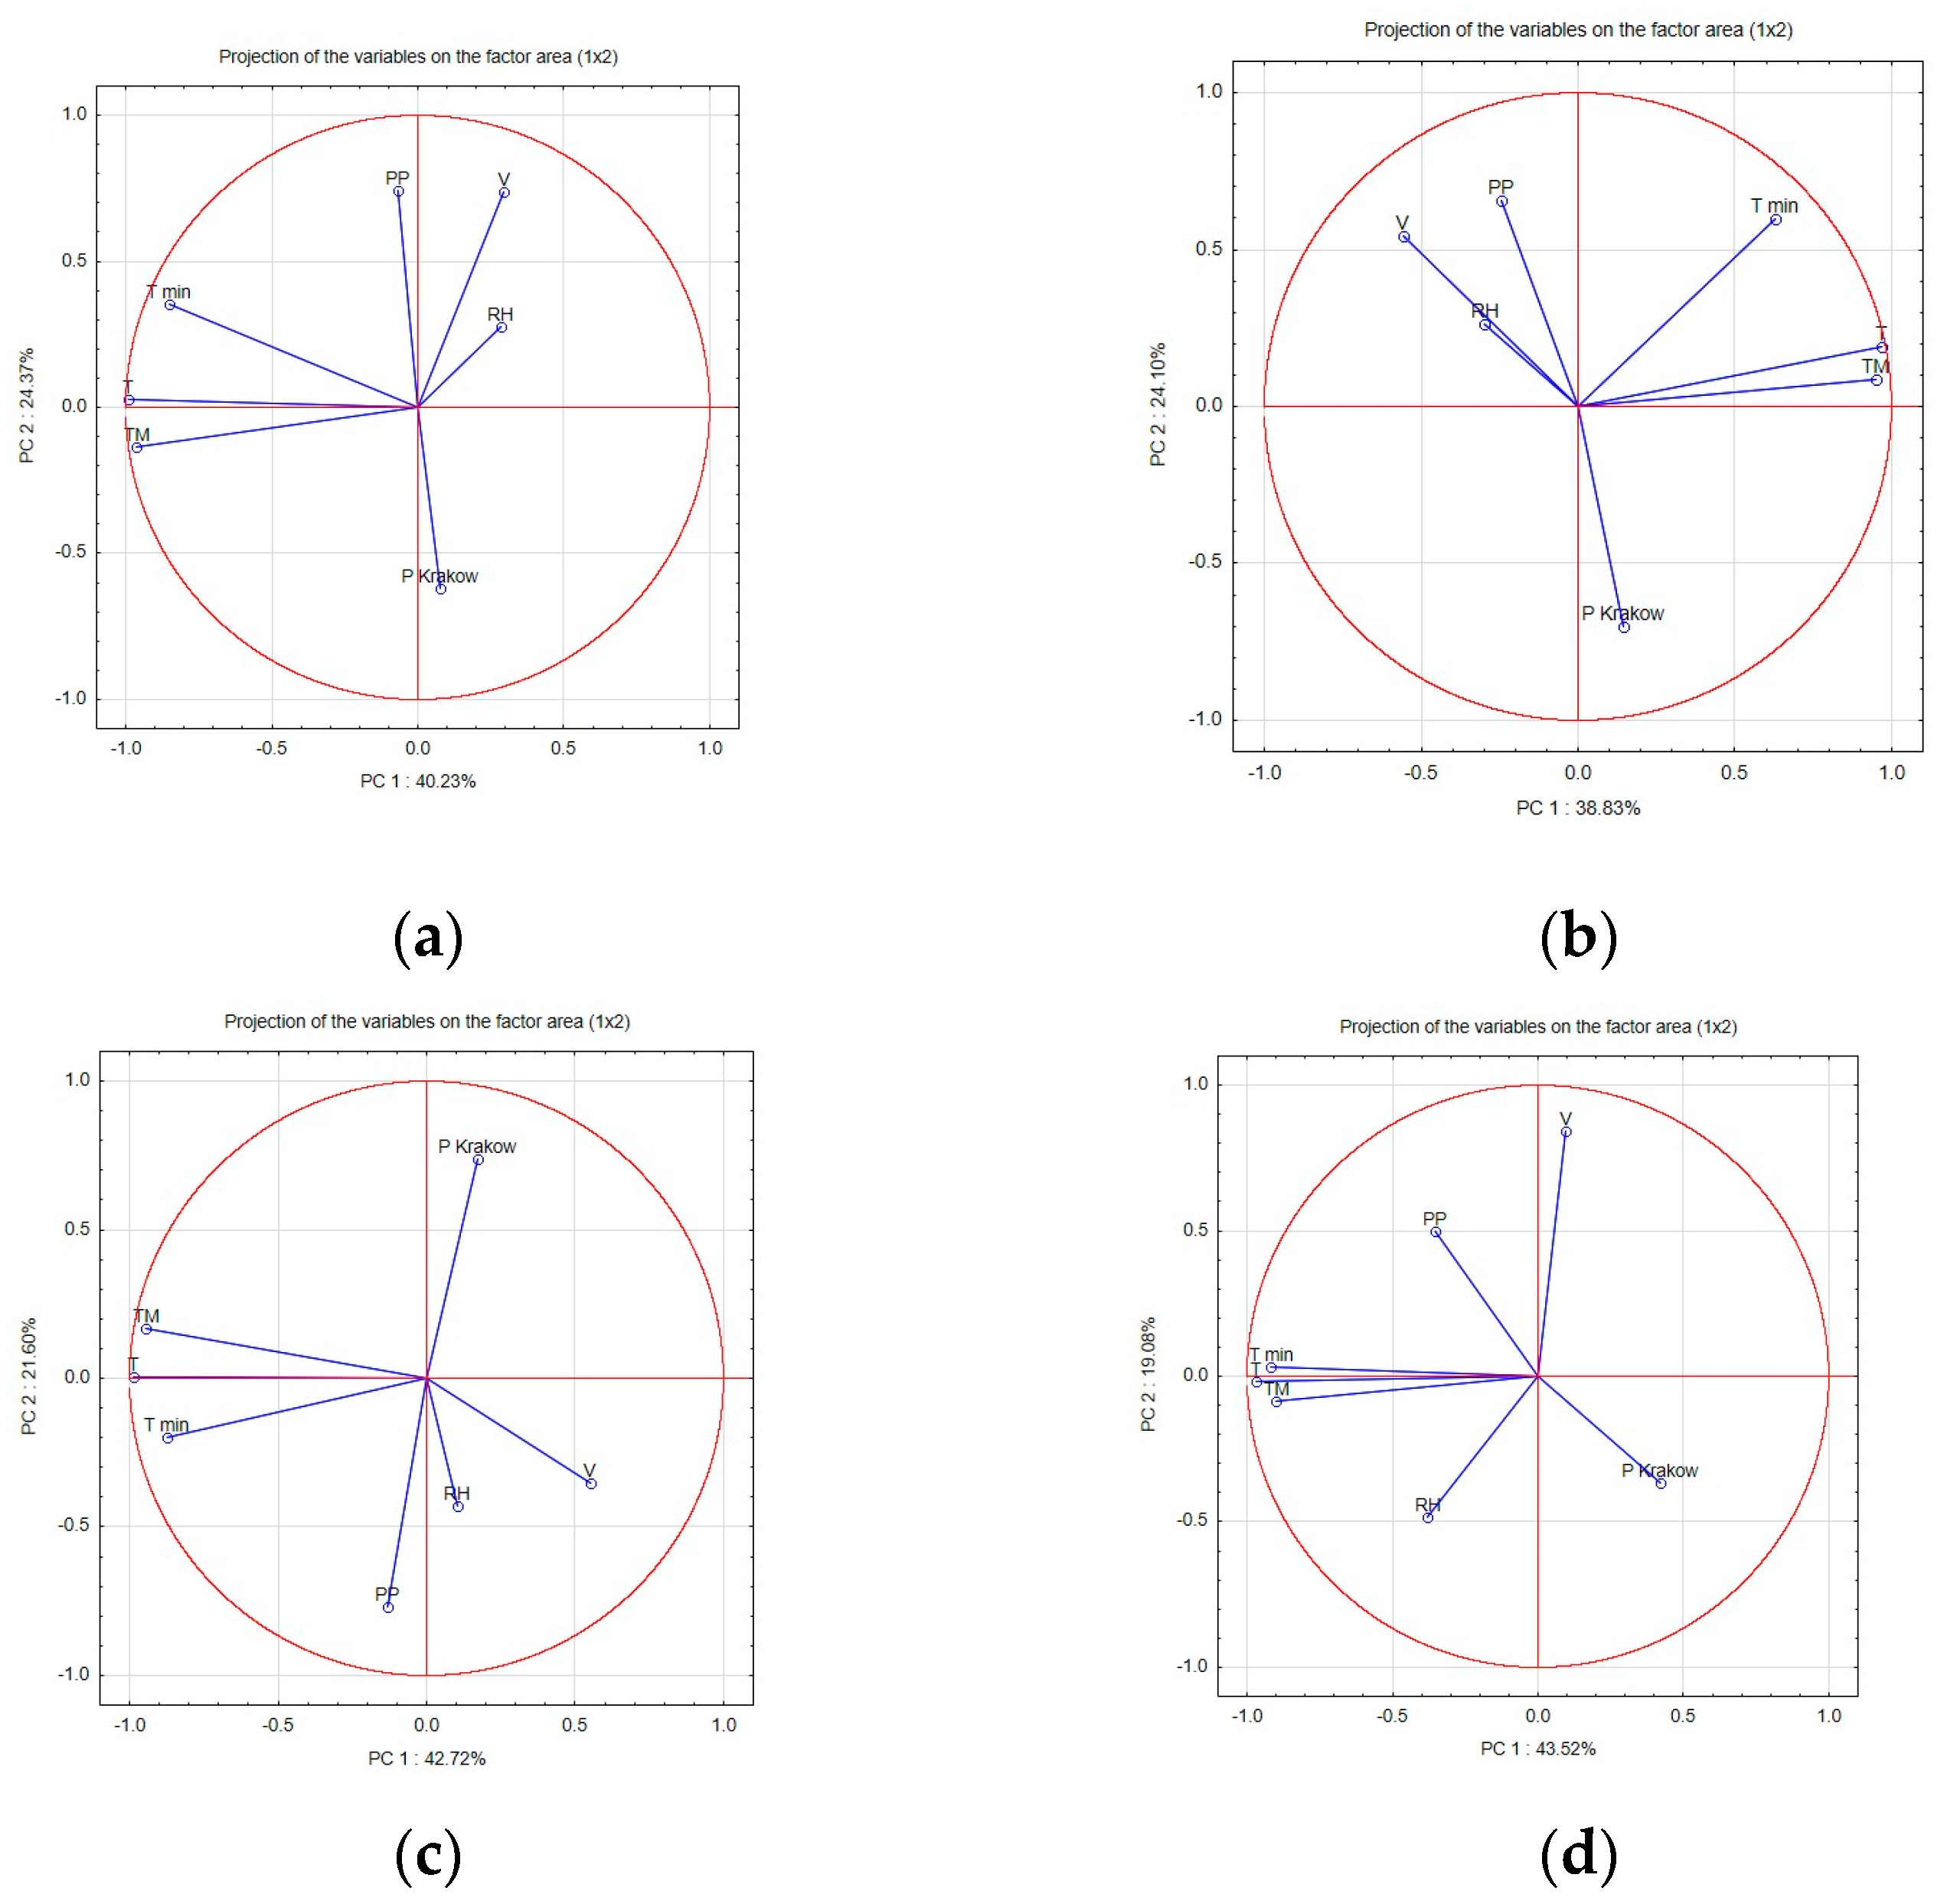
Analysis of the eigenvalues (Table 3) of variables in individual seasons reveals differences between them. In spring, factor 1 (spring-PC1), which is a linear combination of the average (T), maximum (TM), and minimum (Tm) temperature, had the greatest effect on the concentration of particulate matter and explains 40.23% of the variability in the concentration of particulate matter. The second factor (spring-PC2), precipitation (PP) and wind speed (V), explains 24.37% of the variability in the concentration of particulate matter. The third factor (spring-PC3) was relative humidity (RH), which explains 14.41% of the variability. In addition, analysis of the correlation coefficients of the principal components shows that the concentration of particulate matter depends significantly on the linear combination of all three temperature values (Table 4). The lower the temperature, the higher the concentration of particulate matter. The concentration of particulate matter was less affected by precipitation (PP), atmospheric pressure (PKrakow), and wind speed (V). As atmospheric pressure and wind speed increased, the concentration of particulate matter increased. This may have been due to an influx of pollutants from communes adjacent to Krakow [42,43]. Relative humidity (RH) had a similar but much smaller influence (Table 4).
In summer, the average (T) and maximum temperature (TM) were most important, together explaining 38.83% of the variability in the concentration of particulate matter (summer-PC1). The second factor (summer-PC2) was atmospheric pressure (PKrakow), explaining 24.10% of the variability in the concentration of particulate matter, and the third factor (summer-PC3) was humidity (RH), explaining 14.78% of the variability (Table 3 and Table 4). In summer, we see that higher temperature (maximum and average), to a lesser extent a decrease in atmospheric pressure (PKrakow), and to a much lesser extent an increase in relative humidity cause an increase in PM2.5 pollution (Table 4). A similar relationship was observed by Juda-Rezler and Toczko [44]. In their study, the concentration of particulate matter in summer increased with the air temperature and decreased when the temperature decreased. The correlation coefficient was also positive in the warm months from April to September. Research by Rozbicka and Michalak [45] carried out in Warsaw also indicates a relationship between meteorological conditions and the concentration of air pollution. The authors report that the concentration of suspended particulate matter in summer increases mainly due to an accumulation of pollutants from transport sources. Gliniak et al. [46] showed that car traffic is 20% responsible for the PM2.5 concentrations in Krakow, due to the abrasion of vehicle tires and road material. Borowiak et al. [47] found that air pollution levels are characterized by seasonality, both daily and yearly. This is linked to increased emissions from different sources at different times of year.
In autumn, the greatest effect was exerted by the average (T), maximum (TM), and minimum (Tm) temperature, which together explain 42.72% of the variability in the concentration of particulate matter (autumn-PC1). The second factor (autumn-PC2), which includes atmospheric pressure (PKrakow) and precipitation (PP), explains 21.60% of the variability, while the third factor (autumn-PC3), consisting of humidity (RH), explains only 15.81% of the variability in the system (Table 3 and Table 4). During this period, we also observe an increase in the PM concentration depending on a decrease in temperature, to a lesser extent on a decrease in precipitation (PP) and an increase in atmospheric pressure (PKrakow), and to the least extent on higher relative humidity (Table 4).
In winter, the particulate matter concentration is influenced by three factors, which determine 80% of the PM2.5 concentration. The first factor (winter-PC1) is a linear combination of air temperatures (TM, Tm, and T)—43.52%; the second factor (winter-PC2) is mainly wind speed (V)—19.08%; and the third factor (winter-PC3) is precipitation (PP) and relative humidity (RH)—16.07% (Table 3 and Table 4). In winter, the increase in the concentration of particulate matter was most influenced by the decline in temperature (TM, Tm, and T), to a lesser extent by increased wind speed (V), and least by declines in precipitation (PP) and relative humidity (RH) (Table 4). During autumn and winter, the main sources of pollution are emissions from the combustion of solid fuels (coal and wood) and waste in household heating systems and pollution from transportation and industry [48,49,50]. This resulted in a resolution of the Lesser Poland Voivodeship Assembly (Resolution No. XVIII/243/16 of the Sejmik of the Lesser Poland Voivodeship of 15 January 2016 on the introduction of restrictions on the operation of installations in which fuels are burned in the Municipality of Krakow) prohibiting the burning of solid fuels, wood, and heavy oil in household furnaces, beginning in September 2019. The resolution forced the elimination of previously used furnaces. This piece of legislation should prompt air quality researchers to test PM2.5 air pollution after 2019.
In winter, the first factor (winter-PC1), which was a linear combination of temperatures (TM, Tm, and T), can be reduced to only one of these temperatures. All temperature data provide the same information, and their vectors overlap. In summer, similar information is provided by the average (T) and maximum (TM) temperatures. Therefore, further analysis of the summer period can take into account the average (T), maximum (TM), or minimum (Tm) temperature.
Figure 3 presents the relationships between the variables and the PCs for seasons. A positive or negative correlation is indicated by an acute or obtuse angle, respectively, between vectors; a lack of dependency is represented by a right angle between vectors.
Similar relationships were reported by Zuśka et al. [51], who used PCA for concentrations of PM10 particulate matter in Nowy Sącz. In that case, it was also possible to reduce the number of meteorological variables to determine concentrations of particulate matter. In the present study, the first factor in winter for PM25 (winter-PC1, PM2.5) was the combination of the air temperatures, whereas in the case of PM10 in the study cited, the first principle component included not only the combination of air temperatures, but the wind speed as well (winter-PC1, PM10; Table 5). The second factor in the case of PM10 was the combination of humidity and atmospheric pressure, while the second factor for the concentration of PM2.5 (winter-PC2, PM2.5) was mainly wind speed (V). The components of the third factor differ as well. The PM2.5 concentration was influenced by precipitation (PP) and relative humidity (RH), while in the case of the concentration of PM10, there was no significant meteorological factor in the third component (winter-PC3, PM10). The differences observed may be explained by the geographic location of the two cities.
The location of the city of Krakow in the Vistula River valley determines certain features of its natural climate, including the formation of cold air pools, frequent temperature inversions, and increased frequency of freezing temperatures, calm or light wind, and fog. These circumstances favour the accumulation of pollutants near the ground and the formation of smog, causing values to exceed the acceptable and target levels [31,43,52,53,54,55,56,57,58]. This explains the substantial differences in the PM2.5 concentrations between calendar seasons (spring, summer, autumn, and winter). Understanding seasonal variation is important for managing air quality and implementing measures to reduce pollutant emissions, especially in regions prone to poor air quality in specific seasons [59].
Meteorological conditions have a significant impact on air pollution, but systematic and detailed studies on the effects of meteorological conditions on pollutant concentrations are rare. Studies most often compare average PM concentrations between the heating season and the period outside the heating season. During these periods, meteorological conditions such as wind speed, wind direction, temperature, and temperature inversion differ. However, the use of wood or coal to heat rooms in many areas and the much higher pollution associated with transport in winter are also important factors. Similar results were obtained by [60,61,62,63,64] (Table 6). Meteorological conditions are undoubtedly an important factor affecting PM concentrations, but their complexity remains a subject of research.

4. Conclusions

The use of principal component analysis (PCA) to study the effect of selected meteorological elements on the concentration of suspended PM2.5 particulate matter showed which of them have a decisive influence (are statistically significant). Three principal components are sufficient to explain the variability in the PM2.5 concentration in each season of the year. In most seasons, the dominant factor was the maximum, minimum, and average temperature (PC1), but in summer, it was only the maximum and average temperature. The second factor was precipitation and wind speed in spring, atmospheric pressure in summer, atmospheric pressure and precipitation in autumn, and wind speed in winter. The third component consisted mainly of relative humidity in spring, summer, and autumn, and precipitation and humidity in winter. These analyses show that the variability in the PM2.5 concentration can be determined. No regression equation of the expected PM2.5 concentration was presented; however, we can observe that in winter (when the concentration of PM2.5 is the highest), the temperature can explain 44% of the variability in the level of PM2.5 concentration, the wind speed can explain about 19%, and precipitation and humidity only 16%. Knowledge of which meteorological elements strongly affect PM2.5 levels, obtained using the PCA method, can be used in warnings to the public regarding the dangerous effects of particulate matter on human health. This study should be repeated in a few years to track the changes in the values of the characteristics studied and diagnose progress in sustainable development in the study area.

Author Contributions

Conceptualization: A.Z.-W., Z.Z. and J.K.; methodology: A.Z.-W., Z.Z. and J.K.; software: A.Z.-W. and Z.Z.; validation: A.Z.-W., Z.Z. and J.K.; formal analysis: A.Z.-W., Z.Z. and J.K.; investigation: A.Z.-W. and Z.Z.; resources: A.Z.-W. and Z.Z.; data curation: A.Z.-W., Z.Z. and J.K.; writing—original draft preparation: A.Z.-W., Z.Z. and J.K.; writing—review and editing: A.Z.-W.; visualization: A.Z.-W., Z.Z. and J.K.; supervision: A.Z.-W., Z.Z. and J.K.; project administration: A.Z.-W. All authors have read and agreed to the published version of the manuscript.

Funding

This study was conducted with a subsidy from the Ministry of Science and Higher Education in Poland for University of Agriculture in Krakow in 2023.

Institutional Review Board Statement

Not applicable.

Informed Consent Statement

Not applicable.

Data Availability Statement

Data available on request from the authors.

Conflicts of Interest

The authors declare no conflicts of interest. The funders had no role in the design of this study; in the collection, analyses, or interpretation of data; in the writing of the manuscript; or in the decision to publish the results.

References

  1. Air Quality in Europe—2015 Report. Available online: https://www.eea.europa.eu/publications/air-quality-in-europe-2015 (accessed on 21 May 2023).
  2. Air Quality in Europe—2017 Report. Available online: https://www.eea.europa.eu/publications/air-quality-in-europe-2017 (accessed on 21 May 2023).
  3. Zgłobicki, W.; Baran-Zgłobicka, B. Air pollution in major Polish cities in the period 2005–2021: Intensity, effects and attempts to reduce it. Environ. Res. 2024, 240, 117497. [Google Scholar] [CrossRef] [PubMed]
  4. Air Quality in Europe—2018 Report. Available online: https://www.eea.europa.eu//publications/air-quality-in-europe-2018 (accessed on 12 June 2023).
  5. Sprawozdanie Specjalne nr 23 z 2018 Roku pod Tytułem “Zanieczyszczenie Powietrza—Nasze Zdrowie Nadal nie jest Wystarczająco Chronione”, No. 23, Paragraph 29. Available online: https://op.europa.eu/webpub/eca/special-reports/air-quality-23-2018/pl/#chapter3 (accessed on 21 June 2023).
  6. Journal Laws of 2012, Item 1031. Available online: https://eli.gov.pl/eli/DU/2012/1031/ogl/pol (accessed on 31 May 2023).
  7. Roczna Ocena Jakości Powietrza w Województwie Małopolskim, Raport Wojewódzki za Rok 2018, GIOŚ, Departament Monitoringu Środowiska, Regionalny Wydział Monitoringu Środowiska w Krakowie, Kraków 2019 r (Annual Assessment of Air Quality in the Lesser Poland Voivodeship, 2019). Available online: https://powietrze.gios.gov.pl/pjp/publications/card/14060 (accessed on 11 April 2023).
  8. Traczyk, P.; Gruszecka-Kosowska, A. The Condition of Air Pollution in Kraków, Poland, in 2005–2020, with Health Risk Assessment. Int. J. Environ. Res. Public Health 2020, 17, 6063. [Google Scholar] [CrossRef] [PubMed]
  9. European Environment Agency. Particulate Matter from Natural Sources and Related Reporting under the EU Air Quality Directive in 2008 and 2009; European Environment Agency: Copenhagen, Denmark, 2012. Available online: https://data.europa.eu/doi/10.2800/55574 (accessed on 21 May 2023).
  10. Household Air Pollution. Available online: https://www.who.int/news-room/fact-sheets/detail/household-air-pollution-and-health?gclid=EAIaIQobChMIhsKpvLTAgAMVRgqiAx0LWgPbEAAYASAAEgI6PPD_BwE (accessed on 12 June 2023).
  11. Karagulian, F.; Belis, C.A.; Dora, C.F.C.; Prüss-Ustün, A.M.; Bonjour, S.; Adair-Rohani, H.; Amann, M. Contributions to cities’ ambient particulate matter (PM): A systematic review of local source contributions at global level. Atmos. Environ. 2015, 120, 475–483. [Google Scholar] [CrossRef]
  12. Krzeszowiak, J.; Pawlas, K. Particulate matter (PM2.5 and PM10), properties and epidemiological significance for respiratory and cardiovascular diseases. A review of the literature on the effects of short- and long-term exposure. Med. Srod. 2018, 21, 7–13. [Google Scholar] [CrossRef]
  13. WHO Air Quality Guidelines for Particulate Matter, Ozone, Nitrogen Dioxide and Sulfur Dioxide: Global Update 2005: Summary of Risk Assessment. Available online: https://apps.who.int/iris/handle/10665/69477 (accessed on 11 April 2023).
  14. Mačejná, L.; Zacharová, A.; Ollerová, H.; Škvareninová, J.; Škvarenina, J. Hydrobiochemical balance of total mercury in a forest catchment area at former cinnabar mining locality. J. Hydrol. Hydromech. 2021, 69, 209–219. [Google Scholar] [CrossRef]
  15. Xu, L.; Chen, J.; Niu, Z.; Yin, L.; Chen, Y. Characterization of mercury in atmospheric particulate matter in the southeast coastal cities of China. Atmos. Pollut. Res. 2013, 4, 454–461. [Google Scholar] [CrossRef]
  16. Kim, K.-H.; Kabir, E.; Kabir, S. A review on the human health impact of airborne particulate matter. Environ. Int. 2015, 74, 136–143. [Google Scholar] [CrossRef] [PubMed]
  17. Khomenko, S.; Cirach, M.; Pereira-Barboza, E.; Mueller, N.; Barrera-Gómez, J.; Rojas-Rueda, D.; de Hoogh, K.; Hoek, G.; Nieuwenhuijsen, M. Premature mortality due to air pollution in European cities: A health impact assessment. Lancet Planet. Health 2021, 5, e121–e134. [Google Scholar] [CrossRef]
  18. IARC: Outdoor Air Pollution a Leading Environmental Cause of Cancer Deaths. Available online: https://www.iarc.who.int/wp-content/uploads/2018/07/pr221_E.pdf (accessed on 11 May 2023).
  19. Rajagopalan, S.; Al-Kindi, S.G.; Brook, R.D. Air Pollution and Cardiovascular Disease. J. Am. Coll. Cardiol. 2018, 72, 2054–2070. [Google Scholar] [CrossRef]
  20. Ebrahimi, H.; Aryan, Z.; Moghaddam, S.S.; Bisignano, C.; Rezaei, S.; Pishgar, F.; Force, L.M.; Abolhassani, H.; Abu-Gharbieh, E.; Advani, S.M.; et al. Global, regional, and national burden of respiratory tract cancers and associated risk factors from 1990 to 2019 a systematic analysis for the Global Burden of Disease Study 2019. Lancet Respir. Med. 2021, 9, 1030–1049. [Google Scholar] [CrossRef]
  21. Zanobetti, A.; Schwartz, J. Air pollution and emergency admissions in Boston, MA. J. Epidemiol. Community Health 2006, 60, 890–895. [Google Scholar] [CrossRef] [PubMed]
  22. Belleudi, V.; Faustini, A.; Stafoggia, M.; Cattani, G.; Marconi, A.; Perucci, C.A.; Forastiere, F. Impact of Fine and Ultrafine Particles on Emergency Hospital Admissions for Cardiac and Respiratory Diseases. Epidemiology 2010, 21, 414–423. [Google Scholar] [CrossRef]
  23. Health Impacts of Air Pollution in Europe. 2022. Available online: https://www.eea.europa.eu/publications/air-quality-in-europe-2022/health-impacts-of-air-pollution (accessed on 21 May 2023).
  24. WHO Global Air Quality Guidelines. Particulate Matter (PM2.5 and PM10), Ozone, Nitrogen Dioxide, Sulfur Dioxide and Carbon Monoxide. Available online: https://iris.who.int/bitstream/handle/10665/345329/9789240034228-eng.pdf?sequence=1 (accessed on 12 June 2023).
  25. Kozak, J. Wpływ Wybranych Elementów Meteorologicznych na Stężenia Pyłu Zawieszonego w Bielsku-Białej. Ph.D. Thesis, University of Agriculture in Kraków, Kraków, Poland, 2007. [Google Scholar]
  26. Czarnecka, M.; Nidzgorska-Lencewicz, J. Warunki Meteorologiczne kształtujące jakość Powietrza w styczniu i w lipcu 2006 roku w Szczecinie. Acta Agrophys. 2008, 12, 55–72. [Google Scholar]
  27. Majewski, G.; Przewoźniczuk, W.; Kleniewska, M.; Rozbicka, K. Analiza zmienności wybranych zanieczyszczeń powietrza w zależności od opadów atmosferycznych w rejonie Ursynowa. Acta Agrophys. 2009, 13, 419–434. [Google Scholar]
  28. Knozová, G. Zanieczyszczenie pyłem zawieszonym na Morawach Południowych przy różnych typach cyrkulacji. In Rola Cyrkulacji Atmosfery w Kształtowaniu Klimatu, 1st ed.; Bielec-Bąkowska, Z., Łupikasza, E., Widawski, A., Eds.; Kat Klima, Wydział Nauk o Ziemi Uniwersytetu Śląskiego: Sosnowiec, Poland, 2012; pp. 287–297. [Google Scholar]
  29. Liu, Y.; Zhou, Y.; Lu, J. Exploring the relationship between air pollution and meteorological conditions in China under environmental governance. Sci. Rep. 2020, 10, 14518. [Google Scholar] [CrossRef] [PubMed]
  30. Radzka, E. The Effect of Meteorological Conditions on Air Pollution in Siedlce. J. Ecol. Eng. 2020, 21, 97–104. [Google Scholar] [CrossRef] [PubMed]
  31. Bokwa, A.; Wypych, A.; Hajto, M.J. Role of Fog in Urban Heat Island Modification in Krakow, Poland. Aerosol Air Qual. Res. 2018, 18, 178–187. [Google Scholar] [CrossRef]
  32. Journal of Laws 1991 No. 77, Item 335. Available online: https://isap.sejm.gov.pl/isap.nsf/download.xsp/WDU19910770335/U/D19910335Lj.pdf (accessed on 31 May 2023).
  33. EN 14907:2005; Ambient Air Quality—Standard Gravimetric Measurement Method for the Determination of the PM2.5 Mass Fraction of Suspended Particulate Matter. European Committee for Standardization: Brussels, Belgium, 2005.
  34. Peel, M.C.; Finlayson, B.L.; McMahon, T.A. Updated world map of the Köppen-Geiger climate classification. Hydrol. Earth Syst. Sci. 2007, 11, 1633–1644. [Google Scholar] [CrossRef]
  35. Aczel, A.D. Statistics in Management; PWN: Warsaw, Poland, 2018; pp. 1–1222. [Google Scholar]
  36. Niedźwiedź, T. Sytuacje Synoptyczne i ich Wpływ na Zróżnicowanie Przestrzenne Wybranych Elementów Klimatu w Dorzeczu Górnej Wisły; Rozprawy Habilitacyjne UJ, No. 58; Jagiellonian University Publishing House: Kraków, Poland, 1981. [Google Scholar]
  37. Niedźwiedź, T. Catalogue of Synoptic Situations in the Upper Vistula River Basin (1873.09–2015.12); Department of Climatology, Faculty of Earth Sciences, University of Silesia: Sosnowiec, Poland, 2016; Available online: http://klimat.wnoz.us.edu.pl (accessed on 30 April 2023).
  38. Bokwa, A.; Hajto, M.J.; Walawender, J.P.; Szymanowski, M. Influence of diversified relief on the urban heat island in the city of Kraków, Poland. Theor. Appl. Climatol. 2015, 122, 365–382. [Google Scholar] [CrossRef]
  39. Jędruszkiewicz, J.; Piotrowski, P.; Pietras, B. Koncentracja zanieczyszczeń pyłowych powietrza PM2,5 w Krakowie w latach 2010–2014. Acta Geogr. Lodz. 2016, 104, 123–135. [Google Scholar]
  40. Manisalidis, I.; Stavropoulou, E.; Stavropoulos, A.; Bezirtzoglou, E. Environmental and Health Impacts of Air Pollution: A Review. Front. Public Health 2020, 8, 505570. [Google Scholar] [CrossRef]
  41. Harrison, R.M.; Laxen, D.; Moorcroft, S.; Laxen, K. Processes affecting concentrations of fine particulate matter (PM2.5) in the UK atmosphere. Atmos. Environ. 2012, 46, 115–124. [Google Scholar] [CrossRef]
  42. Ocena Jakości Powietrza w Województwie Małopolskim w 2012 Roku, Wojewódzki Inspektorat Ochrony Środowiska, Kraków 2013 r (Assessment of Air Quality in the Lesser Poland Voivodeship in 2012, 2013). Available online: https://powietrze.gios.gov.pl/pjp/rwms/publications/card/345?lang=en (accessed on 11 April 2023).
  43. Danek, T.; Weglinska, E.; Zareba, M. The influence of meteorological factors and terrain on air pollution concentration and migration: A geostatistical case study from Krakow, Poland. Sci. Rep. 2022, 12, 11050. [Google Scholar] [CrossRef] [PubMed]
  44. Juda-Rezler, K.; Toczko, B. Pyły Drobne w Atmosferze. Kompendium Wiedzy o Zanieczyszczeniu Powietrza Pyłem Zawieszonym w Polsce, Biblioteka Monitoringu Środowiska; GIOŚ: Warszawa, Poland, 2016; pp. 1–279. [Google Scholar]
  45. Rozbicka, K.; Michalak, M. Charakterystyka stężeń wybranych zanieczyszczeń powietrza na obszarze Warszawy (Poland). Prz. Nauk. Inż. Kształt. Środ. 2015, 68, 193–206. [Google Scholar]
  46. Gliniak, M.; Zuśka, Z.; Miczyński, J. Ocena poziomu pyłowego zanieczyszczenia powietrza w aglomeracji krakowskiej na przykładzie Al. A. Mickiewicza. Logistyka 2015, 4, 8876–8881. [Google Scholar]
  47. Borowiak, K.; Budka, A.; Lisiak-Zielińska, M. Air pollution in summer and winter—Real threat. Ciepłownictwo Ogrzew. Went. 2023, 2, 21–26. [Google Scholar]
  48. Cembrzyńska, J.; Krakowiak, E.; Brewczyński, P.Z. Zanieczyszczenie powietrza pyłem zawieszonym PM10 oraz PM2.5 w warunkach silnej antropopresji na przykładzie miasta Sosnowiec. Med. Sr.—Environ. Med. 2012, 15, 31–38. [Google Scholar]
  49. Cesari, D.; De Benedetto, G.E.; Bonasoni, P.; Busetto, M.; Dinoi, A.; Merico, E.; Chirizzi, D.; Cristofanelli, P.; Donateo, A.; Grasso, F.M.; et al. Seasonal variability of PM2.5 and PM10 composition and sources in an urban background site in Southern Italy. Sci. Total Environ. 2018, 612, 202–213. [Google Scholar] [CrossRef]
  50. Zaręba, M.; Danek, T. Analysis of Air Pollution Migration during COVID-19 Lockdown in Krakow, Poland. Aerosol. Air Qual. Res. 2022, 22, 210275. [Google Scholar] [CrossRef]
  51. Zuśka, Z.; Kopcińska, J.; Dacewicz, E.; Skowera, B.; Wojkowski, J.; Ziernicka–Wojtaszek, A. Application of the Principal Component Analysis (PCA) Method to Assess the Impact of Meteorological Elements on Concentrations of Particulate Matter (PM10): A Case Study of the Mountain Valley (the Sącz Basin, Poland). Sustainability 2019, 11, 6740. [Google Scholar] [CrossRef]
  52. Mindas, J.; Skvarenina, J. Chemical composition of fog/cloud and rain/snow water in biosphere reserve Pol’ana. Ecology 1995, 14, 125–137. [Google Scholar]
  53. Walczewski, J.; Feleksy-Bielak, M.; Dębicka, K.; Śliwińska, U. Wskaźniki meteorologicznych warunków dyspersji zanieczyszczeń powietrza i ich zmienność w Krakowie w latach 1990–1999. Wiad. Instututu Meteorol. I Gospod. Wodnej 2000, 23, 13–27. [Google Scholar]
  54. Bokwa, A. Environmental impacts of long-term air pollution changes in Krakow, Poland. Pol. J. Envir. Stud. 2008, 17, 673–686. Available online: http://www.pjoes.com/Issue-5-2008,3821 (accessed on 26 May 2024).
  55. Bokwa, A. Infuence of air temperature inversions on the air pollution dispersion conditions in Krakow. Pr. Geogr. 2011, 126, 41–51. [Google Scholar]
  56. Ćwiek, K.; Majewski, G. Wpływ elementów meteorologicznych na kształtowanie się stężeń zanieczyszczeń powietrza na przykładzie Krakowa. Prz. Nauk.–Inż. Kształ. Środ. 2015, 67, 54–66. [Google Scholar]
  57. Kalbarczyk, R. Temporal changes in concentration of pm10 dust in Poznań, middle-west Poland as dependent on meteorological conditions. Appl. Ecol. Environ. Res. 2018, 16, 1999–2014. [Google Scholar] [CrossRef]
  58. Niedźwiedź, T.; Łupikasza, E.B.; Małarzewski, Ł.; Budzik, T. Surface-based nocturnal air temperature inversions in southern Poland and their influence on PM10 and PM2.5 concentrations in Upper Silesia. Theor. Appl. Clim. 2021, 146, 897–919. [Google Scholar] [CrossRef]
  59. Shelton, S.; Liyanage, G.; Jayasekara, S.; Pushpawela, B.; Rathnayake, U.; Jayasundara, A.; Jayasooriya, L.D. Seasonal Variability of Air Pollutants and Their Relationships to Meteorological Parameters in an Urban Environment. Adv. Meteorol. 2022, 2022, 5628911. [Google Scholar] [CrossRef]
  60. Houthuijs, D.; Breugelmans, O.; Hoek, G.; Vaskövi, E.; Miháliková, E.; Pastuszka, J.S.; Jirik, V.; Sachelarescu, S.; Lolova, D.; Meliefste, K.; et al. PM10 and PM2.5 concentrations in Central and Eastern Europe: Results from the Cesar study. Atmos. Environ. 2001, 35, 2757–2771. [Google Scholar] [CrossRef]
  61. Hasan, F.B.; Midyurova, B.N.; Mihalev, T.M. Temperature Effect on Particulate Matter Concentrations PM 10 during the heating season in Burgas. IOP Conf. Ser. Mater. Sci. Eng. 2021, 1031, 012002. [Google Scholar] [CrossRef]
  62. Kirešová, S.; Guzan, M. Determining the Correlation between Particulate Matter PM10 and Meteorological Factors. Eng 2022, 3, 343–363. [Google Scholar] [CrossRef]
  63. Šmejkalová, A.H.; Brzezina, J. The Effect of Drought on PM Concentrations in the Czech Republic. Aerosol. Air Qual. Res. 2022, 22, 220130. [Google Scholar] [CrossRef]
  64. Jandacka, D.; Durcanska, D.; Nicolanska, M.; Holubcik, M. Impact of Seasonal Heating on PM10 and PM2.5 Concentrations in Sučany, Slovakia: A Temporal and Spatial Analysis. Fire 2024, 7, 150. [Google Scholar] [CrossRef]
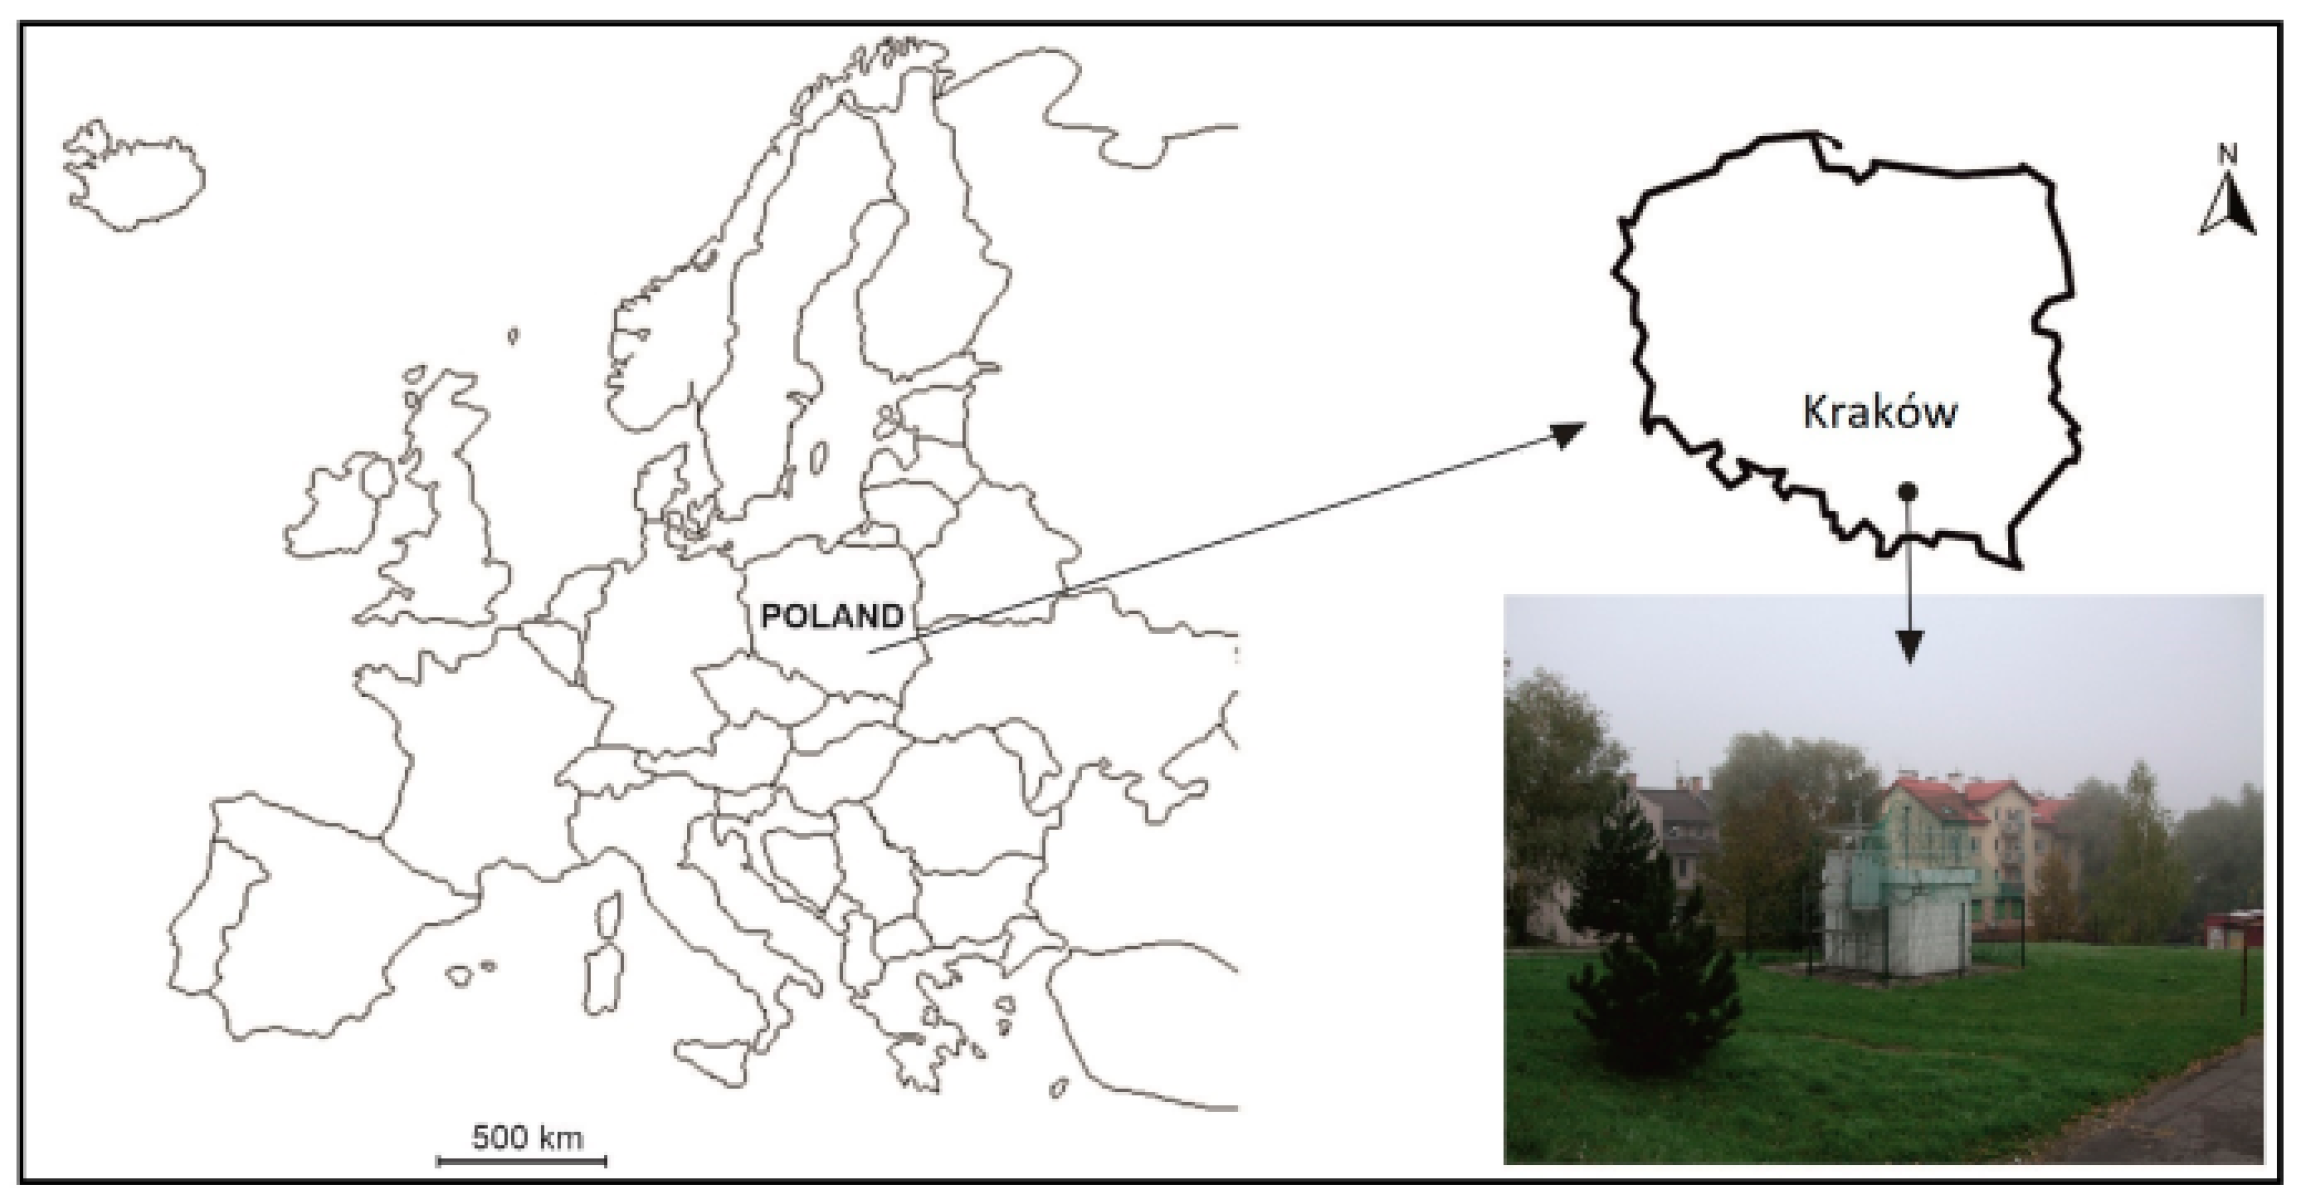
Figure 1. Location of air monitoring station in Krakow in relation to Poland and Europe (Φ 50.010575, λ 19.949189, 223 m a.s.l.).
Sustainability 16 04797 g001
Figure 2. 24-h PM2.5 concentrations in Krakow in 2010–2019 in four calendar seasons: (a) spring, (b) summer, (c) autumn, (d) winter.
Sustainability 16 04797 g002aSustainability 16 04797 g002b
Figure 3. Dependence of variables on principal components of selected meteorological elements: (a) spring, (b) summer, (c) autumn, (d) winter. Abbreviations: average temperature (T), maximum temperature (TM) minimum temperature (Tm), relative humidity (RH), precipitation totals (PP), atmospheric pressure (PKrakow), wind speed (V).
Sustainability 16 04797 g003
Table 1. Annual average PM2.5 concentrations in Krakow in 2010–2019.
Year2010201120122013201420152016201720182019
PM2.5 (µg/m3)35374133333430323125
Table 2. Correlation matrix.
SpringPM2.5TMTmTPPVRHPKrakow
PM2.51.00
TM−0.341.00
Tm−0.610.701.00
T−0.490.950.861.00
PP−0.19−0.010.220.071.00
V−0.28−0.28−0.05−0.220.081.00
RH−0.03−0.420.10−0.260.380.021.00
PKrakow0.26−0.02−0.16−0.07−0.22−0.17−0.231.00
SummerPM2.5TMTmTPPVRHPKrakow
PM2.51.00
TM0.591.00
Tm0.250.531.00
T0.580.940.701.00
PP−0.09−0.110.10−0.101.00
V−0.38−0.270.04−0.230.071.00
RH−0.28−0.480.09−0.420.380.041.00
PKrakow0.150.04−0.160.01−0.29−0.22−0.261.00
AutumnPM2.5TMTmTPPVRHPKrakow
PM2.51.00
TM−0.301.00
Tm−0.530.711.00
T−0.450.930.901.00
PP−0.200.030.210.111.00
V−0.40−0.250.03−0.120.101.00
RH0.26−0.50−0.22−0.420.17−0.121.00
PKrakow0.060.02−0.040.00−0.09−0.010.271.00
WinterPM2.5TMTmTPPVRHPKrakow
PM2.51.00
TM−0.331.00
Tm−0.580.781.00
T−0.510.930.931.00
PP−0.210.160.220.221.00
V−0.590.110.300.240.171.00
RH0.18−0.180.04−0.070.17−0.281.00
PKrakow0.06−0.08−0.12−0.11−0.100.000.301.00
Data highlighted in red represent a statistically significant correlation between variables (significance level 0.05). Abbreviations: average temperature (T), maximum temperature (TM), minimum temperature (Tm), relative humidity (RH), precipitation totals (PP), atmospheric pressure (PKrakow), wind speed (V)
Table 3. Eigenvalues of the correlation matrix.
SpringSummer
Factor No.Eigenvalue% of Total VarianceCumul. EigenvalueCumul.%Eigenvalue% of Total VarianceCumul. EigenvalueCumul.%
PC12.8240.232.8240.232.7238.832.7238.83
PC21.7124.374.5264.601.6924.104.4062.92
PC31.0114.415.5379.011.0314.785.4477.70
PC40.7610.796.2989.800.7010.016.1487.72
PC50.598.456.8898.250.659.266.7996.97
AutumnWinter
PC12.9942.722.9942.723.0543.523.0543.52
PC21.5121.604.5064.321.3419.084.3862.60
PC31.1115.815.6180.131.1216.075.5178.66
PC40.689.676.2989.800.7711.066.2889.72
PC50.568.066.8597.860.578.136.8597.85
Table 4. Coefficients of principal components of selected meteorological elements.
Factor Coefficients of Variables Based on Correlations
SpringSummer
Meteorological ElementsPC1PC2PC3PC1PC2PC3
TM−0.963−0.1370.0500.9500.087−0.019
Tm−0.8520.3550.0170.6280.5970.022
T−0.9920.0270.0400.9700.1920.005
PP−0.0690.743−0.200−0.2470.657−0.306
RH0.2840.2760.823−0.2990.2620.853
V0.2950.738−0.403−0.5570.544−0.386
PKrakow0.077−0.622−0.3520.143−0.700−0.251
AutumnWinter
Meteorological ElementsPC1PC2PC3PC1PC2PC3
TM−0.9440.168−0.090−0.899−0.0860.279
Tm−0.875−0.197−0.069−0.9190.0300.202
T−0.9860.004−0.065−0.969−0.0180.221
PP−0.133−0.768−0.242−0.3550.500−0.587
RH0.103−0.4310.831−0.378−0.485−0.592
V0.551−0.352−0.5820.0970.8410.233
PKrakow0.1700.739−0.0420.421−0.3680.458
Table 5. Coefficients of principal components of selected meteorological elements of PM10. Zuśka et al. [51].
Winter
Meteorological ElementsPC1PC2PC3
T−0.88−0.400.22
TM−0.87−0.220.25
Tm−0.77−0.510.22
H−0.120.840.44
V−0.72−0.32−0.52
PP−0.070.160.43
VM−0.720.410.49
Po 50N20E−0.310.890.24
Table 6. Results of similar studies from nearby regions.
Year of Each StudyResearch LocationsMain FindingsMethodology Title and Authors
November 1995 to October 1996Six Central and Eastern European countries: Bulgaria, Czech Republic, Hungary, Poland, Romania, and
Slovakia
The CESAR and PEACE studies showed that mean PM10 concentrations during the heating season
are generally higher in Central and Eastern Europe than in Scandinavia and Western Europe
Analysis of variance and correlation analysis‘PM10 and PM2.5 concentrations in Central and Eastern Europe: results from the Cesar study’, Houthuijs et al. [60]
October to March in four years, 2017–2020Burgas, BulgariaA decrease in temperature has a negative effect on PM10 levels in January and FebruaryComparison of mean PM concentrations during heating and non-heating seasons‘Temperature effect on PM10 concentrations during the heating season in Burgas’, Hasan et al. [61]
January, March, and May 2022First measurement—Košice, Slovakia;
second measurement—a small village near Košice (one street with
five family houses clustered together)
Strong correlation between PM and wind speed, humidity, and temperatureCorrelation analysis‘Determining the correlation between particulate matter PM10
and meteorological factors’,
Kirešová and Guzan [62]
10-year period from 2010 to 2019, during the growing season (April–September)Czech RepublicPM10 and PM2.5 concentrations were strongly correlated with soil temperature and soil moistureDunn test for multiple comparison of mean PM concentrations between station type, separately for dry and wet period‘The effect of drought on PM concentrations in the Czech Republic’, Šmejkalová and Brzezina [63]
Winter 2019Village of Sučany, SlovakiaCorrelation between the heating season, the PM concentration, and wind directionCorrelation and regression analyses‘Impact of seasonal heating on PM10 and PM2.5 concentrations in Sučany, Slovakia: a temporal and spatial analysis’, Jandacka et al. [64]
Disclaimer/Publisher’s Note: The statements, opinions and data contained in all publications are solely those of the individual author(s) and contributor(s) and not of MDPI and/or the editor(s). MDPI and/or the editor(s) disclaim responsibility for any injury to people or property resulting from any ideas, methods, instructions or products referred to in the content.