Article

Estimation of Potential Nitrous Oxide Emissions from Landfills in the United States: 2010–2020

1
Department of Environmental Engineering, Incheon National University, Incheon 22012, Republic of Korea
2
Korea Environmental Industry and Technology Institute, Incheon 22689, Republic of Korea
*
Author to whom correspondence should be addressed.
Sustainability 2024, 16(11), 4810; https://doi.org/10.3390/su16114810
Submission received: 5 April 2024 / Revised: 12 May 2024 / Accepted: 21 May 2024 / Published: 5 June 2024

Abstract

:
Nitrous oxide (N2O), a major greenhouse gas, has the potential to be emitted from waste landfills. Previous studies have demonstrated the propensity of landfilling facilities to emit significant quantities of N2O, a fact underscored by the IPCC Guidelines, which emphasize the importance of researching this phenomenon. However, due to the absence of established international guidelines for quantifying N2O emissions from landfills, many countries, including the United States, have excluded N2O from greenhouse gas inventories. Therefore, this study aims to estimate N2O emissions from landfills in the United States, a country with a significant landfill waste volume. In this study, N2O emissions from U.S. landfills over an 11-year period (2010–2020) are estimated by using the emission estimation formula provided in CDM AM0083 and emission factors from the 2006 IPCC Guidelines. Additionally, emissions were calculated spatially for each state and individual landfill facility. As a result, the impact of integrating N2O emissions from landfills into the national greenhouse gas inventory was assessed. The average annual landfill N2O emission in the United States over the 11-year period was estimated to be 3,214,693 ton-CO2-equivalent/year, with an overall decreasing trend. In 2020, Indiana, Michigan, and Oregon exhibited high landfill N2O emissions per capita, while the Virgin Islands, Connecticut, and Massachusetts demonstrated lower emissions. When incorporated into the U.S. greenhouse gas inventory, landfill N2O emissions represent 10.41% of the total sector N2O emissions. Although N2O emissions are declining alongside reduced waste landfilling in the United States, the quantity remains significant and should be factored into greenhouse gas inventory calculations and emission scenarios for the next CMIP6. Further research investigating N2O emission coefficients across different regions and waste types is necessary. Ultimately, this study aims to support the United Nations (UN)’s Sustainable Development Goals (SDGs), particularly SDG 11 (Sustainable Cities and Communities), 12 (Responsible Consumption and Production), and 13 (Climate Action), by enhancing the tools for accurate greenhouse gas inventory and promoting sustainable waste management.

1. Introduction

Landfills play a significant role in waste disposal worldwide. Prior to disposal in landfills, waste undergoes various treatment processes such as recycling and incineration, contributing to the expansion of landfill facilities. The generation and release of gases from anaerobic digestion within landfills are associated with a range of air pollution issues, from odor problems to climate change [1,2,3,4,5,6,7,8,9]. Moreover, the barriers separating waste and soil in landfills often lack sufficient strength, allowing leachate to penetrate directly into the surrounding environment. Leachate, containing a variety of pollutants, contaminates groundwater and disrupts the local ecosystem [10,11,12]. Hence, managing pollutants within landfills that cannot be fully eliminated is essential.
The United States (U.S.) stands out among the 38 OECD countries for having the highest waste generation and landfill waste [13]. In 2018 alone, the United States generated approximately 265 million tons of waste, constituting 37.8% of the total waste generation of 701 million tons in the remaining 37 OECD countries, excluding Canada, for which data is unavailable. Additionally, landfill disposal in the United States totaled approximately 132 million tons in 2018, accounting for 50.0% of the total waste disposal. Moreover, to improve food waste management, the U.S. Environmental Protection Agency (EPA) strengthened the food waste measurement methodology in 2017, leading to a significant increase in the classification of waste from food waste to municipal solid waste (MSW). Despite the continued rise in waste quantities, landfill capacity remains stagnant. Numerous studies have projected that many landfill sites in the U.S. will reach their capacity in the coming decades [14,15]. However, despite decades of modern sanitary landfill history, there has been a lack of consistent comprehensive review regarding the size, capacity, operational characteristics, and other parameters of landfills [16].
The accurate calculation of total greenhouse gas emissions from landfills is pivotal, given its substantial contribution to both the U.S. and global greenhouse gas inventories. As the U.S. ranks prominently in global landfill disposal, its corresponding greenhouse gas emissions play a significant role not only in the U.S. inventory but also in global efforts to reduce greenhouse gases. Landfill gases (LFG) arise from the anaerobic decomposition of organic matter within landfills [17,18,19,20]. Biodegradable organic materials in waste, such as paper, animal and vegetable matter, and garden waste, are primary sources [21]. Methane (CH4) and carbon dioxide (CO2), both potent greenhouse gases, are the predominant components of LFG [8,22,23,24]. These emissions persist until a significant portion of the organic matter undergoes decomposition, often spanning several decades [21].
In addition to CH4 and CO2, various other LFGs are generated, including nitrous oxide (N2O), albeit in small amounts. N2O is a potent greenhouse gas with a Global Warming Potential (GWP) 310 times greater than that of CO2 [25]. Emissions of N2O primarily stem from bacteria decomposing nitrogen in soil and oceans. When organic household waste decomposes, 20–60% of incoming nitrogen can be lost as gas, with approximately 5% potentially emitted as N2O [26,27]. Theoretically, within U.S. landfills where organic matter constitutes 22–36% of municipal solid waste (MSW), there is potential for N2O production during organic waste decomposition [28]. Studies on N2O emissions in landfill areas suggest a significant contribution to greenhouse gas emissions from waste when converted into CO2 equivalents [7,29].
Previous research has highlighted significant N2O emissions from landfills. For example, at the municipal landfill of the Helsinki Metropolitan Area in Finland, N2O emissions were measured at 2.7 mg-N/m2∙h [30], surpassing maximum N2O emissions from agricultural soils and forests in Northern Europe by at least 1–2 times. Similarly, the Hogbytorp landfill in Sweden, which is covered with pure sewage sludge, reported more than double the amount of N2O emissions [31]. Moreover, emissions at the center for waste disposal Pohlsche Heidea in Germany ranged from 0 to 428 mg-N/m2∙h [32], depending on landfill type and duration. In a separate study conducted in Osaka City, Japan, emissions of 40.2 g/day were reported from an active landfill and 7.8 g/day from a closed landfill at two sea-based solid waste disposal sites at North Port [33]. However, previous studies have primarily focused on regional measurements, and estimating emissions on a wide scale remains challenging due to the high uncertainty and numerous factors involved in landfill gas emissions.
The absence of N2O emissions from landfill facilities in greenhouse gas inventories stems from a lack of research standardization. Presently, greenhouse gas emissions from the landfill sector are primarily derived from methane (CH4) emissions. The Intergovernmental Panel on Climate Change (IPCC) Guidelines for National Greenhouse Gas Inventories (IPCC GL) for solid waste disposal focus solely on the first-order decay (FOD) model for methane generation. This underscores the need for developing guidelines to estimate N2O emissions from landfills, as highlighted during the 2015 IPCC Expert Meeting for Technical Assessment of IPCC Inventory Guidelines [34]. However, due to the absence of international standards, most countries, including the U.S., do not account for N2O emissions from landfills [35].
Thus, it is crucial to accurately quantify the amount of N2O emissions using existing reliable methods. This necessitates addressing specific questions to enhance greenhouse gas management effectiveness: (1) How much N2O is potentially emitted from landfills at the national, state, and facility levels? (2) How do these emissions change over time? (3) How will the inclusion of N2O emissions from landfills affect the greenhouse gas inventory in the waste sector?
To bridge this knowledge gap, our study aims to achieve the following objectives:
(1)
Estimate N2O emissions from landfills across the U.S. using comprehensive data on waste generation and disposal.
(2)
Determine N2O emissions from landfills by state and facility from 2010 to 2020, considering temporal and spatial variations.
(3)
Assess the environmental costs associated with N2O emissions from landfills and evaluate their impact on changes in the U.S. greenhouse gas inventory when applied.
The hypothesis of this study is that N2O emissions from landfill sectors in the waste field significantly contribute to national greenhouse gas emissions.
Anticipating our findings, it is expected that the results of this study will unveil significant insights into the extent of N2O emissions from landfill facilities across the U.S. By segmenting emissions temporally and spatially, regional disparities and temporal trends are anticipated to be identified, shedding light on potential N2O emissions in landfill sectors. Furthermore, our analysis of the environmental costs associated with these emissions will provide policymakers and stakeholders with valuable information for developing effective mitigation strategies.
Ultimately, by quantifying the impact of N2O emissions from landfills on the U.S. greenhouse gas inventory, our study aims to underscore the importance of incorporating these emissions into national climate action plans. These findings have the potential to inform policy decisions and guide sustainable waste management practices, contributing to broader efforts to mitigate climate change. Ultimately, this study supports several Sustainable Development Goals (SDGs), especially SDG 11 (Sustainable Cities and Communities), 12 (Responsible Consumption and Production), and 13 (Climate Action), because the results and its implications aforementioned align with enhancing sustainable waste management and accurate greenhouse gas inventory [11,36,37,38,39].

2. Materials and Methods

2.1. Research Design

In this study, N2O emissions from U.S. landfills over an 11-year period (2010–2020) are estimated. Specifically, our objectives include quantifying emissions at both state and landfill facility levels and investigating the impact of incorporating landfill N2O emissions into the greenhouse gas inventory [40,41].
To address the absence of specific methodologies for estimating N2O emissions in the 2006 IPCC Guidelines, the Clean Development Mechanism (CDM) methodology AM0083, endorsed by the United Nations Framework Convention on Climate Change (UNFCCC) [41], is adopted for our study. This methodology, commonly applied in climate protection initiatives in developing nations, provides a suitable framework for our analysis.
Our study focuses on the U.S., a global leader in waste generation and landfill disposal [42]. Detailed analyses are conducted by leveraging comprehensive data from U.S. landfills, aggregated by county and state. The U.S. EPA’s longstanding collection of waste-related data since the 1960s and regular publication of reports on waste trends since 2012 provide a robust foundation for our research [35].
The U.S. ranks second globally in greenhouse gas emissions from the waste sector, with the landfill sector contributing significantly (69.9%) to waste-related emissions [35]. Therefore, access to data on landfill-related greenhouse gas emissions in the U.S. is crucial for informing policy enhancements and future research efforts (see Figure 1).

2.2. N2O Estimation Method

The CDM methodology AM0083, approved by the UNFCCC, provides a methodology for activities involving aerating or low-pressure leaching to prevent anaerobic decomposition and achieve aerobic decomposition at landfill sites [41]. Such processes may result in residual methane and nitrous oxide emissions due to incomplete aeration (including downtime of air equipment), incomplete decomposition, and the aerobic decomposition process itself. Consequently, estimating the emissions of methane and nitrous oxide allows for the estimation of total greenhouse gas emissions.
This methodology presents two methods for estimating N2O emissions: one involves direct measurement and correction of N2O on-site, while the other involves calculation using emission coefficient. Due to the lack of current data measuring N2O concentrations at landfill sites, N2O emissions in this study are estimated using the equation based on emission coefficient.
The N2O emission estimation equation provided by CDM methodology AM0083 [41] is as follows.
T E N 2 O = i W i × E F N 2 O × G W P N 2 O a
In this equation,
TEN2O = Annual N2O emissions from landfills (ton-CO2/year)
a = Planned minimum stabilization period of the landfill (years)
i = Landfill category classified
Wi = Total amount of landfill waste in landfill category i (ton)
EFN2O = N2O emission coefficient for landfill aeration and stabilization (ton-N2O/ton-waste)
GWPN2O = Global warming potential of N2O (ton-CO2eq/ton-N2O)
The N2O emission coefficient utilized in Equation (1) is further classified according to the type of waste, to enhance the accuracy of the estimates. Specifically, different emission coefficients were applied depending on whether the target is organic or non-organic waste. By classifying the total amount of landfill waste into organic waste and other waste, Equation (2) can be expressed as follows [41]:
T E N 2 O = i [ W i × { R O × E F 1 + ( 1 R O ) × E F 2 } ] × G W P N 2 O a
In this equation,
RO = Ratio of organic waste to total landfill waste
EF1 = N2O emission coefficient for landfilled organic waste (ton-N2O/ton-waste)
EF2 = N2O emission coefficient for landfill aeration and stabilization (ton-N2O/ton-waste)

2.3. Data Collection

In this study, N2O emissions are estimated through Equation (2). The values used to estimate N2O emissions are as Table 1.
The stabilization of the landfill refers to the state where the biological, physical, and chemical decomposition of deposited waste is completed, and no further settlement of the landfill layer or generation of gases such as methane and carbon dioxide occurs. The planned minimum stabilization period “a” was applied based on previous study [43] that estimated greenhouse gas emissions. In this study, a period of 5.5 years was set for “a”, considering the range of 5.5 to 10 years, which can be considered as the average stabilization period of landfills according to the referenced research.
The variable “i" represents the range classified by state and county where the landfill is located in the U.S., and “Wi” utilized landfill waste weight data updated in September 2021 by the EPA [46]. The database, surveyed according to the Greenhouse Gas Reporting Program (GHGRP), includes information such as the location of the landfill facilities, actual or projected closure years, designed capacity, total landfill waste quantity, and annual intake waste volume of each landfill. Considering a minimum stabilization period of 5.5 years for all landfills, data for landfills closed before 2015, 5 years prior to the 2019 reference year, were excluded for a conservative estimation.
In the U.S., there is no consistent regulation regarding the specific items constituting organic waste [47]. In fact, the criteria for classifying organic and inorganic waste vary depending on each state’s regulations. Organic substances compounds containing carbon–hydrogen bonds, and organic waste refers to biodegradable animal or plant-based waste that can be decomposed into carbon dioxide, methane, or simple organic molecules by microorganisms [48,49,50]. In this study, organic waste was defined based on these definitions and the organic waste components identified in each state, including food, paper, rubber/leather/textile, wood (e.g., garden waste), dust, and diapers.
Table 2 summarizes the proportion of organic waste (‘RO’ in Equation (2)) in the total landfill waste. If state-level data on the composition of landfill waste have been reported since 2010, the corresponding information (Table 2) was sourced from [51,52,53,54,55,56,57,58,59,60]. In cases where no data were available after 2010, statistics on the physical composition of average incoming wastes in the U.S. in 2018 were utilized as a representative [61]. Moreover, when facility-level data were accessible within a state, the average value of the facility was adopted as the value for the state during the same reporting period.
The emission factor “EF1” is applied as 0.24 g-N2O/kg-waste for the biological treatment of organic waste, referring to the 2006 IPCC GL [44]. This factor is currently utilized to estimate N2O emissions from the biological treatment of solid waste in other waste sectors domestically.
Another emission factor, “EF2”, is utilized as the default value in the CDM methodology AM0083, as presented in Equation (1). Based on a study on N2O emissions from organic waste composting at landfill sites [27], a default value of 0.027 kg-N2O/ton-waste was applied. During the composting process of organic waste, nitrogen (N) losses occur within a range of 20–60% of the initial content. Potential emission pathways include atmospheric losses (NH3, N2, N2O, NO) and hydrosphere losses (NO3 leaching). In the cited study, N2O emissions from two composting facilities (an aerated continuous flow reactor and a batch compost heap) were measured and analyzed.
Based on the impact of carbon dioxide on global warming, the Global Warming Potential (GWP) of N2O (‘GWPN2O’) indicates the degree to which other greenhouse gases contribute to global warming. GWPN2O applies a 100-year compared to CO2, as reported by the IPCC [45]. This GWP value of 310 is currently utilized to calculate national greenhouse gas emissions.
Population and area data for states and cities were obtained from the US Census population and area surveys updated in October–November 2021, utilizing the population figures from 2019 [62,63,64,65]. For the Virgin Islands, which were excluded from the state population database, separate reports were consulted for reference. Population density was calculated by dividing the population of each state by its area in square kilometers (km2).
Regarding landfill area, data were derived from the EPA LMOP landfill dataset [46], specifically utilizing the “Current Landfill Area (acres)” metric. For conversion into units of mg-N2O/h·m2 from ton-CO2/year, the landfill area was utilized. When converting to mg-N2O/h·ton, the total amount of landfill waste was used, calculated from the “Waste in Place (ton)” metric also sourced from the EPA LMOP landfill data.
Greenhouse gas emissions data, including total greenhouse gas emissions in the U.S., greenhouse gas emissions in the waste sector, greenhouse gas emissions in the landfill sector, and total N2O emissions, were based on the 2020 data from the EPA’s Facility Level Information on Greenhouse Gas Tool (FLIGHT) project.
State-level average tipping fees were obtained from the Environmental Research & Education Foundation (EREF), utilizing their April 2019 data on state-level average tipping fees [66].

2.4. Data Analysis

Through spatial and temporal analysis using the aforementioned calculations and data, we conducted an analysis of the emission data. Visual representations of the data were created utilizing color and size differences in figures. In addition to analyzing emissions for the entire U.S., detailed regional analyses were performed based on characteristics such as population, implementation of regulations, and major industries, by calculating emissions for each state and landfill. Furthermore, data excluding variables related to population were derived by calculating the landfill N2O emissions per capita for each state. Additionally, emissions for each year from 2010 to 2020 were analyzed using cumulative data, enabling the interpretation of temporal trends such as changes in regulations and waste volume over time.
The proportion of organic waste is a key variable in the calculation formula for landfill N2O emissions used in this study, which we believe is significantly influenced by the type of waste. Thus, implications were derived assuming that waste types are associated with major industries, recycling rates, and related regulations in each period and region.
By examining the landfill N2O emissions for each state over the 11-year period from 2010 to 2020, we calculated the increase rate to determine whether emissions increased or decreased. The slope (a) of the linear trend line (y = ax + b) for the 11 years was defined as the increase rate, where “x” represents the year and “y” represents the landfill N2O emissions. This allowed us to observe changes in landfill N2O emissions over the past 11 years under different state-specific regulations such as tipping fees and extended producer responsibility (EPR).
Furthermore, to gauge the impact of the derived landfill N2O emissions, we calculated the ratio of these emissions to the greenhouse gas emissions currently applied in actual greenhouse gas inventories. For the year 2020, we analyzed the proportion of landfill N2O emissions to total N2O emissions in the waste sector, total N2O emissions across all sectors, total greenhouse gas emissions from landfills, and total greenhouse gas emissions in the waste sector. Additionally, differences in the impact when applying landfill N2O emissions to the greenhouse gas inventories of each state were examined.

3. Results and Discussion

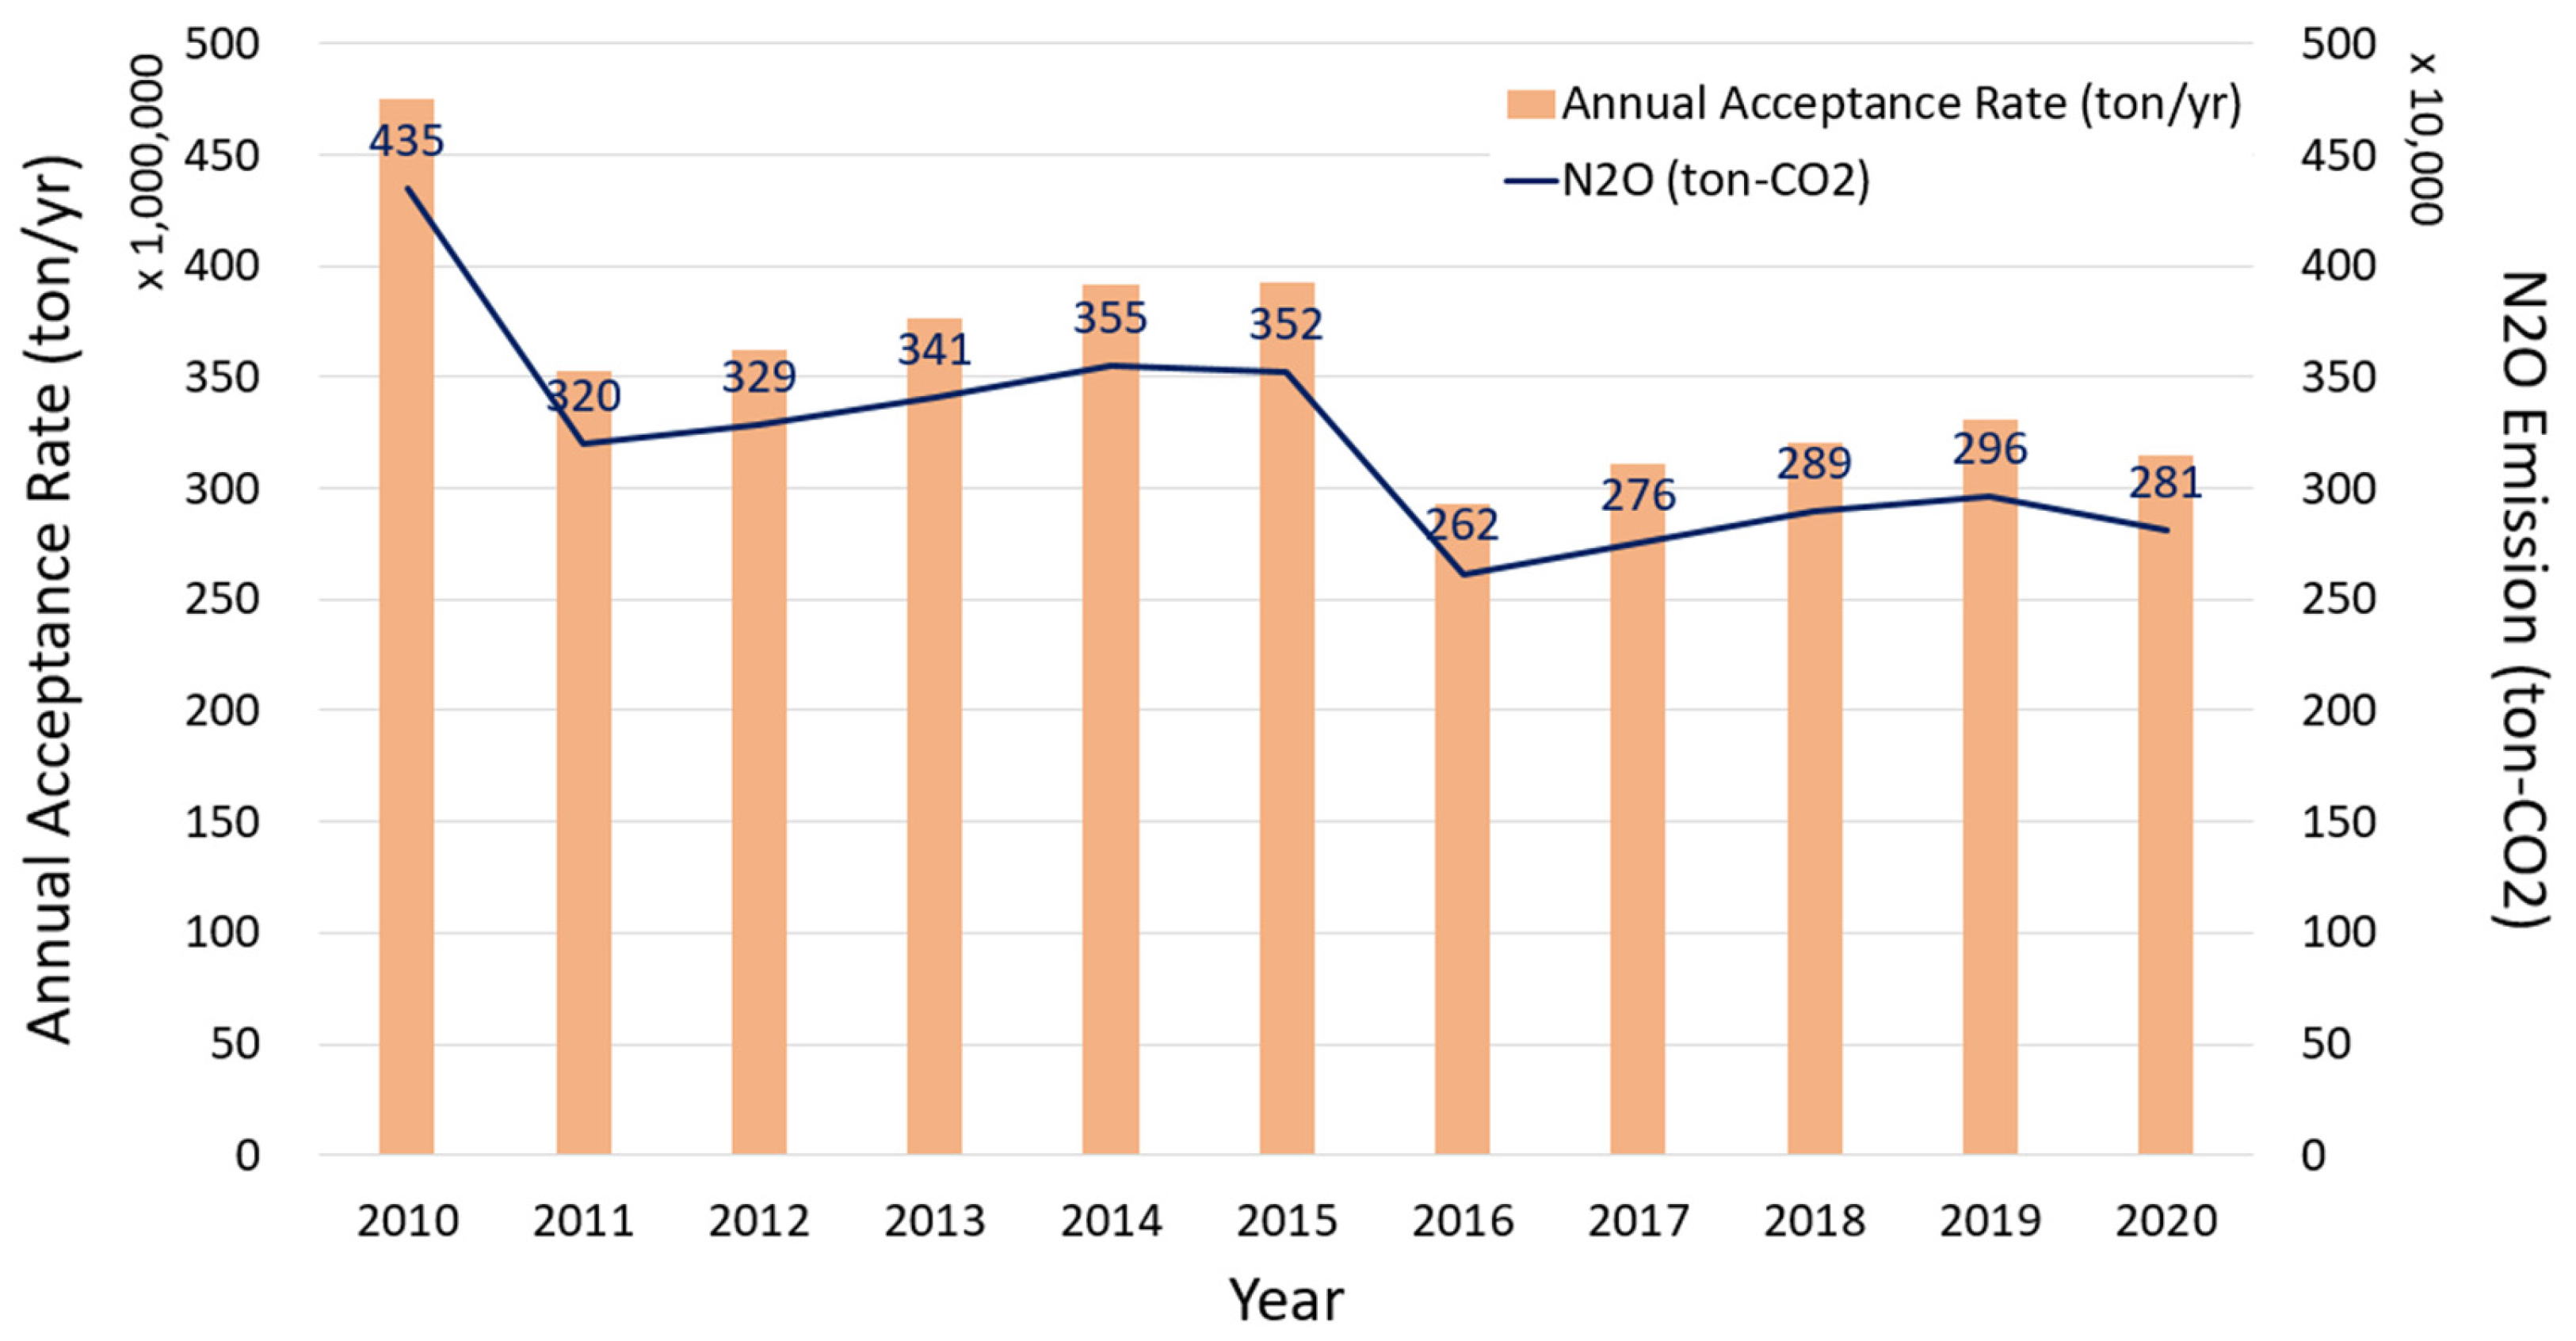
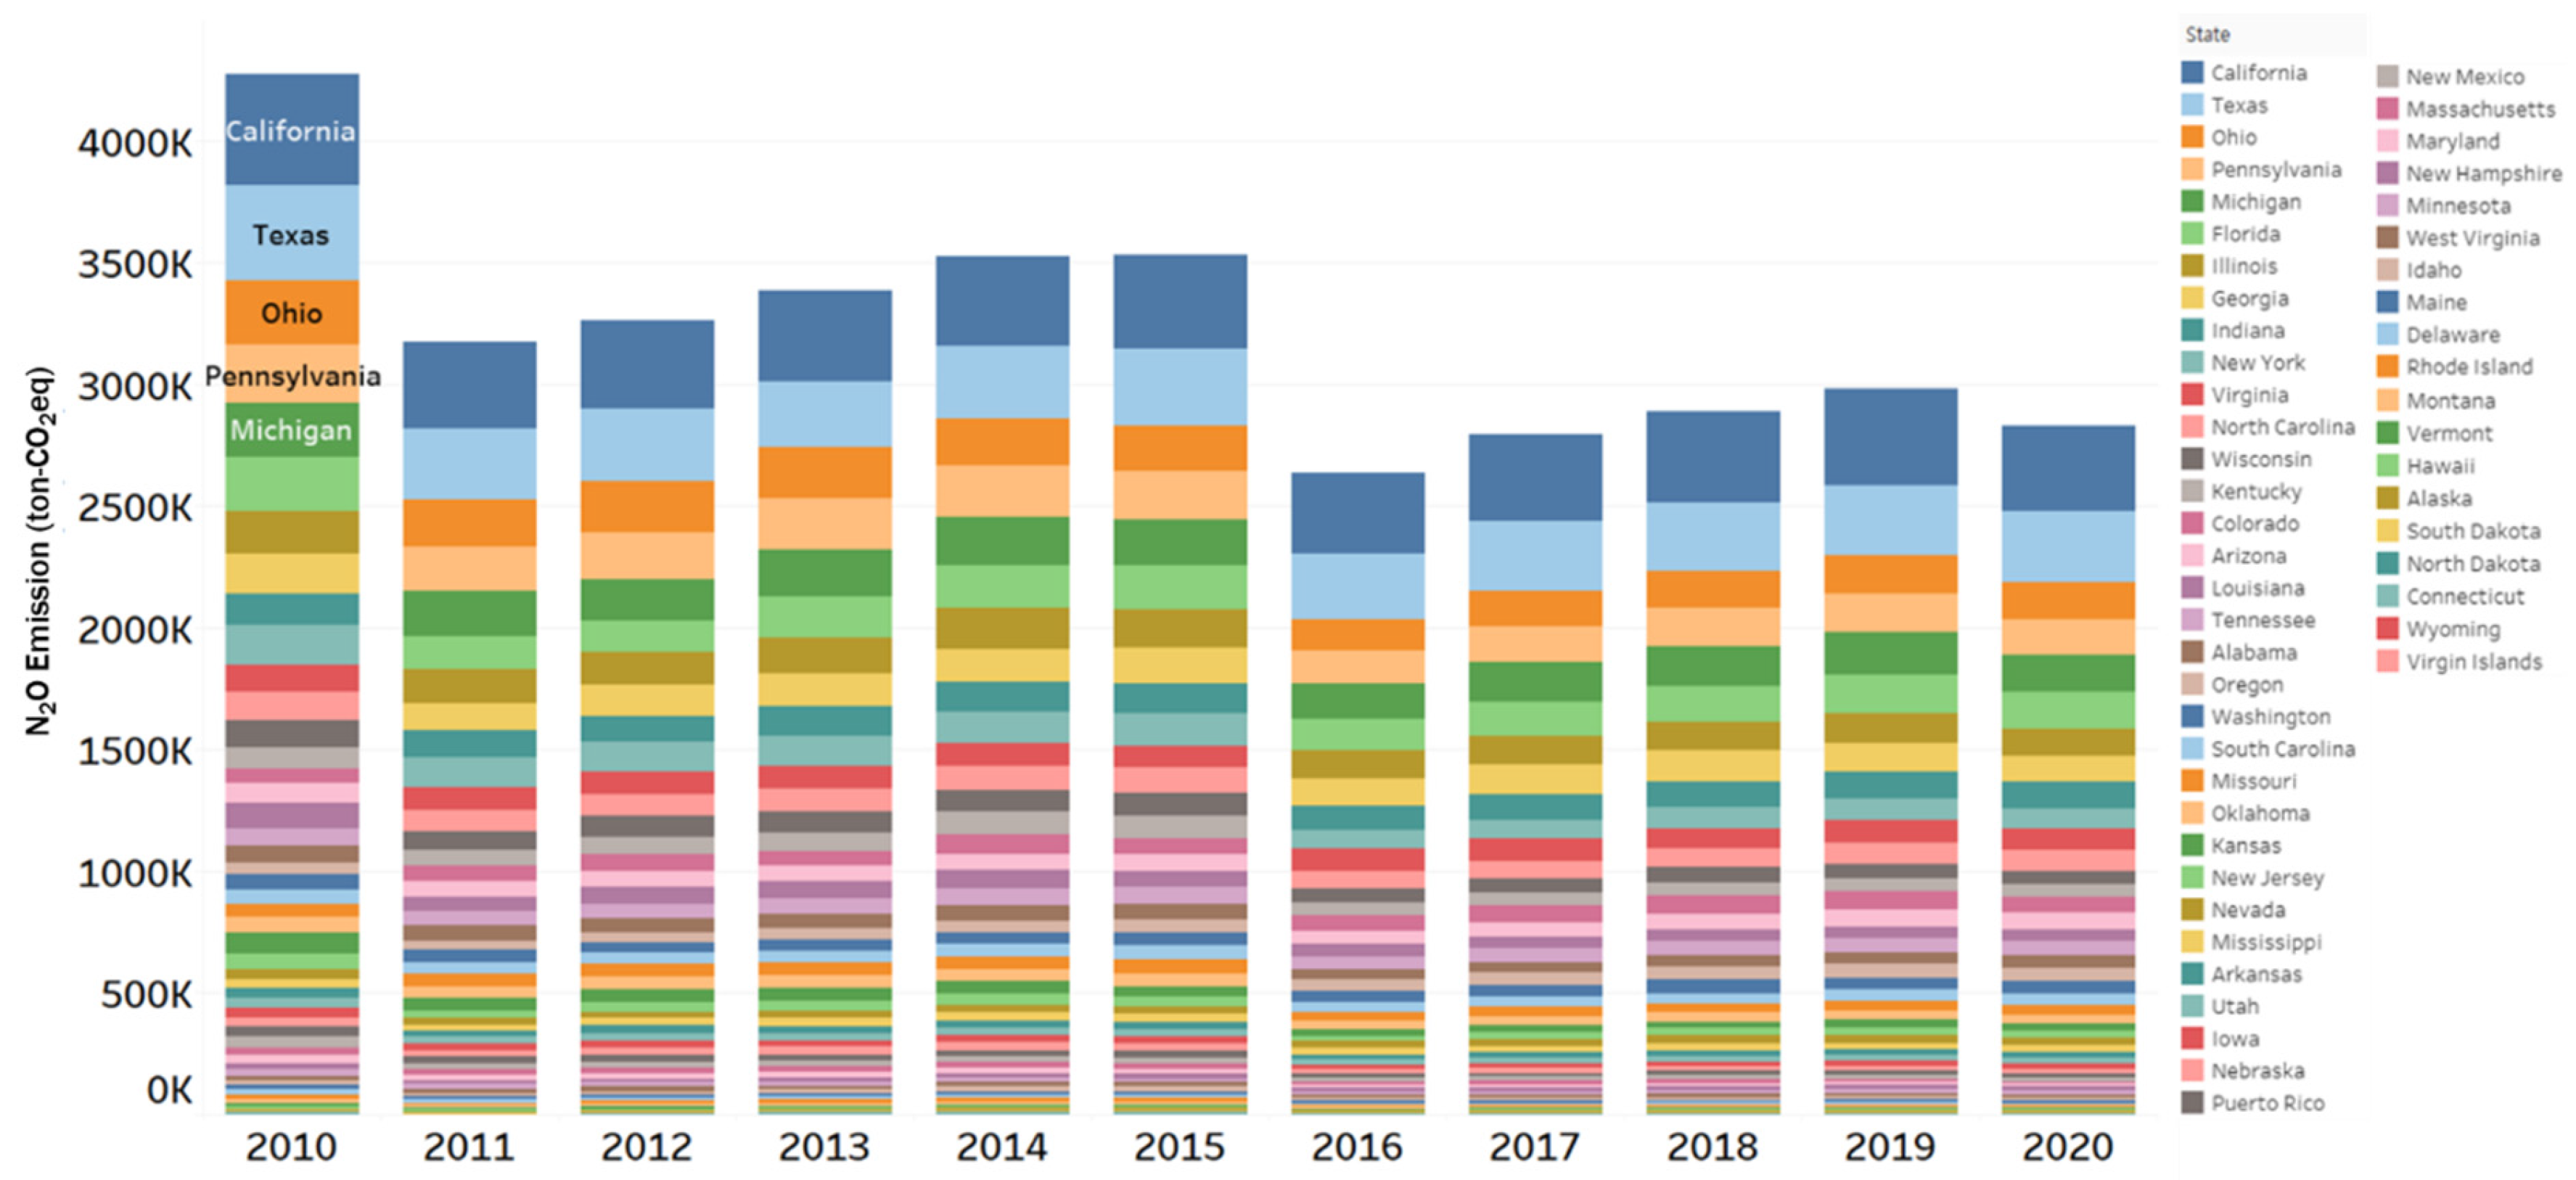
3.1. General Trend of Nitrous Oxide Emissions from Landfills in the United States

As depicted in Figure 2, the estimated N2O emissions from 3,920,585,362 tons of landfill waste in the U.S. over the 11-year period from 2010 to 2020, using the aforementioned methodology, totaled 35,361,628 ton-CO2. Moreover, the average annual emissions over this period amounted to 3,214,693 ton-CO2/year. The highest emissions occurred in 2010, estimated at 4,349,859 ton-CO2/year, while the lowest were recorded in 2016 at 2,615,701 ton-CO2/year. For the most recent years, 2020 and 2019, emissions were estimated at 2,812,271 ton-CO2/year and 2,961,590 ton-CO2/year, respectively. When integrated into the greenhouse gas inventory, these emissions from the waste sector in 2019 accounted for approximately 1.81% of the total.
The trend of N2O emissions mirrors the pattern of landfill acceptance waste, suggesting a consistent proportion of organic waste annually. Indeed, the proportion of organic waste, which was 63.60% in 2010, showed a slight decrease to 61.85% in 2020.
Emissions displayed a similar trend to landfill acceptance waste, peaking in 2010, followed by a sharp decline in 2011, then a gradual increase until 2014–2015. Subsequently, there was a notable drop in 2016, followed by a rise until 2019 and a slight decrease in 2020. This trend appears closely linked to landfill waste itself, signifying an overall reduction in landfill volume from 2010 to 2020, likely influenced by landfill reduction policies. The proportion of landfilling to total waste generation declined from 54.3% in 2010 to 50.0% in 2018, with the Zero Waste Plan targeting further waste generation reduction by 2025. This plan aims to curtail landfilling through policies like prohibiting the disposal of recyclable and hazardous wastes and diverting compostable organic wastes from landfills [67].
Implementation of zero-waste policies in the U.S. has indeed led to reduced waste generation. Recycling policies and waste-to-clean-energy initiatives have diversified waste disposal methods, resulting in both absolute and relative decreases in landfill quantities. Additionally, since 2018, categorizing some food waste under “other food management” has lessened the amount of food waste entering landfills.
The N2O emissions estimated in this study are challenging to compare comprehensively due to limited measurement and research conducted thus far. However, upon extensive comparison, the estimated average N2O emission of 2.259 mg-N2O/h·m2 (equivalent to 3.318 mg-N2O/h·ton) over 11 years (2010–2020) from this study falls within the range of emissions measured in several previous studies. When considering landfill N2O emission measurement studies conducted worldwide, concentrations ranging from −0.104 to 1562.5 mg-N2O/h·m2, with a mean value of 2.708 mg-N2O/h·m2 (95% confidence interval ranged from −525 to 579.167 mg-N2O/h·m2) have been reported [7]. The emissions estimated in this study approximate the average values reported in previous studies. Additionally, they exhibit similar values to studies reporting an average of 2.625 mg-N2O/h·m2 emitted from landfills in northern and southern California, US [68].
According to the 2018 N2O emission categorized by landfilled waste type (Figure 3), N2O emissions from organic waste, constituting 62.50% of the landfill inflow waste, account for 93.68% of the total emissions. Particularly, food waste emits the highest amount of N2O at 36.12%, followed by paper (17.69%), wood (12.44%), textile (11.54%), and yard trimming (10.79%) emitted N2O in decreasing order.
Food production accounts for one-quarter of the world’s greenhouse gas emissions [42], and this significance extends to landfills. The U.S. EPA defines food waste as “uneaten food and food preparation wastes from residences, commercial establishments such as grocery stores and sit-down and fast-food restaurants, institutional sources such as school cafeterias, and industrial sources such as factory lunchrooms” [69]. Between 2017 and 2018, the EPA enhanced its food measurement methodology to manage wasted food more efficiently across the entire food system and minimize the amount excluded, resulting in a significant increase in the accounted-for food waste. Consequently, this also impacted the volume of food waste landfilled. The proportion of food waste in landfill waste remained relatively stable at 21.00–22.00% between 2010 and 2017 but notably increased to 24.10% in 2018. With composition data beyond 2019 yet to be compiled, the proportion of food waste in landfill waste is anticipated to be higher than that of 2010 to 2017, underscoring the increasing importance of managing N2O emissions from food waste landfilling.
Paper waste, comprising the largest portion of MSW in the U.S., encompasses “products such as office papers, newspapers, corrugated boxes, milk cartons, tissue paper, and paper plates and cups” [69]. Since 2010, with the digitization of products previously made predominantly of paper, such as newspapers, the demand for paper has decreased, resulting in a reduction in landfill volume. Additionally, paper waste is the only category where recycling exceeds landfilling as of 2018, indicating active awareness and technology in recycling. However, despite this progress, landfill emissions of N2O from paper waste remain the second highest after food waste due to the high overall waste generation rate. Therefore, continuous efforts should be made to further increase recycling rates.
Americans discard about two million tons of carpet each year. Carpets and rugs categorized under textiles include woven, tufted, and other rugs (e.g., knitted, needle punched, braided) [61]. Due to the fact that only 10% of carpet materials can be reused or recycled, recycling efforts are limited [70]. Despite the Carpet America Recovery Effort (CARE) and other initiatives aimed at carpet collection and recycling over the past two decades, the recycling rate has not significantly increased. In California, carpets have been designated as an extended producer responsibility (EPR) item, resulting in a recycling rate double the national average. However, the implementation of this policy has faced challenges due to opposition from some manufacturers [71].
Yard trimmings include grass, leaves, and tree and brush trimmings from residential, institutional, and commercial sources [69]. Since the enactment of laws prohibiting landfill disposal of yard trimmings after 1990, their disposal decreased but began to increase again in the 2000s. The current predominant methods for handling them include composting, landfilling, and combustion with energy recovery. From 2010 to 2017, the proportion of yard trimmings composted increased from 57.49% to 69.41% of the total yard trimmings generated, resulting in a significant reduction in landfilling from 35.00% to 24.59%. However, in 2018, composting decreased to 62.99% while landfilling increased to 29.75%, and it remains uncertain what trend will continue after 2019, for which there is no data.
The composition of landfill waste significantly influences N2O emissions from landfills [7,72]. This composition is closely tied to regulations governing landfilling and promoting alternative waste treatment methods, as discussed earlier. As waste-related issues have garnered attention, national efforts to address them, such as increasing recycling rates, have been ongoing. With the strengthening and diversification of related regulations, it is anticipated that the absolute quantity of landfill waste has decreased, and its composition has shifted towards emitting fewer greenhouse gases. Consequently, it is inferred that overall N2O emissions from landfills in the U.S. are on a decreasing trend.

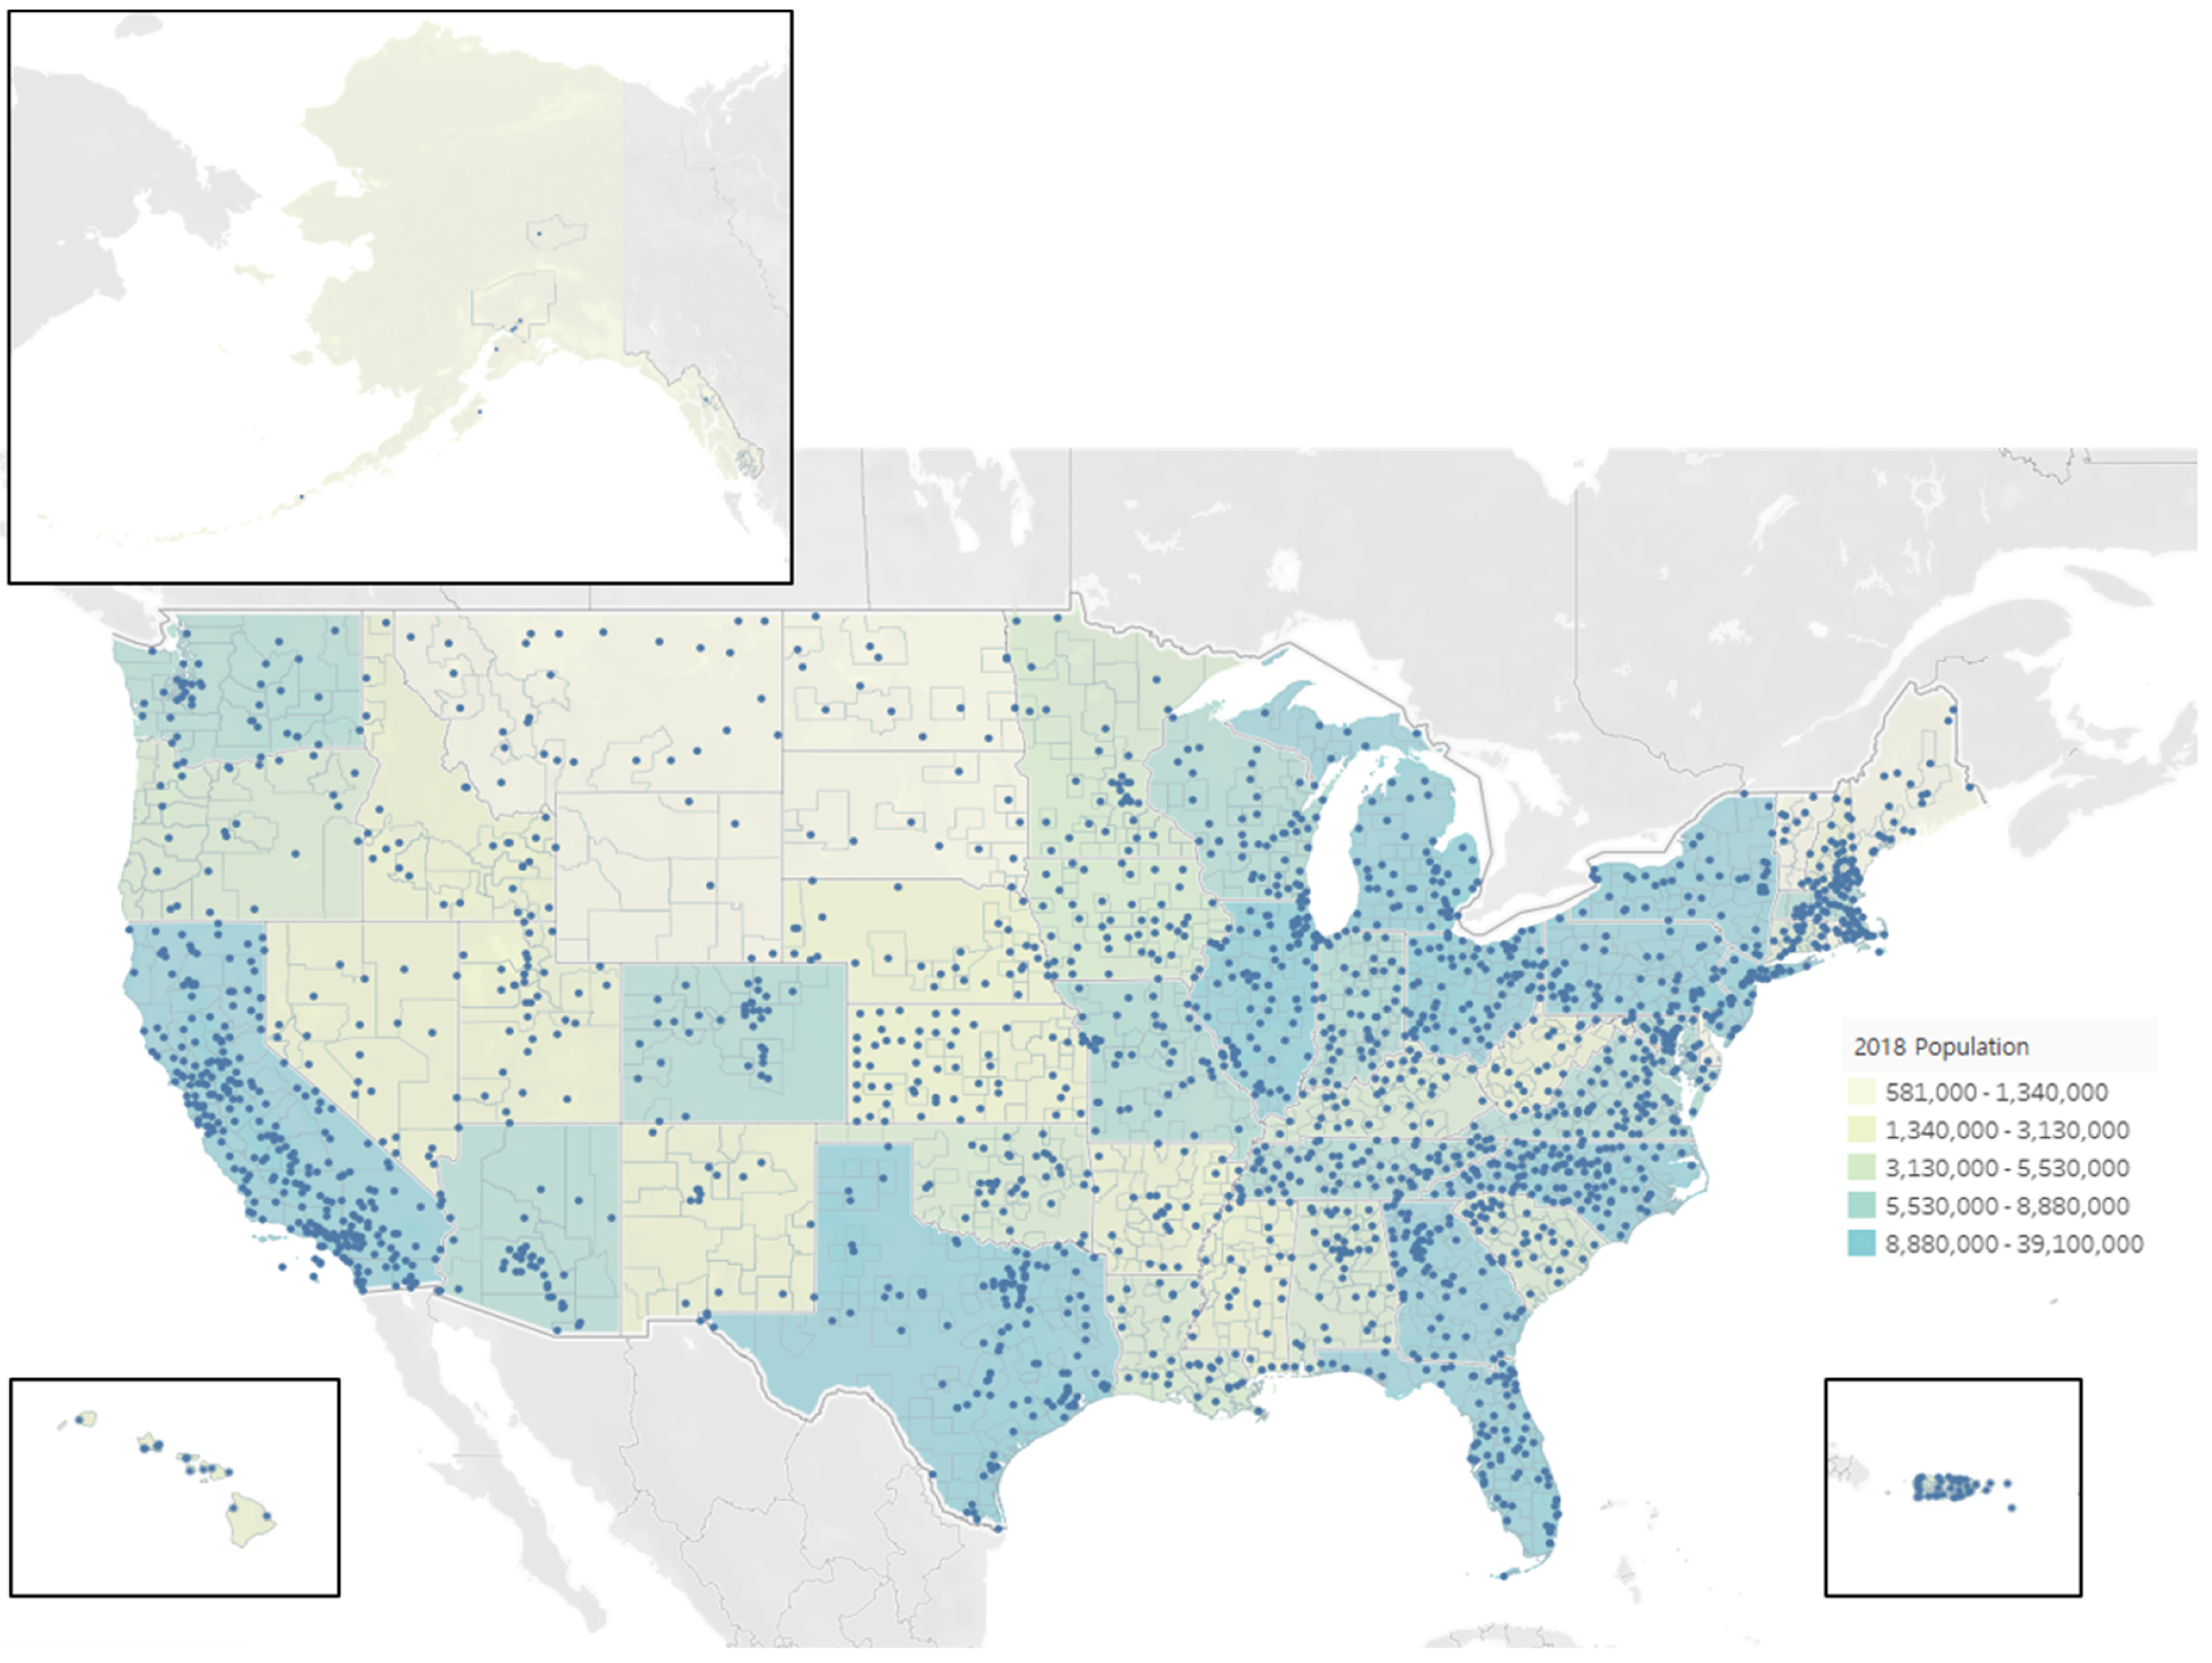
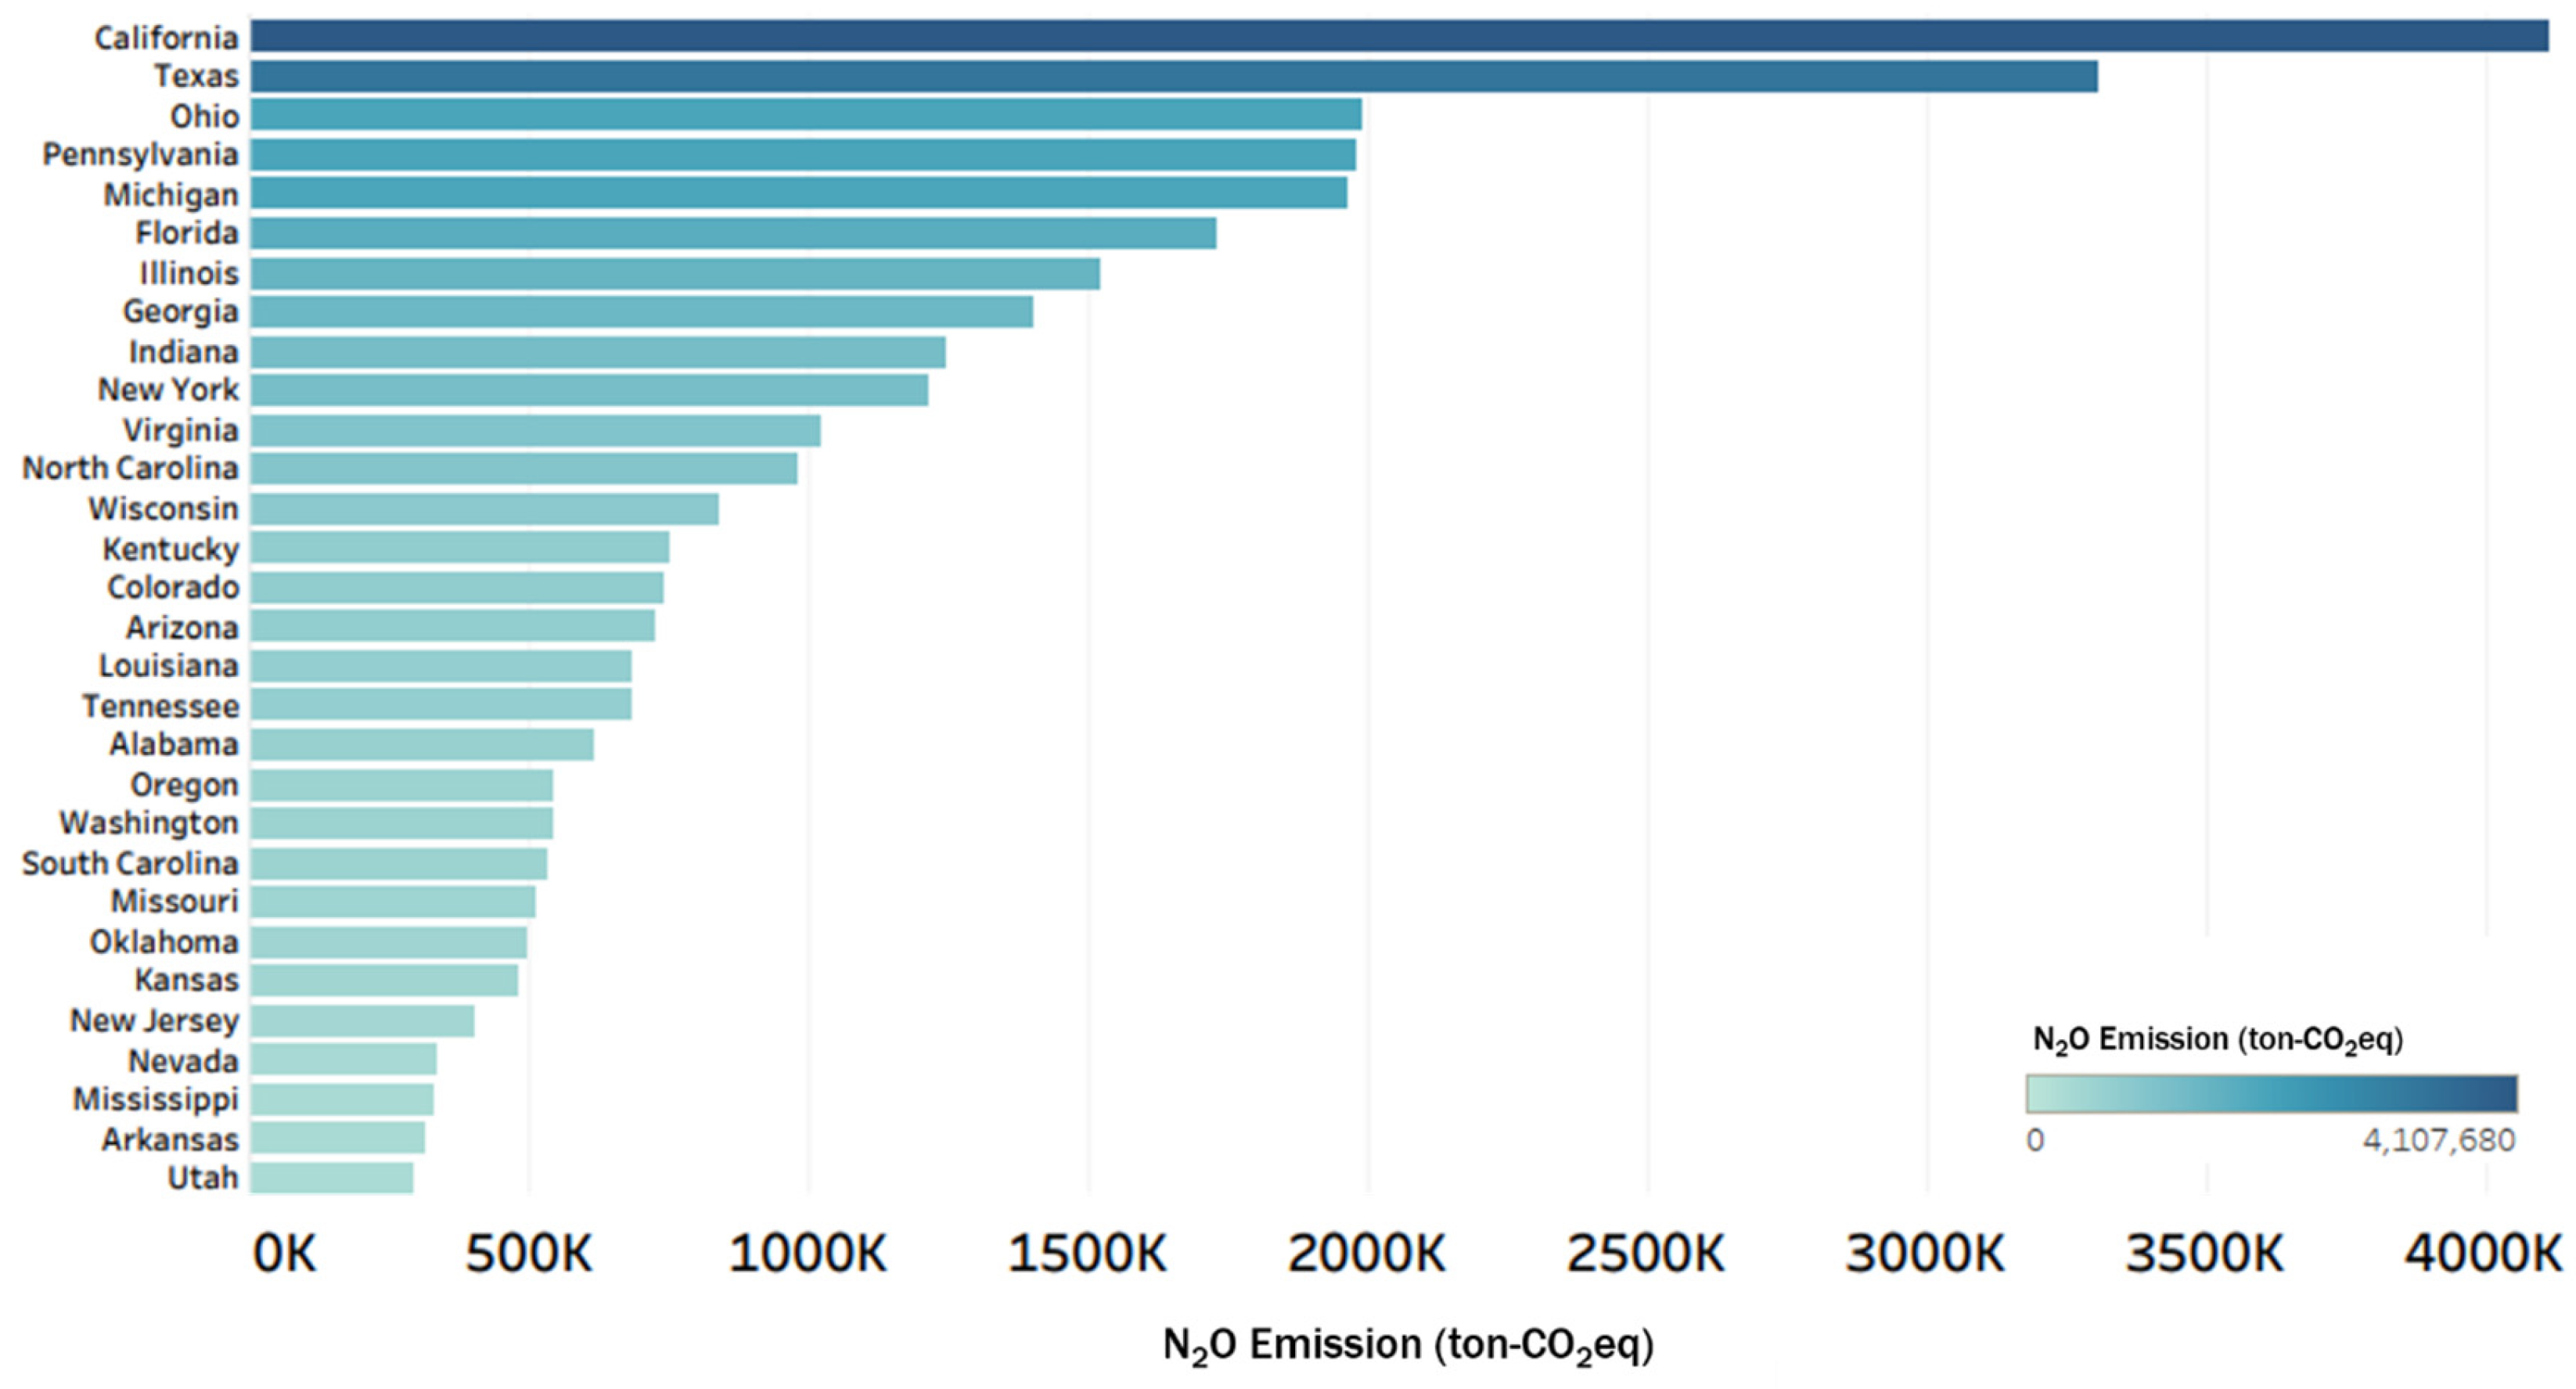
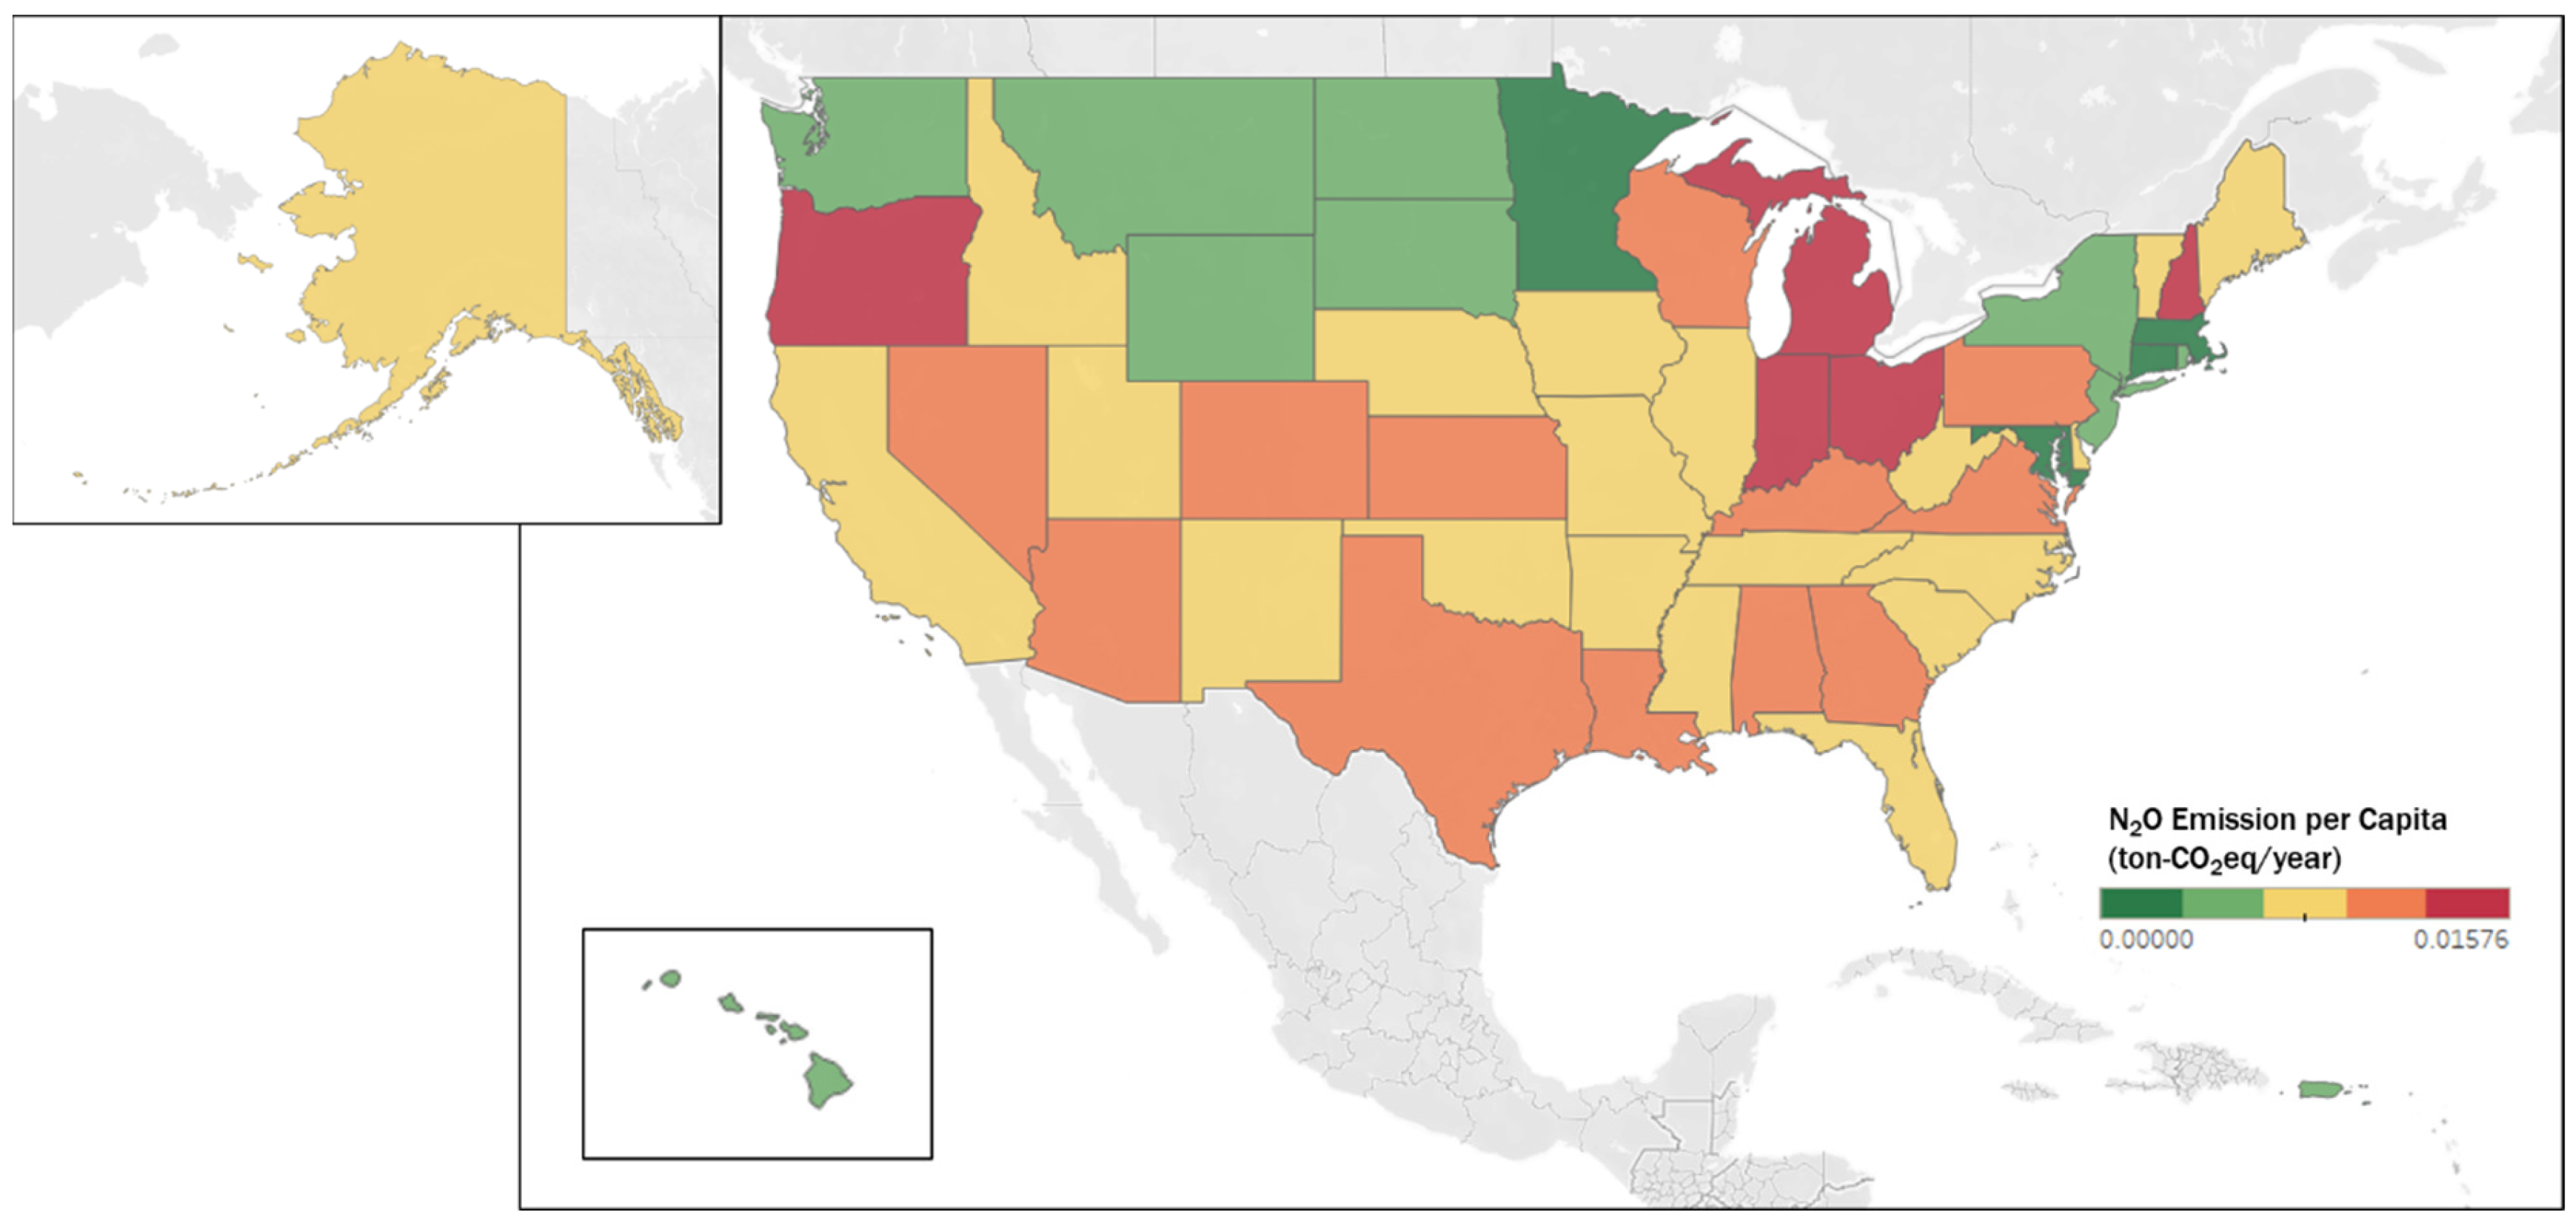
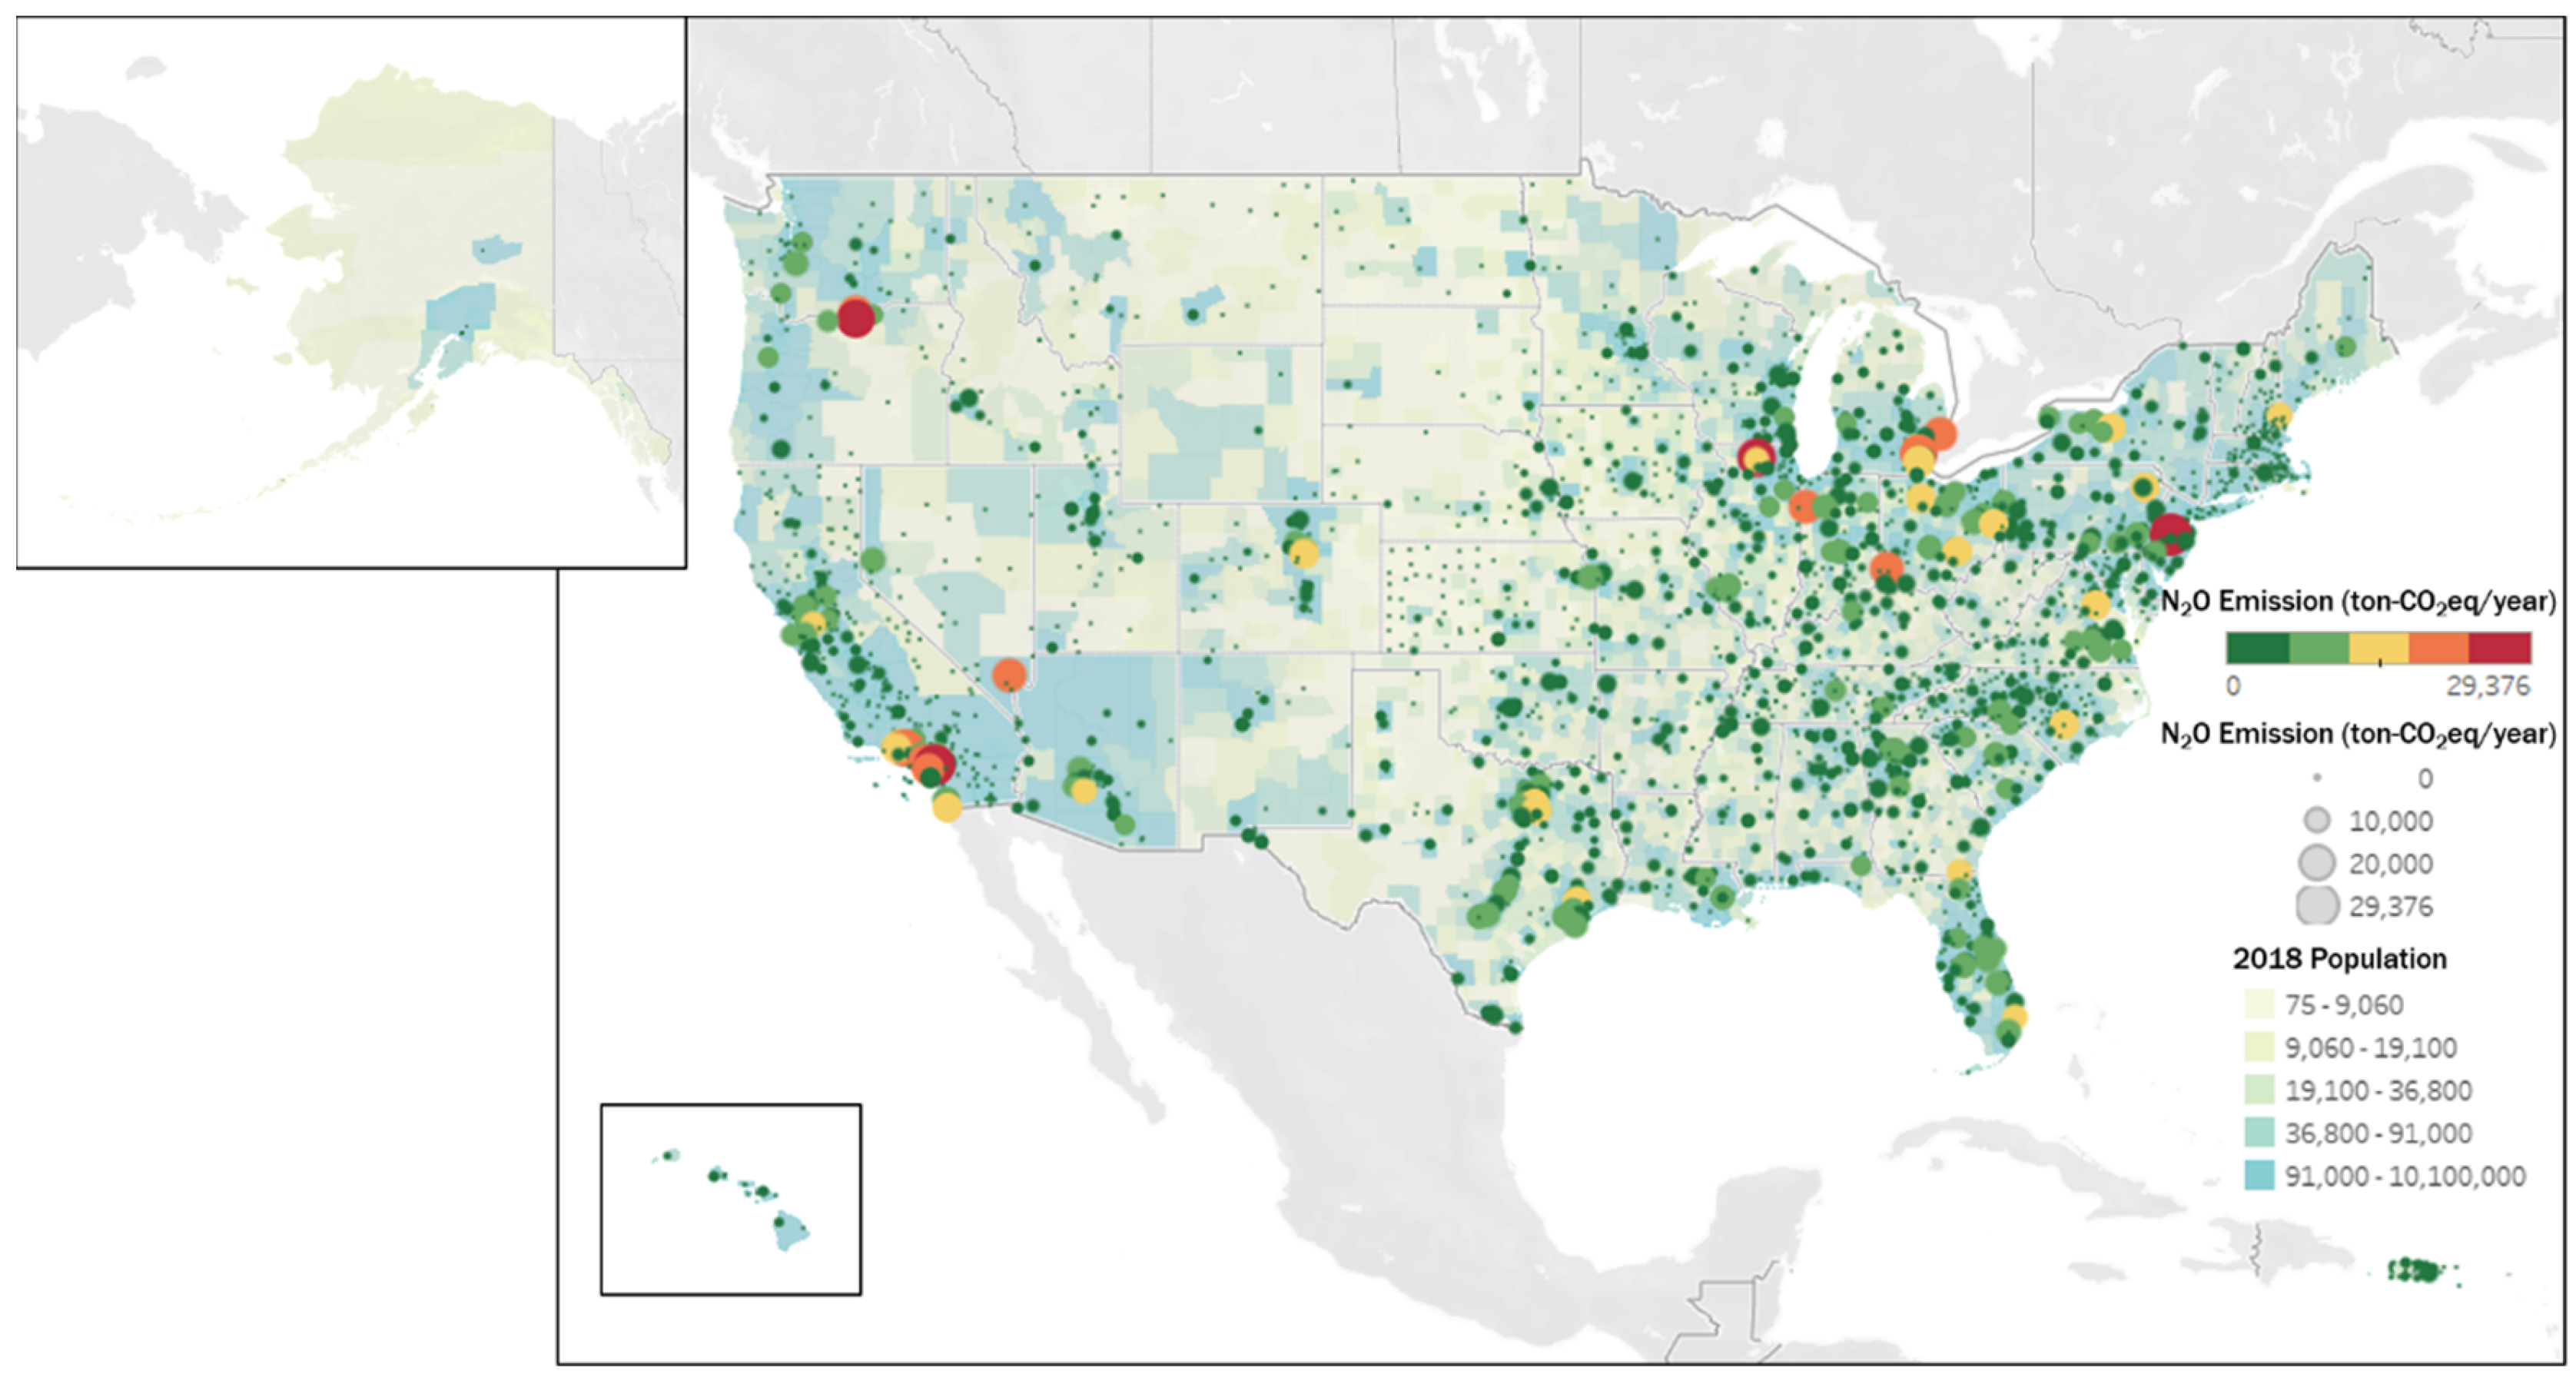
3.2. Regional Specific Trend of Nitrous Oxide Emission from Landfills in the United States

In 2020, California and Texas ranked first and second, respectively, in terms of N2O emissions by state, accounting for 22.8% of the total emissions from all states. The landfill N2O emissions within the top eight states (California, Texas, Ohio, Michigan, Florida, Pennsylvania, Illinois, and Georgia) constitute over half, specifically 51.72%, of the total emissions in the U.S. (see Figure 4).
Figure 5 is a graph that divides the emissions of each state within the total emissions of the U.S. from 2010 to 2020 by color. The average emissions per state within the U.S. are 54,410 ton-CO2/year. The rankings of state emissions during this period from 2010 to 2020 do not change significantly, as this is the total emissions without considering the population or area of each state. The two states with the highest emissions mentioned above, California and Texas, account for 20.7% of the total population of the U.S. Regions with larger populations tend to generate more waste, leading to higher landfill volumes and consequently higher absolute N2O emissions. However, the correlation with population is not perfectly proportional. For example, although New York ranks fourth in population, with a significant difference (approximately 6,651,572 people) from fifth-ranked Pennsylvania, Pennsylvania emits 62,406 ton-CO2/year more than New York, which is ranked tenth.
In addition, there is a proportional relationship between population density and waste generation [73,74,75]. Examining whether N2O emissions at landfills are related to population density, Wyoming, the second lowest in population density, ranked third lowest in N2O emissions at 1929 tons-CO2/year. Similarly, North Dakota, with the fourth lowest population density, was fourth lowest in N2O emissions, while South Dakota, with the fifth lowest population density, ranked sixth lowest in N2O emissions. However, New Jersey, which has the highest population density, ranked 26th with 30,482 tons-CO2/year, Massachusetts, the third highest in population density, ranked 42nd with 6918 tons-CO2/year, and Connecticut, the fourth highest in population density, ranked 51st with 1247 tons-CO2/year in 2020.
Therefore, while population size and density may influence landfill N2O emissions to some extent, it appears that other factors also play significant roles. For instance, waste composition resulting from various primary industries and lifestyles in different regions, particularly the proportion of organic matter, could be a major factor [20]. Additionally, other factors such as recycling rates and waste-related legislation may also be considered as influential factors directly impacting the quantity of waste disposed of.
The average landfill N2O emission per capita across the 52 states in the U.S. is 7.83 kg-CO2/year, as shown in Figure 6. While California and Texas had particularly high total emissions, Indiana, ranked ninth in total emissions, topped the list with 15.8 kg-CO2/year per capita, and Michigan, ranked second, had 15.3 kg-CO2/year per capita emissions. The top 10 states with the highest N2O emissions from landfills per capita are Indiana, Michigan, Oregon, New Hampshire, Ohio, Kentucky, Pennsylvania, Colorado, Virginia, and Nevada in descending order. Additionally, the 10 states with the lowest emissions are the Virgin Islands, Connecticut, Massachusetts, Minnesota, Maryland, Wyoming, New Jersey, Puerto Rico, New York, and North Dakota in ascending order.
As shown in Figure 7, from 2010 to 2020, while overall emissions in the U.S. have been declining, there are four states where landfill N2O emissions have been increasing. Oregon, Colorado, Nevada, and New Hampshire are the states showing the steepest incline in landfill N2O emissions. All four states ranked in the top 10 for landfill N2O emissions per capita in 2020. In this case of Oregon, total N2O emissions from landfills reached their lowest point in 2011 and have since exhibited an increasing trend, rising by 47.95% compared to 2011 by 2020. Colorado has been on an upward trend since 2010, reaching its peak in 2018 with a 24.56% increase compared to 2010, followed by a decline until 2020. Nevada had initially high emissions until 2010 but decreased to its lowest point by 2012. Afterward, emissions increased, reaching their highest emissions in 2019 with a 42.20% increase compared to 2012, the lowest point, followed by a decrease again in 2020. Conversely, New Hampshire did not show a consistent upward trend, reaching its peak in 2015 and experiencing a sharp decline in 2016, maintaining similar emissions thereafter.
Excluding the Virgin Islands, which recorded 0 tons of landfill by EPA, 47 states have seen a decrease in landfill N2O emissions from 2010 to 2020. States with particularly steep declines include Ohio, Pennsylvania, and New York. Although New York’s landfill N2O emissions per capita in 2020 ranked among the top 10, they were at a relatively low rank. Ohio and Pennsylvania, despite emitting high levels of N2O in the top 10, are displaying a decrease, suggesting a likelihood of further reduction due to their steep decline rates. Ohio demonstrated a decreasing trend after peaking in emission in 2010, reaching its lowest level in 2016. It decreased by 50.03% compared to 2010 and has since seen a slight increase to maintain a consistent level of emissions. Similarly, Pennsylvania recorded its highest emissions in 2010, followed by a decrease of 45.97% from 2010 to 2016, when it hit its lowest point. Subsequently, there has been a slight increase, maintaining emissions at a comparable level. New York underwent significant declines in emissions in 2011 and 2016. In 2016, there was a 53.95% decrease compared to 2010, followed by marginal increases to sustain similar levels thereafter.
The Organic Waste Ban prohibits the landfilling of organic waste such as food waste, enabling organic waste generators to reduce their emissions by utilizing alternatives like donations, composting, and anaerobic digestion. Five states (California, Connecticut, Massachusetts, Rhode Island, and Vermont) have enacted legislation to curb food waste from entering landfills. Among these, Connecticut, Massachusetts, Rhode Island, and Vermont have N2O emissions per landfill ranking within the bottom second, third, 13th, and 16th positions, respectively, falling within the bottom 25%.
California, leading in landfill N2O emissions and ranking 22nd in emissions per capita, implemented legislation mandating the recycling of organic waste, encompassing food waste, green waste, landscape and pruning waste, nonhazardous wood waste, and food-soiled paper mixed with food, effective from 1 January 2016. Consequently, landfill N2O emissions witnessed a significant decrease in 2016, with a 13.67% drop compared to the previous year. However, there was subsequently an increase, and overall, no clear downward trend is evident.
Connecticut initiated mandatory recycling requirements for certain organic materials starting 1 January 2014. Landfill N2O emissions peaked in 2014, reaching the highest value since 2010, but steadily decreased thereafter, hitting the lowest landfill N2O emissions in 2020, with a decrease of 39.37% compared to 2010.
Massachusetts has prohibited the landfilling of commercial organic waste from businesses and institutions that generate more than one ton of substances per week since 1 October 2014. Landfill N2O emissions in Massachusetts have been on a decreasing trend since 2010, with a notable decline of 38.32% year-on-year in 2016 and a substantial reduction of 76.85% in 2020 compared to 2010, marking the lowest landfill N2O emissions.
Rhode Island implemented the Food Waste Recycling Requirements from January 1, 2016. Landfill N2O emissions in Rhode Island increased from 2011 to 2015, then sharply declined in 2016 with a 52.92% decrease compared to the previous year, and have continued to decrease since then.
In Vermont, the Universal Recycling Law on the Recycling of Solid Wastes, including organic wastes, was phased in starting from 1 July 2014. Landfilling of leaf and yard debris was prohibited from 1 July 2016, and landfilling of food waste was completely banned from 1 July 2020. Landfill N2O emissions in Vermont have continued to decline since 2010, with a 52.34% decrease from the previous year in 2016 when the Leaf & Yard Debris Landfill Prohibition Act took effect, marking the lowest emission in the period from 2010 to 2020. In 2020, it decreased by 68.30% compared to 2010.
The tipping fee refers to the price per ton of waste paid by individuals disposing of waste in landfills, intended to support landfill maintenance and operational costs. The recycling rate tends to correlate with the tipping fee for the landfill [76]. New Jersey, ranking seventh lowest in landfill N2O emissions per capita despite having the highest population density, has a tipping fee of $81.91, placing it sixth highest. This fee appears relatively high compared to the average tipping fee of $58.98 across 47 states in the United States, excluding the 5 states (Massachusetts, Vermont, Connecticut, Puerto Rico, and the Virgin Islands) without tipping fee records in 2019. Conversely, Kentucky, ranking sixth highest in landfill N2O emissions per capita despite having average population density, has the lowest tipping fee at $29.82.
Extended Producer Responsibility (EPR) is the principle that assigns responsibility for the environmental impact of products at the end of their life cycle to the original producers and sellers of the products [77]. In the U.S., EPR policies vary from state to state, covering product categories such as batteries, electronics and cell phones, fluorescent lighting, and mattresses, among others, totaling 15 categories under EPR, including carpets, classified as organic waste in this study. Six states—Washington, New York, Rhode Island, Vermont, California, and Maine—have implemented more than five EPR programs. Interestingly, among the states with the top six landfill N2O emissions, except for Oregon, which has four EPR programs but ranks in the top three for emissions, the number of EPR laws is less than one. Similarly, states ranked up to 18th in emissions have fewer than two EPR laws on average.
As mentioned in Section 3.2, changes in landfill N2O emissions due to waste-related regulations are also occurring at the state level. Since the U.S. has different laws and regulations implemented in each state, the situation may vary across states even though there is an overall decreasing trend in both the quantity of landfill waste and landfill N2O emissions nationwide.
Figure 8 depicts landfill-specific N2O emissions. Landfills emitting N2O above the 2020 average of 1171 ton-CO2/year are concentrated in coastal areas of California, New England, South Atlantic, East South Central, and West South Central. Additionally, as of 2020, there are six landfills in California, four in Michigan, four in Ohio, and three in Texas, with one each in Pennsylvania, Illinois, Oregon, Nevada, Washington, Indiana, Colorado, and North Carolina.
The landfill with the highest annual emissions between 2010 and 2020 were located in Los Angeles, Whittier, California, producing 56,307 ton-CO2/year in 2010. This can be attributed to its location in California, which has the largest total amount of waste landfilled, and its status as the largest landfill in the United States. Operational for 56 years, it was closed in October 2013. Over the four years from 2010 to 2013, the landfill emitted N2O of 921,544 ton-CO2 due to waste totaling 102,308,197 tons. The landfill was situated in the southwest area, where landfills are currently concentrated in California. Within a 45-mile radius of the landfill are several other landfills that are ranked 2nd, 12th, and 13th in terms of landfill N2O emissions.
In this study, factors such as the composition of the soil were not considered when estimating landfill N2O emissions. However, in reality, factors such as the oxygen and water composition in landfill soil can influence N2O emissions [78,79]. Considering that many major landfills estimated in this paper are located near coastlines, it is likely that such additional conditions may lead to variations in total landfill N2O emissions if they are taken into account.

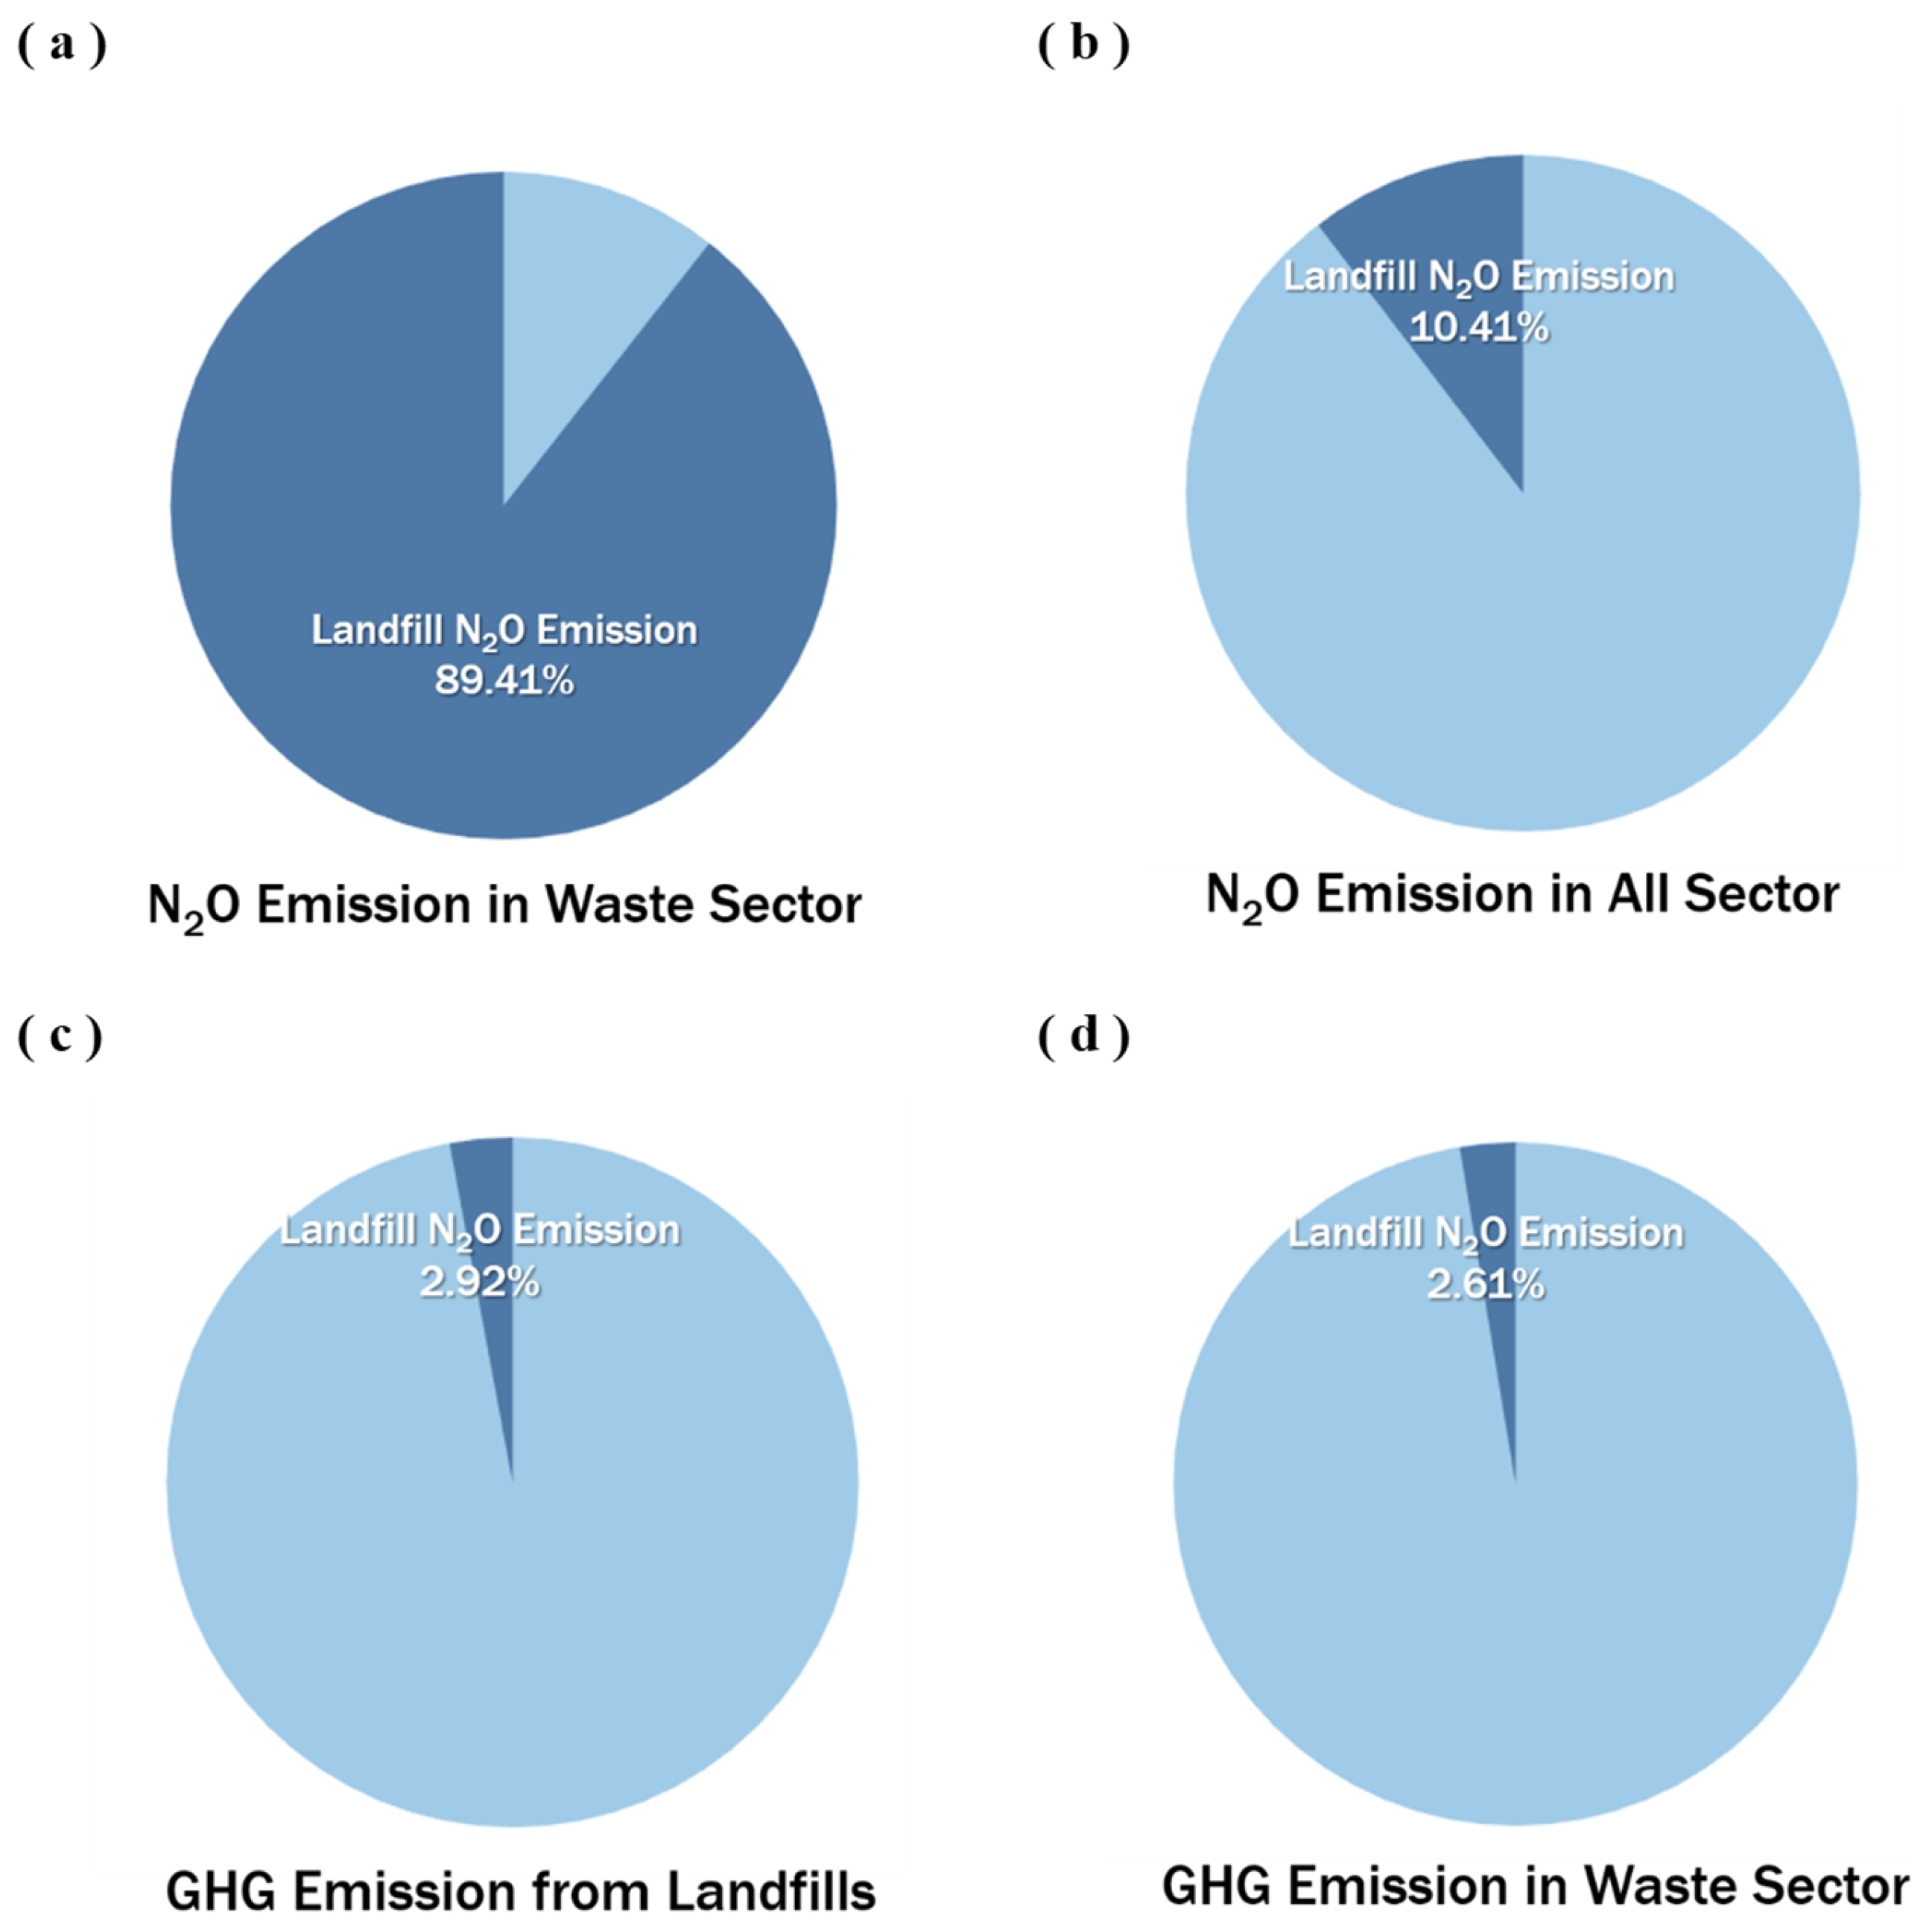
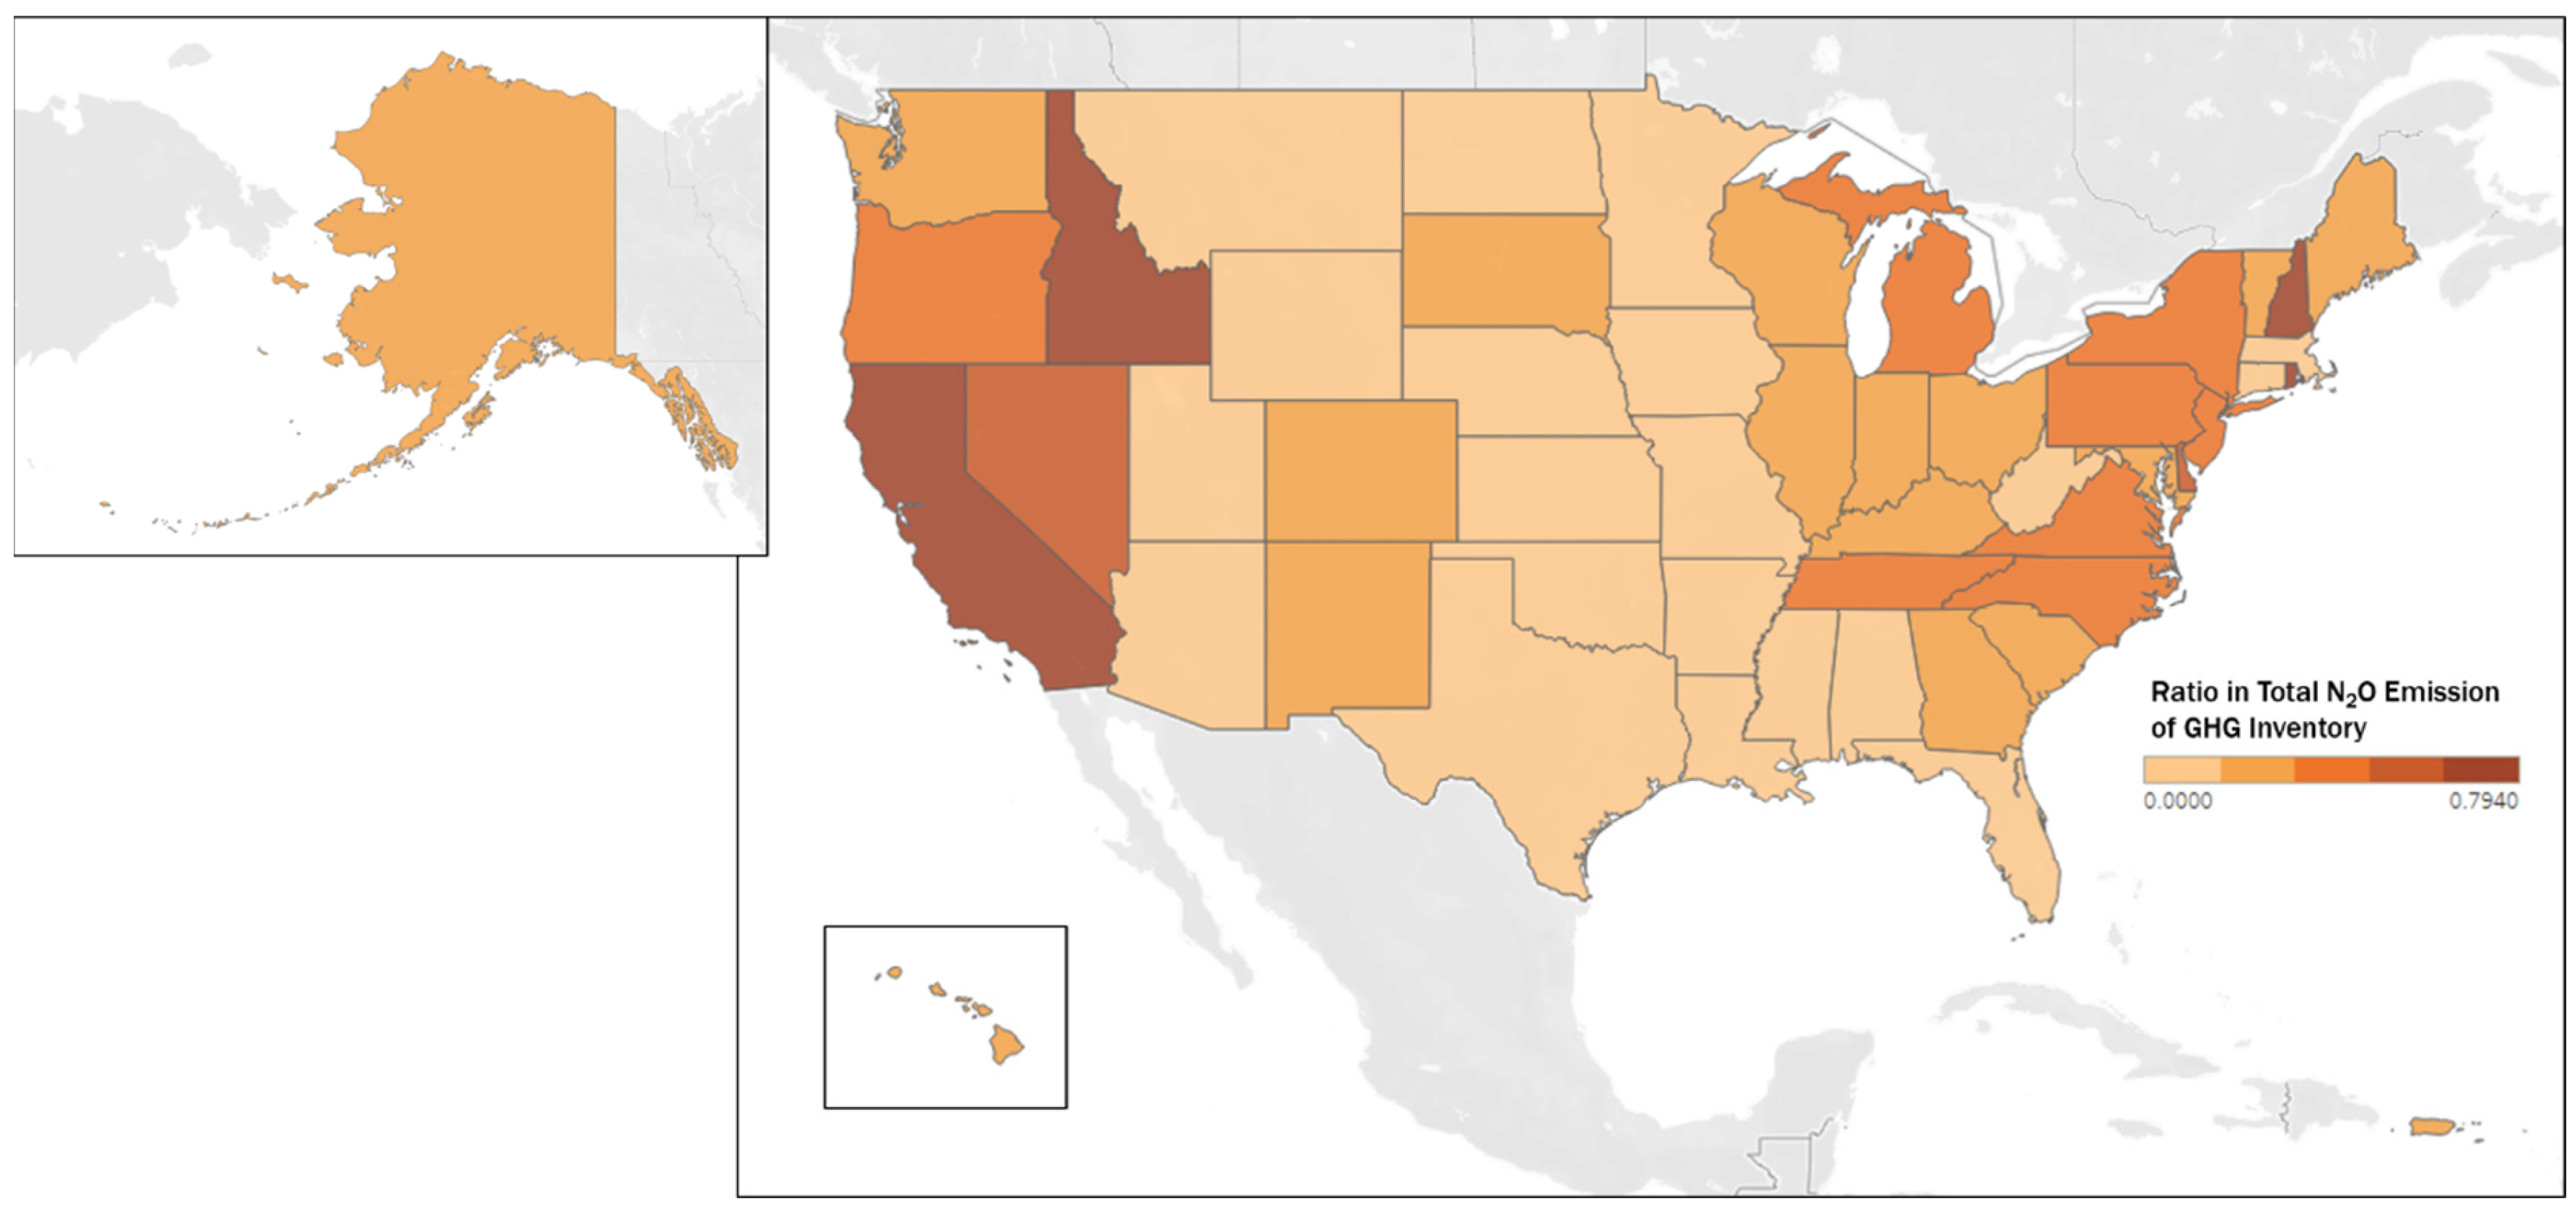
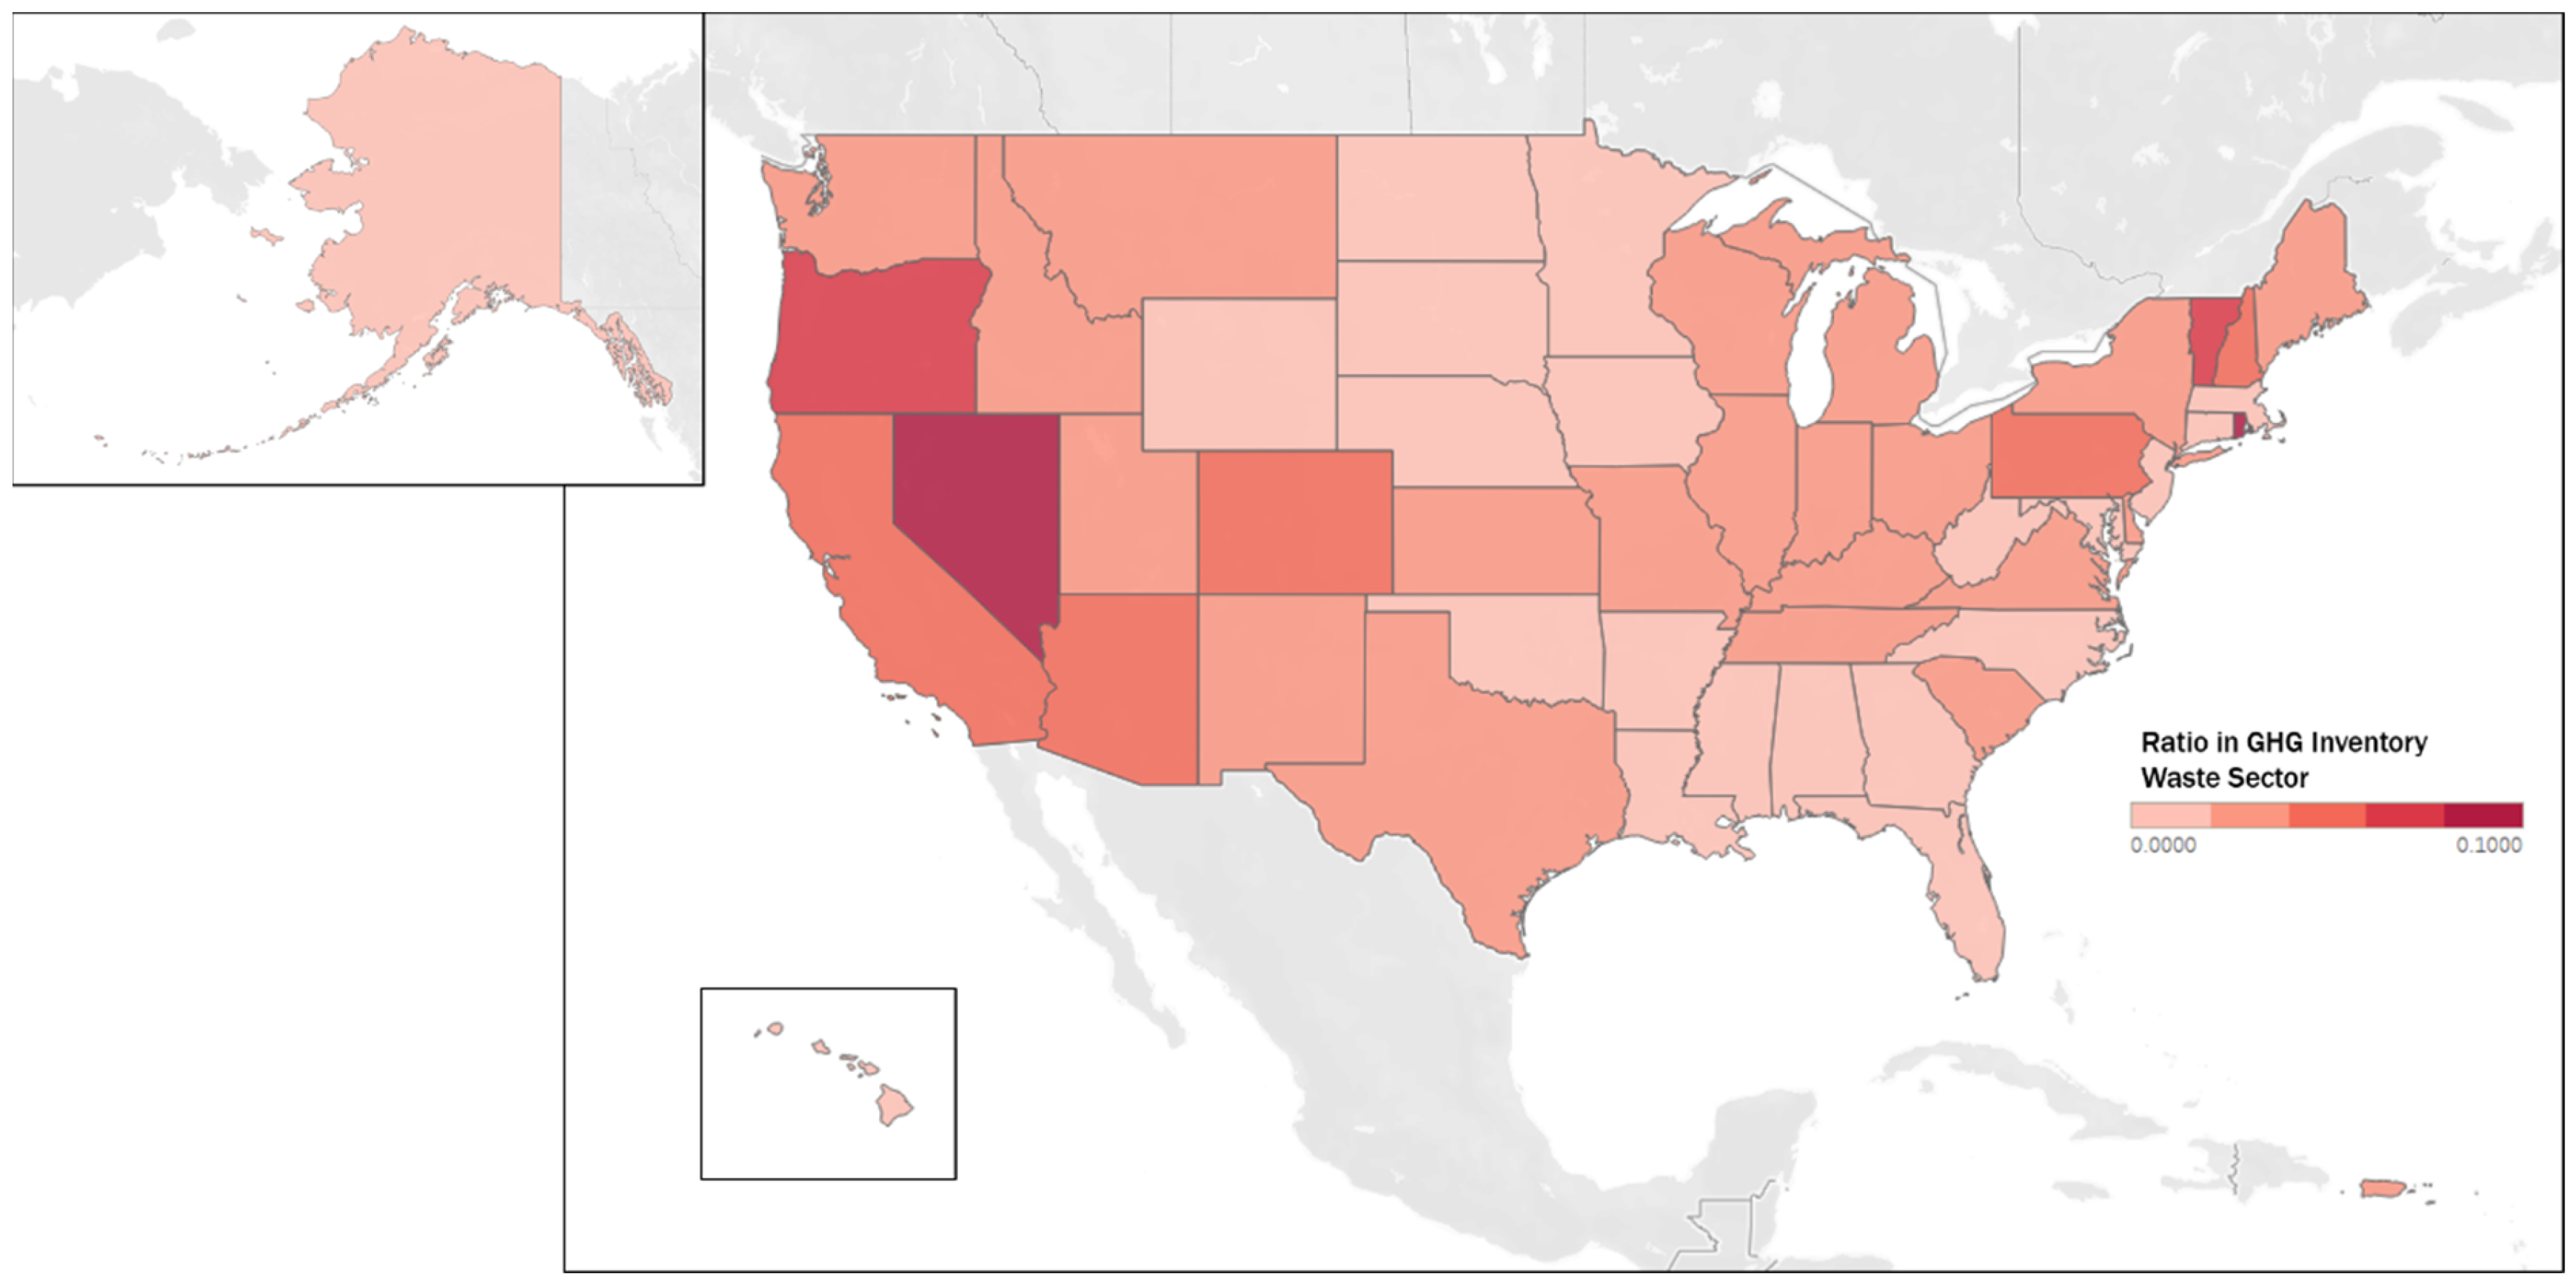
3.3. The Impact of Including N2O Emissions in Greenhouse Gas Inventory

The estimation of landfill N2O emissions is a crucial aspect of overall N2O emissions within the waste sector. In 2020, when accounting for other sources such as wastewater treatment and composting, the total N2O emissions in the waste sector reached 3,164,531 ton-CO2/year. Landfill N2O emissions made a significant contribution to this total, representing 89.41% of the overall emissions (Figure 9a).
The inclusion of landfill N2O emissions resulted in a significant escalation in the growth rate of N2O emissions within the waste sector. To be precise, there was an 843.99% increase compared to the period before the incorporation of landfill emissions. This emphasizes the substantial influence of landfill N2O emissions on the comprehensive greenhouse gas inventory within the waste sector.
Furthermore, when considering the estimation of landfill N2O emissions within the broader context of total N2O emissions across various sectors (including energy, industrial processes, agricultural, LULUCF, and waste) in 2020, which amounted to 27,177,567 ton-CO2/year, the contribution of landfill N2O emissions becomes apparent. Specifically, landfill N2O emissions accounted for 10.41% of the total emissions (Figure 9b). The inclusion of landfill N2O emissions led to an overall growth rate of total N2O emissions of 11.62% compared to before the inclusion of landfill emissions. Additionally, the proportion of N2O emissions to total greenhouse gas emissions increased marginally by 0.11%, rising from 0.94% to 1.04%.
Also, when incorporating the estimation of landfill N2O emissions into the 2020 greenhouse gas emissions, specifically methane (CH4) emissions within the landfill sector, the total emissions amount to 96,982,716 ton-CO2/year, with N2O emissions representing 2.92% of this total (Figure 9c). This results in a growth rate of greenhouse gas emissions in the landfill sector of 3.01% compared to calculations made without considering N2O emissions.
Furthermore, if the estimation of landfill N2O emissions is applied to the 2020 greenhouse gas (CH4, N2O) emissions in the waste sector, the total emission amount to 108,234,085 ton-CO2/year, with N2O emissions from landfills contributing 2.61% to this total (Figure 9d). This results in a growth rate of greenhouse gas emissions in the waste sector of 2.68% compared to calculations made without considering N2O emissions from landfills. Additionally, the proportion of the waste sector in total emissions increases by 0.10%, rising from 4.05% to 4.16%.
If the landfill N2O emissions calculated in this study are applied to the greenhouse gas inventory, the N2O emissions from the waste category in 2020 would amount to 3,147,511 ton-CO2/year (originally 335,240 ton-CO2/year), moving from the 6th to the 3rd position out of 9 categories (power plants, petroleum and natural gas systems, refineries, chemicals, minerals, waste, metals, pulp and paper, other).
When landfill N2O emissions are factored into the greenhouse gas inventory, Figure 10 illustrates the proportion of landfill N2O emissions to the total sector N2O emissions by state. Landfills exert a significant impact on N2O emissions in states with high landfill N2O emissions, highlighting the necessity of considering landfill N2O emissions when establishing greenhouse gas reduction objectives and strategies. Specifically, solutions to reduce the influx of organic matter into landfill sites need to be developed. States like New Hampshire (79.40%), California (74.44%), Rhode Island (73.41%), Idaho (66.28%), Nevada (61.15%), and Delaware (50.48%) exhibit a ratio of landfill N2O emissions to total sector N2O emissions of 50.00% or higher.
When examining landfill N2O emissions within the greenhouse gas inventory, Figure 11 provides a visual representation of the proportion of landfill N2O emissions relative to all greenhouse gas emissions in the waste sector, categorized by state. Given the substantial impact of landfill greenhouse gas emissions on waste management, it becomes crucial to diversify waste treatment methods beyond landfills, such as exploring waste-to-energy initiatives. Rhode Island notably exhibits a high percentage of 26.30%. Additionally, states where landfill N2O emissions account for more than 5.00% include Nevada (8.04%), Vermont (6.23%), Oregon (6.16%), and Arizona (5.46%).
Since the introduction of carbon emissions trading schemes worldwide, greenhouse gas emissions have gained potential as assets that can be traded. As a result, they are economically evaluated and considered in many fields. To assess the N2O emissions estimated in this study using the Kyoto Mechanism, they were converted into emission trade prices by referencing the average clearing price the US Regional Greenhouse Gas Initiative (RGGI) for each respective year. The total cost of emissions from landfill N2O emissions in the United States for 11 years amounts to $137,060,293, with specific figures for each year as follows: $8,076,172 in 2010, $6,003,129 in 2011, $6,295,578 in 2012, $9,887,769 in 2013, $16,852,370 in 2014, $21,566,946 in 2015, $11,785,803 in 2016, $9,563,920 in 2017, $12,740,169 in 2018, $16,159,680 in 2019, and $18,128,755 in 2020.

4. Conclusions

While active landfills are significant contributors to N2O emissions, the quantification of N2O from landfills has historically been overlooked. In this study, this gap was addressed by quantifying N2O emissions from landfills at various entity levels over an 11-year period. Our findings reveal that the average annual landfill N2O emissions from 2010 to 2020 in the United States amounted to 3,214,693 tons of CO2 per year. Despite a decrease in landfill waste across the United States, N2O emissions remain substantial. When considering the approximately 2,000,000 tons of CO2 per year from composting and 300,000 tons of CO2 per year from waste incineration in the calculation of N2O emissions as of 2019, it becomes evident that N2O emissions make a significant contribution. Moreover, landfill N2O emissions represent up to 79.40% of the total N2O emissions in each state in the United States, underscoring the need for careful consideration in greenhouse gas inventory assessments and reduction strategies.
The treatment of organic waste through methods other than landfilling is generally considered more environmentally effective, with composting being a widely regarded alternative due to its ability to reuse organic material in the composting process. However, without accounting for N2O emissions from landfills, assessments of greenhouse gas emissions from alternative treatment methods may inadvertently promote landfilling.
Additionally, the carbon credit associated with landfill N2O emissions holds substantial value, totaling approximately $137,060,293 over 11 years. This value is expected to grow with increases in emission trading prices, highlighting the rising significance of landfill N2O emissions in the waste sector’s value.
Considering these implications, it would be equitable to include N2O emissions from landfills in the waste sector when calculating national greenhouse gas emissions for establishing a greenhouse gas inventory. Doing so would raise concerns about the reduction in N2O emissions from landfills and emphasize the importance of devising measures to reduce emissions.
Our study contributes significantly to theoretical understanding by shedding light on the previously overlooked issue of landfill N2O emissions. By quantifying these emissions over an 11-year period and examining them at various entity levels, we provide valuable insights into the dynamics and trends of N2O emissions from landfills. This contributes to the theoretical framework of waste management and environmental science by expanding our understanding of the sources and impacts of greenhouse gas emissions within the waste sector.
Moreover, our findings have important practical implications for waste management practices and environmental policy. By demonstrating the substantial contribution of landfill N2O emissions to overall greenhouse gas emissions, we highlight the urgency of including these emissions in greenhouse gas reduction strategies. Policymakers must recognize the significance of landfill N2O emissions and prioritize measures to mitigate them. This includes promoting the adoption of alternative waste treatment methods such as composting and waste-to-energy initiatives, which can significantly reduce N2O emissions compared to traditional landfilling.
Furthermore, our study underscores the need for further research into N2O emissions from landfills and their mitigation strategies. While our study provides valuable insights, there are still gaps in our understanding of the factors influencing N2O emissions from landfills and the effectiveness of mitigation measures. Future research in this area can help refine our understanding and inform more targeted and effective policy interventions. By emphasizing the importance of continued research into landfill N2O emissions, our study provides a roadmap for future investigations in this critical area of environmental science and policy. This can contribute to achieving SDGs, especially SDG 11 (Sustainable Cities and Communities), 12 (Responsible Consumption and Production), and 13 (Climate Action).
However, it is important to acknowledge certain limitations in interpreting the results of this study. Firstly, the accuracy and reliability of the data utilized need to be carefully assessed. Discrepancies arise from the inclusion of regional-level landfill wastes in the Greenhouse Gas Reporting Program (GHGRP) data conducted by the EPA, potentially impacting the accuracy of calculations. To obtain more precise results, follow-up studies are necessary, considering various factors such as the quantity, area, duration, and method of landfilling for each landfill facility.
Moreover, significant fluctuations in emissions can occur during the calculation process due to variations in emission coefficients. While this study utilized N2O emission coefficients from organic waste treatment and aeration landfills approved by the CDM methodology, it is essential to acknowledge the complexity of N2O generation in landfills, influenced by various factors. Currently, there is a lack of comprehensive studies on this matter, and international guidelines for calculation are absent. Therefore, achieving the most accurate emissions estimates may require developing inventory-based emission coefficients tailored to specific country conditions and landfill characteristics. Establishing international calculation guidelines through experimental studies on N2O generation reactions in landfill facilities is crucial to this end.

Author Contributions

Conceptualization, Y.N. and K.B.; Methodology, Y.N. and K.B.; Software, Y.N. and K.B.; Validation, Y.N. and K.B.; Formal analysis, Y.N. and K.B.; Investigation, Y.N. and K.B.; Resources, K.B.; Data curation, Y.N. and K.B.; Writing – original draft, Y.N. and K.B.; Writing – review & editing, Y.N. and K.B.; Visualization, Y.N. and K.B.; Supervision, K.B.; Project administration, K.B.; Funding acquisition, K.B. All authors have read and agreed to the published version of the manuscript.

Funding

This work was supported by Incheon National University Research Grant in 2021.

Data Availability Statement

The raw data supporting the conclusions of this article will be made available by the authors on request.

Conflicts of Interest

The authors declare no conflict of interest.

References

  1. Allen, M.R.; Braithwaite, A.; Hills, C.C. Trace Organic Compounds in Landfill Gas at Seven U.K. Waste Disposal Sites. Environ. Sci. Technol. 1997, 31, 1054–1061. [Google Scholar] [CrossRef]
  2. Gautam, K.; Pandey, N.; Yadav, D.; Parthasarathi, R.; Turner, A.; Anbumani, S.; Jha, A.N. Ecotoxicological impacts of landfill sites: Towards risk assessment, mitigation policies and the role of artificial intelligence. Sci. Total Environ. 2024, 927, 171804. [Google Scholar] [CrossRef] [PubMed]
  3. Guo, H.; Xu, H.; Liu, J.; Nie, X.; Li, X.; Shu, T.; Bai, B.; Ma, X.; Yao, Y. Greenhouse Gas Emissions in the Process of Landfill Disposal in China. Energies 2022, 15, 6711. [Google Scholar] [CrossRef]
  4. Ham, R.K.; Norman, M.R.; Fritschel, P.R. Chemical Characterization of Fresh Kills Landfill Refuse and Extracts. J. Environ. Eng. 1993, 119, 1176–1195. [Google Scholar] [CrossRef]
  5. Ito, A.; Takahashi, I.; Nagata, Y.; Chiba, K.; Haraguchi, H. Spatial and temporal characteristics of urban atmospheric methane in Nagoya City, Japan: An assessment of the contribution from regional landfills. Atmos. Environ. 2001, 35, 3137–3144. [Google Scholar] [CrossRef]
  6. Lee, N.H.; Song, S.H.; Jung, M.J.; Kim, R.H.; Park, J.K. Dynamic emissions of N2O from solid waste landfills: A review. Environ. Eng. Res. 2023, 28, 220630. [Google Scholar] [CrossRef]
  7. Manheim, D.C.; Yeşiller, N.; Hanson, J.L. Gas Emissions from Municipal Solid Waste Landfills: A Comprehensive Review and Analysis of Global Data. J. Indian Inst. Sci. 2021, 101, 625–657. [Google Scholar] [CrossRef]
  8. Park, J.W.; Shin, H.C. Surface emission of landfill gas from solid waste landfill. Atmos. Environ. 2001, 35, 3445–3451. [Google Scholar] [CrossRef]
  9. Son, Y.-S.; Kim, J.-C.; Kim, K.-H.; Lim, B.-A.; Park, K.-N.; Lee, W.-K. The Composition of Odor Compounds Emitted from Municipal Solid Waste Landfill. J. Korean Soc. Atmos. Environ. 2007, 23, 666–674. [Google Scholar] [CrossRef]
  10. Abiriga, D.; Vestgarden, L.S.; Klempe, H. Groundwater contamination from a municipal landfill: Effect of age, landfill closure, and season on groundwater chemistry. Sci. Total Environ. 2020, 737, 140307. [Google Scholar] [CrossRef]
  11. Dagwar, P.P.; Dutta, D. Landfill leachate a potential challenge towards sustainable environmental management. Sci. Total Environ. 2024, 926, 171668. [Google Scholar] [CrossRef] [PubMed]
  12. Iravanian, A.; Ravari, S.O. Types of Contamination in Landfills and Effects on The Environment: A Review Study. IOP Conf. Ser. Earth Environ. Sci. 2020, 614, 012083. [Google Scholar] [CrossRef]
  13. OECD. Stat: Municipal Waste, Generation and Treatment. 2024. Available online: https://stats.oecd.org/index.aspx?DataSetCode=MUNW# (accessed on 22 March 2024).
  14. Ezyske, C.M.; Deng, Y. Landfill Management and Remediation Practices in New Jersey, United States. In Management of Organic Waste; Montclair State University: Montclair, NJ, USA, 2012. [Google Scholar] [CrossRef]
  15. Hanson, D.L.; Caponi, F.R. US landfill disposal: The big picture. J. Munic. Waste Prof. 2008, 18, 297–336. [Google Scholar]
  16. Powell, J.T.; Pons, J.C.; Chertow, M. Waste Informatics: Establishing Characteristics of Contemporary U.S. Landfill Quantities and Practices. Environ. Sci. Technol. 2016, 50, 10877–10884. [Google Scholar] [CrossRef] [PubMed]
  17. Bowman, J. The Methanotrophs—The Families Methylococcaceae and Methylocystaceae. Prokaryotes 2006, 266–289. [Google Scholar] [CrossRef] [PubMed]
  18. Gebert, J.; Groengroeft, A. Passive landfill gas emission—Influence of atmospheric pressure and implications for the operation of methane-oxidising biofilters. Waste Manag. 2006, 26, 245–251. [Google Scholar] [CrossRef] [PubMed]
  19. Hanson, R.S.; Hanson, T.E. Methanotrophic bacteria. Microbiol. Rev. 1996, 60, 439–471. [Google Scholar] [CrossRef] [PubMed]
  20. Zhang, C.; Xu, T.; Feng, H.; Chen, S. Greenhouse Gas Emissions from Landfills: A Review and Bibliometric Analysis. Sustainability 2019, 11, 2282. [Google Scholar] [CrossRef]
  21. Scheutz, C.; Kjeldsen, P.; Bogner, J.E.; Visscher ADe Gebert, J.; Hilger, H.A.; Huber-Humer, M.; Spokas, K. Microbial methane oxidation processes and technologies for mitigation of landfill gas emissions. Waste Manag. Res. 2009, 27, 409–455. [Google Scholar] [CrossRef]
  22. Barlaz, M.A.; Green, R.B.; Chanton, J.P.; Goldsmith, C.D.; Hater, G.R. Evaluation of a Biologically Active Cover for Mitigation of Landfill Gas Emissions. Environ. Sci. Technol. 2004, 38, 4891–4899. [Google Scholar] [CrossRef]
  23. Reinhart, D.R.; Cooper, D.C.; Walker, B.L. Flux Chamber Design and Operation for the Measurement of Municipal Solid Waste Landfill Gas Emission Rates. J. Air Waste Manag. Assoc. 2012, 42, 1067–1070. [Google Scholar] [CrossRef]
  24. Scheutz, C.; Kjeldsen, P. Guidelines for landfill gas emission monitoring using the tracer gas dispersion method. Waste Manag. 2019, 85, 351–360. [Google Scholar] [CrossRef] [PubMed]
  25. IPCC. Climate Change 2014: Synthesis Report; IPCC: Geneva, Switzerland, 2014. [Google Scholar]
  26. Kirchmann, H.; Widen, P. Separately collected organic household wastes. Chemical composition and composting characteristics. Swed. J. Agric. Res. 1994, 24, 3–12. [Google Scholar]
  27. Schenk, M.K.; Appel, S.; Daum, D. N2O emissions during composting of organic waste (Refereed)). Acta Hortic. 1997, 450, 262. [Google Scholar] [CrossRef]
  28. Daskalopoulos, E.; Badr, O.; Probert, S.D. Municipal solid waste: A prediction methodology for the generation rate and composition in the European Union countries and the United States of America. Resour. Conserv. Recycl. 1998, 24, 155–166. [Google Scholar] [CrossRef]
  29. Wang, X.; Jia, M.; Zhang, H.; Pan, S.; Kao, C.M.; Chen, S. Quantifying N2O emissions and production pathways from fresh waste during the initial stage of disposal to a landfill. Waste Manag. 2017, 63, 3–10. [Google Scholar] [CrossRef]
  30. Rinne, J.; Pihlatie, M.; Lohila, A.; Thum, T.; Aurela, M.; Tuovinen, J.-P.; Laurila, T.; Vesala, T. Nitrous Oxide Emissions from a Municipal Landfill. Environ. Sci. Technol. 2005, 39, 7790–7793. [Google Scholar] [CrossRef]
  31. Börjesson, G.; Svensson, B.H. Nitrous oxide emissions from landfill cover soils in Sweden. Tellus Ser. B Chem. Phys. Meteorol. 1997, 49, 357–363. [Google Scholar] [CrossRef]
  32. Harborth, P.; Fuß, R.; Münnich, K.; Flessa, H.; Fricke, K. Spatial variability of nitrous oxide and methane emissions from an MBT landfill in operation: Strong N2O hotspots at the working face. Waste Manag. 2013, 33, 2099–2107. [Google Scholar] [CrossRef]
  33. Tsujimoto, Y.; Masuda, J.; Fukuyama, J.; Ito, H. N2O emissions at solid waste disposal sites in Osaka City. J. Air Waste Manag. Assoc. 1994, 44, 1313–1314. [Google Scholar] [CrossRef]
  34. IPCC. IPCC Expert Meeting for Technical Assessment of IPCC Inventory Guidelines (Energy, IPPU, Waste Sectors); IPCC: Geneva, Switzerland, 2015. [Google Scholar]
  35. U.S. Environmental Protection Agency. Inventory of U.S. Greenhouse Gas Emissions and Sinks: 1990–2019; U.S. Environmental Protection Agency: Washington, DC, USA, 2021.
  36. Zhou, D.; Meinke, H.; Wilson, M.; Marcelis, L.F.M.; Heuvelink, E. Towards Delivering on the Sustainable Development Goals in Greenhouse Production Systems. Resour. Conserv. Recycl. 2021, 169, 105379. [Google Scholar] [CrossRef]
  37. Yaman, C.; Anil, I.; Alagha, O. Potential for Greenhouse Gas Reduction and Energy Recovery from MSW through Different Waste Management Technologies. J. Clean. Prod. 2020, 264, 121432. [Google Scholar] [CrossRef]
  38. Calderón Márquez, A.J.; Cassettari Filho, P.C.; Rutkowski, E.W.; de Lima Isaac, R. Landfill Mining as a Strategic Tool towards Global Sustainable Development. J. Clean. Prod. 2019, 226, 1102–1115. [Google Scholar] [CrossRef]
  39. Ali, S.M.; Appolloni, A.; Cavallaro, F.; D’Adamo, I.; Di Vaio, A.; Ferella, F.; Gastaldi, M.; Ikram, M.; Kumar, N.M.; Martin, M.A.; et al. Development Goals towards Sustainability. Sustainability 2023, 15, 9443. [Google Scholar] [CrossRef]
  40. IPCC. Climate Change 2007 Synthesis Report; IPCC: Geneva, Switzerland, 2007. [Google Scholar]
  41. United Nations Framework Convention on Climate Change. Approved Baseline and Monitoring Methodology AM0083 “Avoidance of Landfill Gas Emissions by In-Situ Aeration of Landfills”; United Nations Framework Convention on Climate Change: Bonn, Germany, 2009.
  42. Ritchie, H.; Roser, M. CO2 and Greenhouse Gas Emissions. Our World in Data. 11 May 2020. Available online: https://ourworldindata.org/co2-and-other-greenhouse-gas-emissions (accessed on 24 March 2024).
  43. Mudhoo, A.; Sewhoo, B.; Mohee, R.; Gurjar, B.R. Greenhouse gas emissions reductions from in-situ aeration in a landfill: A multi-parameter sensitivity analysis approach. J. Environ. Inform. 2013, 22, 78–91. [Google Scholar] [CrossRef]
  44. IPCC. 2006 IPCC Guidelines for National Greenhouse Gas Inventories Volume 5: Waste Chapter 3: Solid Waste Disposal; IPCC: Geneva, Switzerland, 2006. [Google Scholar]
  45. IPCC. IPCC Second Assessment Climate Change 1995; IPCC: Geneva, Switzerland, 1995. [Google Scholar]
  46. U.S. Environmental Protection Agency. Landfill Technical Data; U.S. Environmental Protection Agency: Washington, DC, USA, 2021. Available online: https://www.epa.gov/lmop/landfill-technical-data (accessed on 23 March 2024).
  47. Hassan, S.H.; Halim, A.A.; Yusoff, M.S.; Wang, L.K.; Wang, M.-H.S. Legislation for Solid Waste Management. In Solid Waste Engineering and Management: Volume 1; Spring: Berlin/Heidelberg, Germany, 2021; pp. 85–141. [Google Scholar] [CrossRef]
  48. Contreras, M.; Gázquez, M.J.; Romero, M.; Bolívar, J.P. Recycling of industrial wastes for value-added applications in clay-based ceramic products: A global review (2015–19). New Mater. Civ. Eng. 2020, 155–219. [Google Scholar] [CrossRef]
  49. ReFED. A Roadmap to Reduce U.S. Food Waste by 20 Percent. 2016. Available online: https://refed.org/downloads/ReFED_Report_2016.pdf (accessed on 23 March 2024).
  50. Yang, X.; Choi, H.S.; Park, C.; Kim, S.W. Current states and prospects of organic waste utilization for biorefineries. Renew. Sustain. Energy Rev. 2015, 49, 335–349. [Google Scholar] [CrossRef]
  51. Burns & McDonnell 2013 Statewide Waste Characterization, St. Paul 2013, MN. Available online: https://www.pca.state.mn.us/sites/default/files/w-sw1-60.pdf (accessed on 1 March 2024).
  52. Pennsylvania Department of Environmental Protection. Statewide Waste Composition Study; Pennsylvania Department of Environmental Protection: Harrisburg, PA, USA, 2018.
  53. Iowa Department of Natural Resources. Iowa Statewide Waste Characterization Study 2017; Iowa Department of Natural Resources: Des Moines, IA, USA, 2017.
  54. Delaware Solid Waste Authority Statewide Waste Characterization Study, FY 2016. 2017. Available online: https://dswa.com/wp-content/uploads/2017/02/Final-Report-DSWA-Waste-Characterization-FY-2016-January-2017.pdf (accessed on 21 February 2024).
  55. Economic Impact of Recycling in Alabama and Opportunities for Growth. 2012. Available online: http://adem.alabama.gov/programs/land/landforms/CompleteEconomicsOfRecyclingAlabamaReport.pdf (accessed on 22 February 2024).
  56. Economic Impact Potential and Characterization of Municipal Solid Waste in Michigan 2016. Available online: https://www.michigan.gov/-/media/Project/Websites/egle/Documents/Programs/draft/480236-14-WMSBF-waste-characterization-report.PDF?rev=ae29ca79e78e4b93861ecc9efc34cd08 (accessed on 22 February 2024).
  57. Fairbanks North Star Borough Recycling Plan & Analysis. 2015. Available online: https://www.fnsb.gov/DocumentCenter/View/1262/2015-PDC-Recycling-Plan-and-Analysis-PDF (accessed on 23 February 2024).
  58. Illinois Commodity/Waste Generation and Characterization Study Update. 2015. Available online: https://illinoisrecycles.org/wp-content/uploads/2014/10/2015-Waste-Characterization-Update-FINAL.pdf (accessed on 24 February 2024).
  59. Abramowitz, H.; Sun, Y. Municipal solid waste characterization study for Indiana. In Theses and Dissertations Available from ProQuest; Purdue University: West Lafayette, IN, USA, 2012. [Google Scholar]
  60. Rhode Island Solid Waste Characterization Study. 2015. Available online: https://www.rirrc.org/sites/default/files/2017-02/WasteCharacterizationStudy2015.pdf (accessed on 23 March 2024).
  61. U.S. Environmental Protection Agency. Advancing Sustainable Materials Management: 2018 Tables and Figures; U.S. Environmental Protection Agency: Washington, DC, USA, 2020.
  62. US Census. City and Town Population Totals: 2010–2019; US Census: Suitland, MD, USA, 2021. Available online: https://www.census.gov/data/tables/time-series/demo/popest/2010s-total-cities-and-towns.html (accessed on 21 March 2024).
  63. US Census. State Area Measurements and Internal Point Coordinates; US Census: Suitland, MD, USA, 2021. Available online: https://www.census.gov/geographies/reference-files/2010/geo/state-area.html (accessed on 22 March 2024).
  64. US Census. Understanding the Population of the U.S. Virgin Islands; US Census: Suitland, MD, USA, 2021.
  65. US Census. State Population Totals and Components of Change: 2010–2019; US Census: Suitland, MD, USA, 2021. Available online: https://www.census.gov/data/tables/time-series/demo/popest/2010s-state-total.html (accessed on 22 March 2024).
  66. Environmental Research & Education Foundation. Analysis of MSW Landfill Tipping Fees-April 2019; Environmental Research & Education Foundation: Raleigh, NC, USA, 2020. [Google Scholar]
  67. Zero Waste Strategies. Road to Zero Waste Plan. 2013. Available online: http://www.zerowasteassociates.com (accessed on 24 March 2024).
  68. Bogner, J.E.; Spokas, K.A.; Chanton, J.P. Seasonal Greenhouse Gas Emissions (Methane, Carbon Dioxide, Nitrous Oxide) from Engineered Landfills: Daily, Intermediate, and Final California Cover Soils. J. Environ. Qual. 2011, 40, 1010–1020. [Google Scholar] [CrossRef]
  69. U.S. Environmental Protection Agency. Municipal Solid Waste Generation, Recycling, and Disposal in the United States: Facts and Figures; U.S. Environmental Protection Agency: Washington, DC, USA, 2014.
  70. Interface. A Look Back: Interface’s Sustainability Journey. 2019. Available online: https://www.interface.com.cn/page/interfacestory (accessed on 25 February 2024).
  71. Blair, J.; Mataraarachchi, S. A Review of Landfills, Waste and the Nearly Forgotten Nexus with Climate Change. Environments 2021, 8, 73. [Google Scholar] [CrossRef]
  72. Lee, U.; Han, J.; Wang, M. Evaluation of landfill gas emissions from municipal solid waste landfills for the life-cycle analysis of waste-to-energy pathways. J. Clean. Prod. 2017, 166, 335–342. [Google Scholar] [CrossRef]
  73. Angeles, L.; Karadimas, N.V.; Loumos, V.G. GIS-based modelling for the estimation of municipal solid waste generation and collection. Waste Manag. Res. 2008, 26, 337–346. [Google Scholar] [CrossRef] [PubMed]
  74. Matsunaga, K.; Themelis, N.J. Effects of affluence and population density on waste generation and disposal of municipal solid wastes. Earth Eng. Cent. Rep. 2002, 1, 1–29. Available online: https://www.researchgate.net/publication/228908198 (accessed on 26 February 2024).
  75. Vijay, R.; Gupta, A.; Kalamdhad, A.S.; Devotta, S. Estimation and allocation of solid waste to bin through geographical information systems. Waste Manag. Res. 2005, 23, 479–484. [Google Scholar] [CrossRef] [PubMed]
  76. Abdel-Shafy, H.I.; Mansour, M.S.M. Solid waste issue: Sources, composition, disposal, recycling, and valorization. Egypt. J. Pet. 2018, 27, 1275–1290. [Google Scholar] [CrossRef]
  77. OECD. Working Group on Waste Prevention and Recycling EPR Policies and Product Design: Economic Theory and Selected Case Studies. 2006. Available online: www.oecd.org/env/waste (accessed on 22 March 2024).
  78. Duan, Z.; Scheutz, C.; Kjeldsen, P. Trace gas emissions from municipal solid waste landfills: A review. Waste Manag. 2021, 119, 39–62. [Google Scholar] [CrossRef]
  79. Huang, D.; Du, Y.; Xu, Q.; Ko, J.H. Quantification and control of gaseous emissions from solid waste landfill surfaces. J. Environ. Manag. 2022, 302, 114001. [Google Scholar] [CrossRef]
Figure 1. Location of Landfills in the United States and Population by State: The population of each state in 2018 (color) and the locations of each landfill (dot).
Sustainability 16 04810 g001
Figure 2. Annual Landfill Acceptance Waste and Landfill N2O Emission—National Level (2010~2020): The annual landfilled waste (blue) and the corresponding calculated N2O emissions (orange) in the United States from 2010 to 2020.
Sustainability 16 04810 g002
Figure 3. Landfill N2O Emission by Waste Type—National Level (2018): The proportion of N2O emissions from landfilled wastes in the U.S. in 2018 by type.
Sustainability 16 04810 g003
Figure 4. The Top 30 States of Annual Landfill N2O Emission (2020): The top 30 states estimated to have had the highest N2O emissions in 2020.
Sustainability 16 04810 g004
Figure 5. Landfill N2O Emission by Annual Landfill Acceptance Waste (2010~2020): Total U.S. N2O emissions (bar) and N2O emissions by state (color) from 2010 to 2020.
Sustainability 16 04810 g005
Figure 6. Landfill N2O Emission by Annual Acceptance Waste per Capita—State Level (2020): N2O emissions by state per capita in 2020 (Color).
Sustainability 16 04810 g006
Figure 7. 2010~2020 Landfill N2O Emission Increase Rate—State Level: Degree (slope) of increase in N2O emissions in the landfill sector between 2010 and 2020.
Sustainability 16 04810 g007
Figure 8. Landfill N2O Emission by Annual Acceptance Waste—Facility Level (2020): Emissions (color and size of dots) for each landfill facility in 2020 and the number of people by city in 2018 (background color).
Sustainability 16 04810 g008
Figure 9. Ratio of Landfill N2O Emission in Greenhouse Gas Inventory in 2020: (a) Ratio of Landfill N2O Emissions to N2O Emissions in the Waste Sector, (b) Ratio of Landfill N2O Emissions to N2O Emissions in All Sector, (c) Ratio of Landfill N2O Emissions to Landfill Greenhouse Gas Emissions, (d) Ratio of Landfill N2O Emissions to Greenhouse Gas Emissions in the Waste Sector.
Sustainability 16 04810 g009
Figure 10. Ratio of Landfill N2O Emission to N2O Emission in Greenhouse Gas Inventory—State Level (2020): Assuming that the landfill N2O emission calculated in this study is applied to the greenhouse gas inventory, the ratio of N2O emission in the landfill sector to the total N2O emission in the U.S. greenhouse gas inventory in 2020.
Sustainability 16 04810 g010
Figure 11. Ratio of Landfill N2O Emission to Waste Sector in Greenhouse Gas Inventory—State Level (2020): Assuming that the landfill N2O emissions calculated in this study are applied to the greenhouse gas inventory, the ratio of the landfill N2O emissions to the total greenhouse gas (e.g., CO2, CH4, N2O) emissions in the US greenhouse gas inventory waste sector in 2020.
Sustainability 16 04810 g011
Table 1. Variables Used to Calculate N2O Emissions.
VariablesMeaningUnitReferencesApplied Value
aPlanned minimum stabilization period of the landfillyearsMudhoo et al. (2013) [43]5.5
WiTotal amount of landfill waste in landfill category iton
RORatio of organic waste to total landfill waste%
EF1N2O emission coefficient for landfilled organic wasteTon-N2O/ton-waste2006 IPCC GL [44]0.00024
EF2N2O emission coefficient for landfill aeration and stabilizationTon-N2O/ton-wasteCDM AM0083 [41]0.000027
GWPN2OGlobal warming potential of N2OTon-CO2eq/ton-N2OIPCC Second Assessment Report [45]310
Table 2. The Ratio of Organic and Inorganic Waste by State.
StateOrganic Ratio (%)Items Included in Organic MatterReported Year
U.S. Average62.5Paper, Rubber, Leather, Textile, Wood, Food Waste, Yard Trimming2018
Alaska66.10Paper, Rubber, Leather, Textile, Wood, Food Waste, Yard Trimming2015
Alabama70.40Paper, Yard Waste, Wood, Food Waste, Textiles, Diapers, Fines, Other Organics2012
Colorado56.30Paper, Food Waste, Yard Waste, Clean Wood, Other Organics2018
Delaware61.13Paper, Vegetative Food Waste, Protein Food Waste, Food Waste in Plastic Packaging, Food Waste in Other Packaging, Leaves, Grass, Brush, Branches and Stumps, Textiles, Rubber/Leather, Diapers and Sanitary Products, Carpet and Carpet Padding, Remainder/Composite Organic2017
Iowa55.80Paper, Food Waste, Textiles and Leather, Diapers, Rubber2017
Illinois61.10Paper, Textile, Yard Waste, Food Scraps, Bottom Fines and Dirt, Diapers, Other Organic2015
Indiana65.26Paper, Textile, Leather, Rubber, Wood, Food Waste, Yard Trimming, Diapers, Fines2012
Michigan61.36Paper, Textile, Food Waste, Yard Waste, Soil, Wood, Other Organics2016
Minnesota58.15Paper, Textile, Leather, Yard Waste, Food Waste, Wood, Other Organic Material2013
Missouri62.71Paper, Textile, Food Waste, Wood, Disposable Diapers and Sanitary Prod., Yard Waste, Remainder/Composite Organic2018
Rhode Island56.90Paper, Textile, Branches and Stumps > 2 inches, Leaf and Yard Debris, Clean Dimensional Lumber, Vegetative Food Waste, Protein Food Waste, Other Organics2015
Disclaimer/Publisher’s Note: The statements, opinions and data contained in all publications are solely those of the individual author(s) and contributor(s) and not of MDPI and/or the editor(s). MDPI and/or the editor(s) disclaim responsibility for any injury to people or property resulting from any ideas, methods, instructions or products referred to in the content.

