
Evaluation of Groundwater Resources in the Qeft Area of Egypt: A Geophysical and Geochemical Perspective

Abstract
:1. Introduction
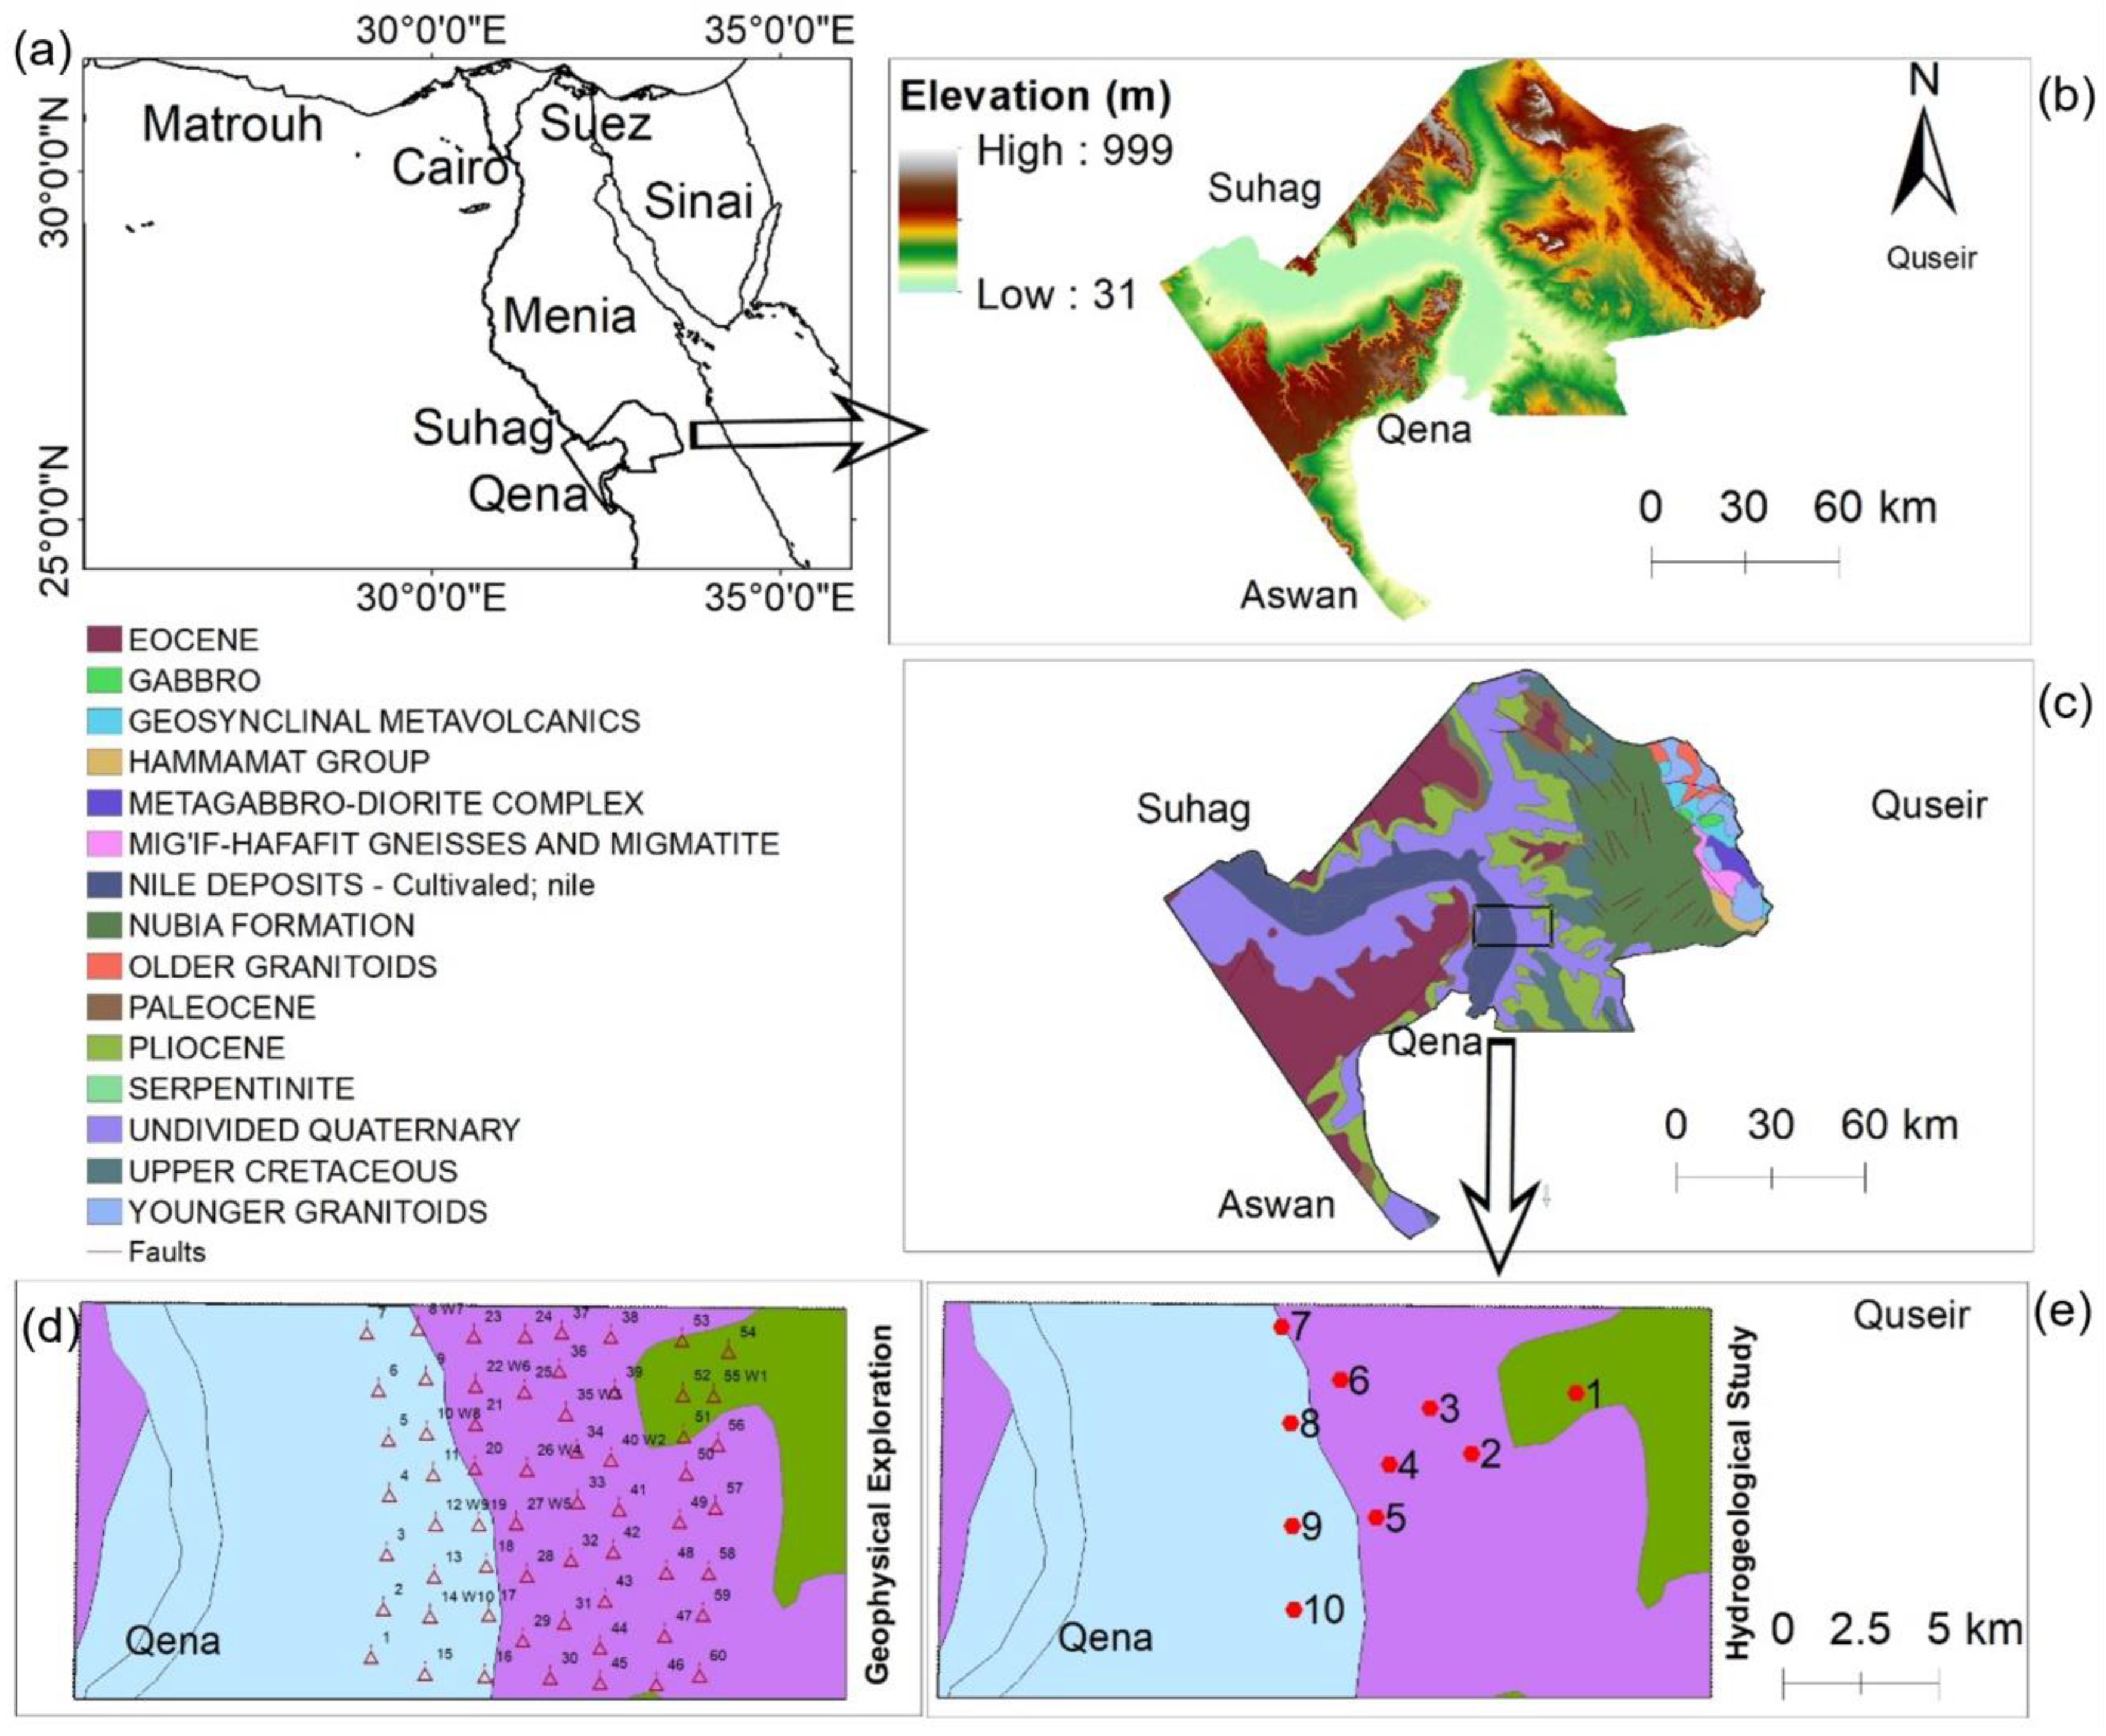
2. Study Area
3. Materials and Methods
3.1. Geophysical Exploration
3.2. Water Sampling and Analytical Techniques
3.3. Assessment and Evaluation
4. Results
4.1. Geophysical Exploration
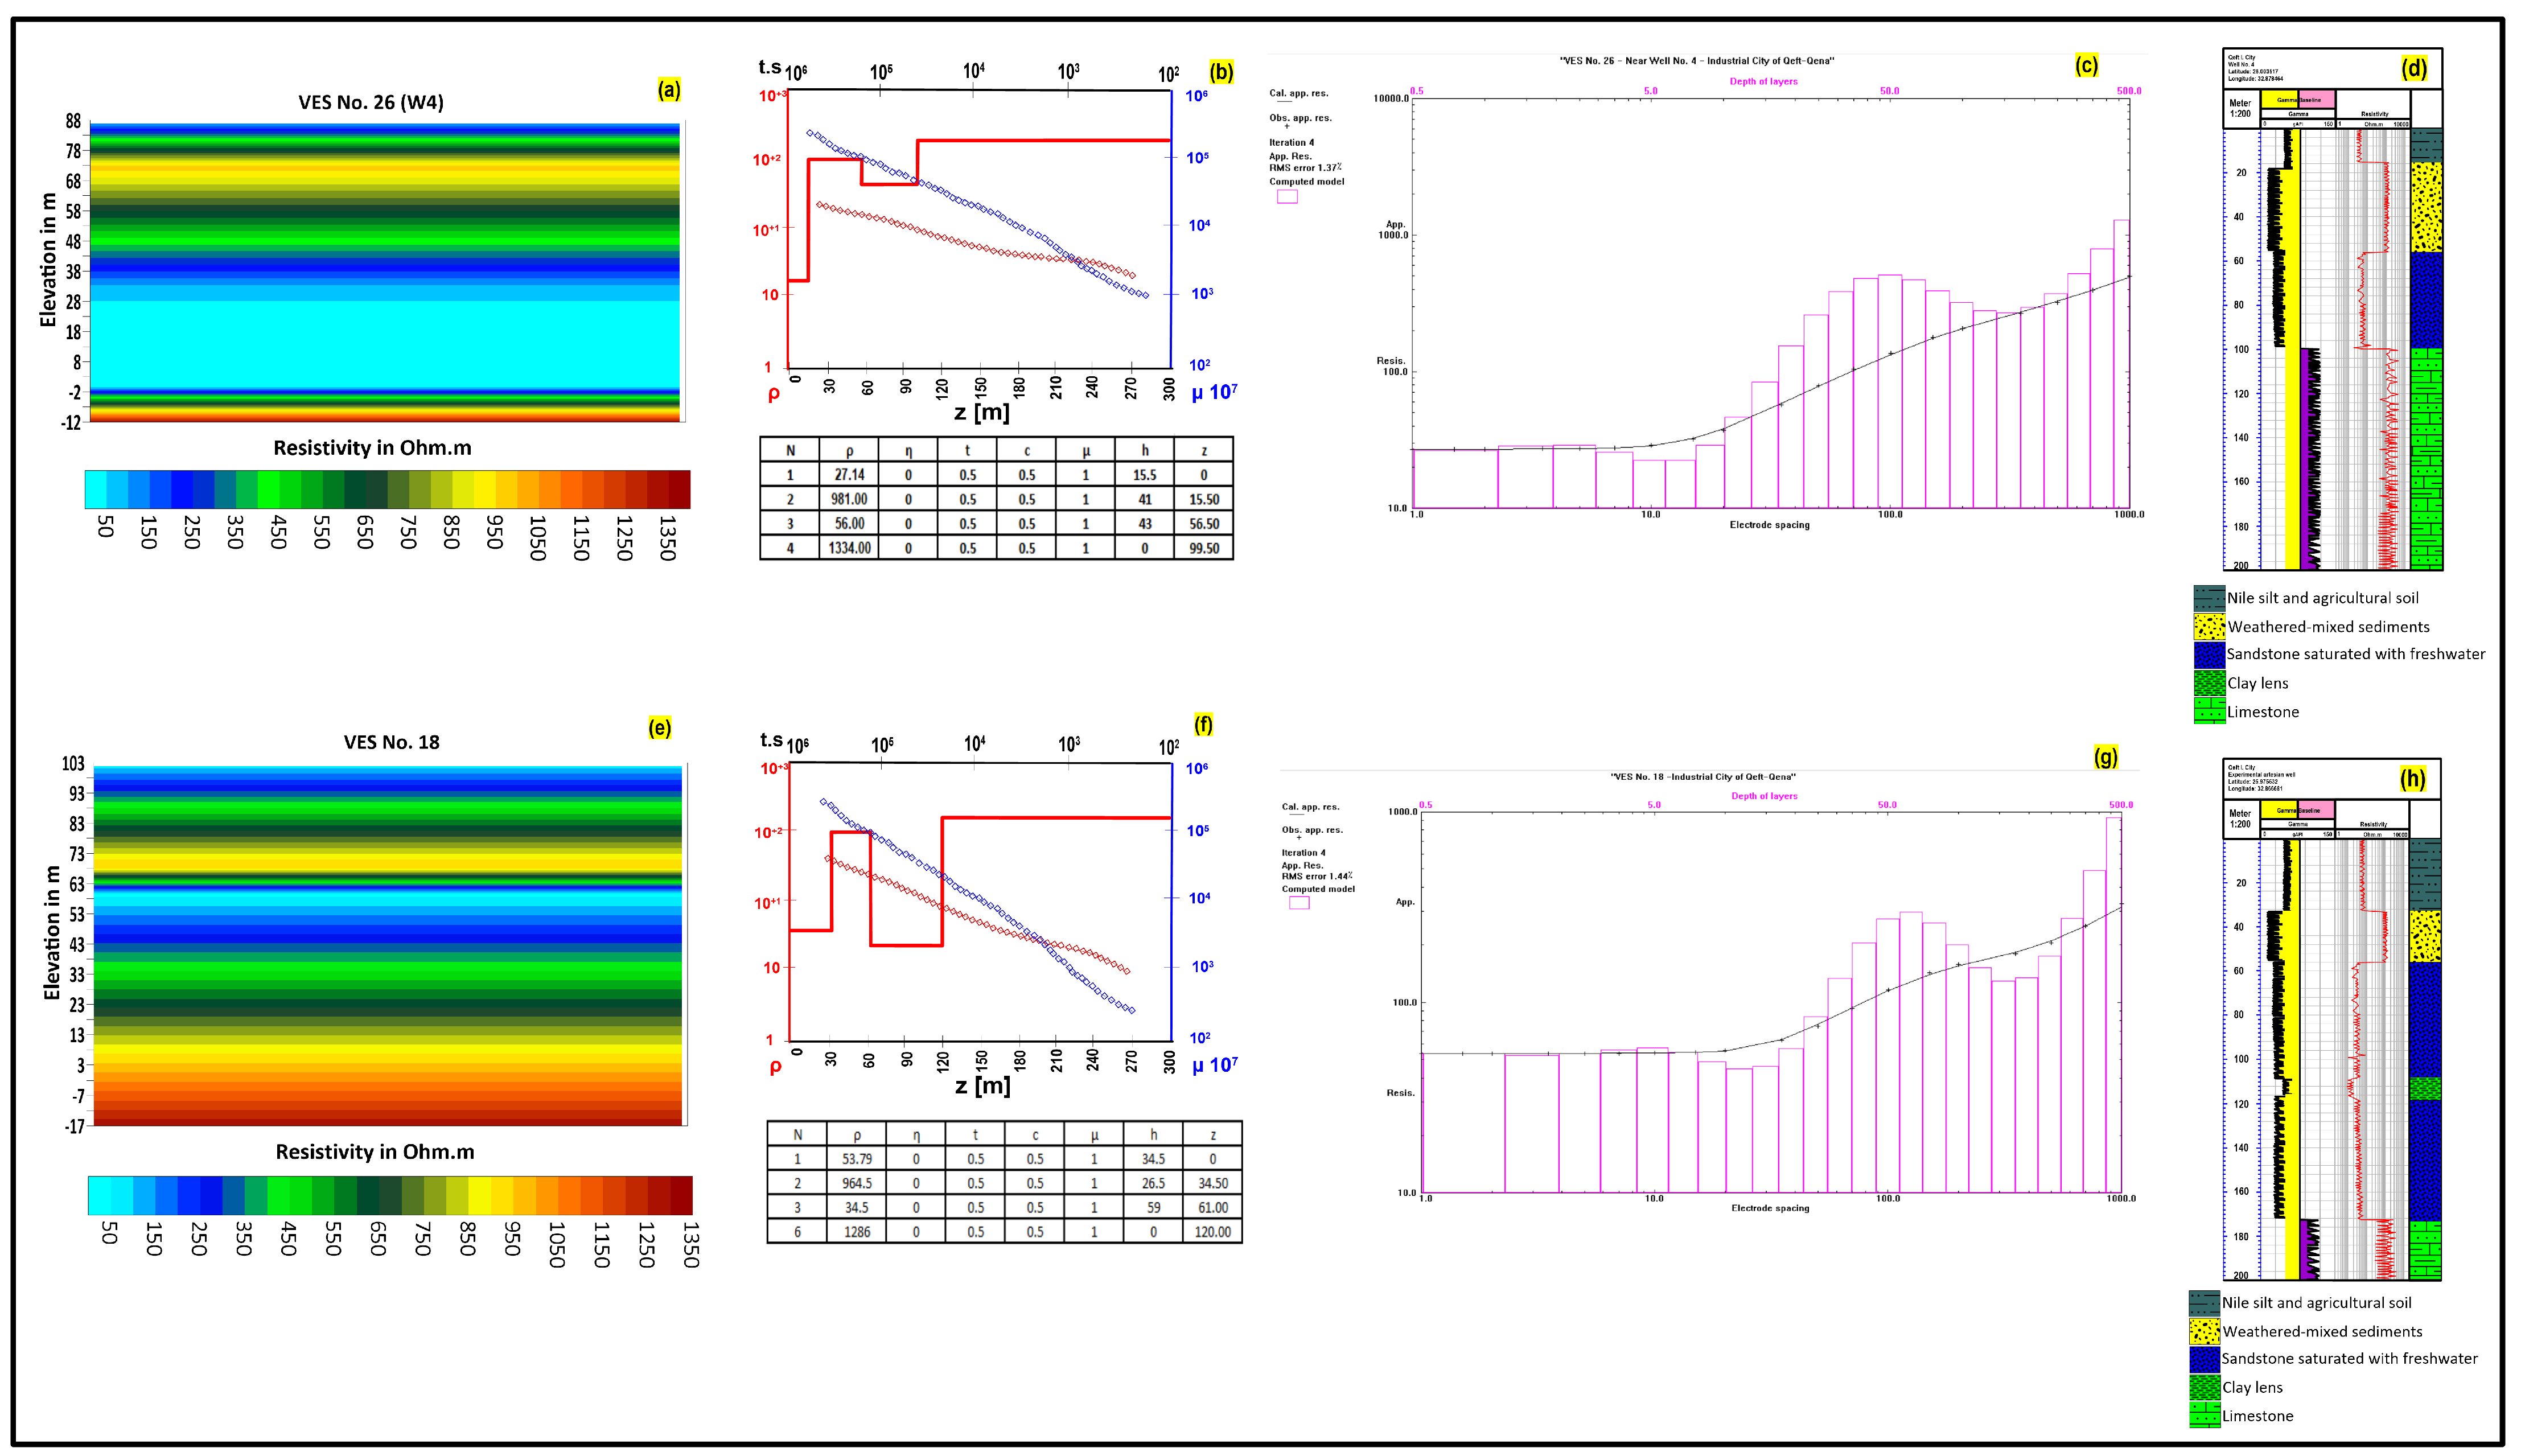
4.1.1. Subsurface Layer Sequance
- The first and topmost layer covers the entire study area. The surface altitude (Figure 3a) decreases from 127 m above sea level in the northeast to 72 in the west near the Nile, representing the natural topographic gradient of this area. This layer is divided based on its resistivity values into sublayers a and b. Layer 1a has resistivity values ranging from 16 Ω∙m to 64 Ω∙m and covers the western portion of the study area. Layer 1a consists of Nile silt and fine sand and was formed by successive annual floods of the Nile, with thicknesses ranging from 7 m to 41 m. The resistivity values of layer 1b in the eastern part of the study area vary from 333 Ω∙m to 711 Ω∙m. (Figure 3b). The relatively high resistivity values represent layers of unreclaimed soil with thicknesses ranging from 5 m to 42 m (Figure 3c).
- The second layer reaches its greatest depth, 42 m, in the northern and northeastern parts of the study area, as well as below VES station No. 18, and its shallowest depth, 4 m, in the southeastern part below VES station No. 47 (Figure 3d) because the thickness of the surface layer is less in the stream valleys. The recorded resistivity values of this layer oscillate between 738 Ω∙m and 1112 Ω∙m (Figure 3e), and its thickness gradually decreases from 51 m in the eastern part to 7 m in the western part of the study area (Figure 3f). This layer consists of a mixture of weathering sediments and valley sediments as gravelly sand.
- The third geoelectric layer is the water-bearing layer, consisting of a shallow aquifer formed by Quaternary alluvial deposits. It increases in depth from 20 m in the west to 93 m in the east (Figure 3g). Resistivity ranges from 18 Ω∙m to 120 Ω∙m (Figure 3h). The resistivity of this layer varies due to the diversity of its components, which include sand, gravel, boulders, and some clay lenses, as recorded through piezometers. The thickness of this water-bearing layer increases from 42 m upstream (in the east) to approximately 90 m downstream (in the west), with an average thickness of 60 m (Figure 3i).
- The maximum separation between two current electrodes helped to determine the depth of the upper surface of the fourth (last) layer, and this depth ranges from 94 m to 145 m (Figure 3j), with altitudes 7 m to 43 m below sea level (Figure 3k). However, this separation distance was not sufficient to reach the bottom surface of this layer and, therefore, it was not possible to determine its thickness. The fourth layer is interpreted as being composed of different lithologies ranging from Pliocene lacustrine deposits to the Lower Eocene Thebes Formation, with resistivity values that are limited to the range between 1250 and 1450 Ω∙m (Figure 3l).
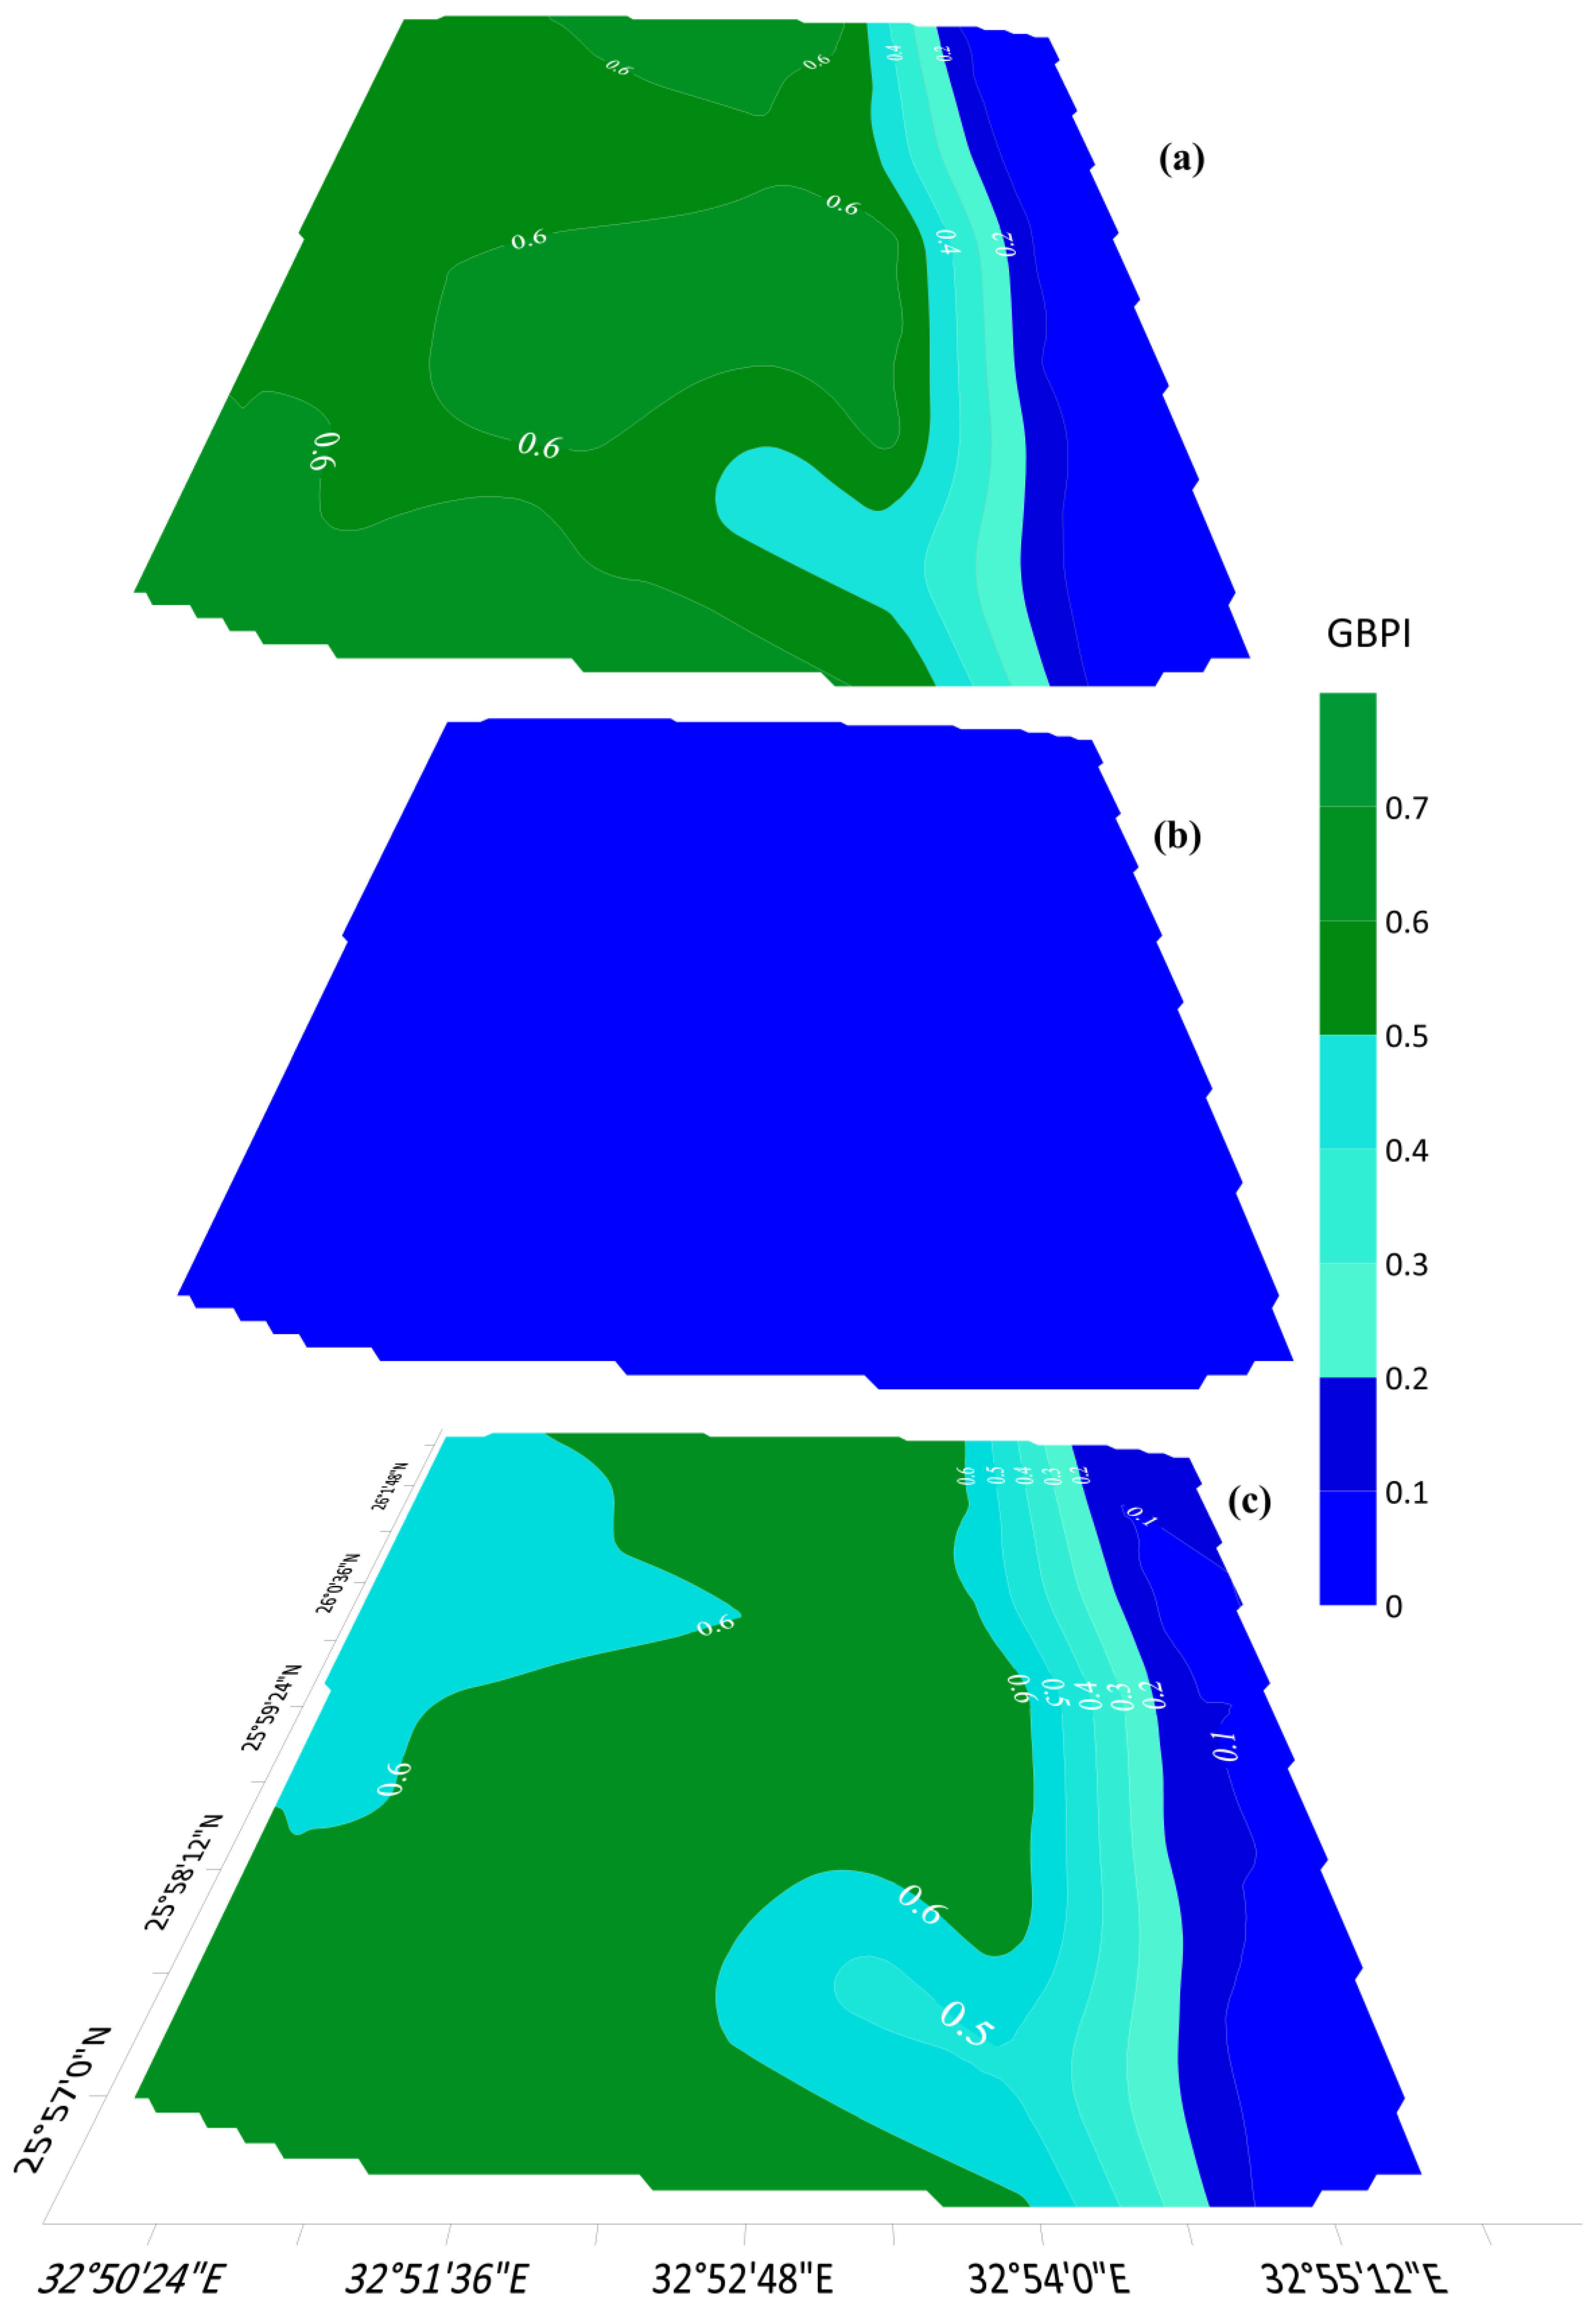
4.1.2. Geophysical Based Protectivity Assessment
4.2. Geochemical Evaluation
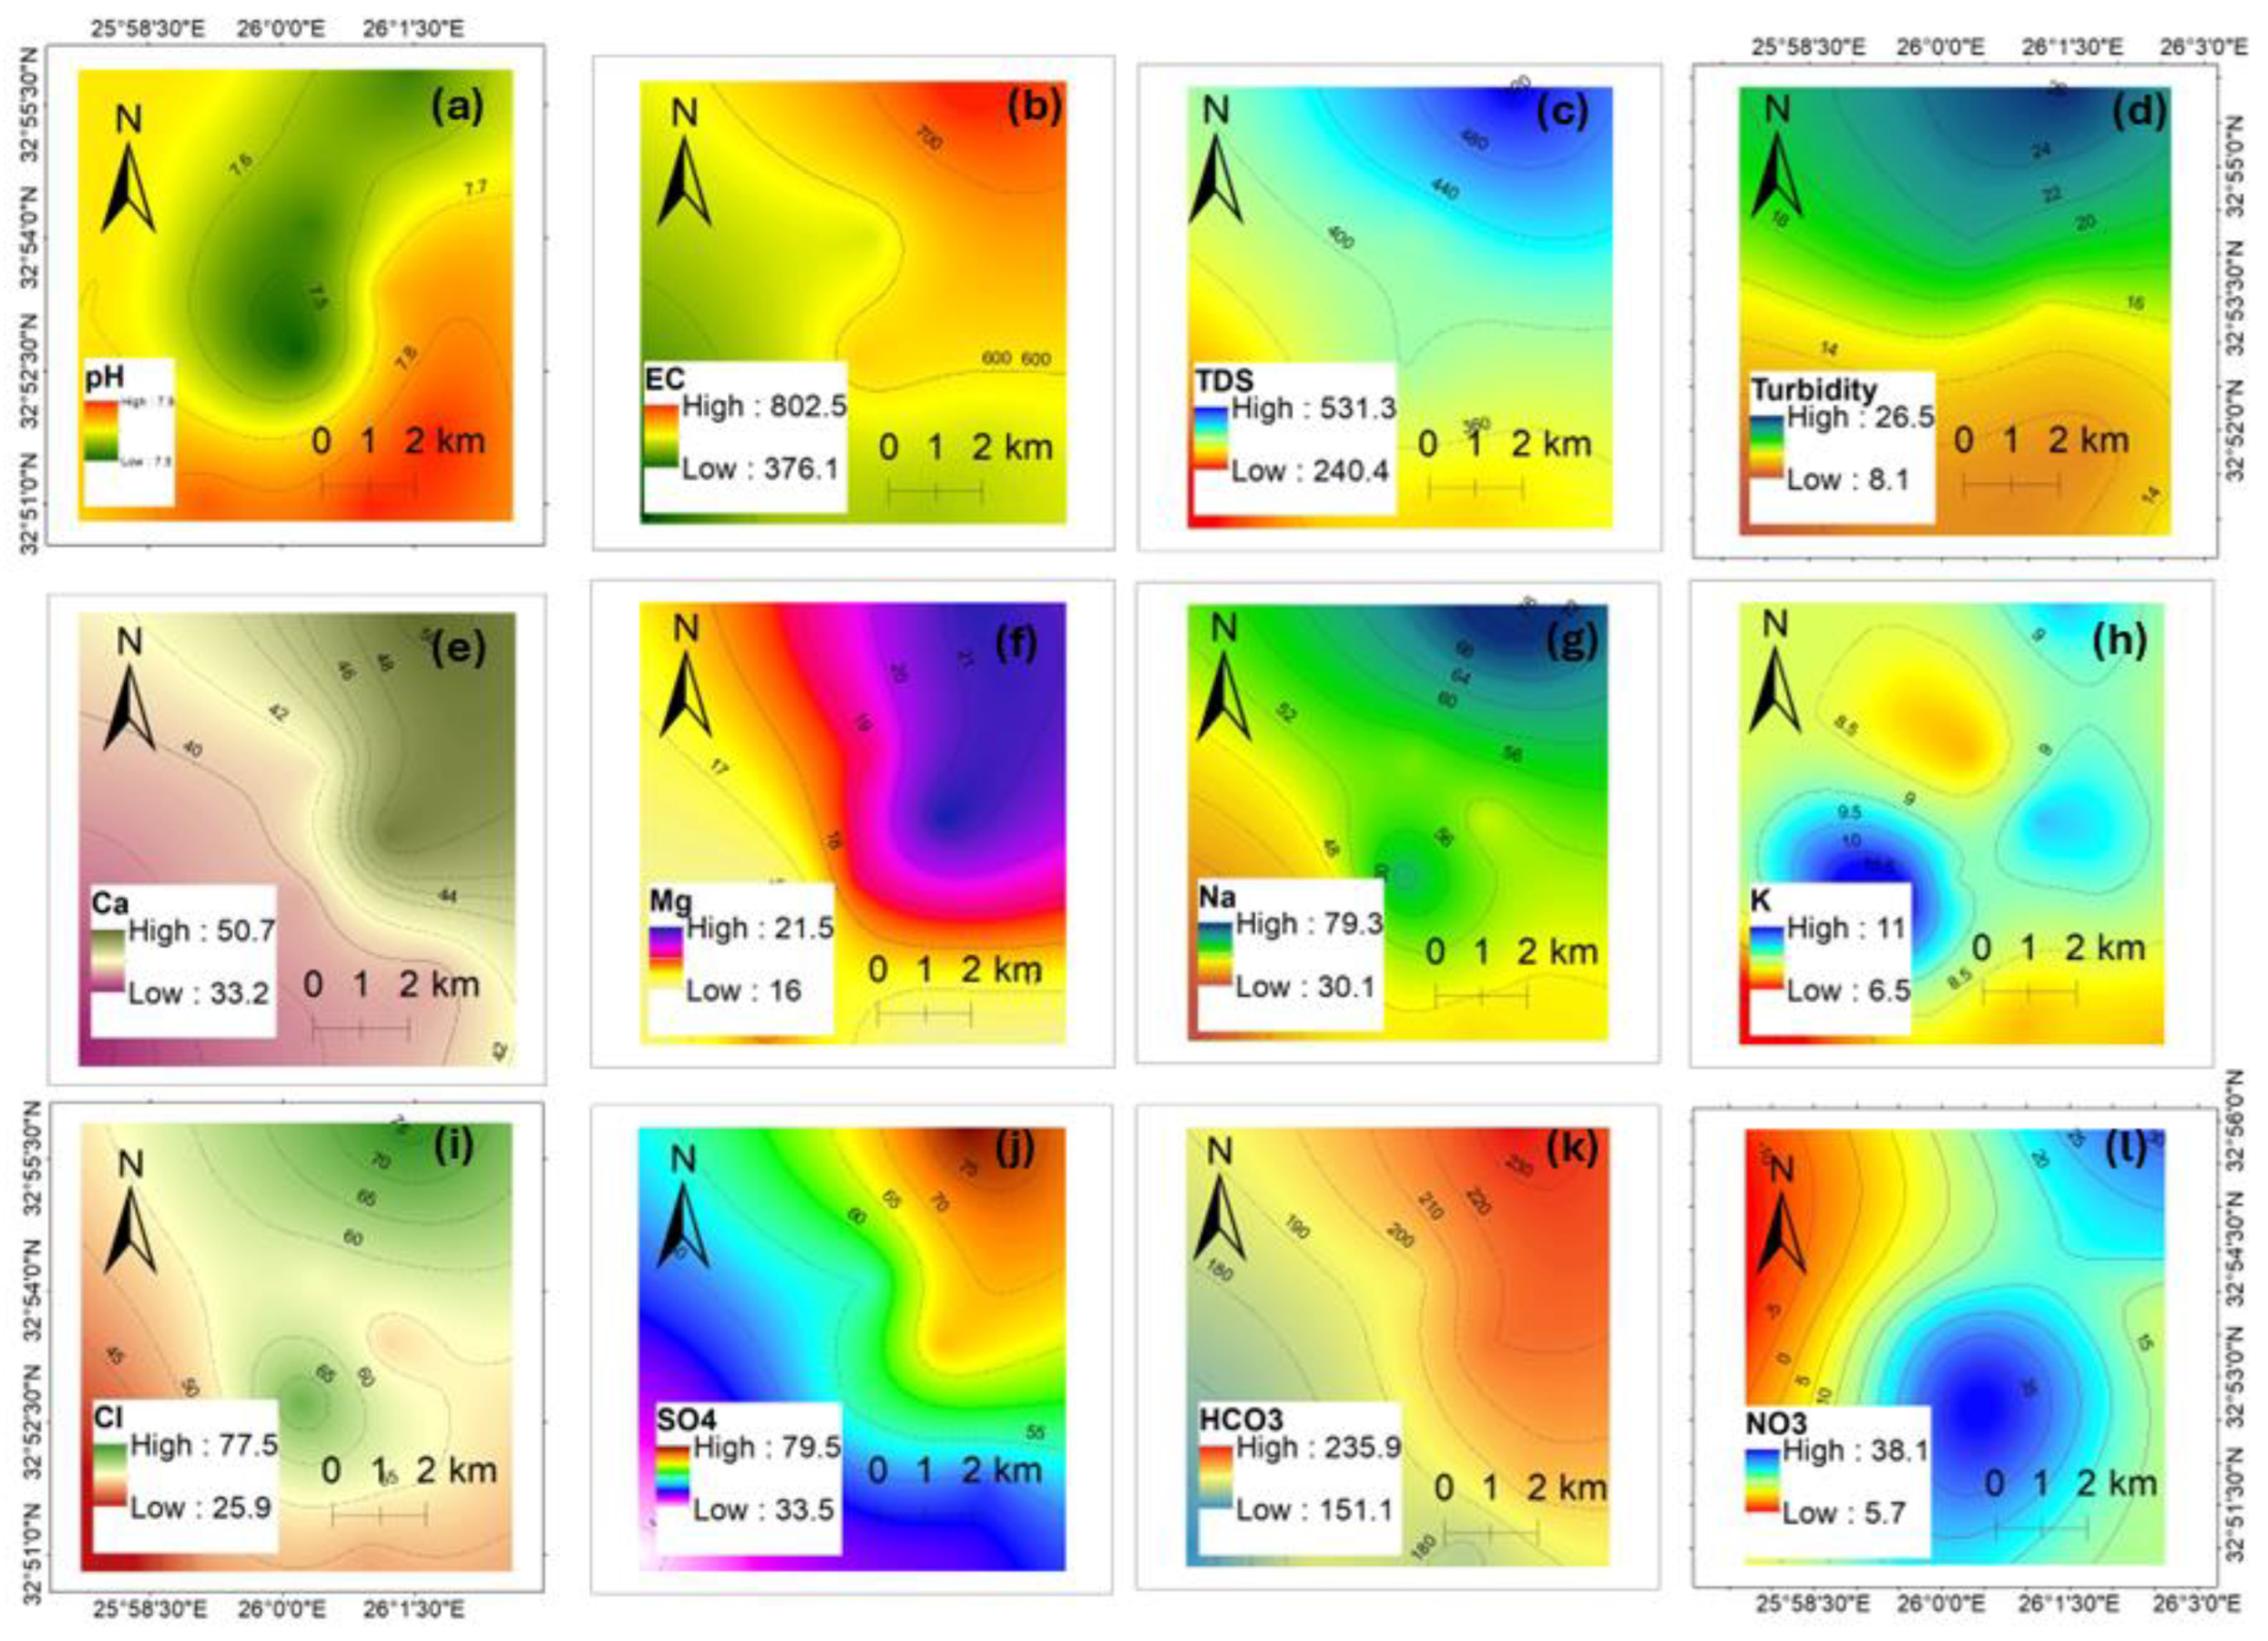
4.2.1. Descriptive Statistics and Spatial Distribution
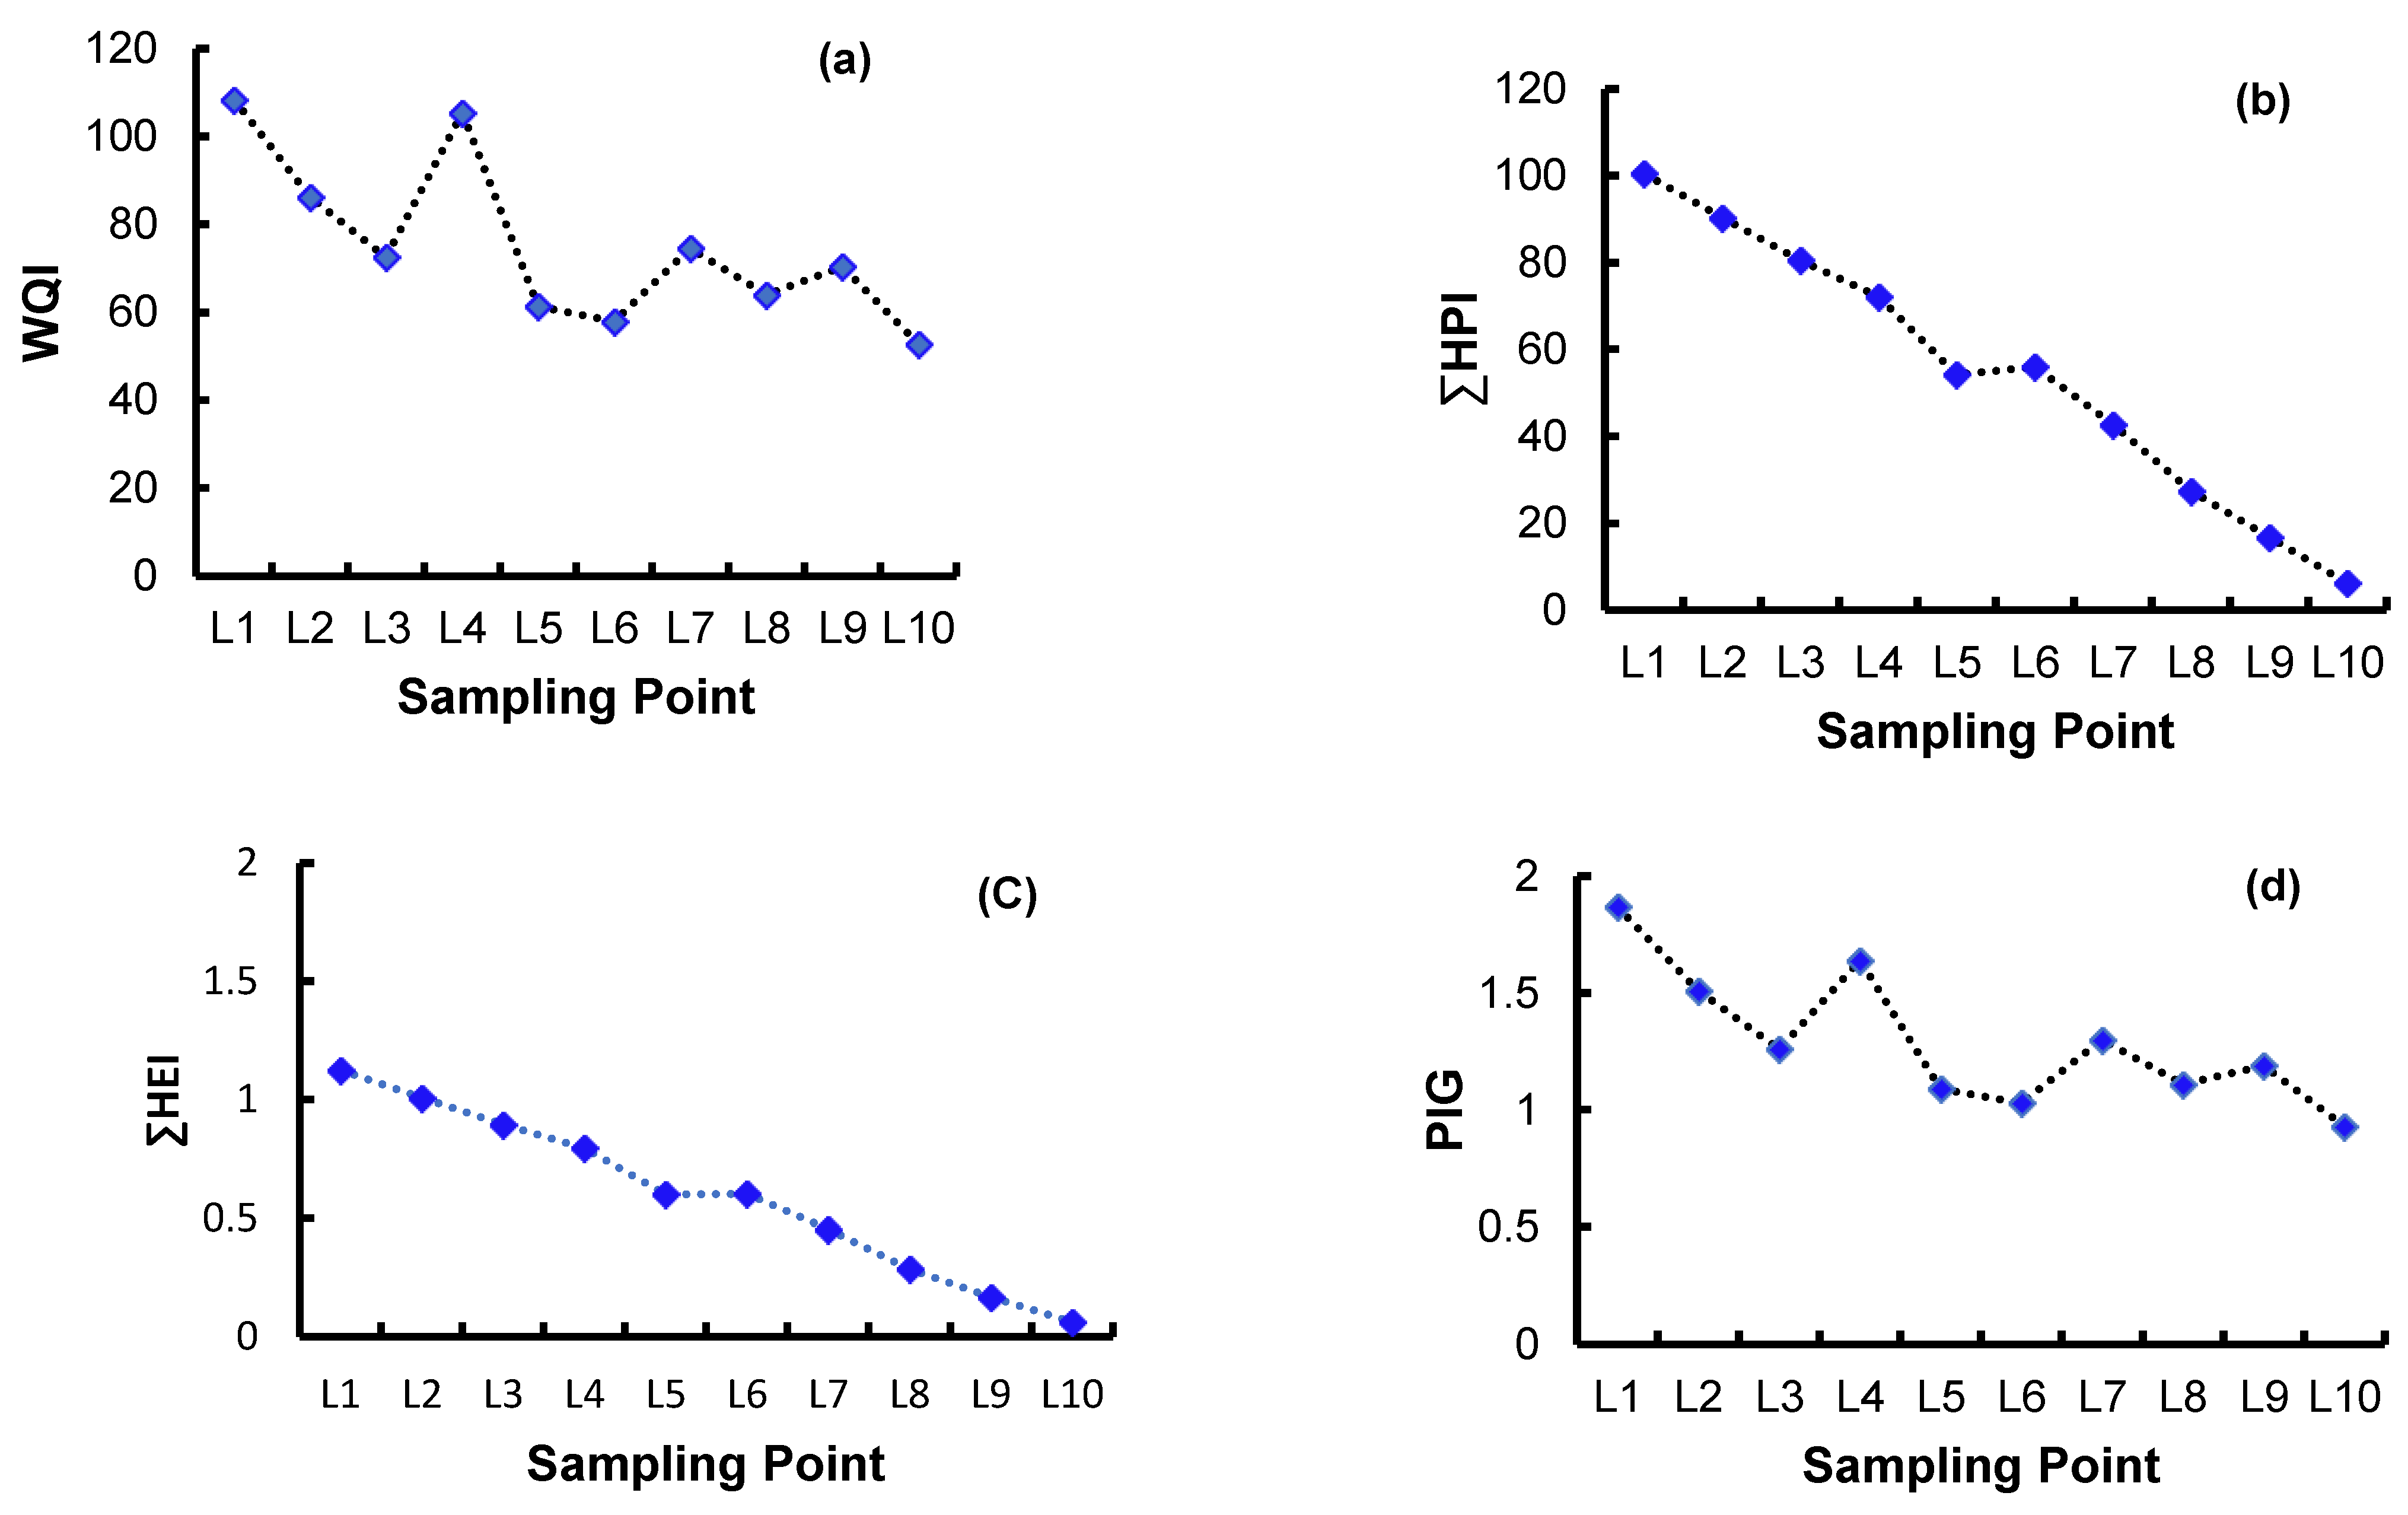
4.2.2. Pollution and Suitability Indices
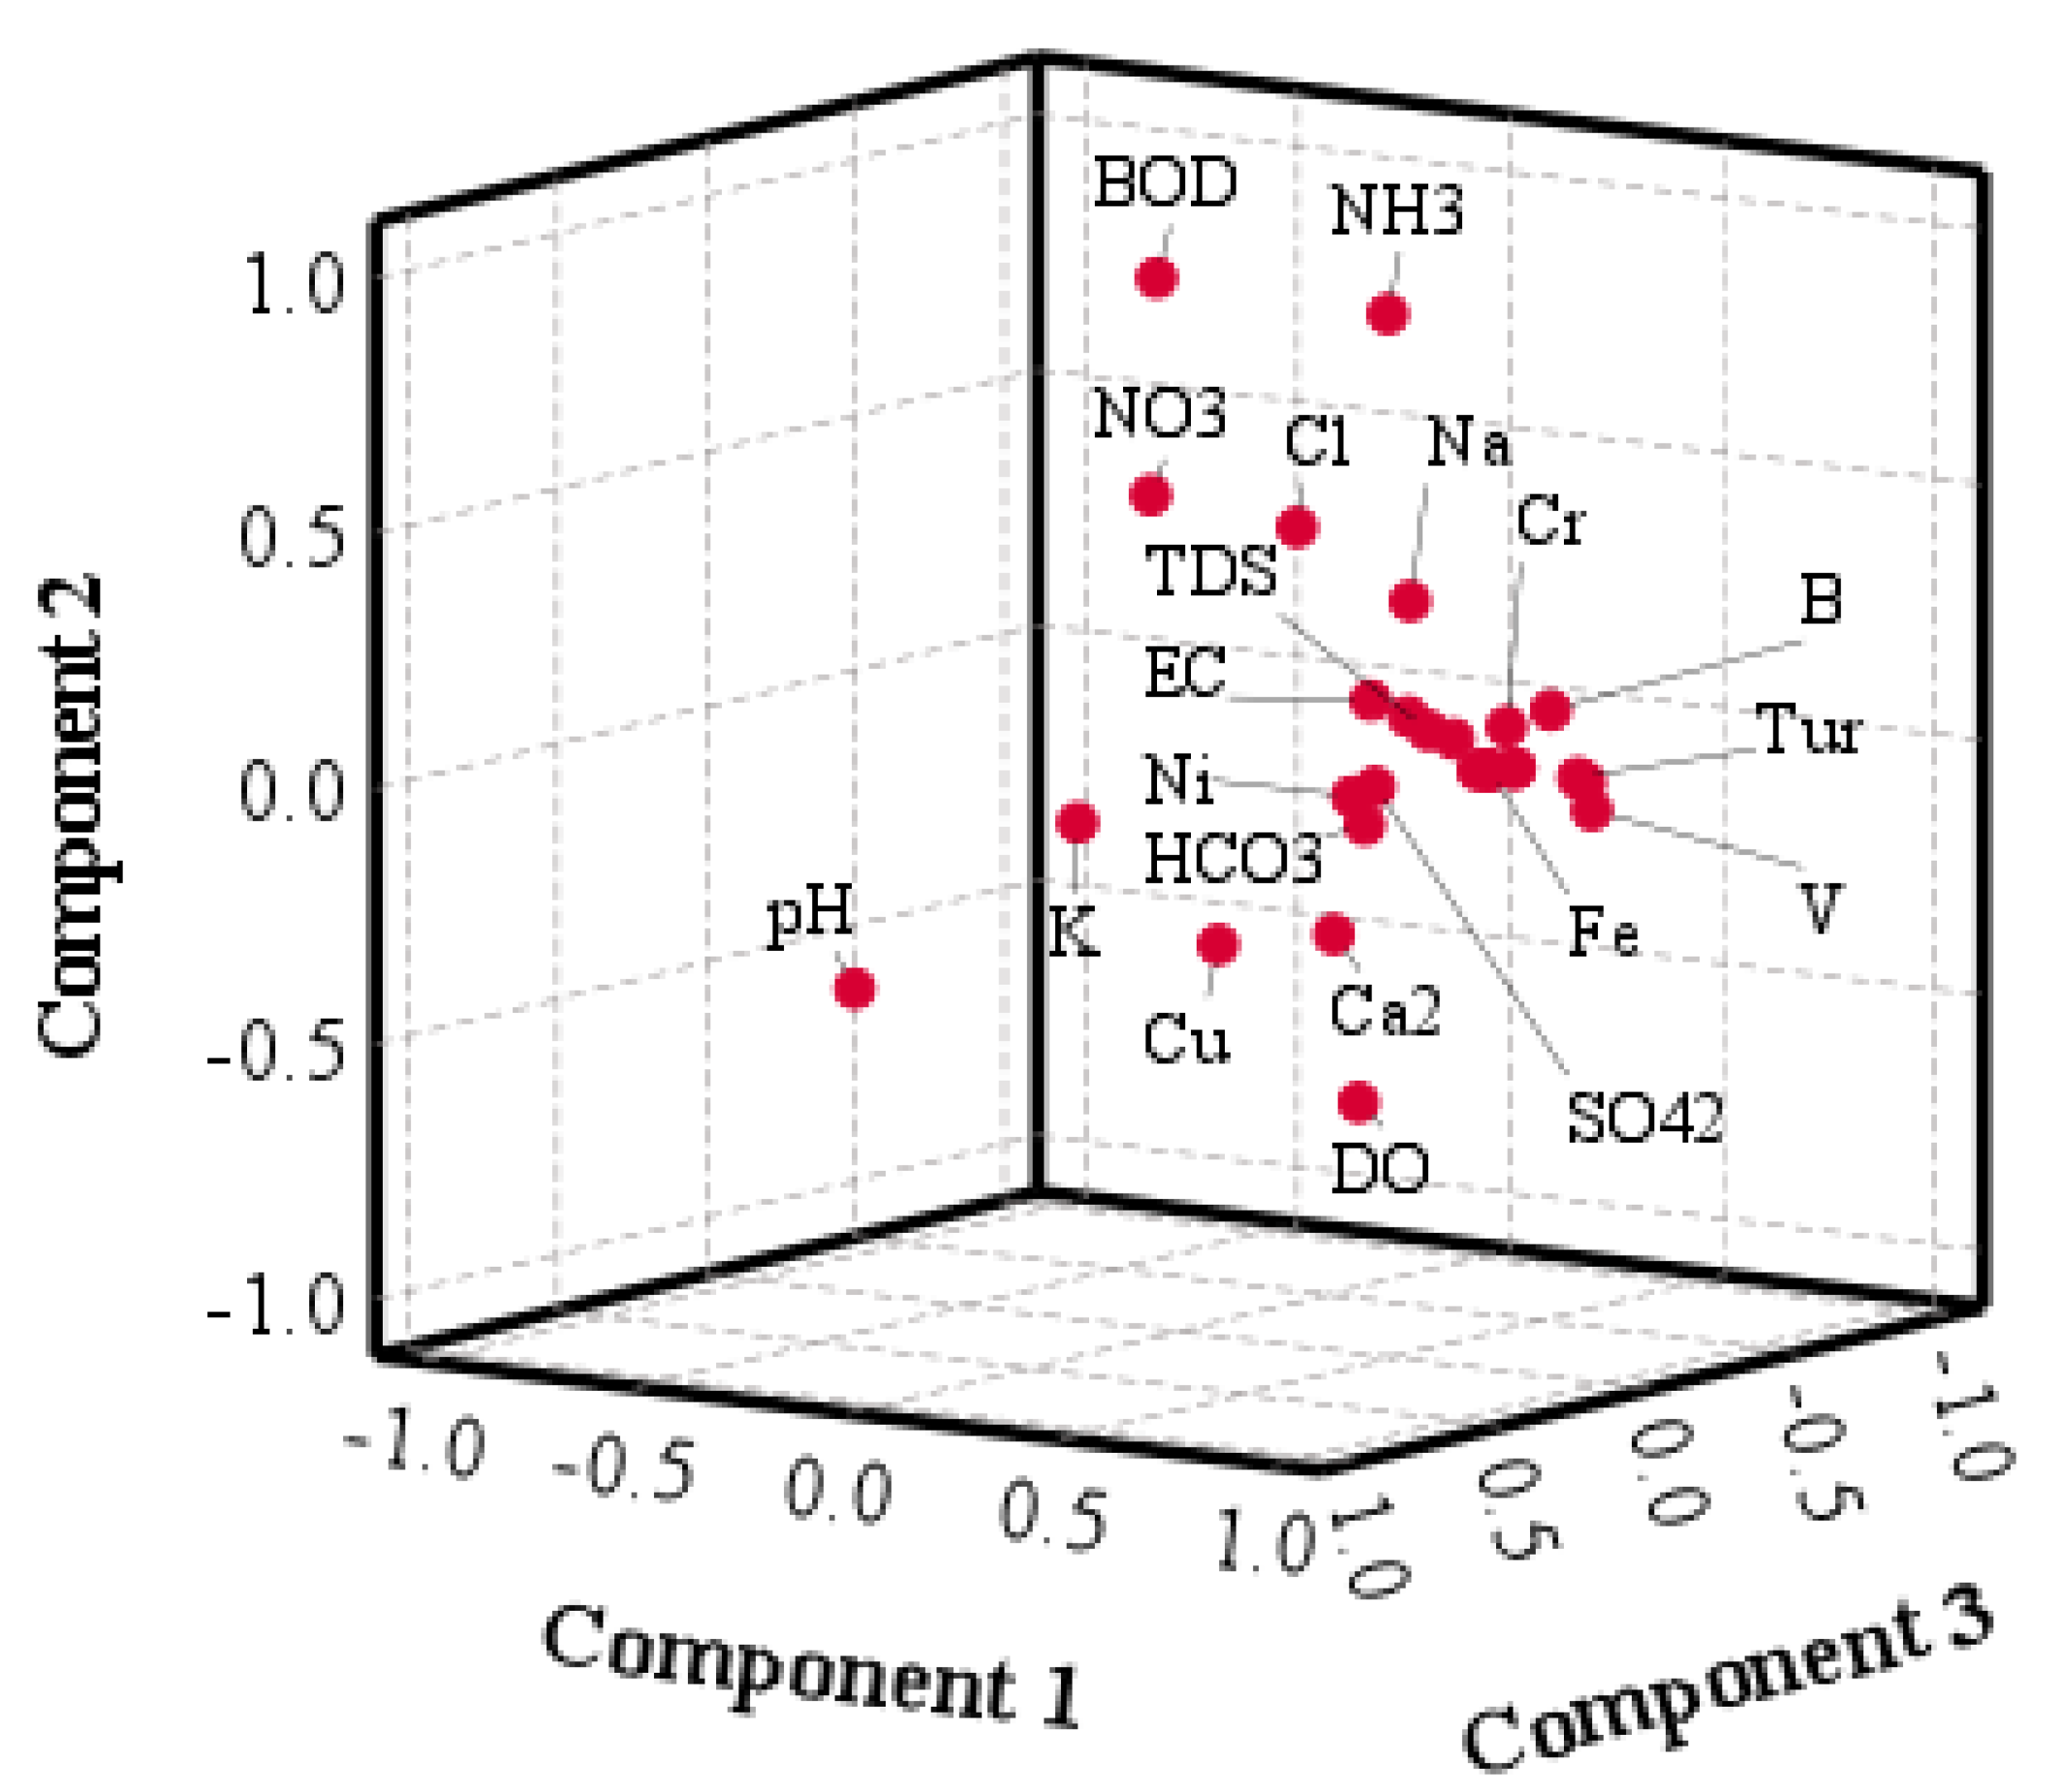
4.2.3. Multivariate Statistical Analysis
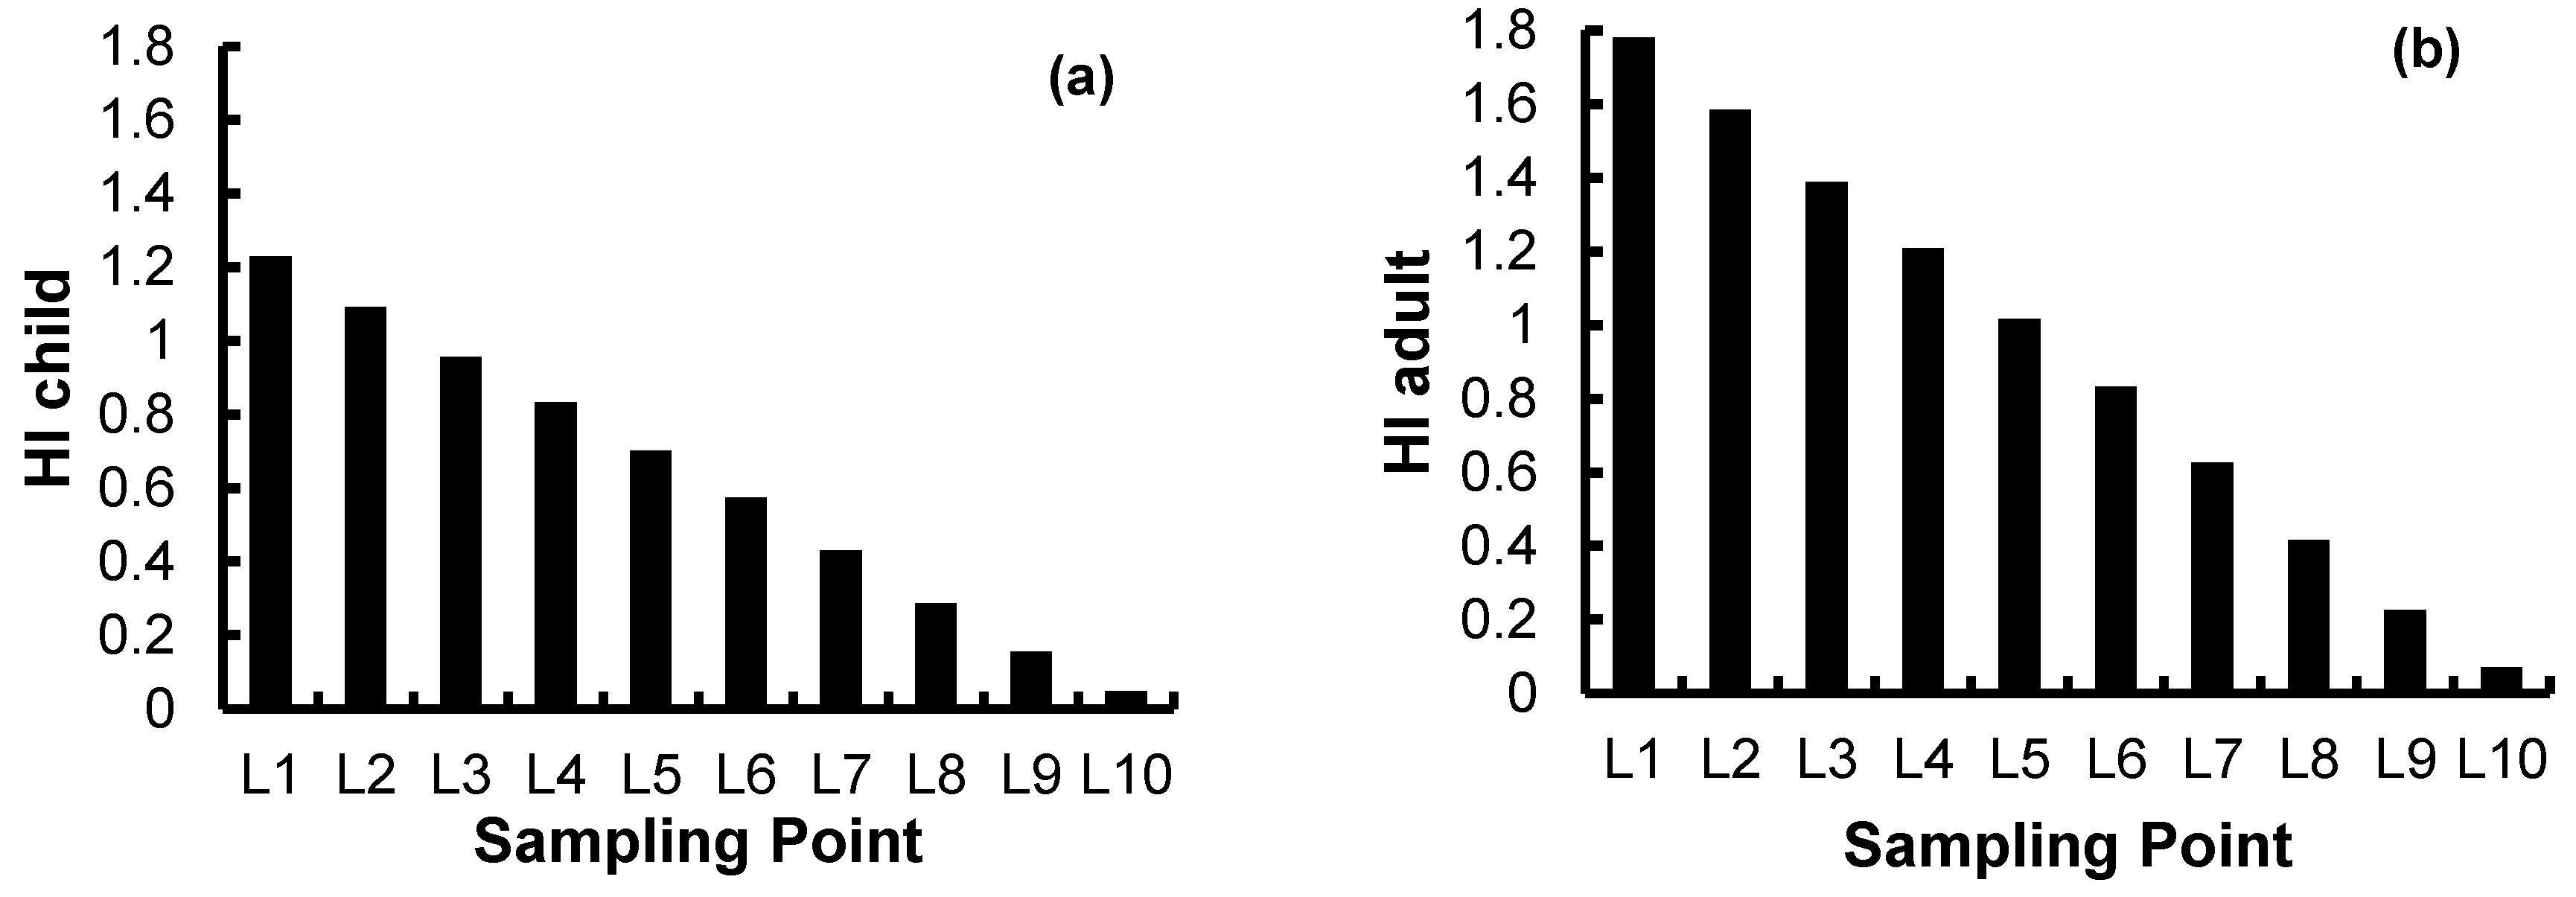
4.2.4. Health-Risk Assessment
5. Discussion
6. Conclusions
7. Limitations and Recommendations
Supplementary Materials
Author Contributions
Funding
Data Availability Statement
Conflicts of Interest
References
- Megdal, S.B. Invisible water: The importance of good groundwater governance and management. NPJ Clean Water 2018, 1, 15. [Google Scholar] [CrossRef]
- Tzanakakis, V.A.; Paranychianakis, N.V.; Angelakis, A.N. Water supply and water scarcity. Water 2020, 12, 2347. [Google Scholar] [CrossRef]
- Roudi-Fahimi, F.; Creel, L.; De Souza, R.M. Finding the Balance: Population and Water Scarcity in the Middle East and North Africa; Population Reference Bureau: Washington, DC, USA, 2002. [Google Scholar]
- Zafar, S.J. Water scarcity in MENA. EcoMENA 2014, 3, 2014. [Google Scholar]
- Falkenmark, M.; Widstrand, C. Population and water resources: A delicate balance. Popul. Bull. 1992, 47, 1–36. [Google Scholar] [PubMed]
- Gleick, P.H. “The Changing Water Paradigm: A Look at Twenty-First Century Water Resources Development”: From Water International (2000). In Sustainable Urban Development Reader; Routledge: London, UK, 2014; pp. 214–223. [Google Scholar]
- Zdruli, P.; Lamaddalena, N.; Todorovic, M.; Scardigno, A.; Calabrese, J.; Ladisa, G.; Verrastro, V.; Pereira, L.S.; Coppola, A.; Marino, M. Priority 1: Sustainable management of natural resources. In Feeding Knowledge; Options Méditerranéennes: Série A, Séminaires Méditerranéens; CIHEAM: Bari, Italy, 2017; pp. 33–70. [Google Scholar]
- Mohie El Din, M.O.; Moussa, A.M. Water management in Egypt for facing the future challenges. J. Adv. Res. 2016, 7, 403–412. [Google Scholar]
- Gharib, A.A.; Blumberg, J.; Manning, D.T.; Goemans, C.; Arabi, M. Assessment of vulnerability to water shortage in semi-arid river basins: The value of demand reduction and storage capacity. Sci. Total Environ. 2023, 871, 161964. [Google Scholar] [CrossRef]
- Ahmed, A.; Clark, I. Groundwater flow and geochemical evolution in the Central Flinders Ranges, South Australia. Sci. Total Environ. 2016, 572, 837–851. [Google Scholar] [CrossRef]
- Abu-Alnaeem, M.F.; Yusoff, I.; Ng, T.F.; Alias, Y.; Raksmey, M. Assessment of groundwater salinity and quality in Gaza coastal aquifer, Gaza Strip, Palestine: An integrated statistical, geostatistical and hydrogeochemical approaches study. Sci. Total Environ. 2018, 615, 972–989. [Google Scholar] [CrossRef]
- Ma, Q.; Ge, W.; Tian, F. Geochemical Characteristics and Controlling Factors of Chemical Composition of Groundwater in a Part of the Nanchang Section of Ganfu Plain. Sustainability 2022, 14, 7976. [Google Scholar] [CrossRef]
- Bahar, M.M.; Reza, M.S. Hydrochemical characteristics and quality assessment of shallow groundwater in a coastal area of Southwest Bangladesh. Environ. Earth Sci. 2010, 61, 1065–1073. [Google Scholar] [CrossRef]
- Selvakumar, S.; Chandrasekar, N.; Kumar, G. Hydrogeochemical characteristics and groundwater contamination in the rapid urban development areas of Coimbatore, India. Water Resour. Ind. 2017, 17, 26–33. [Google Scholar] [CrossRef]
- Mukate, S.V.; Panaskar, D.B.; Wagh, V.M.; Baker, S. Understanding the influence of industrial and agricultural land uses on groundwater quality in semiarid region of Solapur, India. Environ. Dev. Sustain. 2020, 22, 3207–3238. [Google Scholar] [CrossRef]
- Salem, H.A.; Gemail, K.S.; Nosair, A.M. A multidisciplinary approach for delineating wastewater flow paths in shallow groundwater aquifers: A case study in the southeastern part of the Nile Delta, Egypt. J. Contam. Hydrol. 2021, 236, 103701. [Google Scholar] [CrossRef] [PubMed]
- Saleh, A.; Gad, A.; Ahmed, A.; Arman, H.; Farhat, H.I. Groundwater Hydrochemical Characteristics and Water Quality in Egypt’s Central Eastern Desert. Water 2023, 15, 971. [Google Scholar] [CrossRef]
- Liu, C.W.; Lin, K.H.; Kuo, Y.M. Application of factor analysis in the assessment of groundwater quality in a blackfoot disease area in Taiwan. Sci. Total Environ. 2003, 313, 77–89. [Google Scholar] [CrossRef] [PubMed]
- Mahlknecht, J.; Merchán, D.; Rosner, M.; Meixner, A.; Ledesma-Ruiz, R. Assessing seawater intrusion in an arid coastal aquifer under high anthropogenic influence using major constituents, Sr and B isotopes in groundwater. Sci. Total Environ. 2017, 587, 282–295. [Google Scholar] [CrossRef] [PubMed]
- Neshat, A.; Pradhan, B. Risk assessment of groundwater pollution with a new methodological framework: Application of Dempster–Shafer theory and GIS. Nat. Hazards 2015, 78, 1565–1585. [Google Scholar] [CrossRef]
- Bhavsar, Z.; Patel, J. Assessing potability of groundwater using groundwater quality index (GWQI), entropy weighted groundwater pollution index (EGPI) and geospatial analysis for khambhat coastal region of Gujarat. Groundw. Sustain. Dev. 2023, 21, 100916. [Google Scholar] [CrossRef]
- Brindha, K.; Taie Semiromi, M.; Boumaiza, L.; Mukherjee, S. Comparing Deterministic and Stochastic Methods in Geospatial Analysis of Groundwater Fluoride Concentration. Water 2023, 15, 1707. [Google Scholar] [CrossRef]
- Ahmed, A.N.; Othman, F.B.; Afan, H.A.; Ibrahim, R.K.; Fai, C.M.; Hossain, M.S.; Ehteram, M.; Elshafie, A. Machine learning methods for better water quality prediction. J. Hydrol. 2019, 578, 124084. [Google Scholar] [CrossRef]
- Kotb, A.; Mosaad, S.; Kehew, A.E. Geophysical and hydrogeological applications for groundwater evaluation, East El-Minia area, upper Egypt. J. Afr. Earth Sci. 2021, 184, 104384. [Google Scholar] [CrossRef]
- Sankaran, S.; Sonkamble, S.; Krishnakumar, K.; Mondal, N. Integrated approach for demarcating subsurface pollution and saline water intrusion zones in SIPCOT area: A case study from Cuddalore in Southern India. Environ. Monit. Assess. 2012, 184, 5121–5138. [Google Scholar] [CrossRef] [PubMed]
- Najib, S.; Fadili, A.; Mehdi, K.; Riss, J.; Makan, A.J. Contribution of hydrochemical and geoelectrical approaches to investigate salinization process and seawater intrusion in the coastal aquifers of Chaouia, Morocco. J. Contam. Hydrol. 2017, 198, 24–36. [Google Scholar] [CrossRef] [PubMed]
- Shang, T.; Xu, Z.; Gong, X.; Li, X.; Tian, S.; Guan, Y.J. Application of electrical sounding to determine the spatial distribution of groundwater quality in the coastal area of Jiangsu Province, China. J. Hydrol. 2021, 599, 126348. [Google Scholar] [CrossRef]
- Mahmoud, H.H.; Kotb, A.D. Impact of the geological structures on the groundwater potential using geophysical techniques in West Bani Mazar area, El Minia–Western Desert, Egypt. J. Afr. Earth Sci. 2017, 130, 161–173. [Google Scholar] [CrossRef]
- Mahmoud, H.H.; Kotb, A.D.; Tawfik, M.Z. Application of Time Domain Electromagnetic survey to detect fractured limestone aquifer in desert fringes, West Assiut, Egypt. NRIAG J. Astron. Geophys. 2021, 10, 235–243. [Google Scholar] [CrossRef]
- Seleem, E.; Abdel Monem, A.; Zeid, S. Geoelectrical soundings to delineate the Quaternary groundwater aquifer in the central part of Wadi Qena, Eastern Desert, Egypt. J. Appl. Geophys. 2013, 12, 191–207. [Google Scholar]
- Abdel Moneim, A.; Seleem, E.; Zeid, S.; Abdel Samie, S.; Zaki, S.; Abu El-Fotoh, A. Hydrogeochemical characteristics and age dating of groundwater in the Quaternary and Nubian aquifer systems in Wadi Qena, Eastern Desert, Egypt. Sustain. Water Resour. Manag. 2015, 1, 213–232. [Google Scholar] [CrossRef]
- D’Aniello, A.; Cimorelli, L.; Cozzolino, L.; Pianese, D. The effect of geological heterogeneity and groundwater table depth on the hydraulic performance of stormwater infiltration facilities. Water Resour. Manag. 2019, 33, 1147–1166. [Google Scholar] [CrossRef]
- D’Aniello, A.; Cimorelli, L.; Pianese, D.J. Leaking pipes and the urban karst: A pipe scale numerical investigation on water leaks flow paths in the subsurface. J. Hydrol. 2021, 603, 126847. [Google Scholar] [CrossRef]
- Schiavo, M.J. Probabilistic delineation of subsurface connected pathways in alluvial aquifers under geological uncertainty. J. Hydrol. 2022, 615, 128674. [Google Scholar] [CrossRef]
- Bhattacharya, P. Direct Current Geoelectric Sounding: Principles and Interpretation; Elsevier Science Publishers: Amsterdam, The Netherlands, 2012. [Google Scholar]
- Telford, W.M.; Geldart, L.P.; Sheriff, R.E. Applied Geophysics; Cambridge University Press: Cambridge, UK, 1990. [Google Scholar]
- Loke, M.; Chambers, J.; Rucker, D.; Kuras, O.; Wilkinson, P.B. Recent developments in the direct-current geoelectrical imaging method. J. Appl. Geophys. 2013, 95, 135–156. [Google Scholar] [CrossRef]
- Zohdy, A.A. A new method for the automatic interpretation of Schlumberger and Wenner sounding curves. Geophysics 1989, 54, 245–253. [Google Scholar] [CrossRef]
- Zhdanov, M.S. Foundations of Geophysical Electromagnetic Theory and Methods; Elsevier: Amsterdam, The Netherlands, 2017; Volume 43. [Google Scholar]
- Maillet, R. The fundamental equations of electrical prospecting. Geophysics 1947, 12, 529–556. [Google Scholar] [CrossRef]
- Ossai, M.N.; Okeke, F.N.; Obiora, D.N.; Ibuot, J.C. Evaluation of groundwater repositories in parts of Enugu, Eastern Nigeria via electrical resistivity technique. Appl. Water Sci. 2023, 13, 64. [Google Scholar] [CrossRef]
- Engström, E.; Stenberg, A.; Baxter, D.C.; Malinovsky, D.; Mäkinen, I.; Pönni, S.; Rodushkin, I. Effects of sample preparation and calibration strategy on accuracy and precision in the multi-elemental analysis of soil by sector-field ICP-MS. J. Anal. At. Spectrom. 2004, 19, 858–866. [Google Scholar] [CrossRef]
- Zimmerman, D.L.; Homer, K.E. A network design criterion for estimating selected attributes of the semivariogram. Environmetrics 1991, 2, 425–441. [Google Scholar] [CrossRef]
- United States Environmental Protection Agency (USEPA). Quantitative Uncertainty Analysis of Super Fund Residential Risk Path Way Models for Soil and Ground Water: White Paper; Office of Health and Environmental Assessment: Oak Ridge, TN, USA, 1996.
- Stuckey, J.W.; Schaefer, M.V.; Kocar, B.D.; Benner, S.G.; Fendorf, S. Arsenic release metabolically limited to permanently water-saturated soil in Mekong Delta. Nat. Geosci. 2016, 9, 70–76. [Google Scholar] [CrossRef]
- Fewtrell, L.; Fuge, R.; Kay, D. An estimation of the global burden of disease due to skin lesions caused by arsenic in drinking water. J. Water Health 2005, 3, 101–107. [Google Scholar] [CrossRef] [PubMed]
- Henson, M.C.; Chedrese, P.J. Endocrine disruption by cadmium, a common environmental toxicant with paradoxical effects on reproduction. Exp. Biol. Med. 2004, 229, 383–392. [Google Scholar] [CrossRef]
- Mortvedt, J. Heavy metal contaminants in inorganic and organic fertilizers. Fertil. Res. 1995, 43, 55–61. [Google Scholar] [CrossRef]
- Avery, A.A. Infantile methemoglobinemia: Reexamining the role of drinking water nitrates. Environ. Health Perspect. 1999, 107, 583–586. [Google Scholar] [CrossRef] [PubMed]
- Reza, A.; Shim, S.; Kim, S.; Ahmed, N.; Won, S.; Ra, C. Nutrient leaching loss of pre-treated struvite and its application in Sudan grass cultivation as an eco-friendly and sustainable fertilizer source. Sustainability 2019, 11, 4204. [Google Scholar] [CrossRef]
- Zhu, B.; Yang, X.; Rioual, P.; Qin, X.; Liu, Z.; Xiong, H.; Yu, J. Hydrogeochemistry of three watersheds (the Erlqis, Zhungarer and Yili) in northern Xinjiang, NW China. Appl. Geochem. 2011, 26, 1535–1548. [Google Scholar] [CrossRef]
- Wen, X.; Chen, F.; Lin, Y.; Zhu, H.; Yuan, F.; Kuang, D.; Jia, Z.; Yuan, Z. Microbial indicators and their use for monitoring drinking water quality—A review. Sustainability 2020, 12, 2249. [Google Scholar] [CrossRef]
- Mandal, M.; Mandi, S.; Modak, P.; Ghosh, B.; Panda, B.; Mukherjee, A.; Dhak, D.; Senapati, T. Groundwater quality enumeration and health risk in the extended part of Chhotanagpur granite gneiss complex of India. Environ. Sci. Pollut. Res. 2023, 1–28. [Google Scholar] [CrossRef] [PubMed]
- Chien, L.; Robertson, H.; Gerrard, J. Infantile gastroenteritis due to water with high sulfate content. Can. Med. Assoc. J. 1968, 99, 102. [Google Scholar]
- Khan, S.; Shahnaz, M.; Jehan, N.; Rehman, S.; Shah, M.T.; Din, I. Drinking water quality and human health risk in Charsadda district, Pakistan. J. Clean. Prod. 2013, 60, 93–101. [Google Scholar] [CrossRef]


| Parameter | Mean | Minimum | Maximum | World Health Organization (2011) Standards | |
|---|---|---|---|---|---|
| Major Anions and Cations (mg/L) | pH | 7.7 | 7.5 | 7.9 | 6.5–8.5 |
| EC | 567.9 | 375.5 | 803.5 | 300 | |
| TDS | 373.0 | 240.00 | 532.00 | 1000 | |
| Tur. | 14.8 | 8.0 | 26.5 | 0.2 | |
| DO | 4.7 | 1.7 | 6.8 | 5.0 | |
| BOD | 11.9 | 5.0 | 52.5 | 1.5 | |
| Cl− | 53.5 | 21.8 | 81.2 | 5 | |
| NO3− | 20.8 | 5.7 | 37.2 | 50 | |
| SO42- | 52.4 | 30.4 | 83.8 | 250 | |
| CO32- | 0.0 | 0.0 | 0.0 | - | |
| HCO3− | 193.8 | 151.0 | 236.0 | - | |
| Ca2+ | 40.9 | 32.1 | 52.6 | 100–300 | |
| K+ | 8.6 | 6.5 | 11.0 | - | |
| Mg2+ | 18.1 | 16.0 | 21.5 | 50 | |
| Na+ | 50.7 | 30.0 | 79.5 | 200 | |
| Heavy Metals (µg/L) | Ba | 33.2 | 2.8 | 77.4 | 700.0 |
| Cr | 0.1 | 0.0 | 0.2 | 50.0 | |
| Fe | 18.1 | 4.8 | 31.2 | 300 | |
| Mn | 3.2 | 0.0 | 5.7 | 80.0 | |
| Ni | 1.2 | 0.2 | 1.6 | 70.0 | |
| Sb | 7.0 | 0.1 | 33.1 | 20.0 | |
| Al | 1.8 | 1.0 | 2.6 | 100.0 | |
| As | 4.5 | 0.4 | 8.4 | 10.0 | |
| Cd | 0.3 | 0.0 | 0.6 | 3.0 | |
| Co | 0.9 | 0.8 | 1.1 | 10.0 | |
| Cu | 0.3 | 0.0 | 0.7 | 2000.0 | |
| V | 9.9 | 3.0 | 23.0 | - | |
| Zn | 1.1 | 0.0 | 2.6 | 3000.0 |
| Parameter | PC1 | PC2 | PC3 | PC4 | PC5 |
|---|---|---|---|---|---|
| pH | −0.77 | −0.52 | −0.01 | 0.14 | 0.29 |
| EC | 0.68 | 0.24 | 0.33 | 0.42 | 0.38 |
| TDS | 0.80 | 0.19 | 0.31 | 0.27 | 0.29 |
| Tur. | 0.93 | 0.07 | −0.01 | 0.13 | 0.17 |
| NH4 | 0.26 | 0.86 | −0.33 | 0.09 | −0.02 |
| DO | 0.06 | −0.73 | −0.51 | −0.36 | −0.08 |
| BOD | 0.03 | 0.97 | 0.11 | 0.04 | 0.06 |
| Cl− | 0.53 | 0.57 | 0.36 | 0.16 | 0.39 |
| NO3− | 0.32 | 0.64 | 0.56 | 0.21 | 0.25 |
| SO42- | 0.71 | 0.08 | 0.35 | 0.55 | 0.24 |
| HCO3− | 0.64 | −0.01 | 0.29 | 0.41 | 0.56 |
| Ca2+ | 0.61 | −0.22 | 0.36 | 0.57 | 0.23 |
| K+ | 0.39 | 0.06 | 0.90 | 0.05 | −0.07 |
| Na+ | 0.67 | 0.41 | 0.19 | 0.32 | 0.36 |
| Mg2+ | 0.67 | 0.12 | 0.03 | 0.54 | 0.29 |
| B | 0.95 | 0.22 | 0.11 | 0.08 | 0.15 |
| Cr | 0.92 | 0.20 | 0.22 | 0.07 | 0.17 |
| Fe | 0.91 | 0.12 | 0.26 | 0.03 | 0.25 |
| Mn | 0.48 | 0.13 | −0.09 | 0.06 | 0.84 |
| Ni | 0.71 | 0.07 | 0.44 | −0.19 | 0.40 |
| Sb | 0.90 | 0.04 | −0.08 | 0.31 | 0.08 |
| Al | 0.92 | 0.12 | 0.27 | 0.04 | 0.23 |
| As | 0.91 | 0.12 | 0.30 | 0.02 | 0.24 |
| Cd | 0.94 | 0.12 | 0.22 | 0.05 | 0.17 |
| Co | 0.92 | 0.12 | 0.28 | 0.03 | 0.23 |
| Cu | 0.11 | −0.34 | 0.03 | −0.87 | 0.04 |
| V | 0.96 | 0.01 | −0.01 | 0.11 | 0.10 |
| Zn | 0.94 | 0.12 | 0.22 | 0.05 | 0.18 |
| Eigenvalues | 14.74 | 3.88 | 2.91 | 2.60 | 2.43 |
| % of Variance | 52.63 | 13.85 | 10.39 | 9.28 | 8.69 |
| Cumulative % | 52.63 | 66.48 | 76.87 | 86.15 | 94.85 |
| Ingestion | Metal | Adult | Child | ||||
| Minimum | Maximum | Average | Minimum | Maximum | Average | ||
| Cr | 0.0000 | 0.0019 | 0.0009 | 0.0000 | 0.0028 | 0.0013 | |
| Mn | 0.0000 | 0.0081 | 0.0046 | 0.0000 | 0.0118 | 0.0067 | |
| Ni | 0.0004 | 0.0028 | 0.0020 | 0.0006 | 0.0041 | 0.0030 | |
| Cu | 0.0000 | 0.0006 | 0.0002 | 0.0000 | 0.0008 | 0.0003 | |
| Zn | 0.0000 | 0.0029 | 0.0013 | 0.0000 | 0.0004 | 0.0002 | |
| As | 0.0468 | 0.9600 | 0.5106 | 0.0681 | 1.3978 | 0.7435 | |
| Cd | 0.0000 | 0.2123 | 0.0932 | 0.0000 | 0.3092 | 0.1356 | |
| B | 0.0005 | 0.0133 | 0.0057 | 0.0007 | 0.0193 | 0.0083 | |
| HQ | 0.0490 | 1.2004 | 0.6185 | 0.0713 | 1.7440 | 0.8988 | |
| Dermal | Cr | 0.0000 | 0.0009 | 0.0004 | 0.0000 | 0.0010 | 0.0005 |
| Mn | 0.0000 | 0.0011 | 0.0006 | 0.0000 | 0.0013 | 0.0007 | |
| Ni | 0.0000 | 0.0001 | 0.0001 | 0.0000 | 0.0001 | 0.0001 | |
| Cu | 0.0000 | 0.0000 | 0.0000 | 0.0000 | 0.0000 | 0.0000 | |
| Zn | 0.0000 | 0.0000 | 0.0000 | 0.0000 | 0.0000 | 0.0000 | |
| As | 0.0001 | 0.0016 | 0.0009 | 0.0003 | 0.0062 | 0.0033 | |
| Cd | 0.0000 | 0.0237 | 0.0104 | 0.0000 | 0.0272 | 0.0120 | |
| B | 0.0000 | 0.0001 | 0.0000 | 0.0000 | 0.0001 | 0.0000 | |
| HQ | 0.0003 | 0.0273 | 0.0124 | 0.0005 | 0.0357 | 0.0165 | |
| HI | 0.0492 | 1.2277 | 0.6309 | 0.0718 | 1.7797 | 0.9153 | |
| Cr—CRing | As—CRing | Sum 1–2 | Cr—CRderm | As—CRderm | TCRCr-As | Sum | |
|---|---|---|---|---|---|---|---|
| L1 | 3.58 × 10⁻⁶ | 5.90 × 10⁻¹³ | 3.59 × 10⁻⁶ | 3.58 × 10⁻⁶ | 1.77 × 10⁻⁴ | 1.81 × 10⁻⁴ | 1.85 × 10⁻⁴ |
| L2 | 3.16 × 10⁻⁶ | 4.65 × 10⁻¹³ | 3.16 × 10⁻⁶ | 3.16 × 10⁻⁶ | 1.58 × 10⁻⁴ | 1.62 × 10⁻⁴ | 1.65 × 10⁻⁴ |
| L3 | 2.74 × 10⁻⁶ | 3.56 × 10⁻¹³ | 2.74 × 10⁻⁶ | 2.74 × 10⁻⁶ | 1.40 × 10⁻⁴ | 1.43 × 10⁻⁴ | 1.45 × 10⁻⁴ |
| L4 | 2.53 × 10⁻⁶ | 2.88 × 10⁻¹³ | 2.53 × 10⁻⁶ | 2.53 × 10⁻⁶ | 1.23 × 10⁻⁴ | 1.25 × 10⁻⁴ | 1.28 × 10⁻⁴ |
| L5 | 1.69 × 10⁻⁶ | 1.66 × 10⁻¹³ | 1.69 × 10⁻⁶ | 1.69 × 10⁻⁶ | 1.06 × 10⁻⁴ | 1.08 × 10⁻⁴ | 1.10 × 10⁻⁴ |
| L6 | 1.27 × 10⁻⁶ | 1.03 × 10⁻¹³ | 1.27 × 10⁻⁶ | 1.27 × 10⁻⁶ | 8.73 × 10⁻⁵ | 8.86 × 10⁻⁵ | 8.98 × 10⁻⁵ |
| L7 | 6.33 × 10⁻⁶ | 3.95 × 10⁻¹⁴ | 6.33 × 10⁻⁷ | 6.33 × 10⁻⁷ | 6.73 × 10⁻⁵ | 6.79 × 10⁻⁵ | 6.85 × 10⁻⁵ |
| L8 | 4.22 × 10⁻⁷ | 1.87 × 10⁻¹⁴ | 4.22 × 10⁻⁷ | 4.22 × 10⁻⁷ | 4.77 × 10⁻⁵ | 4.81 × 10⁻⁵ | 4.85 × 10⁻⁵ |
| L9 | 2.11 × 10⁻⁷ | 5.45 × 10⁻¹⁵ | 2.11 × 10⁻⁷ | 2.11 × 10⁻⁷ | 2.78 × 10⁻⁵ | 2.80 × 10⁻⁵ | 2.83 × 10⁻⁵ |
| L10 | 2.11 × 10⁻⁷ | 5.45 × 10⁻¹⁵ | 2.11 × 10⁻⁷ | 2.11 × 10⁻⁷ | 8.65 × 10⁻⁶ | 8.86 × 10⁻⁶ | 9.07 × 10⁻⁶ |
| Minimum | 2.11 × 10⁻⁷ | 5.45 × 10⁻¹⁵ | 2.11 × 10⁻⁷ | 2.11 × 10⁻⁷ | 8.65 × 10⁻⁶ | 8.86 × 10⁻⁶ | 9.07 × 10⁻⁶ |
| Maximum | 3.58 × 10⁻⁶ | 5.90 × 10⁻¹³ | 3.59 × 10⁻⁶ | 3.58 × 10⁻⁶ | 1.77 × 10⁻⁴ | 1.81 × 10⁻⁴ | 1.85 × 10⁻⁴ |
| Average | 1.64 × 10⁻⁶ | 2.04 × 10⁻¹³ | 1.64 × 10⁻⁶ | 1.64 × 10⁻⁶ | 9.43 × 10⁻⁵ | 9.60 × 10⁻⁵ | 9.76 × 10⁻⁵ |
Disclaimer/Publisher’s Note: The statements, opinions and data contained in all publications are solely those of the individual author(s) and contributor(s) and not of MDPI and/or the editor(s). MDPI and/or the editor(s) disclaim responsibility for any injury to people or property resulting from any ideas, methods, instructions or products referred to in the content. |
© 2024 by the authors. Licensee MDPI, Basel, Switzerland. This article is an open access article distributed under the terms and conditions of the Creative Commons Attribution (CC BY) license (https://creativecommons.org/licenses/by/4.0/).
Share and Cite
Basheer, A.A.; Selim, E.I.; Ahmed, A.; Kotb, A. Evaluation of Groundwater Resources in the Qeft Area of Egypt: A Geophysical and Geochemical Perspective. Sustainability 2024, 16, 4815. https://doi.org/10.3390/su16114815
Basheer AA, Selim EI, Ahmed A, Kotb A. Evaluation of Groundwater Resources in the Qeft Area of Egypt: A Geophysical and Geochemical Perspective. Sustainability. 2024; 16(11):4815. https://doi.org/10.3390/su16114815
Chicago/Turabian StyleBasheer, Alhussein Adham, Elsayed I. Selim, Alaa Ahmed, and Adel Kotb. 2024. "Evaluation of Groundwater Resources in the Qeft Area of Egypt: A Geophysical and Geochemical Perspective" Sustainability 16, no. 11: 4815. https://doi.org/10.3390/su16114815