
Pedestrian Walking Speed Analysis: A Systematic Review

Abstract
:1. Introduction
- (1)
- Pedestrian flow characteristics: including pedestrian traffic states and the impact of other pedestrians upon speed (density, flow).
- (2)
- Pedestrian attributes: such as age, gender, and physical attributes that affect pedestrian walking speed.
- (3)
- Layout configuration: taking into consideration the layout of the walking environment (e.g., bottlenecks, corridors, inclination, surface), as well as the land use and permanent or temporary obstacles.
- (4)
- Ambient conditions: including noises and season/weather conditions.
- (5)
- Pedestrian behavioral patterns: including walking in a group, carrying baggage, and using a mobile phone.
2. Materials and Methods
2.1. Search Strategy
- Medical studies: wounds and injuries, injury scale, craniocerebral trauma;
- Pedestrian safety: navigation, collision avoidance; and
- Simulated data: forecasting.
- Data provided from simulation models or prediction models;
- Vertical movement and evacuation experiments;
- Lateral oscillation structure;
- Studies on pedestrian speed after trauma/stroke or studies on pedestrians with disabilities or on rehab conditions;
- Studying the effect of speed on behavior (e.g., probability of collision);
- Studies on stride interval or gait gap;
- Monitoring the accessibility or walkability of a city/neighborhood.
2.2. Synthesis Method
- Year when data collection was conducted, if reported, and the country;
- Location, whether it was a public facility (indoor) or public space (outdoor);
- Research objective;
- Data collection method (field observation/experiment), number of participants, duration of recordings, and technical means (video camera, stopwatch, etc.);
- Data extraction method;
- Results, including the influential factor and walking speed rates, if reported.
3. Results
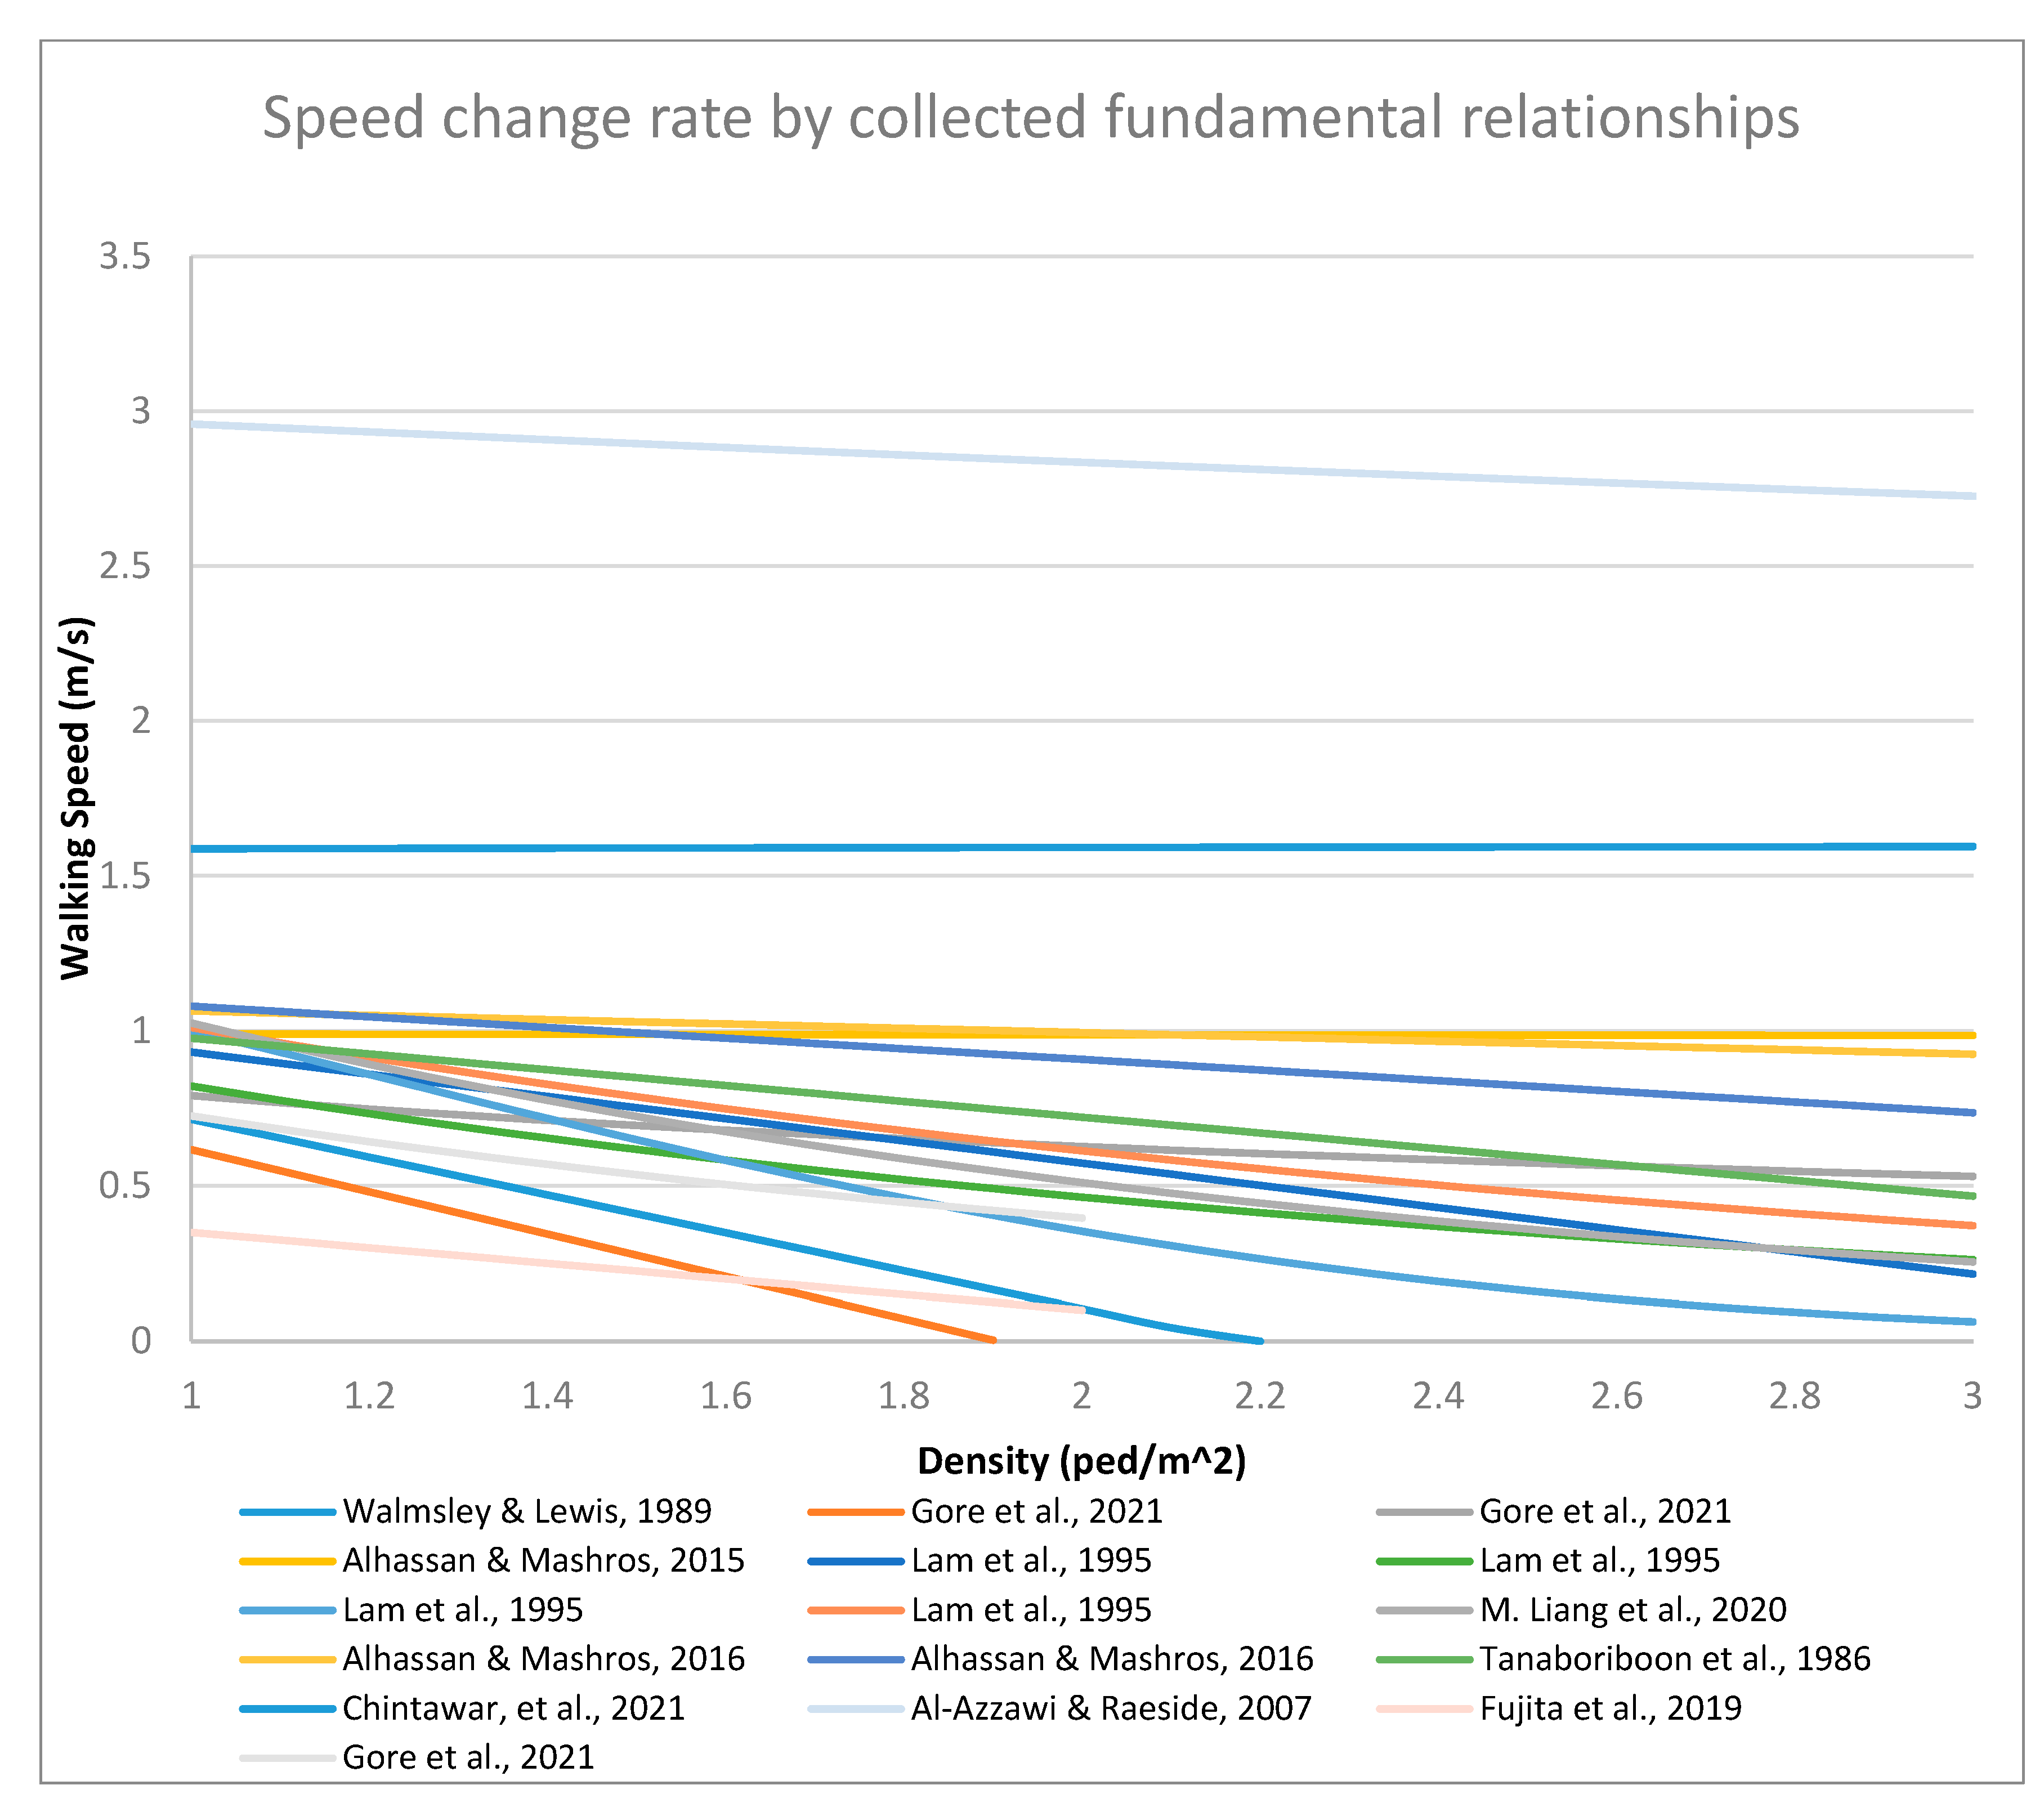
3.1. Pedestrian Flow Characteristics
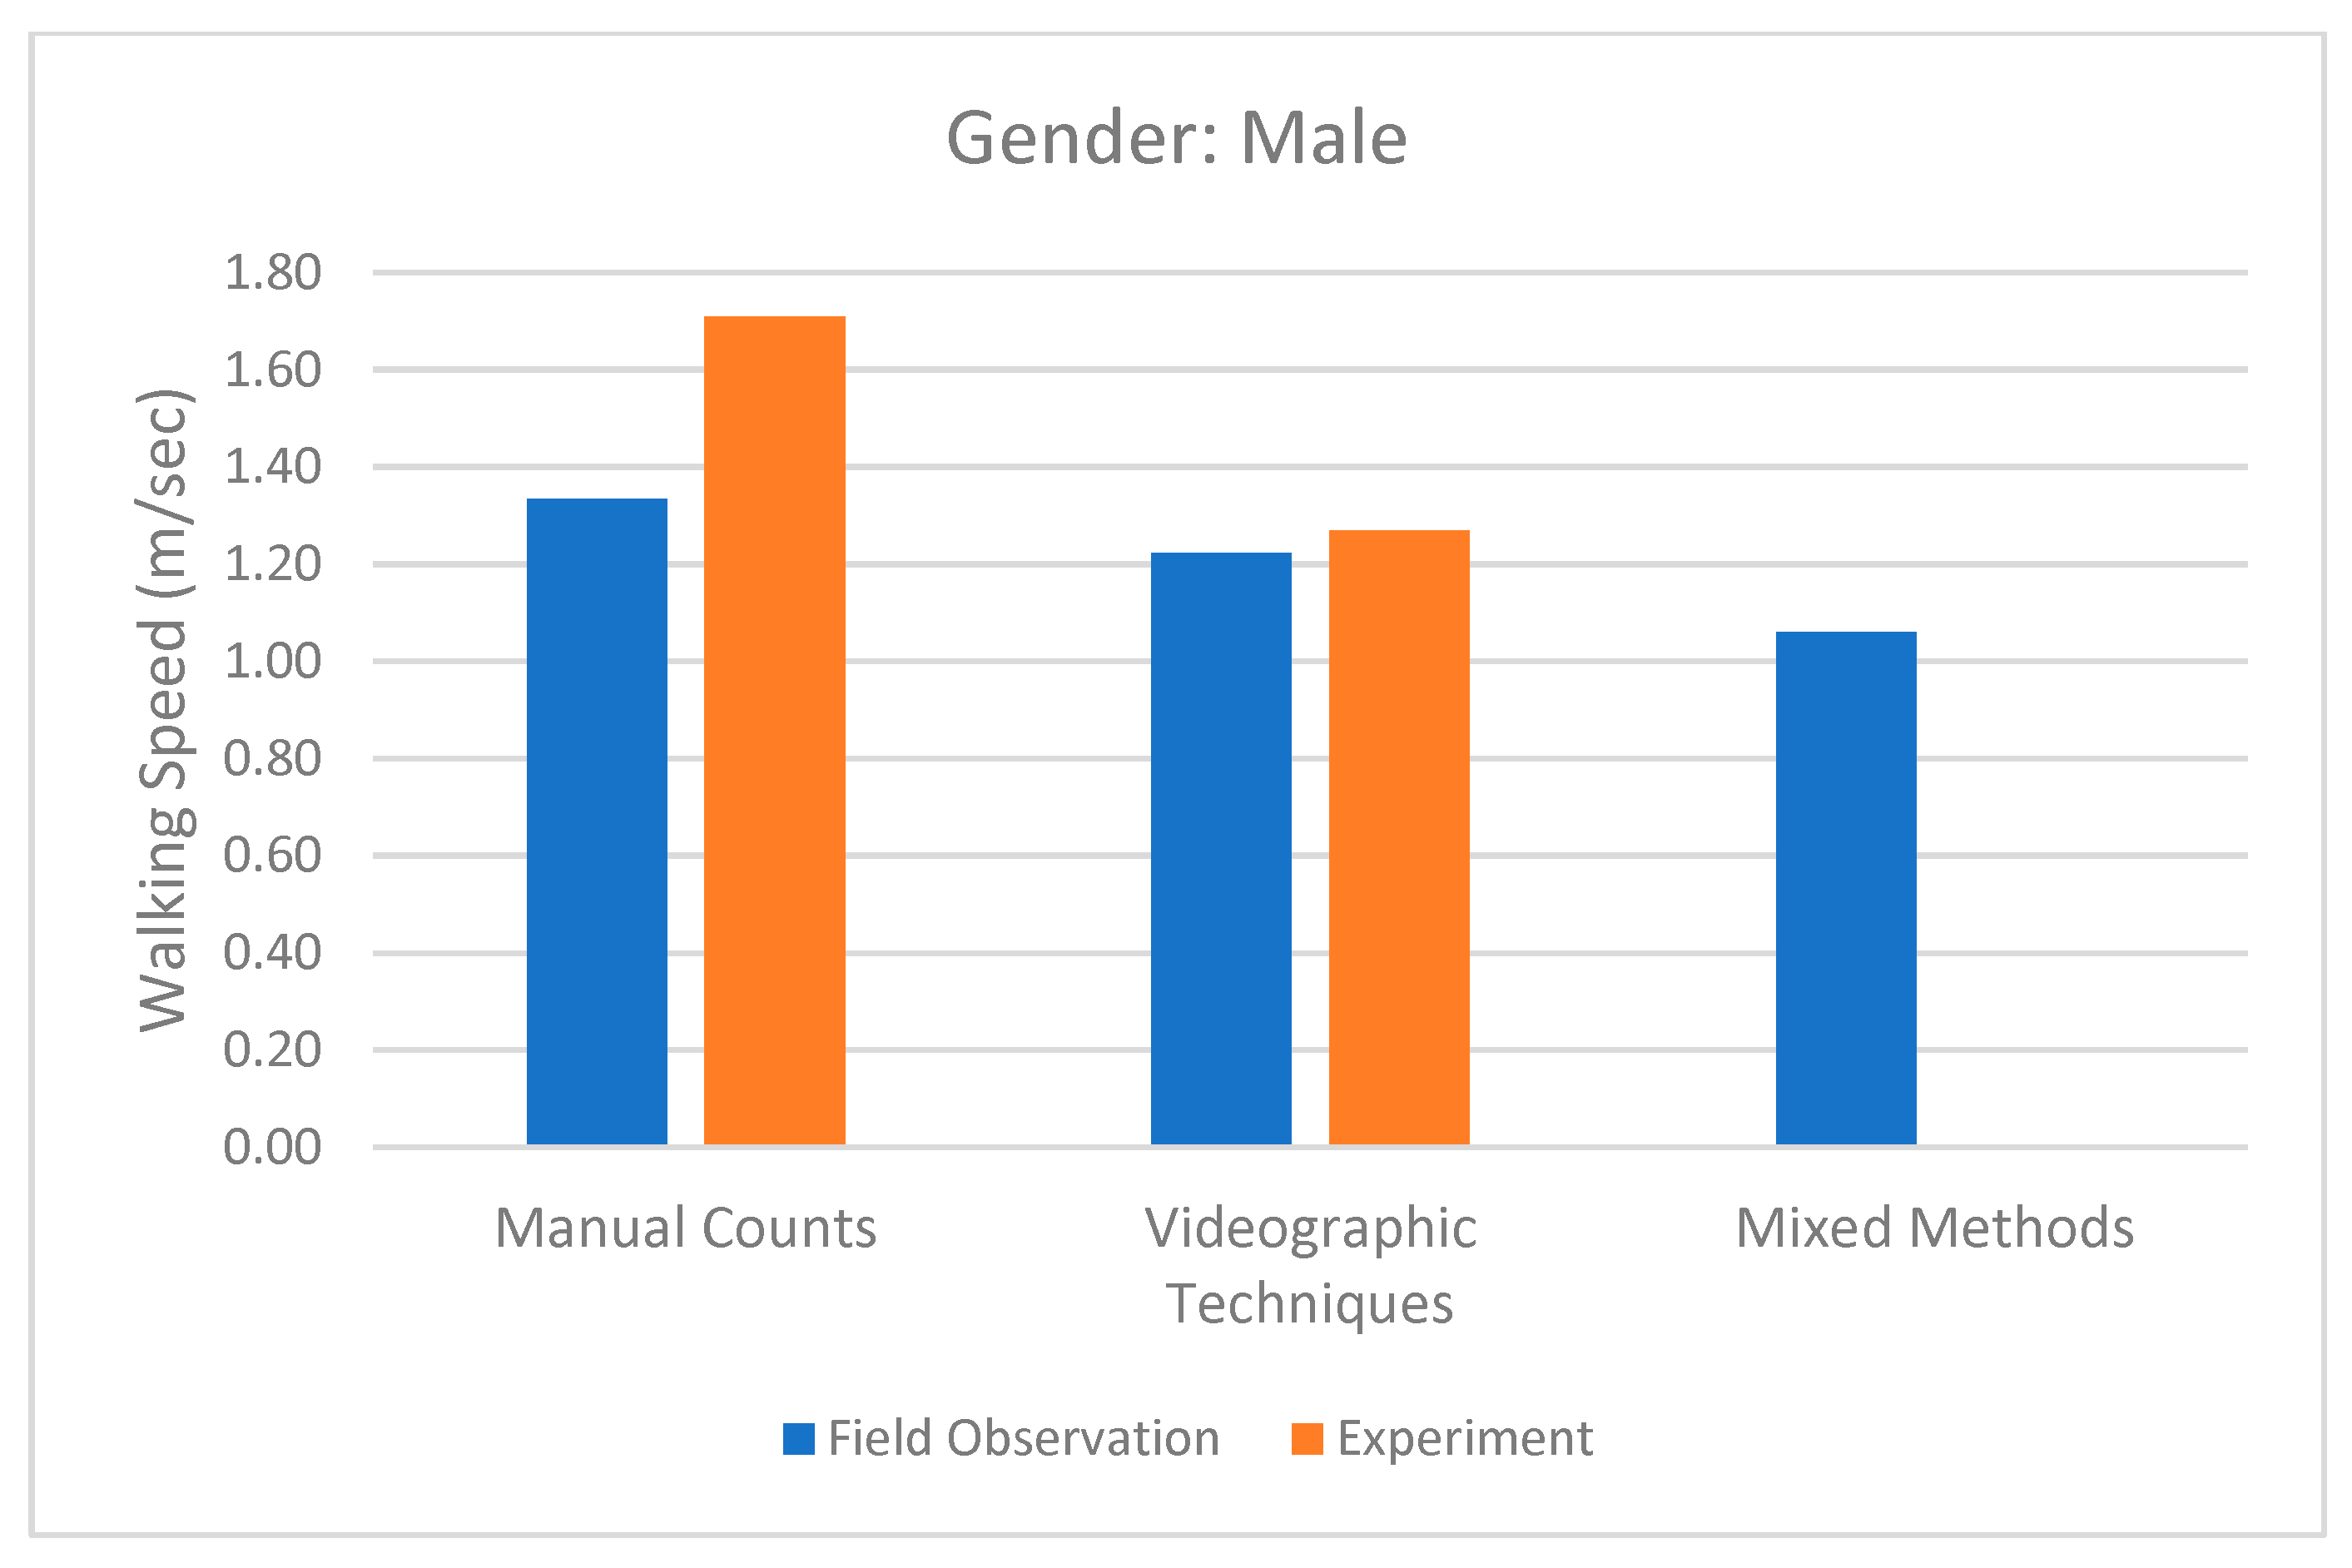
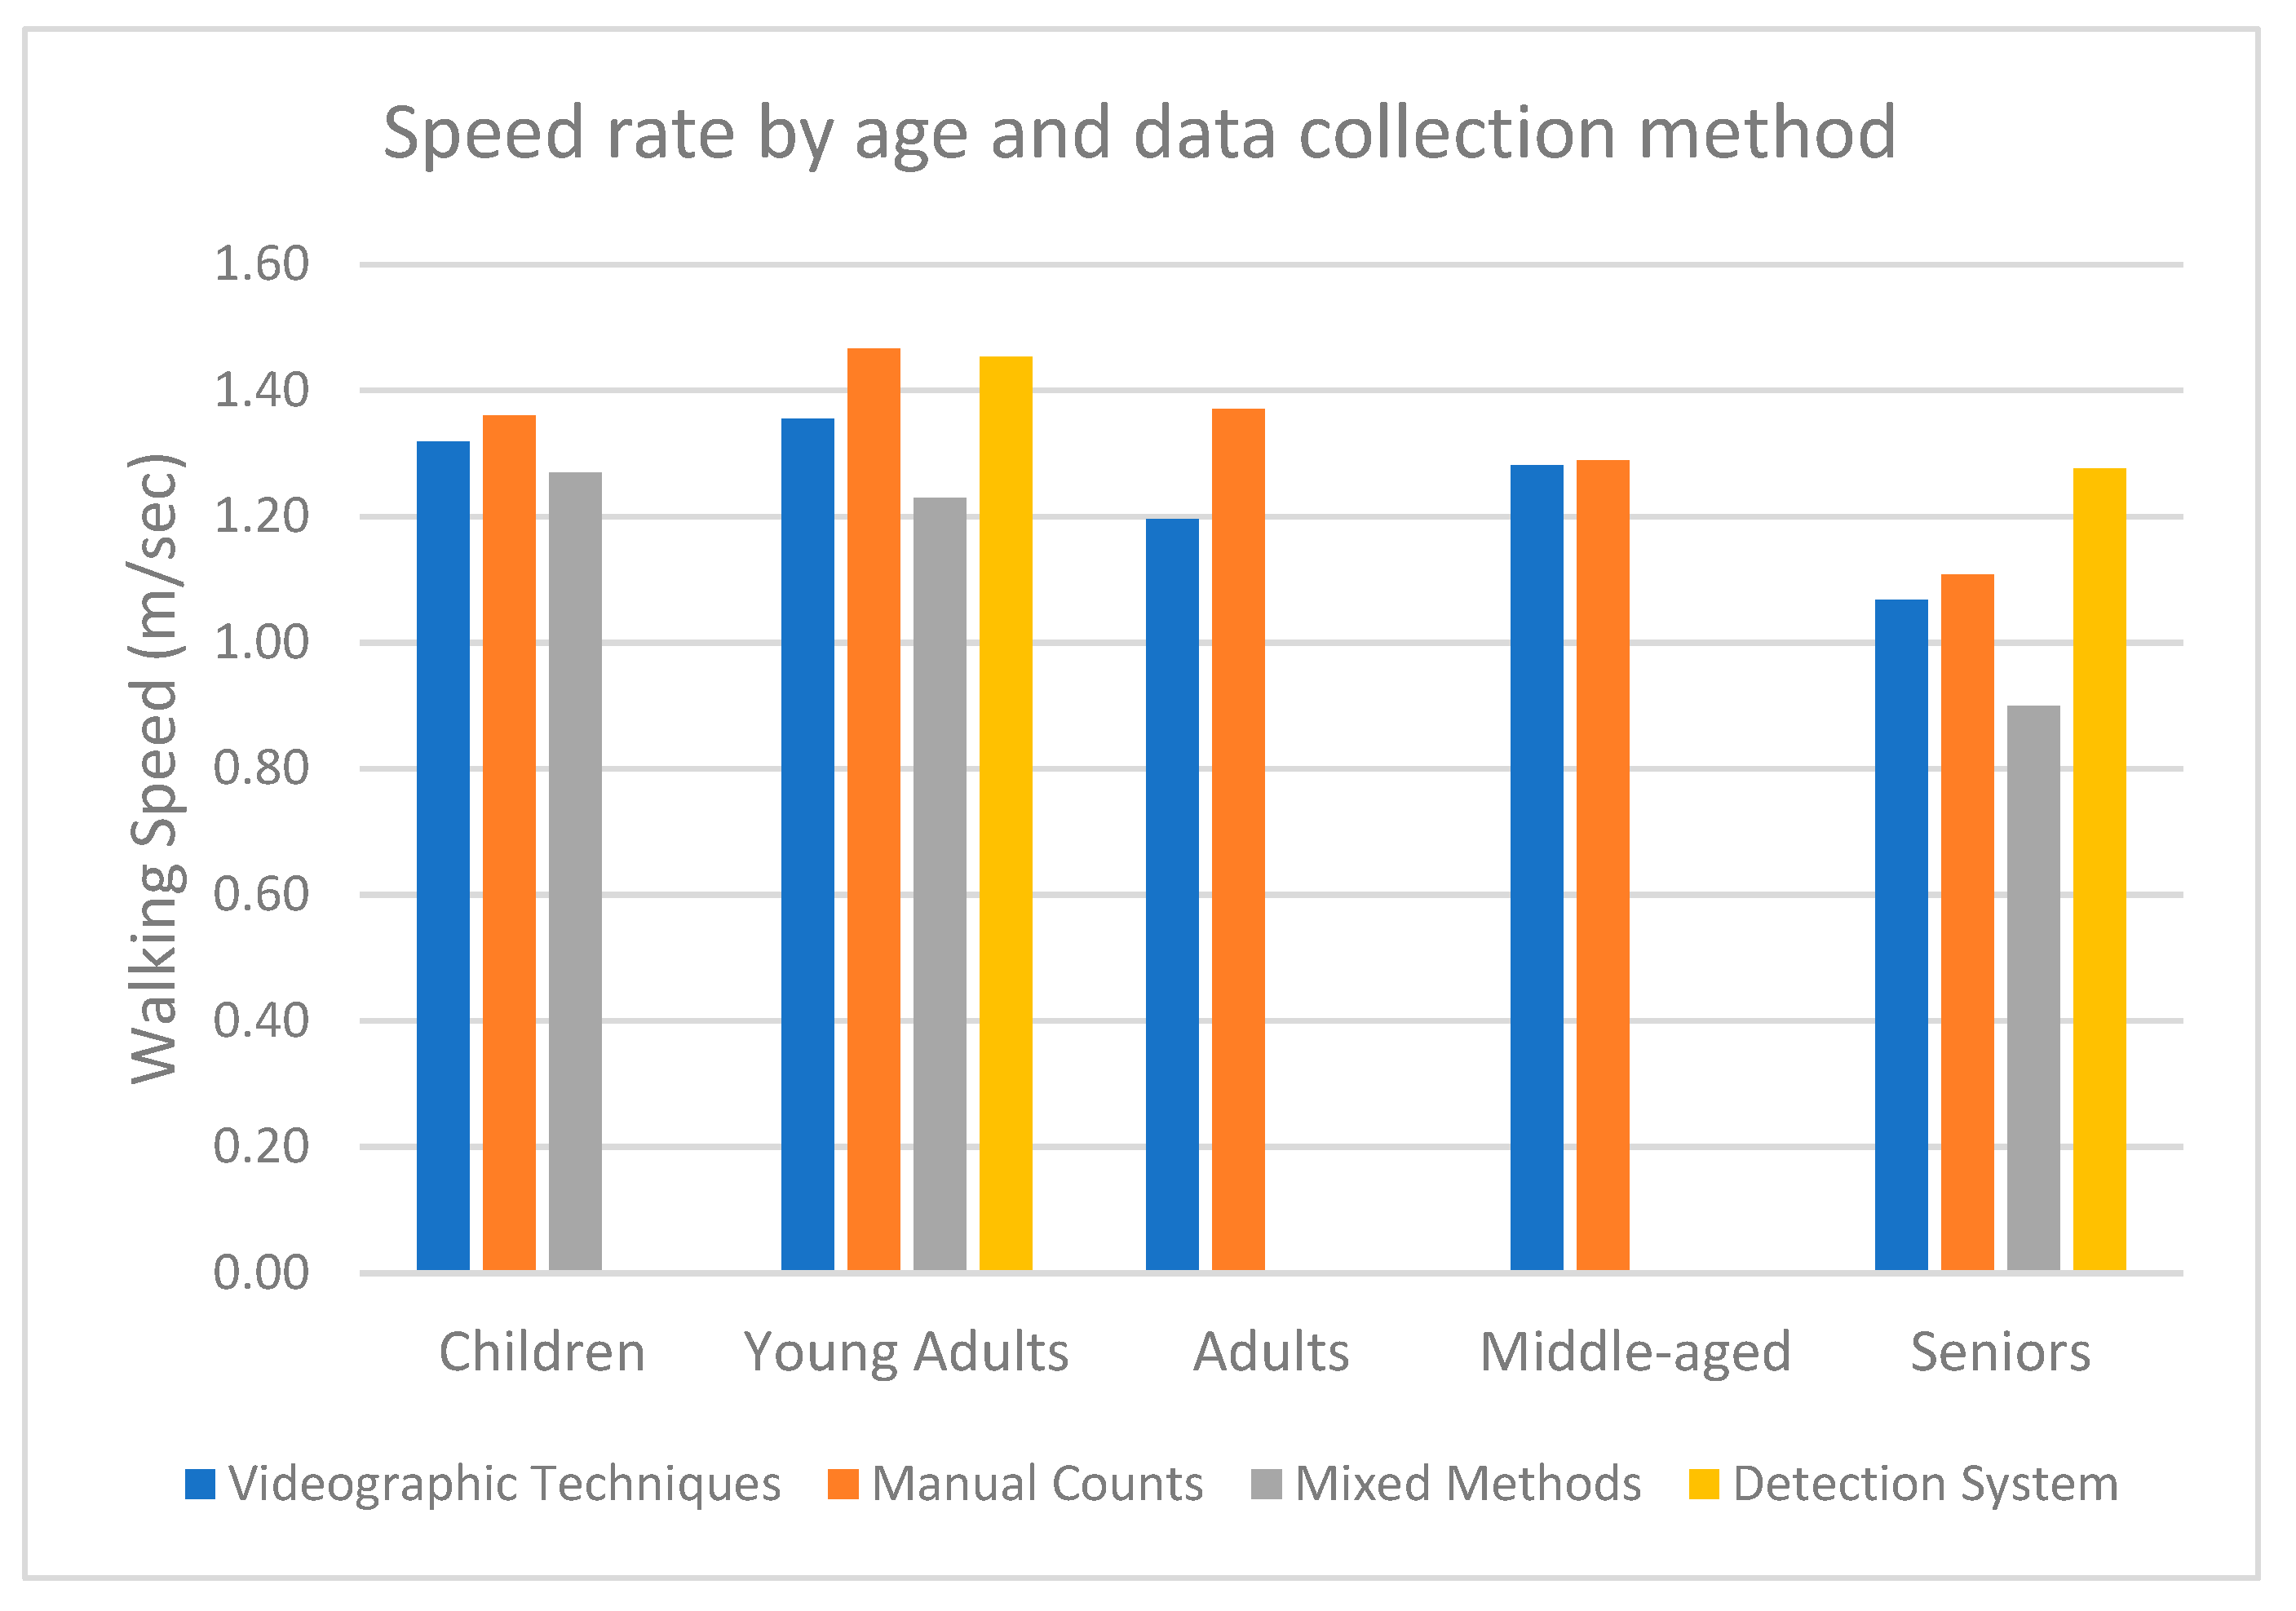
3.2. Pedestrian Attributes
3.3. Layout Configuration
3.4. Ambient Conditions
3.5. Pedestrian Behavioral Patterns
3.6. Meta Analysis
4. Conclusions and Discussion
Funding
Conflicts of Interest
References
- National Research Council (U.S.); Transportation Research Board. Highway Capacity Manual; Transportation Research Board: Washington, DC, USA; National Research Council: Washington, DC, USA, 2000; ISBN 0309066816. [Google Scholar]
- National Academies of Sciences, Engineering, and Medicine. Transit Capacity and Quality of Service Manual, 3rd ed.; Transportation Research Board: Washington, DC, USA, 2013. [Google Scholar]
- Fruin, J.J. Designing for Pedestrians: A Level-of-Service Concept; Polytechnic Institute of Brooklyn: Brooklyn, NY, USA, 1971. [Google Scholar]
- Federal Highway Administration (FHWA). The Manual on Uniform Traffic Control Devices (MUTCD); US Department of Transportation, Federal Highway Administation: Washington, DC, USA, 2009.
- Christoforou, Z.; Chandakas, E.; Kaparias, I. Investigating the Impact of Dwell Time on the Reliability of Urban Light Rail Operations. Urban. Rail Transit. 2020, 6, 116–131. [Google Scholar] [CrossRef]
- Christoforou, Z.; Collet, P.-A.; Kabalan, B.; Leurent, F.; de Feraudy, A.; Ali, A.; Arakelian-von Freeden, T.J.; Li, Y. Influencing Longitudinal Passenger Distribution on Railway Platforms to Shorten and Regularize Train Dwell Times. Transp. Res. Rec. 2017, 2648, 117–125. [Google Scholar] [CrossRef]
- Combs, T.S.; Pardo, C.F. Shifting Streets COVID-19 Mobility Data: Findings from a Global Dataset and a Research Agenda for Transport Planning and Policy. Transp. Res. Interdiscip. Perspect. 2021, 9, 100322. [Google Scholar] [CrossRef]
- Lord, S.; Cloutier, M.S.; Garnier, B.; Christoforou, Z. Crossing Road Intersections in Old Age—With or without Risks? Perceptions of Risk and Crossing Behaviours among the Elderly. Transp. Res. Part. F Traffic Psychol. Behav. 2018, 55, 282–296. [Google Scholar] [CrossRef]
- Bendak, S.; Alnaqbi, A.M.; Alzarooni, M.Y.; Aljanaahi, S.M.; Alsuwaidi, S.J. Factors Affecting Pedestrian Behaviors at Signalized Crosswalks: An Empirical Study. J. Safety Res. 2021, 76, 269–275. [Google Scholar] [CrossRef] [PubMed]
- Lei, B.; Xu, J.; Li, M.; Li, H.; Li, J.; Cao, Z.; Hao, Y.; Zhang, Y. Enhancing Role of Guiding Signs Setting in Metro Stations with Incorporation of Microscopic Behavior of Pedestrians. Sustainability 2019, 11, 6109. [Google Scholar] [CrossRef]
- Franĕk, M.; Režný, L.; Šefara, D.; Cabal, J. Effect of Traffic Noise and Relaxations Sounds on Pedestrian Walking Speed. Int. J. Environ. Res. Public Health 2018, 15, 752. [Google Scholar] [CrossRef] [PubMed]
- Lam, W.H.K.; Cheung, C.-Y. Pedestrian Speed/Flow Relationships for Walking Facilities in Hong Kong. J. Transp. Eng. 2000, 126, 343–349. [Google Scholar] [CrossRef]
- Liang, S.; Leng, H.; Yuan, Q.; Wang, B.W.; Yuan, C. How Does Weather and Climate Affect Pedestrian Walking Speed during Cool and Cold Seasons in Severely Cold Areas? Build. Environ. 2020, 175, 106811. [Google Scholar] [CrossRef]
- Sun, L.; Yang, Z.; Rong, J.; Liu, X. Study on the Weaving Behavior of High Density Bidirectional Pedestrian Flow. Math. Probl. Eng. 2014, 2014, 765659. [Google Scholar] [CrossRef]
- Walmsley, D.J.; Lewis, G.J. The Pace of Pedestrian Flows in Cities. Environ. Behav. 1989, 21, 123–150. [Google Scholar] [CrossRef]
- Abdul Sukor, N.S.; Rahman, N.A.; Rohani, M.M.; Ambak, K.; Hassan, S.A. Pedestrian Movement at the Unpaid Concourse Area in KLCC Train Station. Int. J. Integr. Eng. 2019, 11, 279–291. [Google Scholar] [CrossRef]
- Cepolina, E.M.; Menichini, F.; Gonzalez Rojas, P. Pedestrian Level of Service: The Impact of Social Groups on Pedestrian Flow Characteristics. Int. J. Sustain. Dev. Plan. 2017, 12, 839–848. [Google Scholar] [CrossRef]
- Abbood, A.N.; Hussein, S.A. Evaluation and Improvement Pedestrians Characteristics for Selection Section of Urban Area. Period. Eng. Nat. Sci. 2021, 9, 508–513. [Google Scholar] [CrossRef]
- Chintawar, N.; Tallam, T.; Lakshmana Rao, K.M. Calibration of Fundamental Flow Model for Pedestrian Sidewalks in Urban Areas. In Advances in Civil Engineering; Singh, R.M., Sudheer, K.P., Kurian, B., Eds.; Springer: Singapore, 2021; pp. 427–437. [Google Scholar]
- Al-Mukaram, N.; Musa, S.S. Determination of Pedestrian Level of Service on Sidewalks in Samawah City. In Proceedings of the IOP Conference Series: Materials Science and Engineering, Thi-Qar, Iraq, 15–16 July 2020; IOP Publishing Ltd.: Bristol, UK, 2020; Volume 928. [Google Scholar]
- Abishai Polus, B.; Schofer, J.L.; Ushpiz, A. Pedestrian Flow and Level of Service. J. Transp. Eng. 1983, 109, 46–56. [Google Scholar] [CrossRef]
- Gore, N.; Dave, S.; Shah, J.; Arkatkar, S.; Pulugurtha, S. Effect of On-Street Parking on Pedestrian Flow Characteristics and Level of Service—An Indian Viewpoint. Case Stud. Transp. Policy 2021, 9, 1386–1398. [Google Scholar] [CrossRef]
- Zacharias, J. Pedestrian Dynamics on Narrow Pavements in High-Density Hong Kong. J. Urban Manag. 2021, 10, 409–418. [Google Scholar] [CrossRef]
- Lam, W.H.K.; Morrall, J.F.; Ho, H. Pedestrian Flow Characteristics in Hong Kong. Transp. Res. Rec. 1995, 1487, 56–62. [Google Scholar]
- Boles, W.E.; Hayward, S.C. Effects of Urban Noise and Sidewalk Density upon Pedestrian Cooperation and Tempo. J. Soc. Psychol. 1978, 104, 29–35. [Google Scholar] [CrossRef]
- Goh, P.K.; Lam, W.H.K. Pedestrian Flows and Walking Speed: A Problem at Signalized Crosswalks. Inst. Transp. Eng. 2004, 74, 28–33. [Google Scholar]
- Ropaka, M.; Nikolaou, D.; Yannis, G. Investigation of Traffic and Safety Behavior of Pedestrians While Texting or Web-Surfing. Traffic Inj. Prev. 2020, 21, 389–394. [Google Scholar] [CrossRef] [PubMed]
- Al-Azzawi, M.; Raeside, R. Modeling Pedestrian Walking Speeds on Sidewalks. J. Urban Plan. Dev. 2007, 133, 211–219. [Google Scholar] [CrossRef]
- Ma, J.; Shi, D.; Li, T.; Li, X.; Xu, T.; Lin, P. Experimental Study of Single-File Pedestrian Movement with Height Constraints. J. Stat. Mech. Theory Exp. 2020, 2020, 073409. [Google Scholar] [CrossRef]
- Zhang, B.; Chen, W.; Ma, X.; Qiu, P.; Liu, F. Experimental Study on Pedestrian Behavior in a Mixed Crowd of Individuals and Groups. Phys. A Stat. Mech. Its Appl. 2020, 556, 124814. [Google Scholar] [CrossRef]
- Ren, X.; Zhang, J.; Song, W. Flows of Walking and Running Pedestrians in a Corridor through Exits of Different Widths. Saf. Sci. 2021, 133, 105040. [Google Scholar] [CrossRef]
- Liang, M.; Xu, J.; Jia, L.; Qin, Y. An Improved Model of Passenger Merging in a Y-Shaped Passage. Phys. A Stat. Mech. Its Appl. 2020, 540, 123233. [Google Scholar] [CrossRef]
- Fujita, A.; Feliciani, C.; Yanagisawa, D.; Nishinari, K. Traffic Flow in a Crowd of Pedestrians Walking at Different Speeds. Phys. Rev. E 2019, 99, 062307. [Google Scholar] [CrossRef] [PubMed]
- Chattaraj, U.; Kahali, D.; Das, A.K. Studies on Impacts of Gender Mix on Pedestrian Fundamental Diagram. Eur. Transp. - Trasp. Eur. 2017, 65, 6. [Google Scholar]
- Alhassan, H.M.; Mashros, N. Modelling of Pedestrian Speed-Density and Volume-Density Relationships in Outdoor Walkways. J. Teknol. 2015, 73, 91–97. [Google Scholar]
- Alhassan, H.M.; Mashros, N. Characterisation and Modelling of Pedestrian Flows in Hospital and Academic Environments. J. Teknol. 2016, 78, 49–57. [Google Scholar] [CrossRef]
- Tanaboriboon, Y.; Hwa, S.S.; Chor, C.H. Pedestrian Characteristics Study in Singapore. J. Transp. Eng. 1986, 112, 229–235. [Google Scholar] [CrossRef]
- Caputcu, M.; Sengoz, B.; Ozuysal, M.; Tanyel, S.; Kaplan, S.; Karabayir, A. Use of Laser Measurements and Video Images to Investigate Pedestrian Movement along Non-Uniform Sidewalks. In Proceedings of the World Congress on Civil, Structural, and Environmental Engineering, Prague, Czech Republic, 30–31 March 2016. [Google Scholar]
- Das, S.; Mukherjee, D.; Saha, P.; Roy, S.K. Pedestrian Flow Characteristics at Signalized Intersections in Mixed Traffic Situations: A Case Study in Kolkata, India. In Procedia Computer Science; Elsevier B.V.: Porto, Portugal, 2018; Volume 130, pp. 150–156. [Google Scholar]
- Bouterse, L.; Wall-Scheffler, C. Children Are Not like Other Loads: A Cross-Cultural Perspective on the Influence of Burdens and Companionship on Human Walking. PeerJ 2018, 2018, e5547. [Google Scholar] [CrossRef]
- Alver, Y.; Onelcin, P.; Cicekli, A.; Abdel-Aty, M. Evaluation of Pedestrian Critical Gap and Crossing Speed at Midblock Crossing Using Image Processing. Accid. Anal. Prev. 2021, 156, 106127. [Google Scholar] [CrossRef]
- Tarawneh, M.S. Evaluation of Pedestrian Speed in Jordan with Investigation of Some Contributing Factors. J. Safety Res. 2001, 32, 229–236. [Google Scholar] [CrossRef]
- Easa, S.M.; Cheng, J. Reliability Analysis of Minimum Pedestrian Green Interval for Traffic Signals. J. Transp. Eng. 2013, 139, 651–659. [Google Scholar] [CrossRef]
- Avineri, E.; Shinar, D.; Susilo, Y.O. Pedestrians’ Behaviour in Cross Walks: The Effects of Fear of Falling and Age. Accid. Anal. Prev. 2012, 44, 30–34. [Google Scholar] [CrossRef] [PubMed]
- Mohammed, H.A. Assessment of Distracted Pedestrian Crossing Behavior at Midblock Crosswalks. IATSS Res. 2021, 45, 584–593. [Google Scholar] [CrossRef]
- Muley, D.; Kharbeche, M.; Alhajyaseen, W.K.M.; Al-Salem, M. Empirical Study on Pedestrian Signal Design and Compliance in the State of Qatar. Int. J. Civ. Eng. 2019, 17, 1653–1666. [Google Scholar] [CrossRef]
- Aghabayk, K.; Esmailpour, J.; Jafari, A.; Shiwakoti, N. Observational-Based Study to Explore Pedestrian Crossing Behaviors at Signalized and Unsignalized Crosswalks. Accid. Anal. Prev. 2021, 151, 105990. [Google Scholar] [CrossRef]
- Hassouna, F.M.A. Evaluation of Pedestrian Walking Speed Change Patterns at Crosswalks in Palestine. Open Transp. J. 2020, 14, 44–49. [Google Scholar] [CrossRef]
- Carmeli, E.; Coleman, R.; Omar, H.L.; Brown-Cross, D. Do We Allow Elderly Pedestrians Sufficient Time to Cross the Street in Safety? J. Aging Phys. Act. 2000, 8, 51–58. [Google Scholar] [CrossRef]
- Aghabayk, K.; Parishad, N.; Shiwakoti, N. Investigation on the Impact of Walkways Slope and Pedestrians Physical Characteristics on Pedestrians Normal Walking and Jogging Speeds. Saf. Sci. 2021, 133, 105012. [Google Scholar] [CrossRef]
- Bargegol, I.; Najafi Moghaddam Gilani, V.; Hosseinian, S.M.; Habibzadeh, M. Pedestrians Crossing and Walking Speeds Analysis in Urban Areas under the Influence of Rain and Personality Characteristics. Math. Probl. Eng. 2022, 2022, 7768160. [Google Scholar] [CrossRef]
- Finnis, K.K.; Walton, D. Field Observations to Determine the Influence of Population Size, Location and Individual Factors on Pedestrian Walking Speeds. Ergonomics 2008, 51, 827–842. [Google Scholar] [CrossRef]
- Koushki, P.A. Walking Characteristics in Central Riydah, Saudi Arabia. J. Transp. Eng. 1988, 114, 735–744. [Google Scholar] [CrossRef]
- Fossum, M.; Ryeng, E.O. The Walking Speed of Pedestrians on Various Pavement Surface Conditions during Winter. Transp. Res. D Transp. Environ. 2021, 97, 102934. [Google Scholar] [CrossRef]
- Wirtz, P.; Ries, G. The Pace of Life—Reanalysed: Why Does Walking Speed of Pedestrians Correlate with City Size? Behaviour 1992, 123, 77–83. [Google Scholar] [CrossRef]
- Sun, J.; Walters, M.; Svensson, N.; Lloyd, D. The Influence of Surface Slope on Human Gait Characteristics: A Study of Urban Pedestrians Walking on an Inclined Surface. Ergonomics 1996, 39, 677–692. [Google Scholar] [CrossRef] [PubMed]
- Rahman, K.; Ghani, N.A.; Kamil, A.A.; Mustafa, A. Analysis of Pedestrian Free Flow Walking Speed in a Least Developing Country: A Factorial Design Study. Res. J. Appl. Sci. Eng. Technol. 2012, 4, 4299–4304. [Google Scholar]
- Rastogi, R.; Thaniarasu, I.; Chandra, S. Design Implications of Walking Speed for Pedestrian Facilities. J. Transp. Eng. 2011, 137, 687–696. [Google Scholar] [CrossRef]
- Asher, L.; Aresu, M.; Falaschetti, E.; Mindell, J. Most Older Pedestrians Are Unable to Cross the Road in Time: A Cross-Sectional Study. Age Ageing 2012, 41, 690–694. [Google Scholar] [CrossRef] [PubMed]
- Mohamad Ali, M.F.; Abustan, M.S.; Talib, S.H.A. A Case Study of Malaysian Pedestrian Walking Speed at Shopping Malls in Kuala Lumpur, Malaysia Using Human Behaviour Simulator (HBS). Int. J. Integr. Eng. 2019, 11, 225–230. [Google Scholar] [CrossRef]
- Ekawati, F.F.; Eves, F.F. Effects of Climbing Choice, Demographic, and Climate on Walking Behavior. Kesmas 2020, 15, 59–64. [Google Scholar] [CrossRef]
- Anik, M.A.H.; Hossain, M.; Habib, M.A. Investigation of Pedestrian Jaywalking Behaviour at Mid-Block Locations Using Artificial Neural Networks. Saf. Sci. 2021, 144, 105448. [Google Scholar] [CrossRef]
- Shaaban, K. Analysis of Pedestrian Crossing Speeds at Signalized Intersections in Qatar. Arab. J. Sci. Eng. 2019, 44, 4467–4476. [Google Scholar] [CrossRef]
- Wei, D.; Liu, H.; Tian, Z. Vehicle Delay Estimation at Unsignalised Pedestrian Crosswalks with Probabilistic Yielding Behaviour. Transp. A Transp. Sci. 2015, 11, 103–118. [Google Scholar] [CrossRef]
- Sangeeth, K.; Lokre, A. Factors Influencing Pedestrian Speed in Level of Service (LOS) of Pedestrian Facilities. Transp. Res. Interdiscip. Perspect. 2019, 3, 100066. [Google Scholar] [CrossRef]
- Andrews, A.W.; Chinworth, S.A.; Bourassa, M.; Garvin, M.; Benton, D.; Tanner, S. Update on Distance and Velocity Requirements for Community Ambulation. J. Geriatr. Phys. Ther. 2010, 33, 128–134. [Google Scholar] [CrossRef] [PubMed]
- Deluka-Tibljaš, A.; Šurdonja, S.; Ištoka Otković, I. Analysis of Children’s Traffic Behaviour at Signalized Crosswalks as a Precondition for Safe Children Routes Design: A Case Study from Croatia. J. Adv. Transp. 2021, 2021, 7936261. [Google Scholar] [CrossRef]
- Bandini, S.; Crociani, L.; Gorrini, A.; Nishinari, K.; Vizzari, G. Walkability Assessment for the Elderly Through Simulations: The LONGEVICITY Project. In Proceedings of the 17th International Conference of the Italian Association for Artificial Intelligence—AI*AAL, Trento, Italy, 20–23 November 2018; Volume 2333, pp. 83–91. [Google Scholar]
- Pinna, F.; Murrau, R. Age Factor and Pedestrian Speed on Sidewalks. Sustainability (Switzerland) 2018, 10, 4084. [Google Scholar] [CrossRef]
- Zhang, H.; Xi, B. Heterogeneous pedestrian traffic flow modelling at signalised intersections. Promet.-Traffic-Traffico 2022, 34, 165–177. [Google Scholar] [CrossRef]
- Amosun, S.L.; Burgess, T.; Groeneveldt, L.; Hodgson, T. Are Elderly Pedestrians Allowed Enough Time at Pedestrian Crossings in Cape Town, South Africa? Physiother. Theory Pract. 2007, 23, 325–332. [Google Scholar] [CrossRef]
- Bollard, E.; Fleming, H. A Study to Investigate the Walking Speed of Elderly Adults with Relation to Pedestrian Crossings. Physiother. Theory Pract. 2013, 29, 142–149. [Google Scholar] [CrossRef]
- Zito, G.A.; Cazzoli, D.; Scheffler, L.; Jäger, M.; Müri, R.M.; Mosimann, U.P.; Nyffeler, T.; Mast, F.W.; Nef, T. Street Crossing Behavior in Younger and Older Pedestrians: An Eye- and Head-Tracking Study Psychology, Psychiatry and Quality of Life. BMC Geriatr. 2015, 15, 176. [Google Scholar] [CrossRef]
- Delzenne, J.; Bourrelly, A.; Garnier, C.; Naveteur, J.; Watelain, E. How Do Healthy Older Pedestrians Walk When They Cross the Street? Comput. Methods Biomech. Biomed. Eng. 2014, 17, 98–99. [Google Scholar] [CrossRef] [PubMed]
- Gérin-Lajoie, M.; Richards, C.L.; McFadyen, B.J. The Circumvention of Obstacles during Walking in Different Environmental Contexts: A Comparison between Older and Younger Adults. Gait Posture 2006, 24, 364–369. [Google Scholar] [CrossRef]
- Pedersen, E.; Johansson, M. Dynamic Pedestrian Lighting: Effects on Walking Speed, Legibility and Environmental Perception. Light. Res. Technol. 2018, 50, 522–536. [Google Scholar] [CrossRef]
- Tipakornkiat, C.; Limanond, T.; Kim, H. Determining an Influencing Area Affecting Walking Speed on Footpath: A Case Study of a Footpath in CBD Bangkok, Thailand. Phys. A Stat. Mech. Its Appl. 2012, 391, 5453–5464. [Google Scholar] [CrossRef]
- Hamann, C.; Dulf, D.; Baragan-Andrada, E.; Price, M.; Peek-Asa, C. Contributors to Pedestrian Distraction and Risky Behaviours during Road Crossings in Romania. Inj. Prev. 2017, 23, 370–376. [Google Scholar] [CrossRef]
- Abdullah, W.S.; Al Qemaqchi, N.T. The Impact of University Campus Spatial Organisation on Pedestrian Speed: A Comparison between the Old and New Campuses of Sulaimani University. Interact. Des. Archit. 2021, 47, 256–273. [Google Scholar] [CrossRef]
- Bae, Y.H.; Kim, Y.C.; Oh, R.S.; Son, J.Y.; Hong, W.H.; Choi, J.H. Walking Speed Reduction Rates at Intersections While Wayfinding Indoors: An Experimental Study. Fire Mater. 2021, 45, 498–507. [Google Scholar] [CrossRef]
- Gaire, N.; Sadra Sharifi, M.; Christensen, K.; Chen, A.; Song, Z. Walking Behavior of Individuals with and without Disabilities at Right-Angle Turning Facility. J. Access. Des. All. 2017, 7, 56–75. [Google Scholar] [CrossRef]
- Hannun, J.; Dias, C.; Taha, A.H.; Almutairi, A.; Alhajyaseen, W.; Sarvi, M.; Al-Bosta, S. Pedestrian Flow Characteristics through Different Angled Bends: Exploring the Spatial Variation of Velocity. PLoS ONE 2022, 17, e0264635. [Google Scholar] [CrossRef]
- Aghabayk, K.; Radmehr, K.; Shiwakoti, N. Effect of Intersecting Angle on Pedestrian Crowd Flow under Normal and Evacuation Conditions. Sustainability 2020, 12, 1301. [Google Scholar] [CrossRef]
- Shiwakoti, N. Understanding Differences in Emergency Escape and Experimental Pedestrian Crowd Egress through Quantitative Comparison. Int. J. Disaster Risk Reduct. 2016, 20, 129–137. [Google Scholar] [CrossRef]
- Ma, J.; Song, W.-G.; Fang, Z.-M.; Lo, S.-M.; Liao, G.-X. Experimental Study on Microscopic Moving Characteristics of Pedestrians in Built Corridor Based on Digital Image Processing. Build. Environ. 2010, 45, 2160–2169. [Google Scholar] [CrossRef]
- Franěk, M. Environmental Factors Influencing Pedestrian Walking Speed. Percept. Mot. Skills 2013, 116, 992–1019. [Google Scholar] [CrossRef] [PubMed]
- Berkouk, D.; Karim Bouzir, T.A.; Maffei, L.; Masullo, M. Examining the Associations between Oases Soundscape Components and Walking Speed: Correlation or Causation? Sustainability 2020, 12, 4619. [Google Scholar] [CrossRef]
- Brščić, D.; Kanda, T. Changes in Usage of an Indoor Public Space: Analysis of One Year of Person Tracking. IEEE Trans. Hum. Mach. Syst. 2015, 45, 228–237. [Google Scholar] [CrossRef]
- Elman, D.; Schulte, D.C.; Bukoff, A. Effects of Facial Expression and Stare Duration on Walking Speed: Two Field Experiments. Environ. Psychol. Nonverbal Behav. 1977, 2, 93–99. [Google Scholar] [CrossRef]
- Chang, K.; Foss, P.; Larrea, M.; Bautista, E. Student Pedestrian Walking Speeds at Crosswalks Near Schools. Transp. Res. Rec. 2018, 2672, 22–29. [Google Scholar] [CrossRef]
- Wei, X.; Lv, W.; Song, W.; Li, X. Survey Study and Experimental Investigation on the Local Behavior of Pedestrian Groups. Complexity 2015, 20, 87–97. [Google Scholar] [CrossRef]
- Lamberg, E.M.; Muratori, L.M. Cell Phones Change the Way We Walk. Gait Posture 2012, 35, 688–690. [Google Scholar] [CrossRef]
- Licence, S.; Smith, R.; McGuigan, M.P.; Earnest, C.P. Gait Pattern Alterations during Walking, Texting and Walking and Texting during Cognitively Distractive Tasks While Negotiating Common Pedestrian Obstacles. PLoS ONE 2015, 10, e0133281. [Google Scholar] [CrossRef] [PubMed]
- Alsaleh, R.; Sayed, T.; Zaki, M.H. Assessing the Effect of Pedestrians’ Use of Cell Phones on Their Walking Behavior: A Study Based on Automated Video Analysis. Transp. Res. Rec. 2018, 2672, 46–57. [Google Scholar] [CrossRef]
- Brennan, A.C.; Breloff, S.P. The Effect of Various Cell Phone Related Activities on Gait Kinematics. J. Musculoskelet. Res. 2019, 22, 1950011. [Google Scholar] [CrossRef]
- Chen, S.-H.; Lo, O.-Y.; Kay, T.; Chou, L.-S. Concurrent Phone Texting Alters Crossing Behavior and Induces Gait Imbalance during Obstacle Crossing. Gait Posture 2018, 62, 422–425. [Google Scholar] [CrossRef] [PubMed]
- Gruden, C.; Otković, I.I.; Šraml, M. Safety Analysis of Young Pedestrian Behavior at Signalized Intersections: An Eye-Tracking Study. Sustainability (Switzerland) 2021, 13, 4419. [Google Scholar] [CrossRef]
- Krasovsky, T.; Lanir, J.; Felberbaum, Y.; Kizony, R. Mobile Phone Use during Gait: The Role of Perceived Prioritization and Executive Control. Int. J. Environ. Res. Public Health 2021, 18, 8637. [Google Scholar] [CrossRef]
- Plummer, P.; Apple, S.; Dowd, C.; Keith, E. Texting and Walking: Effect of Environmental Setting and Task Prioritization on Dual-Task Interference in Healthy Young Adults. Gait Posture 2015, 41, 46–51. [Google Scholar] [CrossRef]
- Shi, Z.; Zhang, J.; Ren, X.; Song, W. Quantifying the Impact of Luggage on Pedestrian Walking and Running Movements. Saf. Sci. 2020, 130, 104856. [Google Scholar] [CrossRef]
- Shi, Z.; Zhang, J.; Song, W.; Ren, X.; Weibin, M. Experimental Study of Luggage-Laden Pedestrian Flow in Walking and Running Conditions. J. Stat. Mech. Theory Exp. 2020, 2020, 073410. [Google Scholar] [CrossRef]
- Almodfer, R.; Xiong, S.; Kong, X.; Duan, P. Pedestrian Crossing Speed Patterns and Running Frequency Analysis at a Non-Signalized Marked Crosswalk: Quantitative and Qualitative Approaches. Sustain. Cities Soc. 2017, 34, 183–192. [Google Scholar] [CrossRef]
- Yang, C.; Xia, Y. Interval Pareto Front-Based Multi-Objective Robust Optimization for Sensor Placement in Structural Modal Identification. Reliab. Eng. Syst. Saf. 2024, 242, 109703. [Google Scholar] [CrossRef]
- Yang, C.; Ouyang, H. A Novel Load-Dependent Sensor Placement Method for Model Updating Based on Time-Dependent Reliability Optimization Considering Multi-Source Uncertainties. Mech. Syst. Signal Process 2022, 165, 108386. [Google Scholar] [CrossRef]
- Yang, C. Interval Strategy-Based Regularization Approach for Force Reconstruction with Multi-Source Uncertainties. Comput. Methods Appl. Mech. Eng. 2024, 419, 116679. [Google Scholar] [CrossRef]
- Bosina, E. A New Generic Approach to the Pedestrian Fundamental Diagram; 183 Institut Für Verkehrsplanung Und Transportsysteme; ETH Zürich: Zürich, Switzerland, 2018. [Google Scholar]
- Yang, C.; Lu, W.; Xia, Y. Positioning Accuracy Analysis of Industrial Robots Based on Non-Probabilistic Time-Dependent Reliability. IEEE Trans. Reliab. 2024, 73, 608–621. [Google Scholar] [CrossRef]
- Yang, C.; Lu, W.; Xia, Y. Reliability-Constrained Optimal Attitude-Vibration Control for Rigid-Flexible Coupling Satellite Using Interval Dimension-Wise Analysis. Reliab. Eng. Syst. Saf. 2023, 237, 109382. [Google Scholar] [CrossRef]


| Reference | Country | Location | Method | Data Collection | Fundamental Relationship |
|---|---|---|---|---|---|
| [19] | India | Sidewalk | Field Observation | Videographic Techniques | |
| [22] | India | Sidewalk | Field Observation | Videographic Techniques | (linear) |
(exponential) | |||||
(logarithmic) | |||||
| [24] | Hong Kong | Walkway/Crosswalks | Field Observation | Videographic Techniques and Manual Counts | (indoor walkway) |
(outdoor walkway), | |||||
(signalized crosswalk), | |||||
(light rail transit crosswalk) | |||||
| [15] | England and Australia | Walkway | Field Observation | Manual Counts | |
| [28] | Scotland | Walkway | Field Observation | Videographic Techniques | |
| [32] | China | Laboratory | Field Observation | Videographic Techniques | |
| [35] | Nigeria | Walkway | Field Observation | Videographic Techniques | |
| [36] | Nigeria | Walkway | Field Observation | Videographic Techniques | (university environment) |
(hospital environment) | |||||
| [37] | Singapore | Sidewalk | Field Observation | Videographic Techniques & Manual Counts |
| Reference | Country | Location | Method | Data Collection | Gender | Walking Speed |
|---|---|---|---|---|---|---|
| [59] | UK | Public Facility | Experiment | Manual Counts | Female | 0.80 |
| Male | 0.90 | |||||
| [25] | Pennsylvania | Sidewalk | Experiment | Manual Counts | Female | 3.10 |
| Male | 2.79 | |||||
| [50] | Iran | Walkway | Experiment | Manual Counts | Female | 1.31 |
| Male | 1.40 | |||||
| [34] | India | Public Facility | Experiment | Videographic Techniques | Female | 1.24 |
| Male | 1.27 | |||||
| [38] | Turkey | Sidewalk | Field Observation | Detection System | Male | 1.34 |
| Female | 1.27 | |||||
| [61] | UK | Public Facility | Field Observation | Manual Counts | Female | 1.04 |
| Male | 1.11 | |||||
| [43] | Canada | Signalized Crosswalk | Field Observation | Manual Counts | Female | 1.44 |
| Male | 1.50 | |||||
| China | Signalized Crosswalk | Field Observation | Manual Counts | Female | 1.23 | |
| Male | 1.26 | |||||
| [48] | Palestine | Signalized Crosswalk | Field Observation | Manual Counts | Female | 1.30 |
| Male | 1.39 | |||||
| [42] | Jordan | Signalized Crosswalk | Field Observation | Manual Counts | Female | 1.33 |
| Male | 1.35 | |||||
| [65] | India | Street | Field Observation | Manual Counts | Female | 1.20 |
| Male | 1.30 | |||||
| [48] * | Palestine | Unsignalized Crosswalk | Field Observation | Manual Counts | Female | 1.32 |
| Male | 1.43 | |||||
| [66] | North Carolina | Walkway | Field Observation | Manual Counts | Female | 1.20 |
| Male | 1.39 | |||||
| [53] | Saudi Arabia | Walkway | Field Observation | Manual Counts | Female | 0.88 |
| Male | 1.17 | |||||
| [56] | Australia | Walkway | Field Observation | Manual Counts | Female | 1.10 |
| Male | 1.19 | |||||
| [37] | Singapore | Sidewalk | Field Observation | Mixed Methods | Female | 1.15 |
| Male | 1.32 | |||||
| [40] | Uganda | Walkway | Field Observation | Mixed Methods | Male | 1.04 |
| Female | 0.89 | |||||
| USA | Walkway | Field Observation | Mixed Methods | Male | 0.8 | |
| Female | 0.84 | |||||
| [60] | Kuala Lumpur | Public Facility | Field Observation | Videographic Techniques | Female | 0.81 |
| Male | 0.93 | |||||
| [51] * | Iran | Sidewalk | Field Observation | Videographic Techniques | Female | 0.98 |
| Male | 1.10 | |||||
| [57] | Bangladesh | Sidewalk | Field Observation | Videographic Techniques | Female | 1.24 |
| Male | 1.07 | |||||
| [58] | India | Sidewalk | Field Observation | Videographic Techniques | Female | 1.11 |
| Male | 1.15 | |||||
| [23] | Hong Kong | Sidewalk | Field Observation | Videographic Techniques | Female | 1.10 |
| Male | 1.21 | |||||
| [51] | Iran | Signalized Crosswalk | Field Observation | Videographic Techniques | Female | 1.19 |
| Male | 1.29 | |||||
| Iran | Midblock Crosswalk | Field Observation | Videographic Techniques | Female | 1.02 | |
| Male | 1.13 | |||||
| [9] | United Arab Emirates | Signalized Crosswalk | Field Observation | Videographic Techniques | Female | 1.10 |
| Male | 1.27 | |||||
| [67] | Croatia | Signalized Crosswalk | Field Observation | Videographic Techniques | Female | 1.48 |
| Male | 1.47 | |||||
| [46] | Qatar | Signalized Crosswalk | Field Observation | Videographic Techniques | Female | 1.39 |
| Male | 1.50 | |||||
| [63] | Qatar | Signalized Crosswalk | Field Observation | Videographic Techniques | Female | 1.38 |
| Male | 1.32 | |||||
| [39] | India | Signalized Crosswalk | Field Observation | Videographic Techniques | Male | 1.52 |
| Female | 1.45 | |||||
| [62] | Bangladesh | Street | Field Observation | Videographic Techniques | Female | 0.71 |
| Male | 0.78 | |||||
| [51] | Iran | Street | Field Observation | Videographic Techniques | Female | 0.92 |
| Male | 1.04 | |||||
| [41] | Turkey | Unsignalized Crosswalk | Field Observation | Videographic Techniques | Male | 1.21 |
| Female | 1.13 | |||||
| [35] | Nigeria | Walkway | Field Observation | Videographic Techniques | Female | 1.07 |
| Male | 1.22 | |||||
| [36] | Nigeria | Walkway | Field Observation | Videographic Techniques | Female | 1.13 |
| Male | 1.15 | |||||
| [52] | New Zealand | Walkway | Field Observation | Videographic Techniques | Female | 1.43 |
| Male | 1.50 |
| Reference | Country | Location | Method | Data Collection | Age Group | Speed (m/s) |
|---|---|---|---|---|---|---|
| [50] | Iran | Walkway | Experiment | - | Young Adults | 1.45 |
| Middle-aged | 1.42 | |||||
| Seniors | 1.19 | |||||
| [75] | - | - | Experiment | Detection System | Young Adults | 1.57 |
| Seniors | 1.38 | |||||
| [59] | UK | Public Facility | Experiment | Manual Counts | Seniors | 0.85 |
| [71] | Cape Town | Signalized Crosswalk | Experiment | Manual Counts | Seniors | 0.86 |
| [38] | Turkey | Public Space | Field Observation | Detection System | Children | 1.12 |
| Young Adults | 1.34 | |||||
| Adults | 1.3 | |||||
| Seniors | 1.17 | |||||
| [48] * | Palestine | Signalized Crosswalk | Field Observation | Manual Counts | Children | 1.31 |
| Young Adults | 1.45 | |||||
| Middle-aged | 1.29 | |||||
| Seniors | 1.13 | |||||
| [43] | Canada | Signalized Crosswalk | Field Observation | Manual Counts | Children | 1.65 |
| Adults | 1.53 | |||||
| Seniors | 1.41 | |||||
| China | Signalized Crosswalk | Field Observation | Manual Counts | Children | 1.25 | |
| Adults | 1.26 | |||||
| Seniors | 1.19 | |||||
| [42] | Jordan | Signalized Crosswalk | Field Observation | Manual Counts | Children | 1.29 |
| Young Adults | 1.49 | |||||
| Adults | 1.47 | |||||
| Middle-aged | 1.29 | |||||
| Seniors | 1.17 | |||||
| [49] | South Florida | Signalized Crosswalk | Field Observation | Manual Counts | Seniors | 0.74 |
| [48] | Palestine | Unsignalized Crosswalk | Field Observation | Manual Counts | Children | 1.23 |
| Young Adults | 1.42 | |||||
| Middle-aged | 1.37 | |||||
| Seniors | 1.09 | |||||
| [65] | India | Walkway | Field Observation | Manual Counts | Children | 1.24 |
| Young Adults | 1.39 | |||||
| Adults | 1.20 | |||||
| Middle-aged | 1.01 | |||||
| Seniors | 0.92 | |||||
| [66] | North Carolina | Walkway | Field Observation | Manual Counts | Middle-aged | 1.30 |
| Seniors | 1.29 | |||||
| [37] | Singapore | Sidewalk | Field Observation | Mixed Methods | Children | 1.27 |
| Young Adults | 1.23 | |||||
| Seniors | 0.90 | |||||
| [60] | Kuala Lumpur | Public Facility | Field Observation | Videographic Techniques | Children | 0.77 |
| Adults | 0.96 | |||||
| Seniors | 0.78 | |||||
| [35] | Nigeria | Public Space | Field Observation | Videographic Techniques | Young Adults | 1.17 |
| Adults | 1.13 | |||||
| [39] | India | Public Space | Field Observation | Videographic Techniques | Children | 1.64 |
| Adults | 1.54 | |||||
| Seniors | 1.24 | |||||
| [68] | Italy | Public Space | Field Observation | Videographic Techniques | Adults | 1.28 |
| Seniors | 1.03 | |||||
| [58] | India | Sidewalk | Field Observation | Videographic Techniques | Children | 1.17 |
| Young Adults | 1.29 | |||||
| Middle-aged | 1.15 | |||||
| Seniors | 0.92 | |||||
| [57] | Bangladesh | Sidewalk | Field Observation | Videographic Techniques | Young Adults | 1.26 |
| Adults | 1.16 | |||||
| Seniors | 1.04 | |||||
| [44] * | Israel | Sidewalk | Field Observation | Videographic Techniques | Young Adults | 1.67 |
| Middle-aged | 1.42 | |||||
| Seniors | 1.19 | |||||
| [69] | Italy | Sidewalk | Field Observation | Videographic Techniques | Children | 1.04 |
| Young Adults | 1.00 | |||||
| Middle-aged | 0.99 | |||||
| Seniors | 0.84 | |||||
| [63] | Qatar | Signalized Crosswalk | Field Observation | Videographic Techniques | Children | - |
| Middle-aged | 1.37 | |||||
| Seniors | 1.24 | |||||
| [67] | Croatia | Signalized Crosswalk | Field Observation | Videographic Techniques | Children | 1.44 |
| [44] | Israel | Signalized Crosswalk | Field Observation | Videographic Techniques | Young Adults | 1.48 |
| Middle-aged | 1.33 | |||||
| Seniors | 1.09 | |||||
| [70] | China | Signalized Crosswalk | Field Observation | Videographic Techniques | Children | 1.24 |
| Middle-aged | 1.18 | |||||
| Seniors | 1.08 | |||||
| [44] | Israel | Unsignalized Crosswalk | Field Observation | Videographic Techniques | Young Adults | 1.49 |
| Middle-aged | 1.39 | |||||
| Seniors | 1.11 | |||||
| [52] | New Zealand | Walkway | Field Observation | Videographic Techniques | Children | 1.38 |
| Young Adults | 1.46 | |||||
| Middle-aged | 1.49 | |||||
| Seniors | 1.37 |
| Reference | Country | Location | Walking in a Group | Carrying a Baggage | Cell Phone Use |
|---|---|---|---|---|---|
| [34] | Turkey | Sidewalk | − | − | |
| [36] | Uganda | Walkway | − | − | |
| [36] | USA | Walkway | − | + | |
| [37] | Turkey | Unsignalized Crosswalk | − | − | |
| [38] | Jordan | Signalized Crosswalk | − | ||
| [41] | USA | Unsignalized Crosswalk | − | − | |
| [48] | New Zealand | Walkway | + | ||
| [54] | Bangladesh | Sidewalk | − | ||
| [55] | India | Sidewalk | − | − | − |
| [61] | Qatar | Signalized Crosswalk | − | + | − |
| [64] | India | Street | − | ||
| [66] | Croatia | Signalized Crosswalk | − | ||
| [89] | USA | Signalized Crosswalk | − | ||
| [92] | China | Walkway | − | ||
| [94] | United Kingdom | Public Facility | − | ||
| [95] | Canada | Signalized Crosswalk | − | ||
| [96] | Signalized Crosswalk | − | |||
| [98] | Slovenia | Signalized Crosswalk | − | ||
| [99] | Public Facility | − | |||
| [100] | - | Public Facility | − |
| Gender | Indoor | Outdoor | ||
|---|---|---|---|---|
| Field Observation | Controlled Experiment | Field Observation | Controlled Experiment | |
| Males | 0.93 | 1.09 | 1.26 | 2.00 |
| Females | 0.81 | 1.02 | 1.17 | 1.80 |
| Pedestrian Behavior | Field Observations | Experiments | Differences |
|---|---|---|---|
| Group | 1.35 | - | - |
| No Group | 1.40 | - | - |
| Baggage | 1.28 | 1.80 | −41% |
| No Baggage | 1.28 | 1.82 | −43% |
| Phone | 1.30 | 1.09 | 16% |
| No Phone | 1.37 | 1.27 | 7% |
Disclaimer/Publisher’s Note: The statements, opinions and data contained in all publications are solely those of the individual author(s) and contributor(s) and not of MDPI and/or the editor(s). MDPI and/or the editor(s) disclaim responsibility for any injury to people or property resulting from any ideas, methods, instructions or products referred to in the content. |
© 2024 by the authors. Licensee MDPI, Basel, Switzerland. This article is an open access article distributed under the terms and conditions of the Creative Commons Attribution (CC BY) license (https://creativecommons.org/licenses/by/4.0/).
Share and Cite
Giannoulaki, M.; Christoforou, Z. Pedestrian Walking Speed Analysis: A Systematic Review. Sustainability 2024, 16, 4813. https://doi.org/10.3390/su16114813
Giannoulaki M, Christoforou Z. Pedestrian Walking Speed Analysis: A Systematic Review. Sustainability. 2024; 16(11):4813. https://doi.org/10.3390/su16114813
Chicago/Turabian StyleGiannoulaki, Maria, and Zoi Christoforou. 2024. "Pedestrian Walking Speed Analysis: A Systematic Review" Sustainability 16, no. 11: 4813. https://doi.org/10.3390/su16114813
APA StyleGiannoulaki, M., & Christoforou, Z. (2024). Pedestrian Walking Speed Analysis: A Systematic Review. Sustainability, 16(11), 4813. https://doi.org/10.3390/su16114813