
Exploring Differences and Evolution of Coordination Level of the Industrial Structure, Economy and Ecological Environment Complex System in Beijing–Tianjin–Hebei Urban Agglomeration

Abstract
:1. Introduction
2. Materials and Methods
2.1. Evaluation Indicators
2.2. Processing Data
2.3. Coupling Coordination Model
2.4. Markov Chain
2.5. GM (1,1) Prediction Model
2.6. Dagum Gini Coefficient
2.7. Kernel Density Estimation
3. Results Analysis
3.1. Comprehensive Evaluation Index of the IS-EC-EE Complex System in BTH
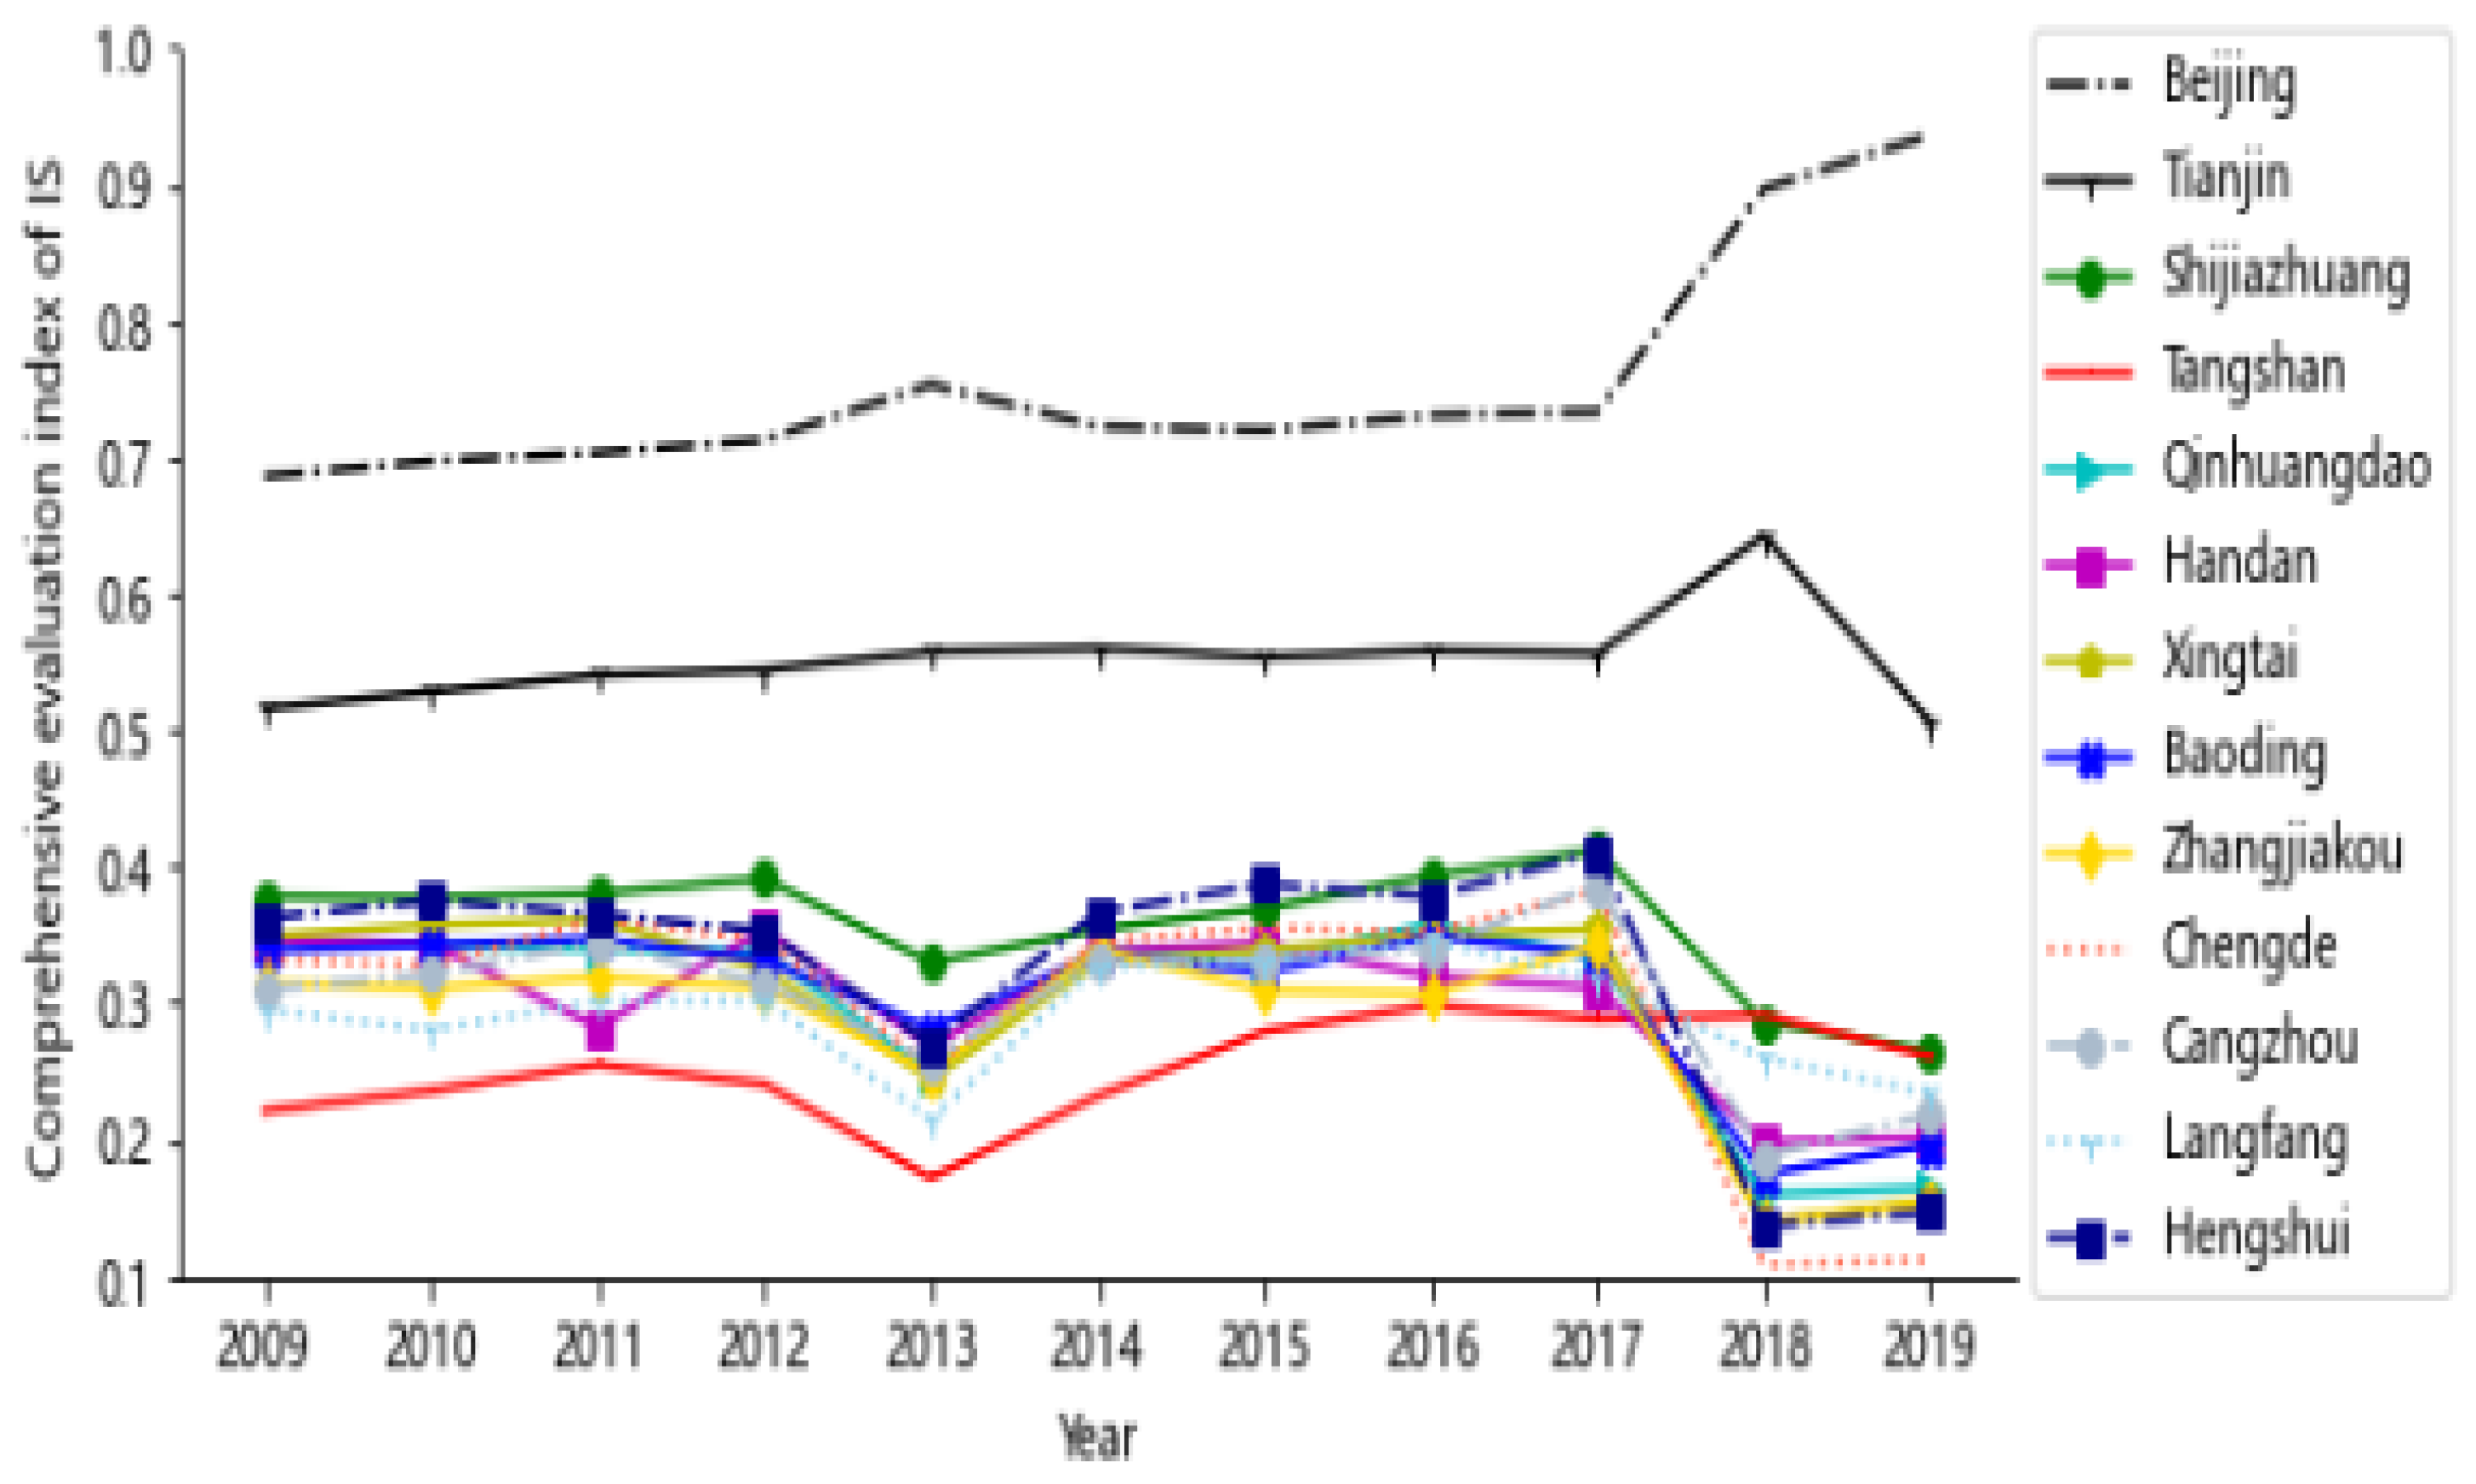
3.1.1. Comprehensive Evaluation of the IS Subsystem
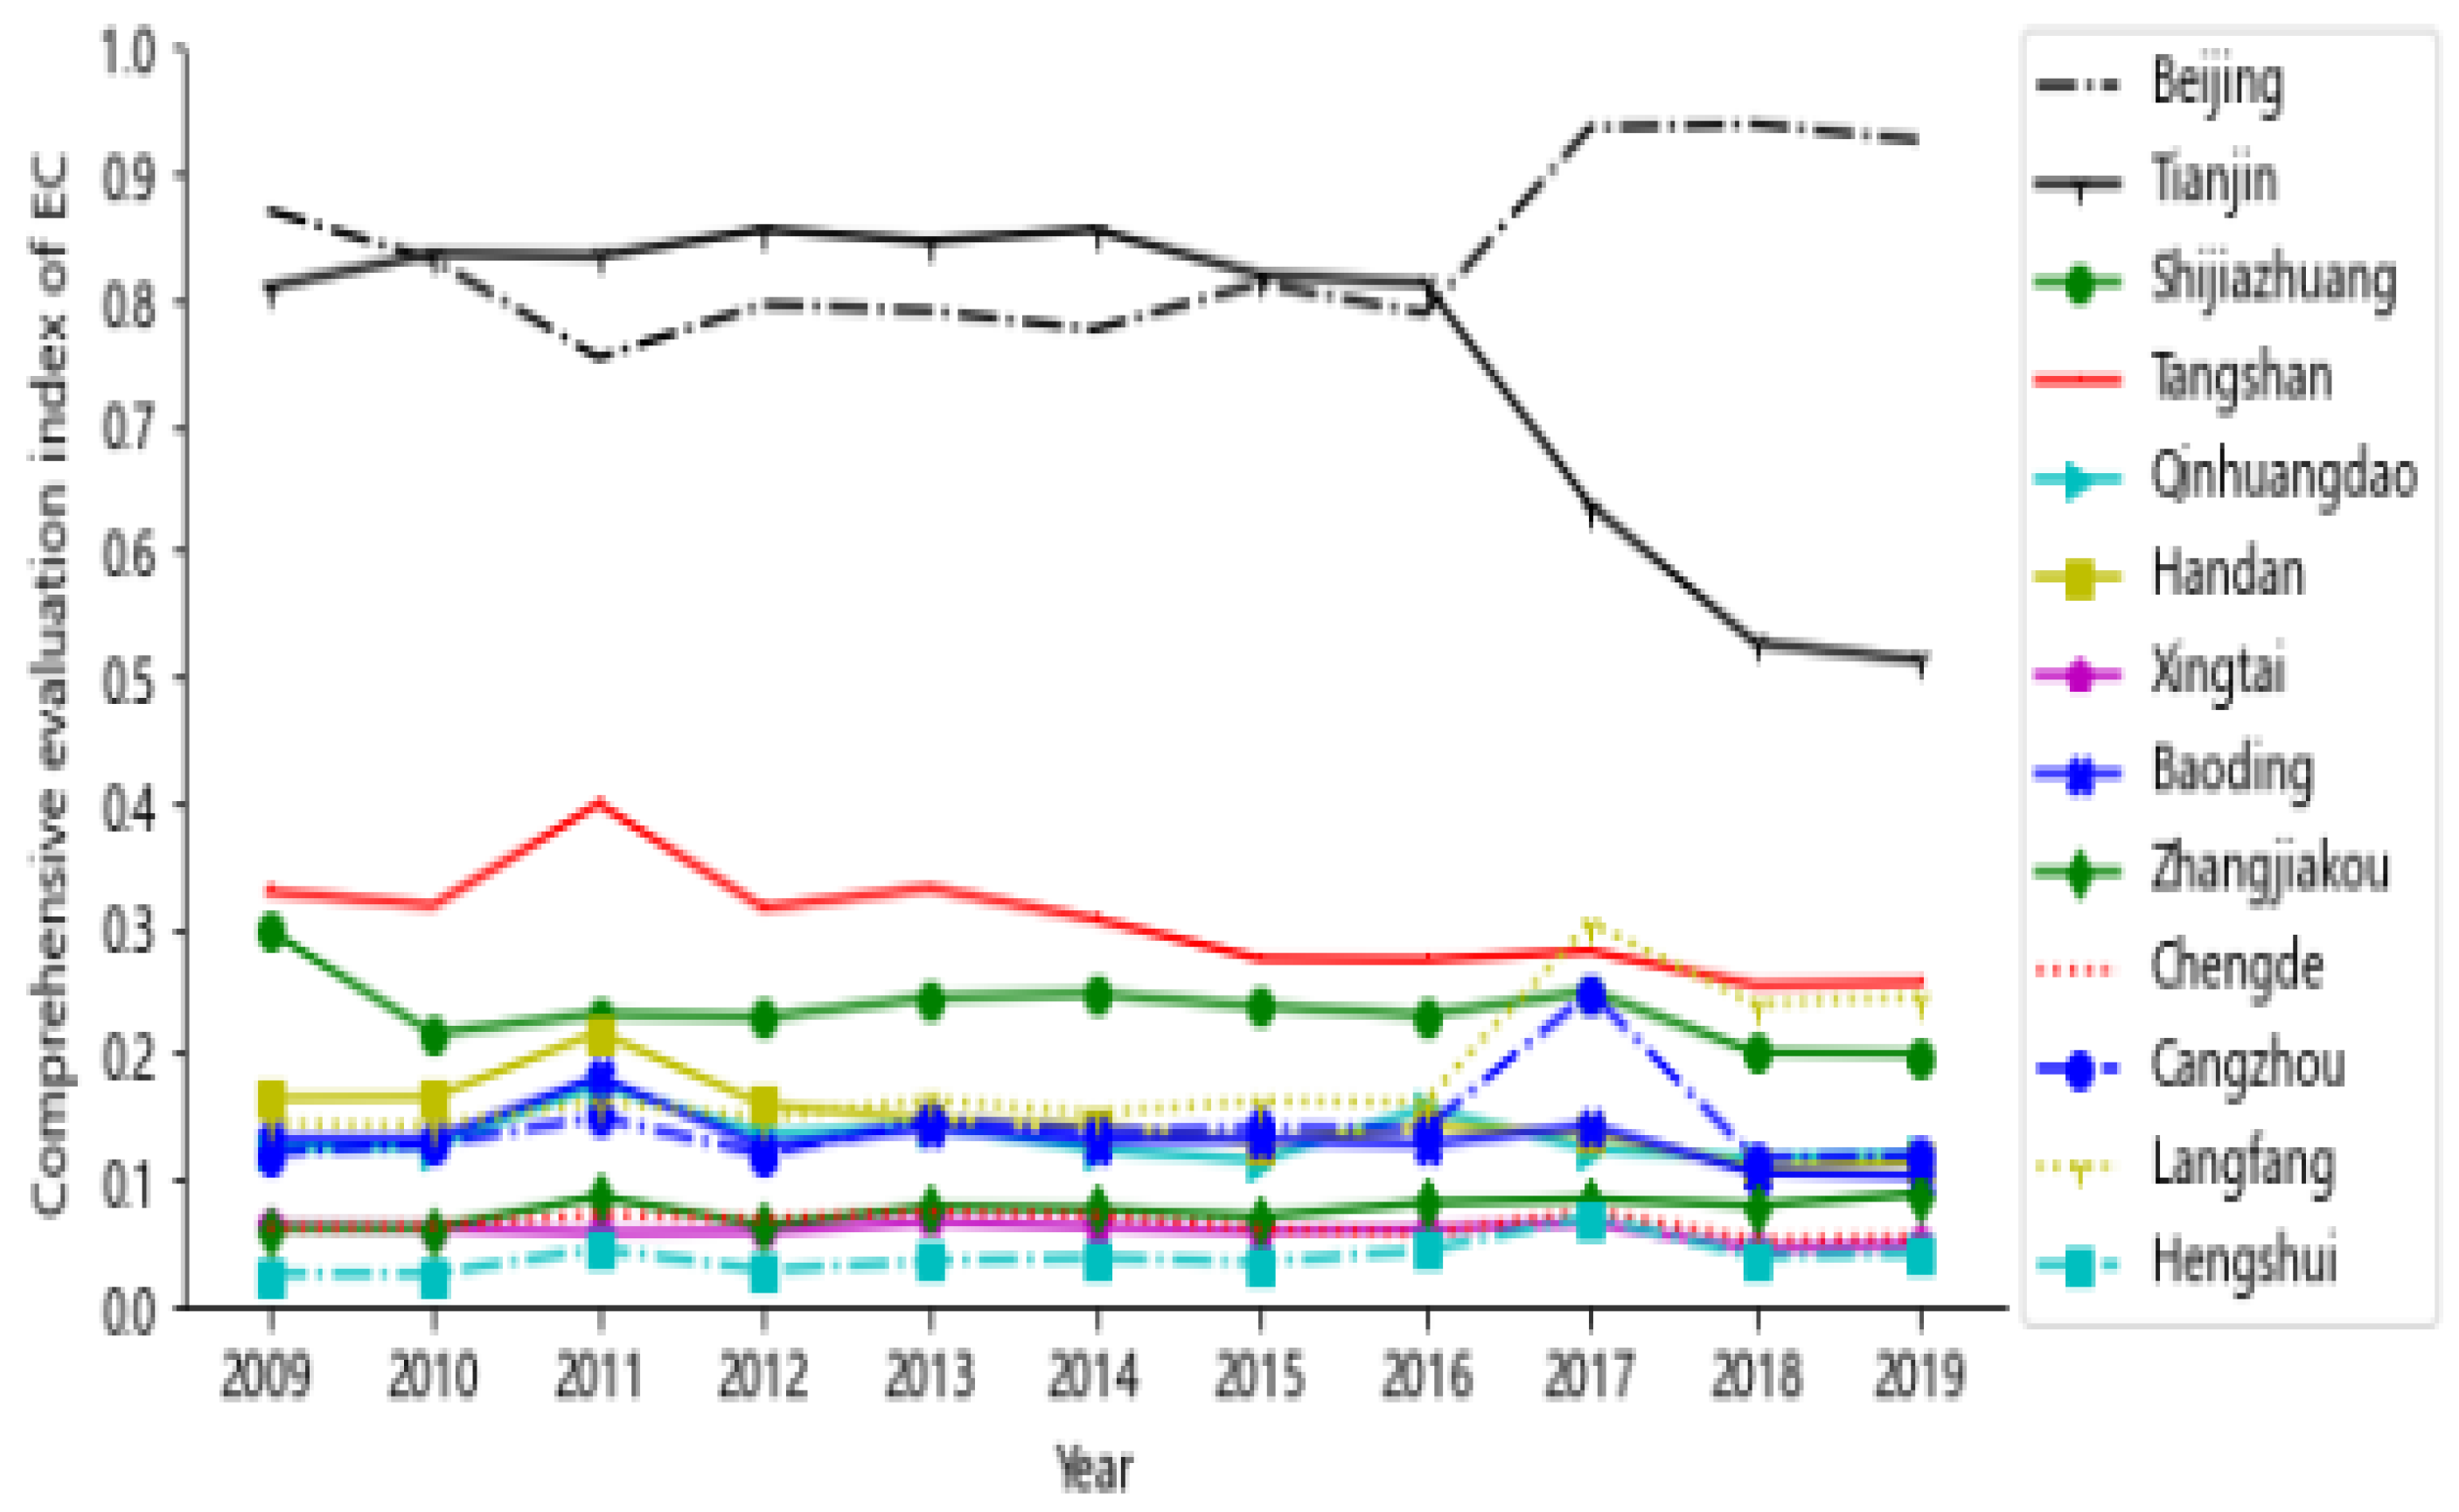
3.1.2. Comprehensive Evaluation of the EC Subsystem
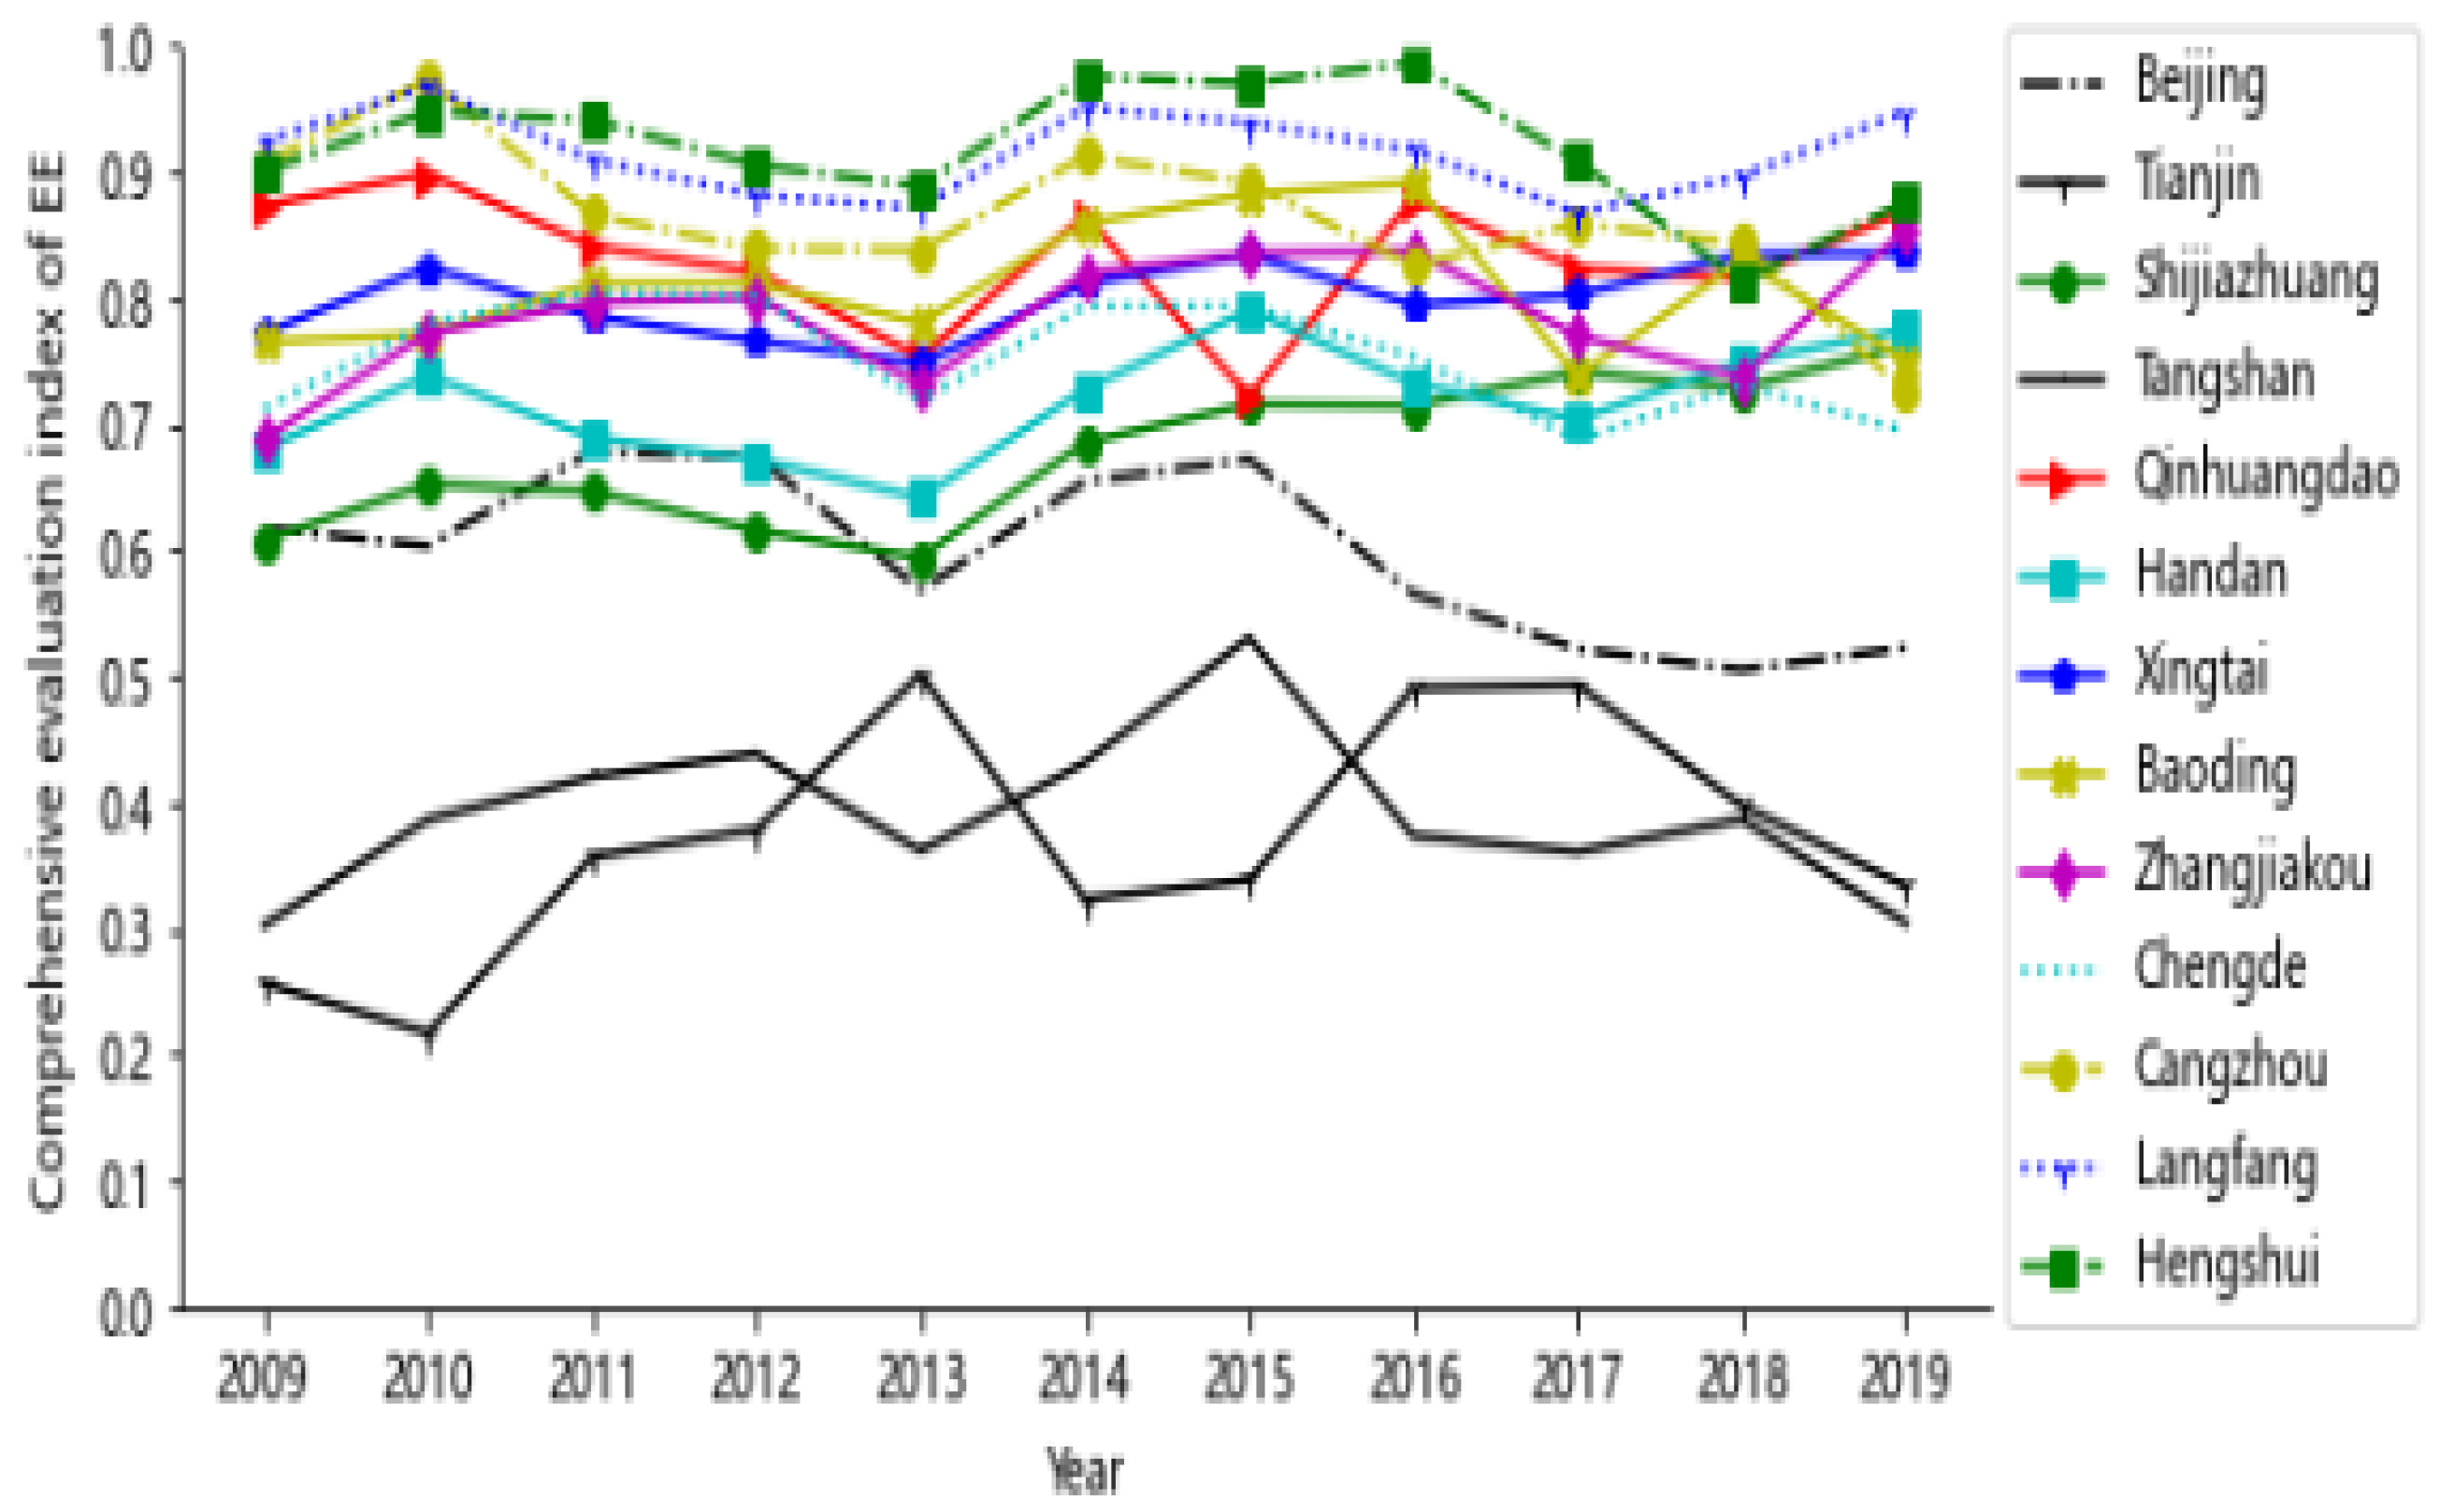
3.1.3. Comprehensive Evaluation of the EE Subsystem
3.1.4. Comprehensive Evaluation of the IS-EC-EE System
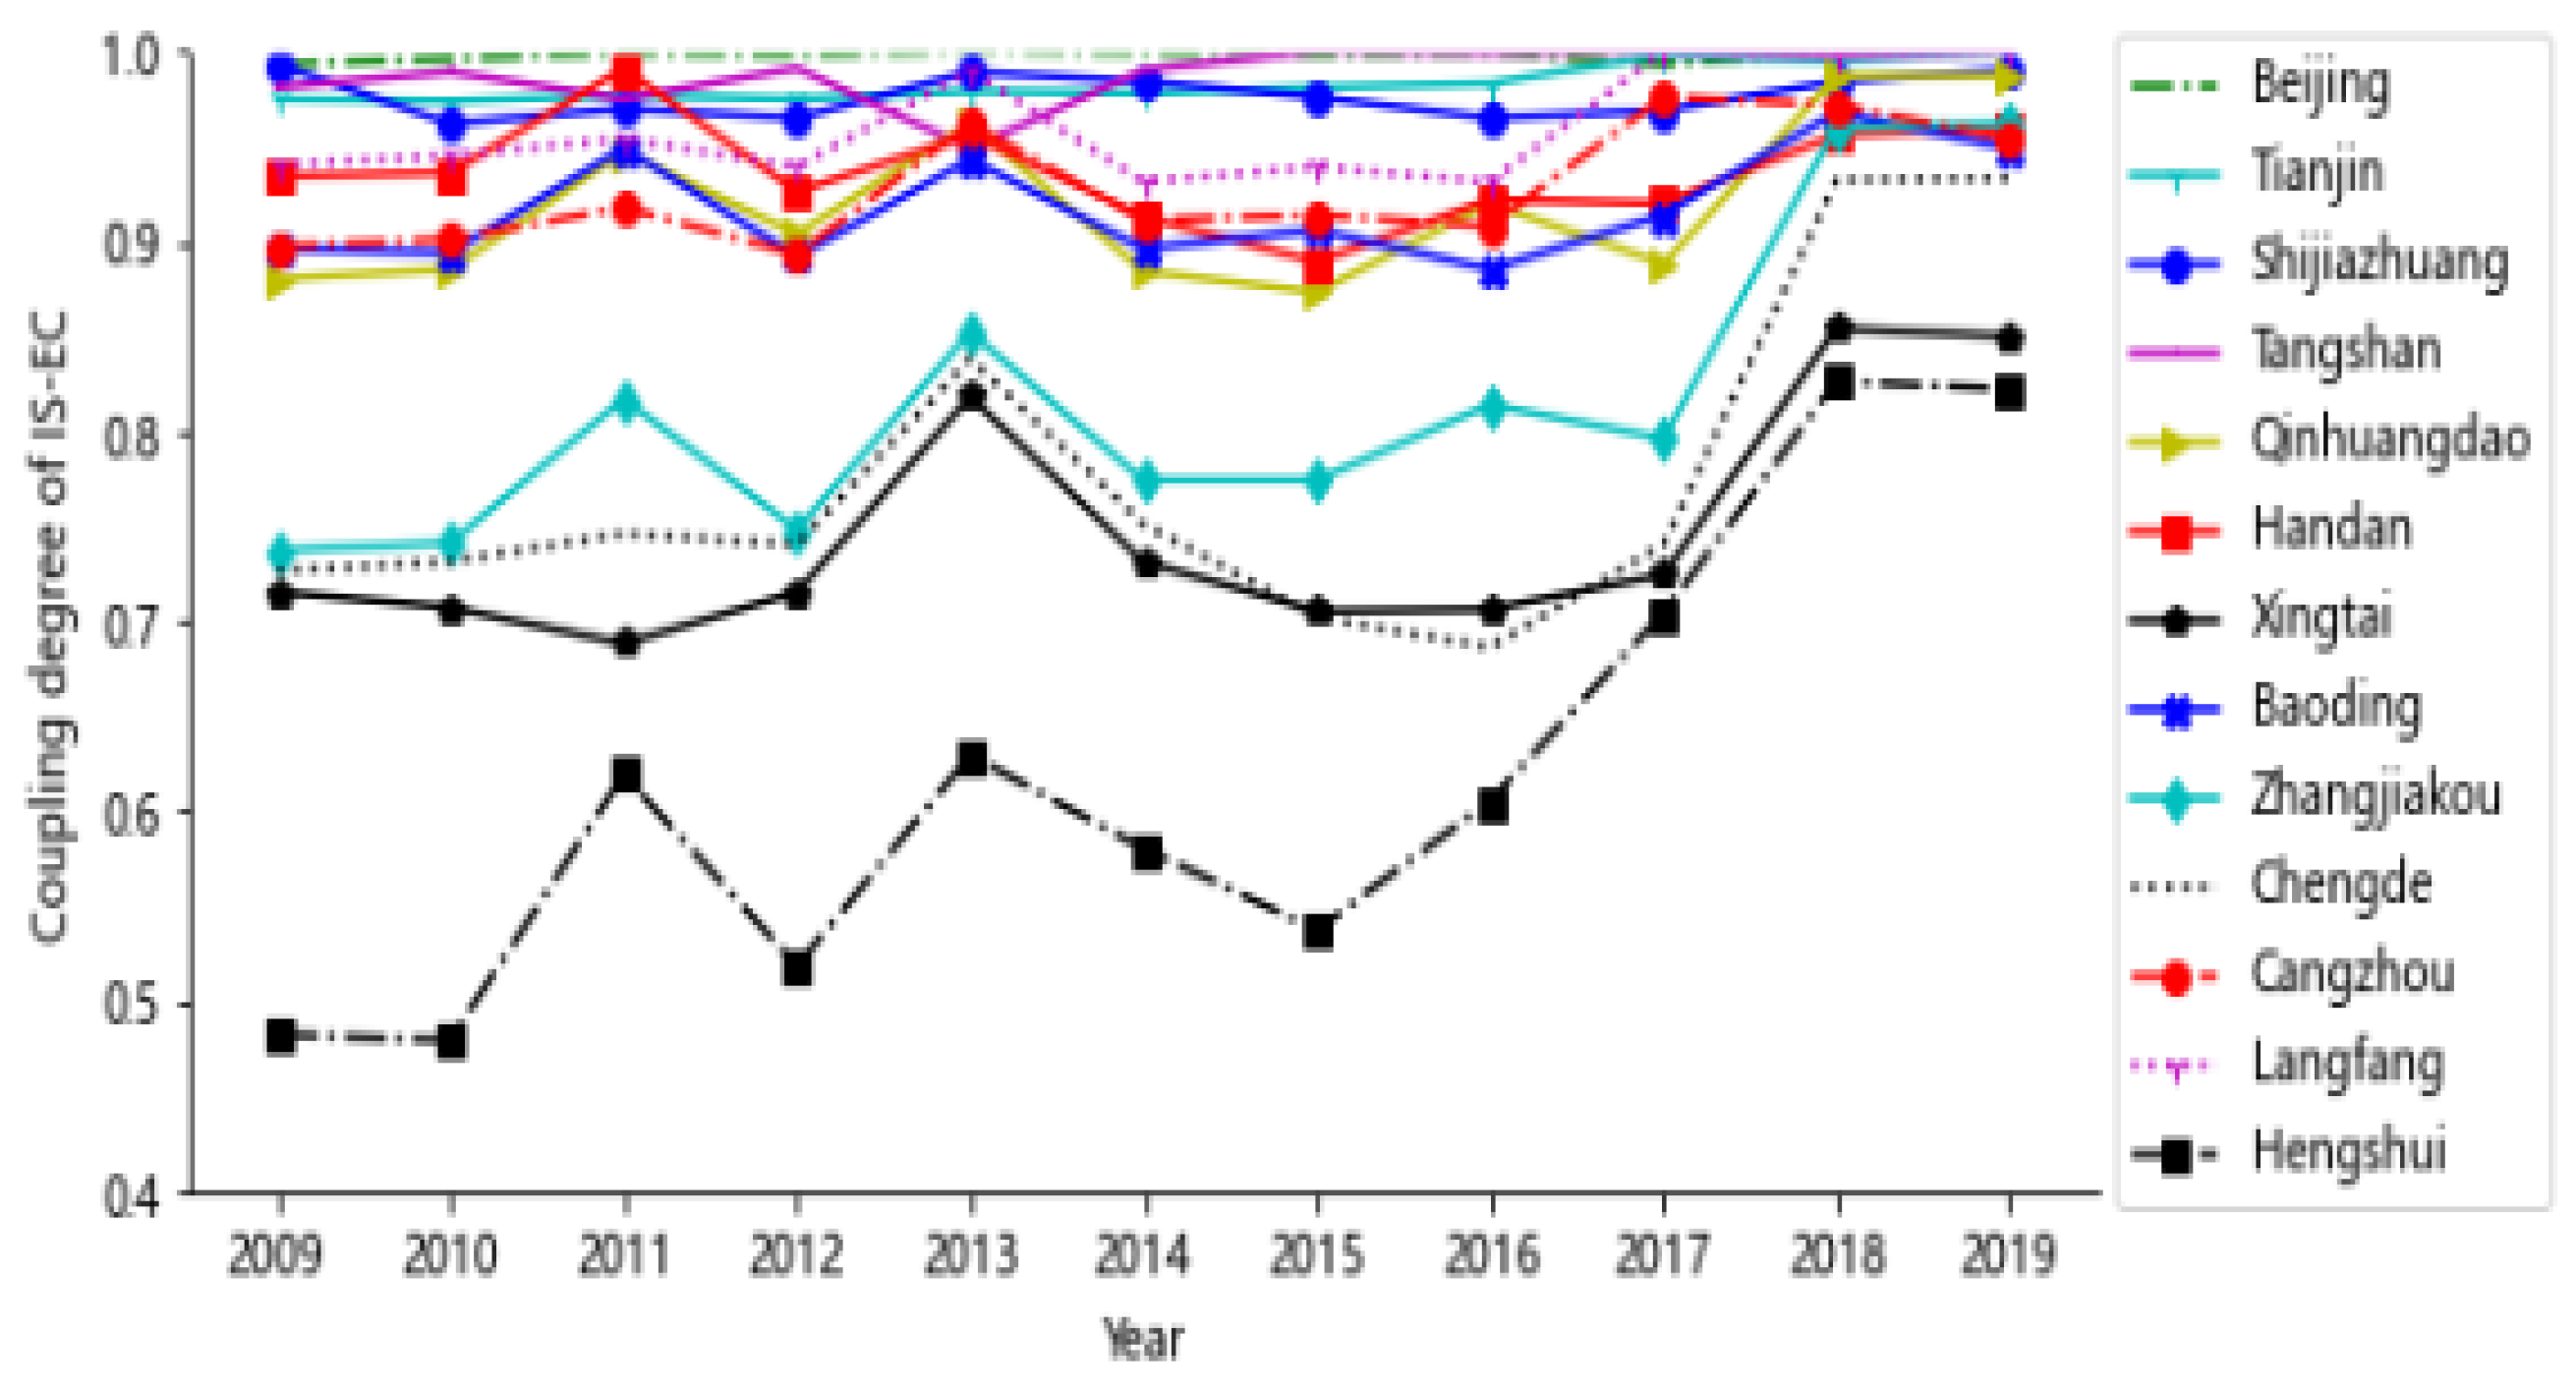
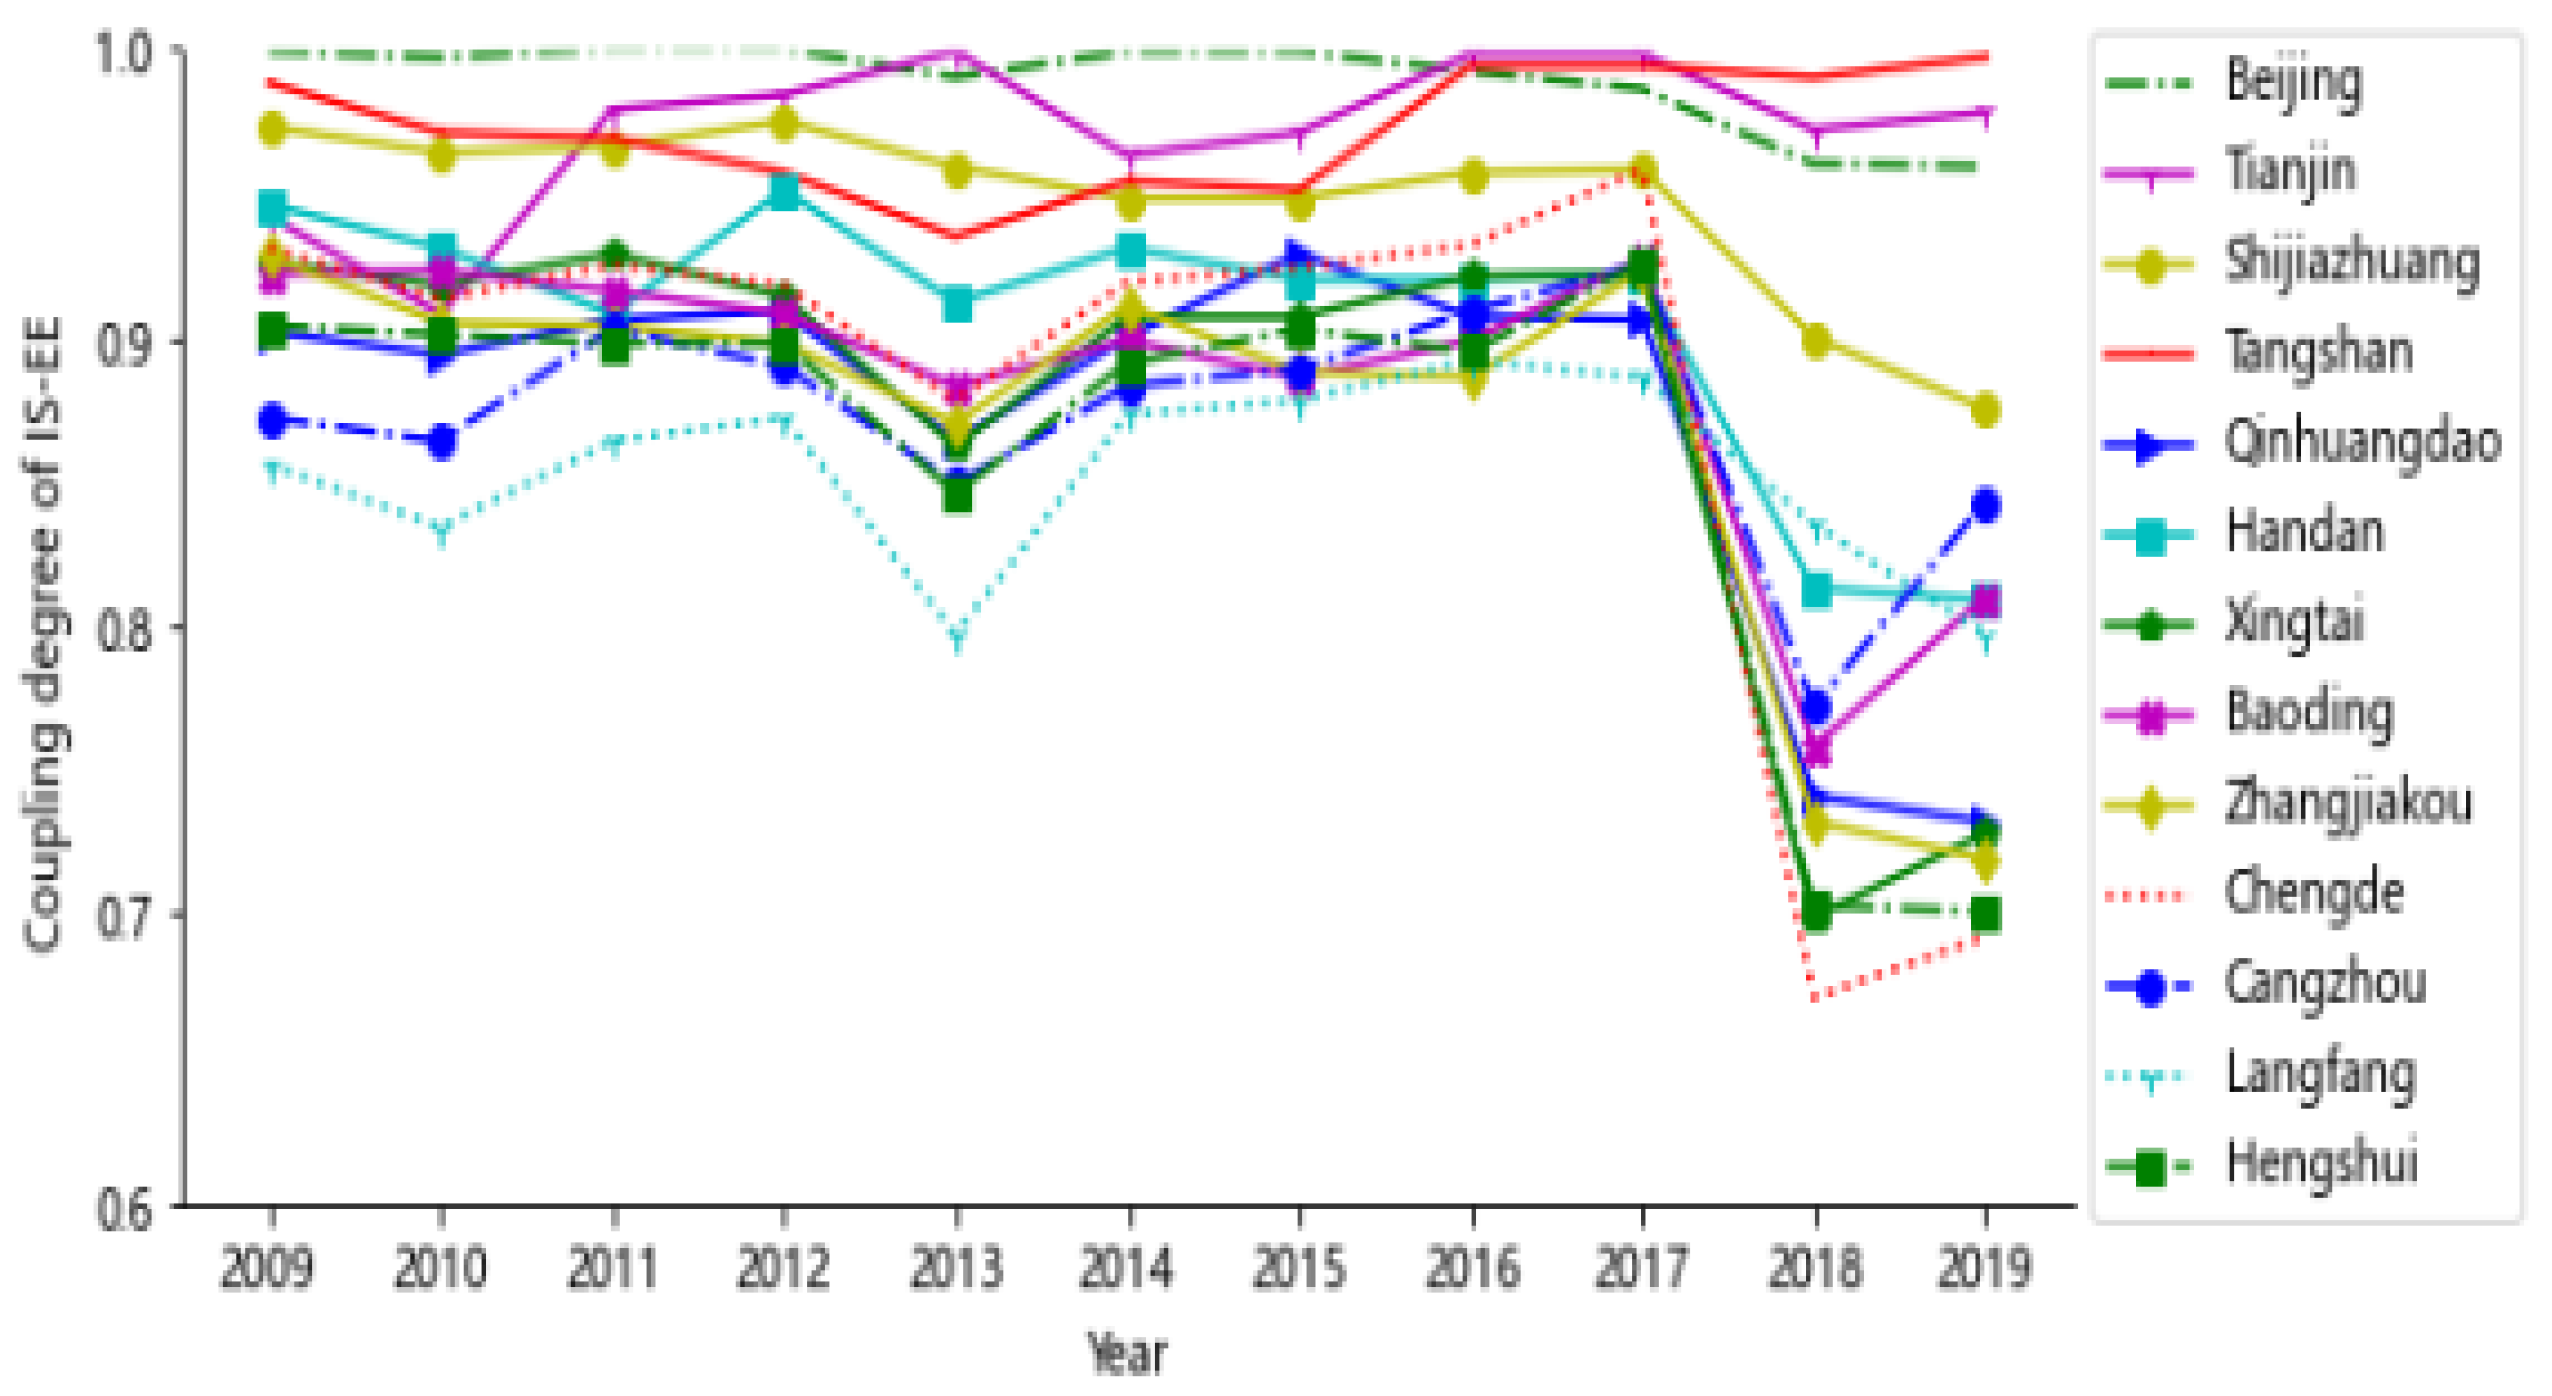
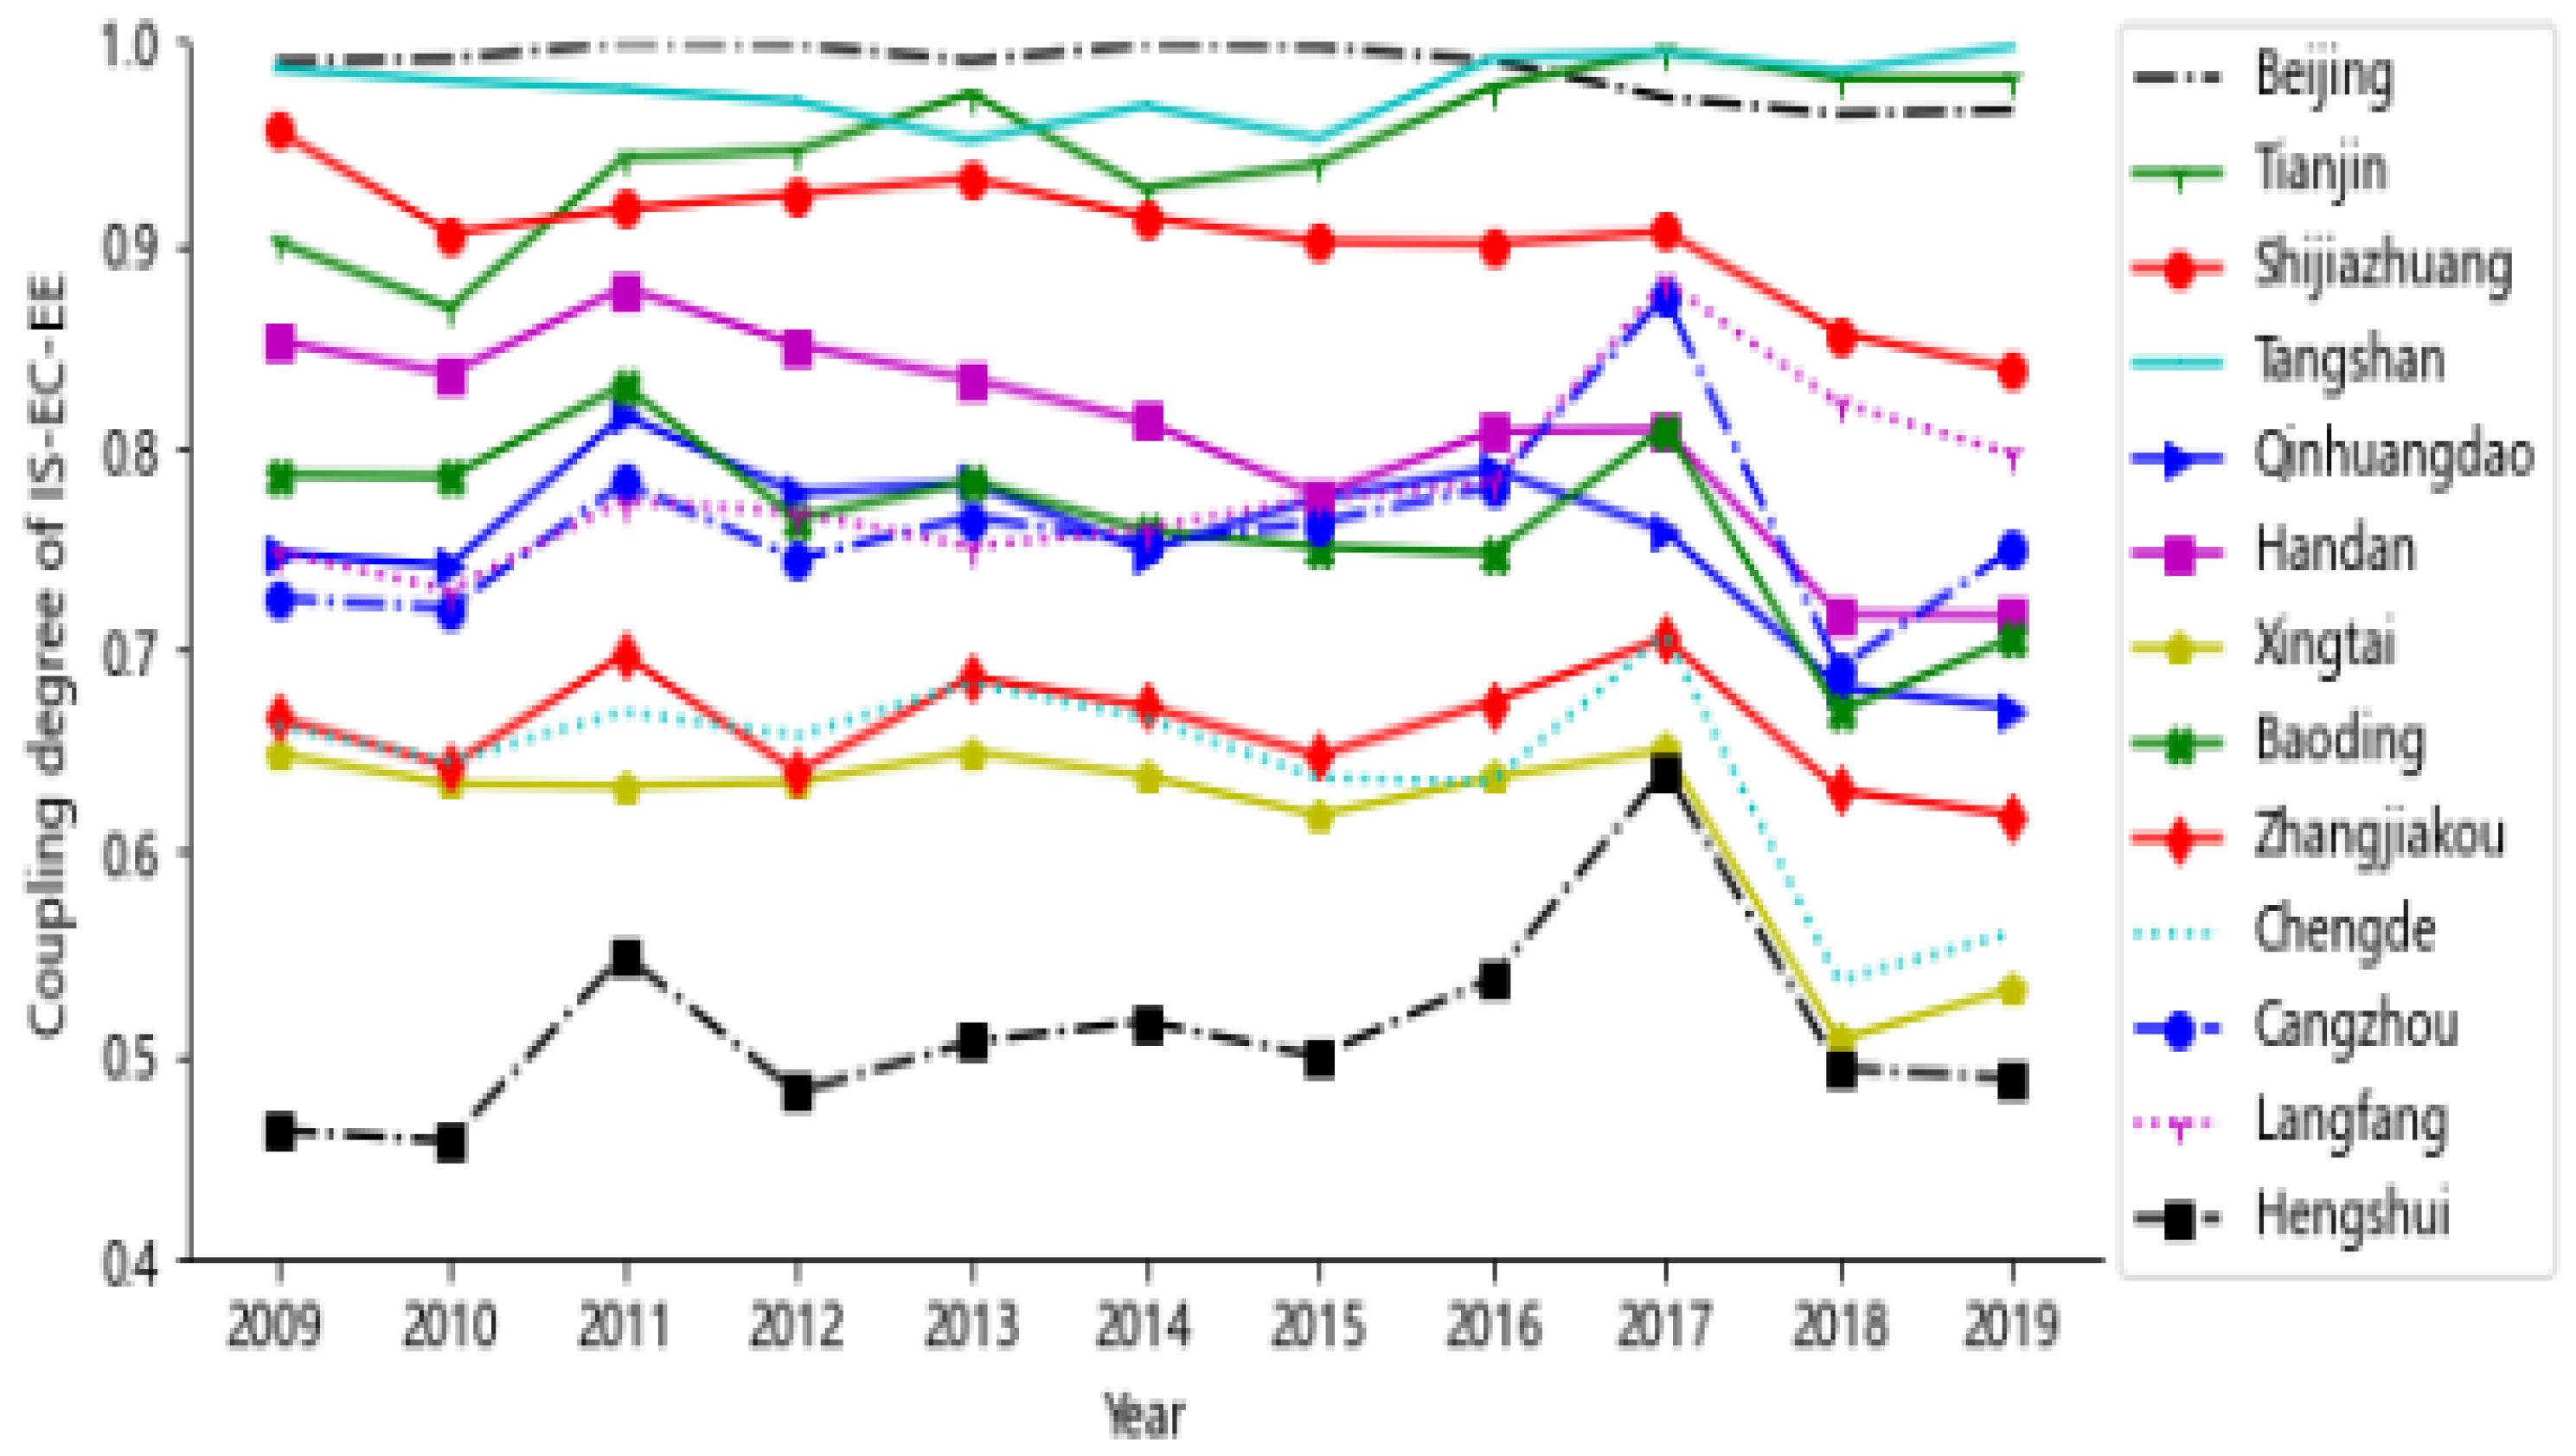
3.2. Analysis of the Coupling Degree of the IS-EC-EE System in BTH
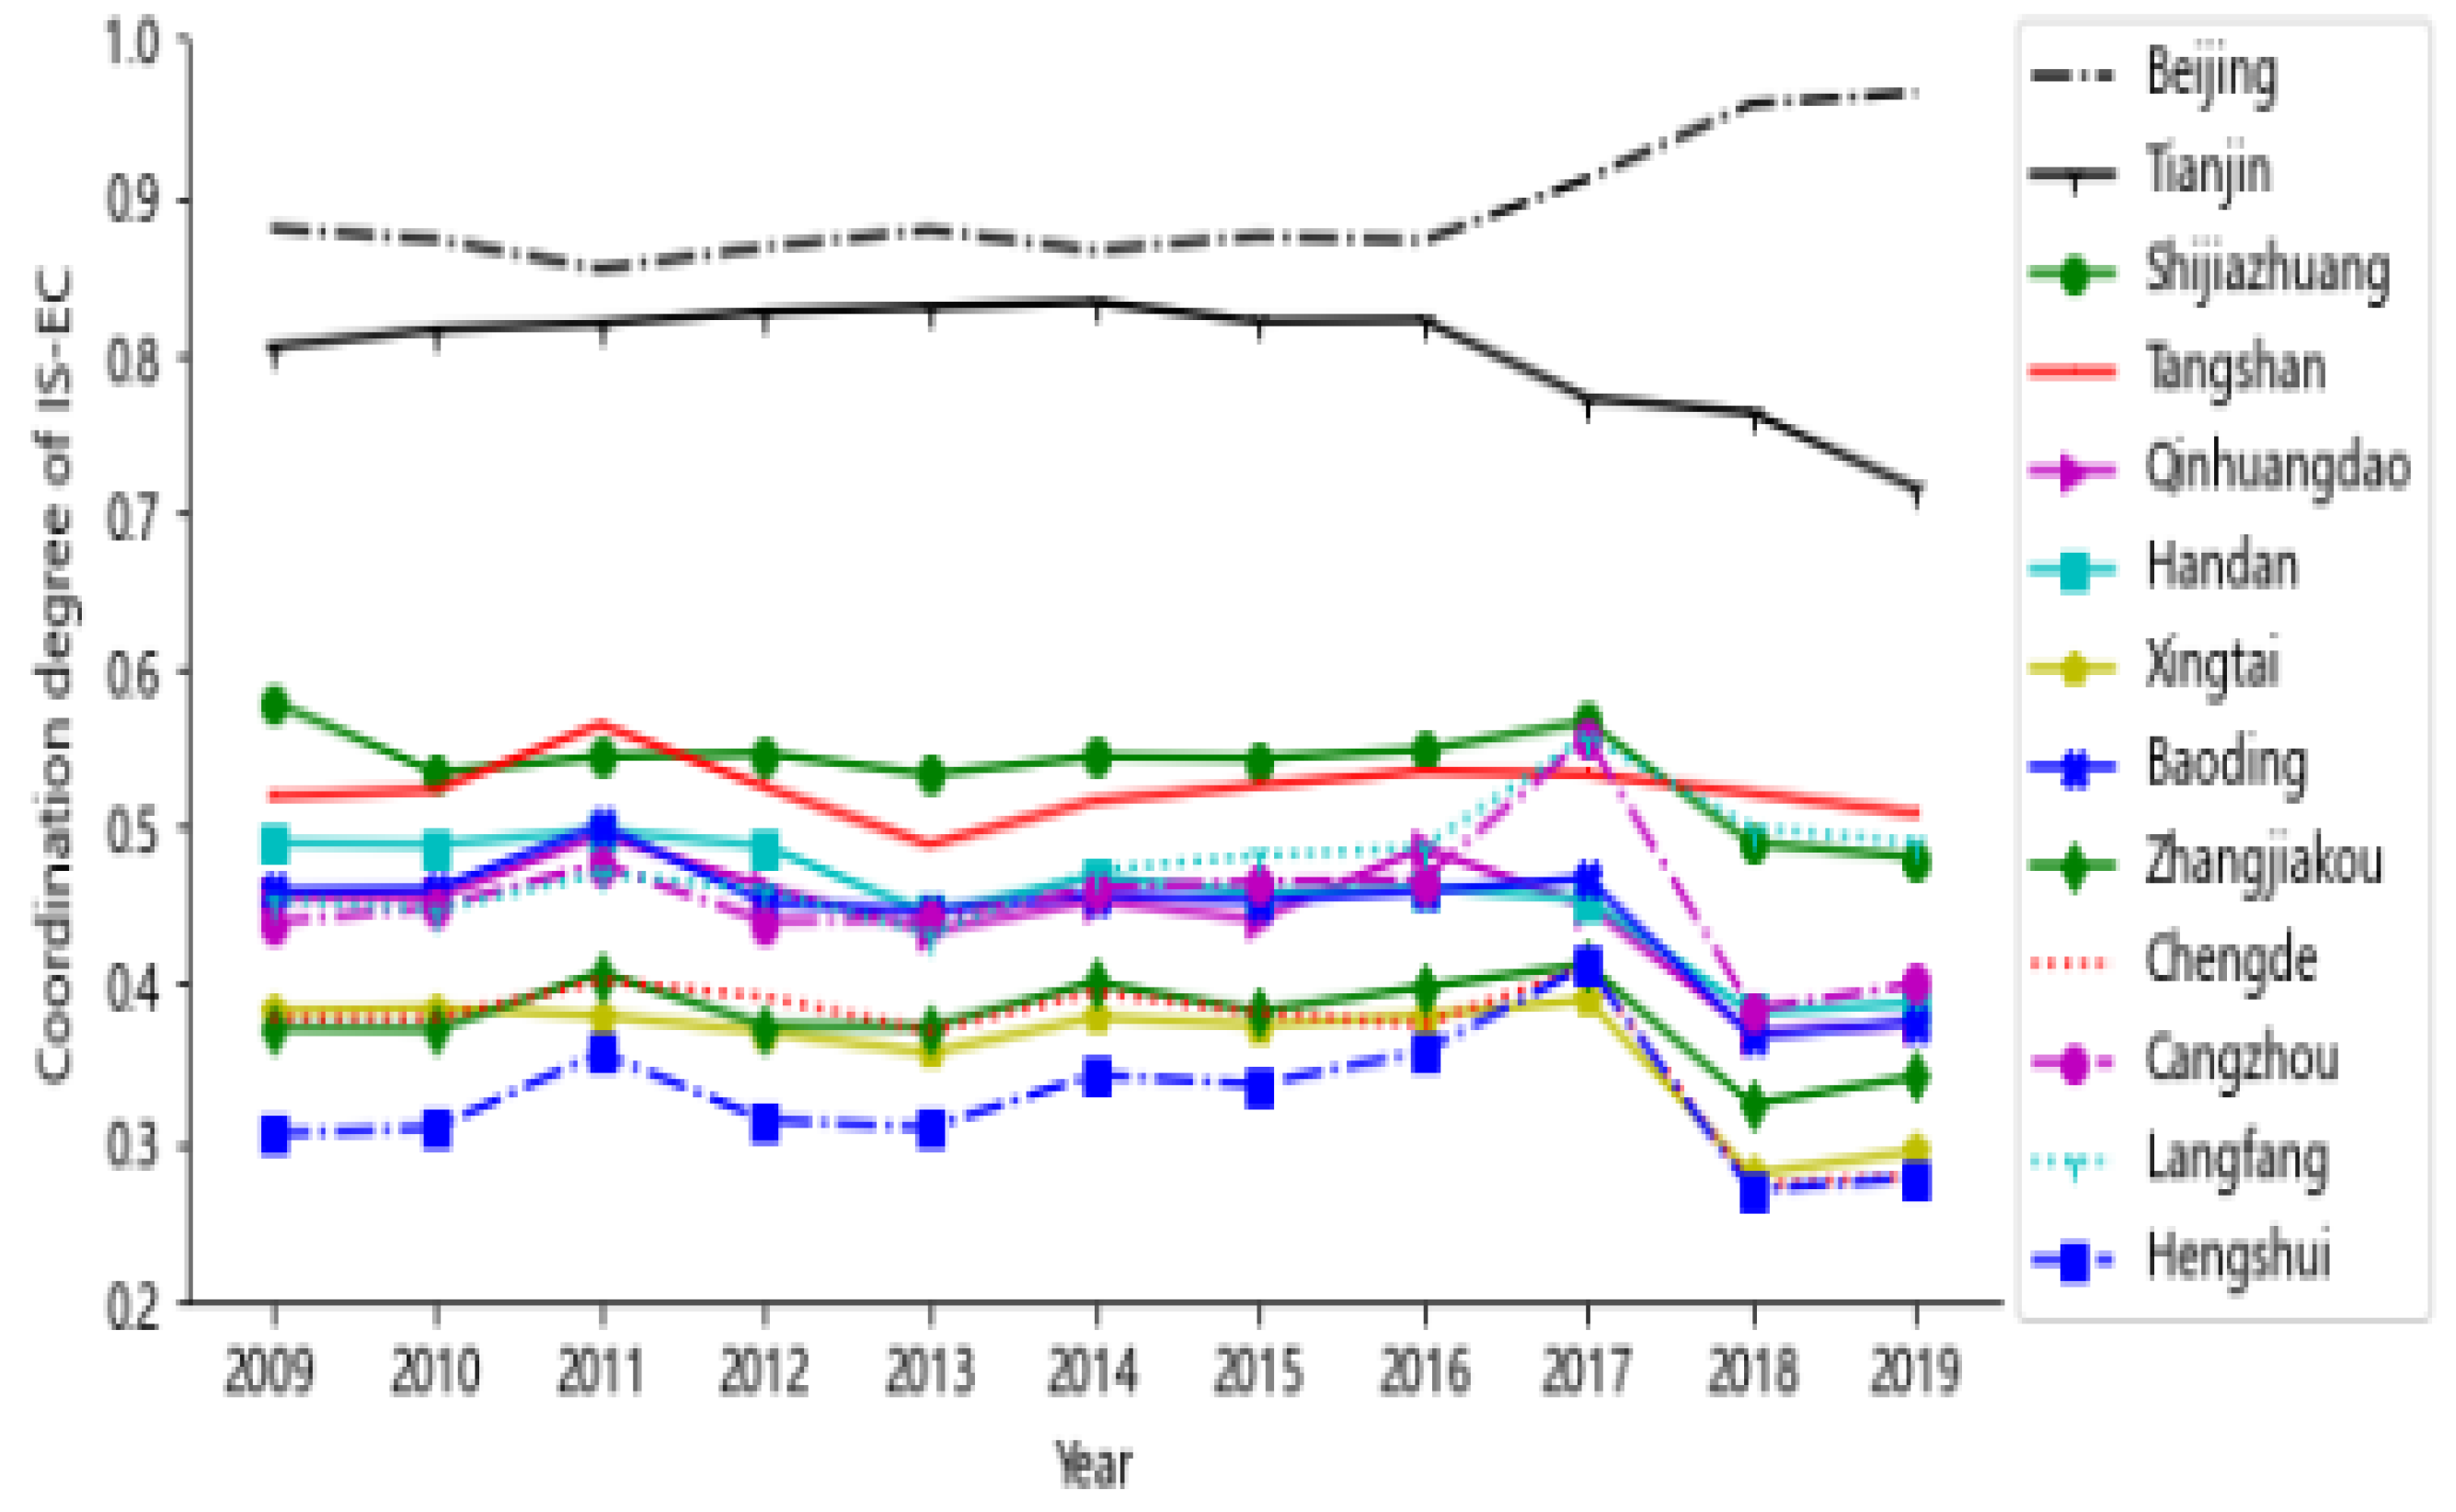
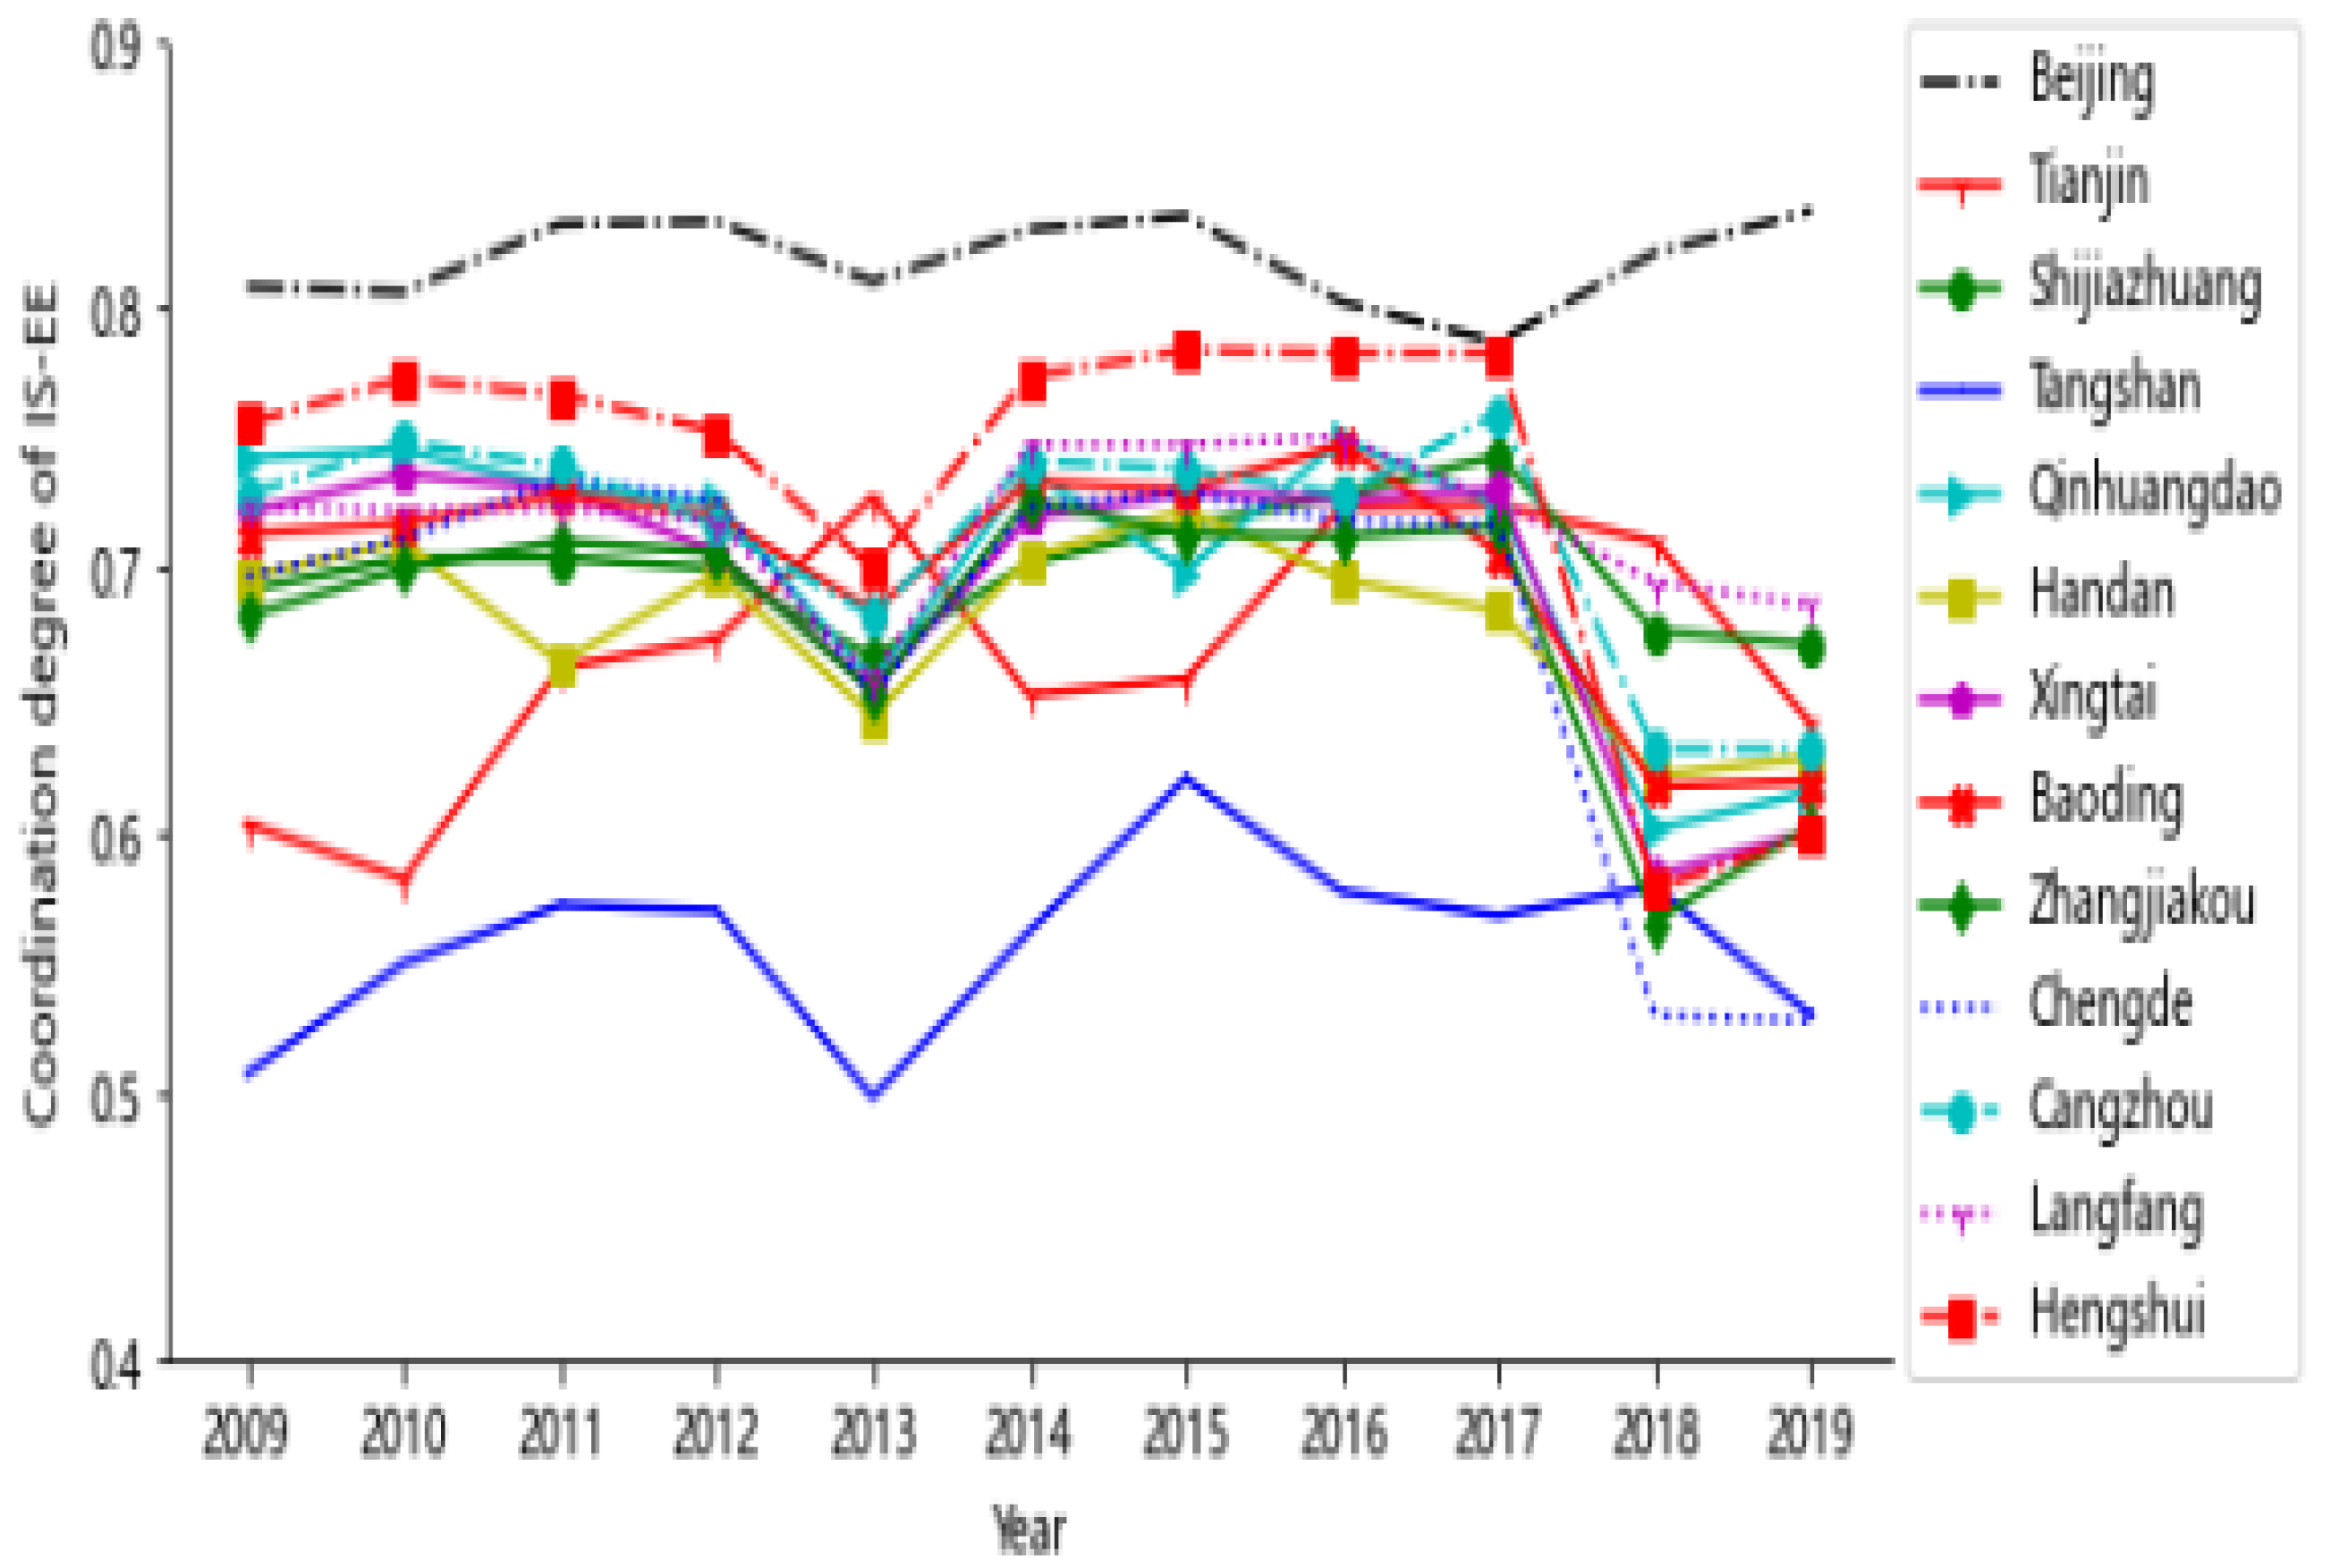
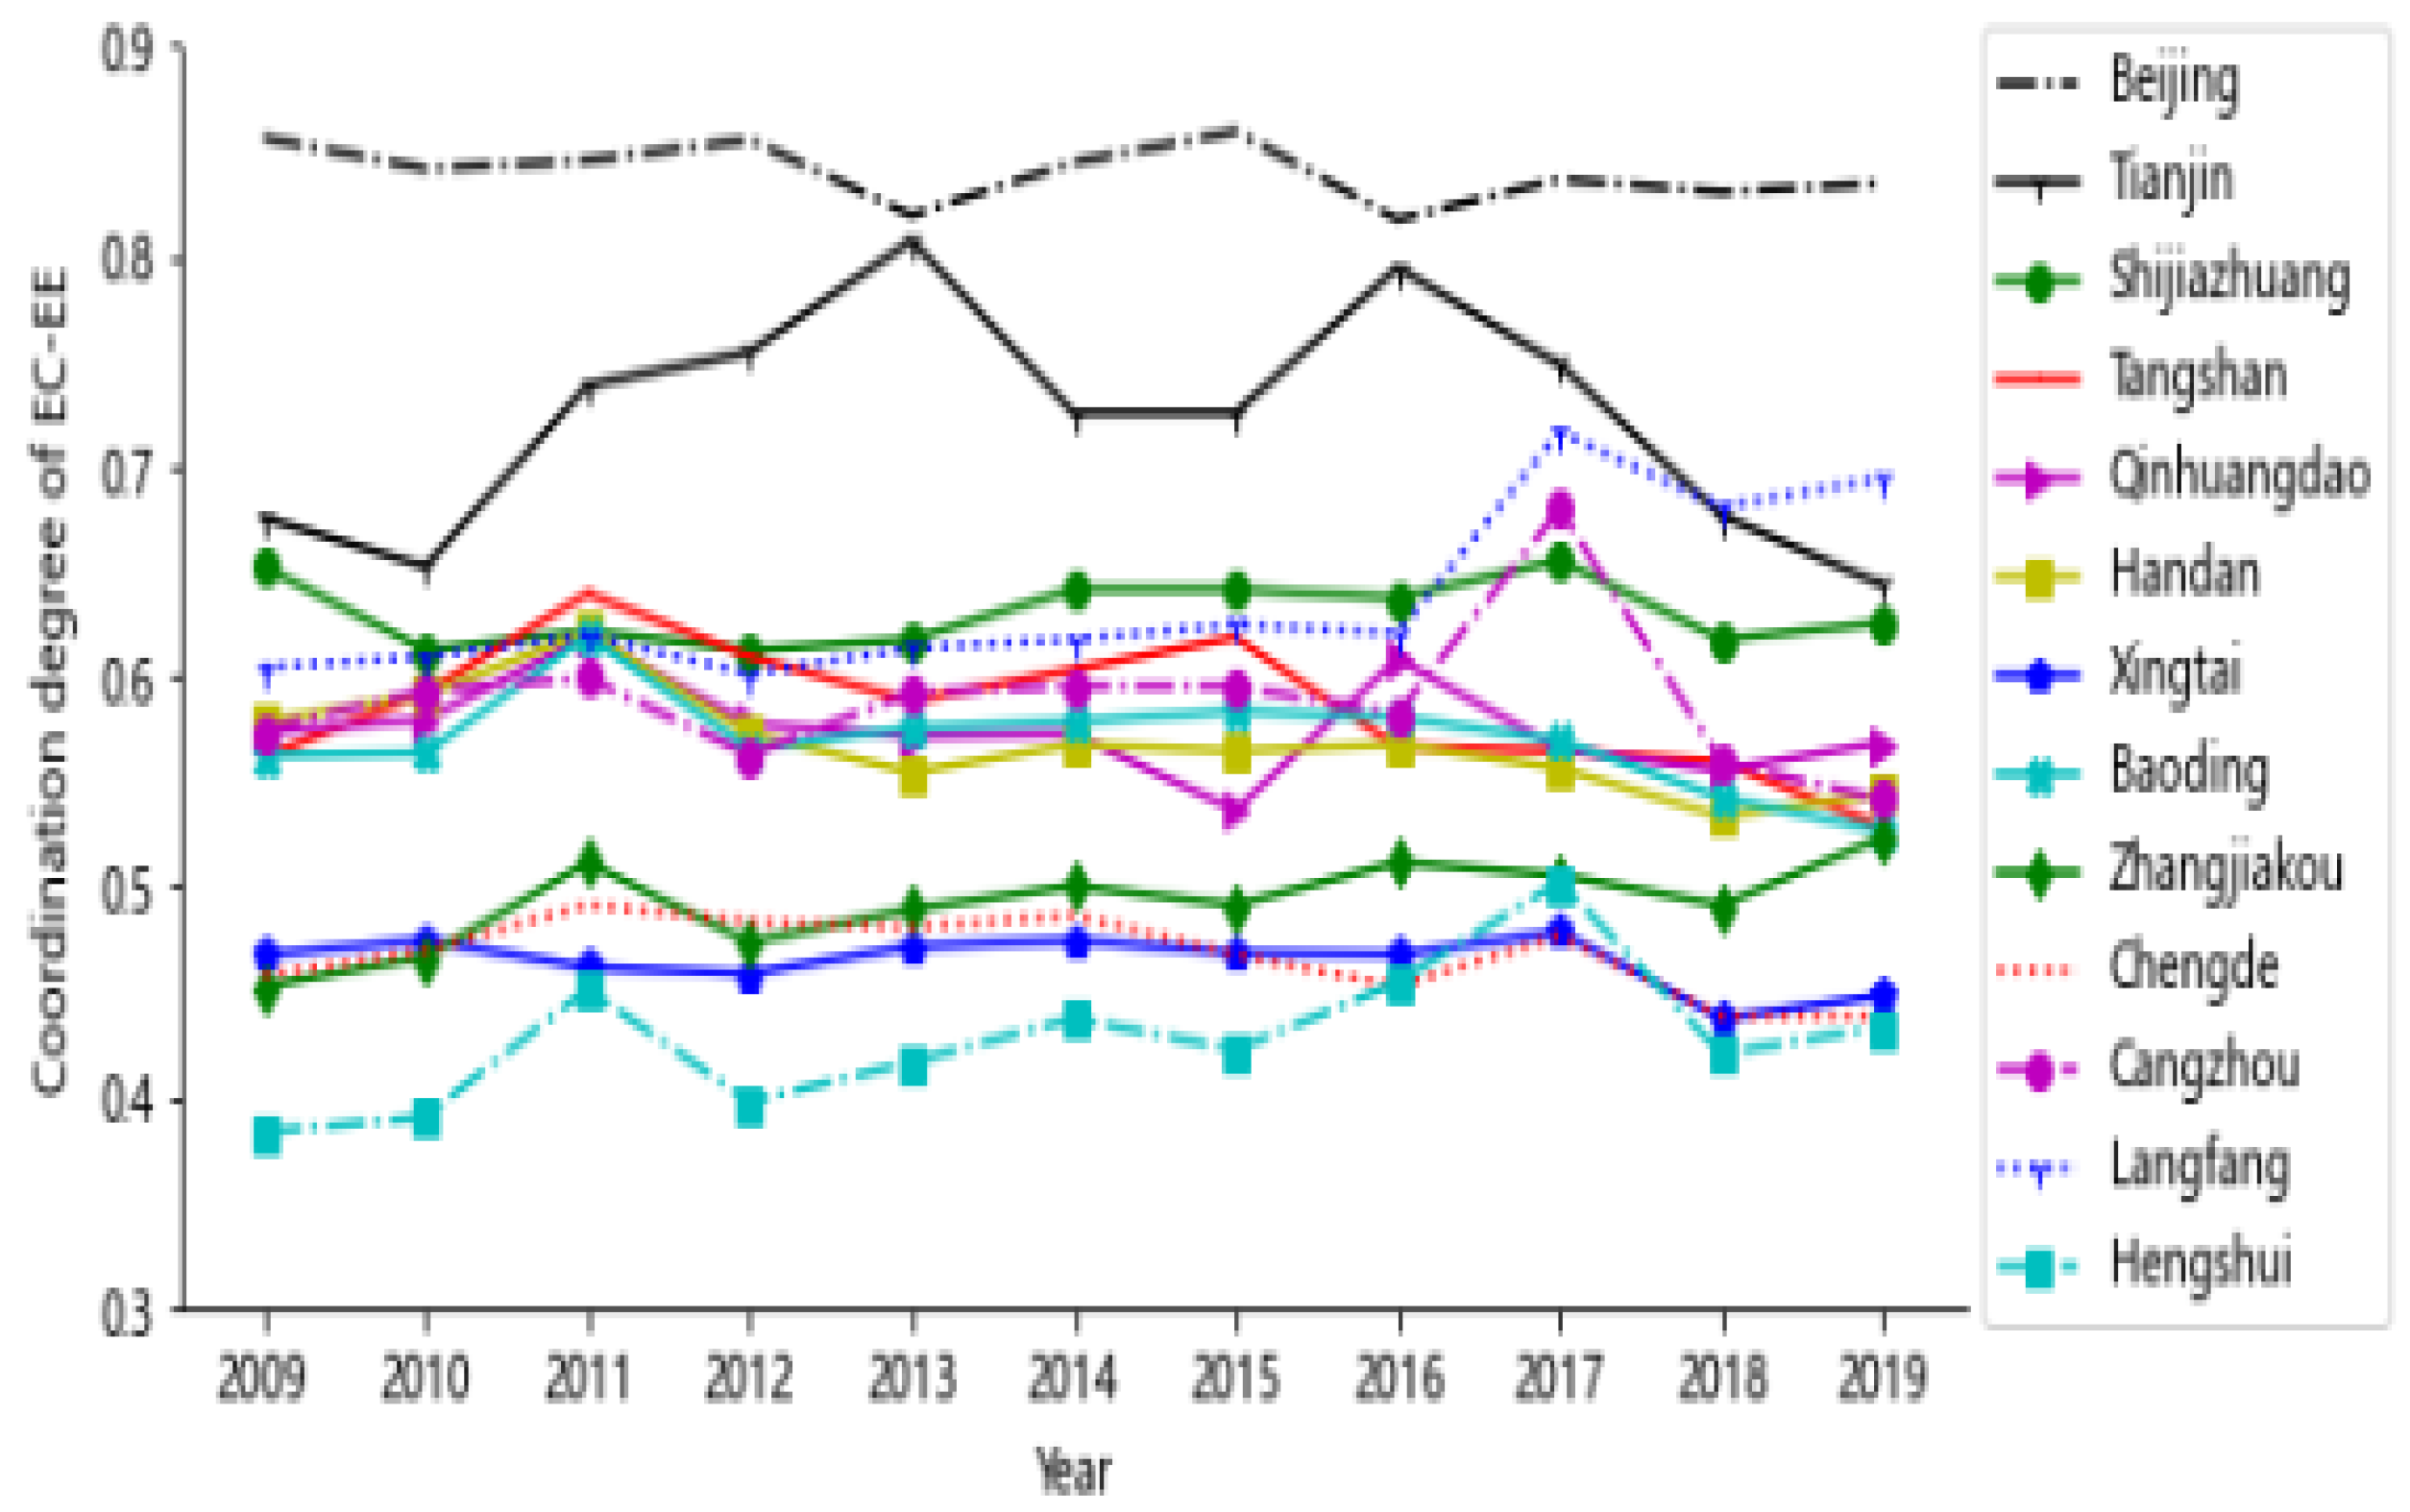
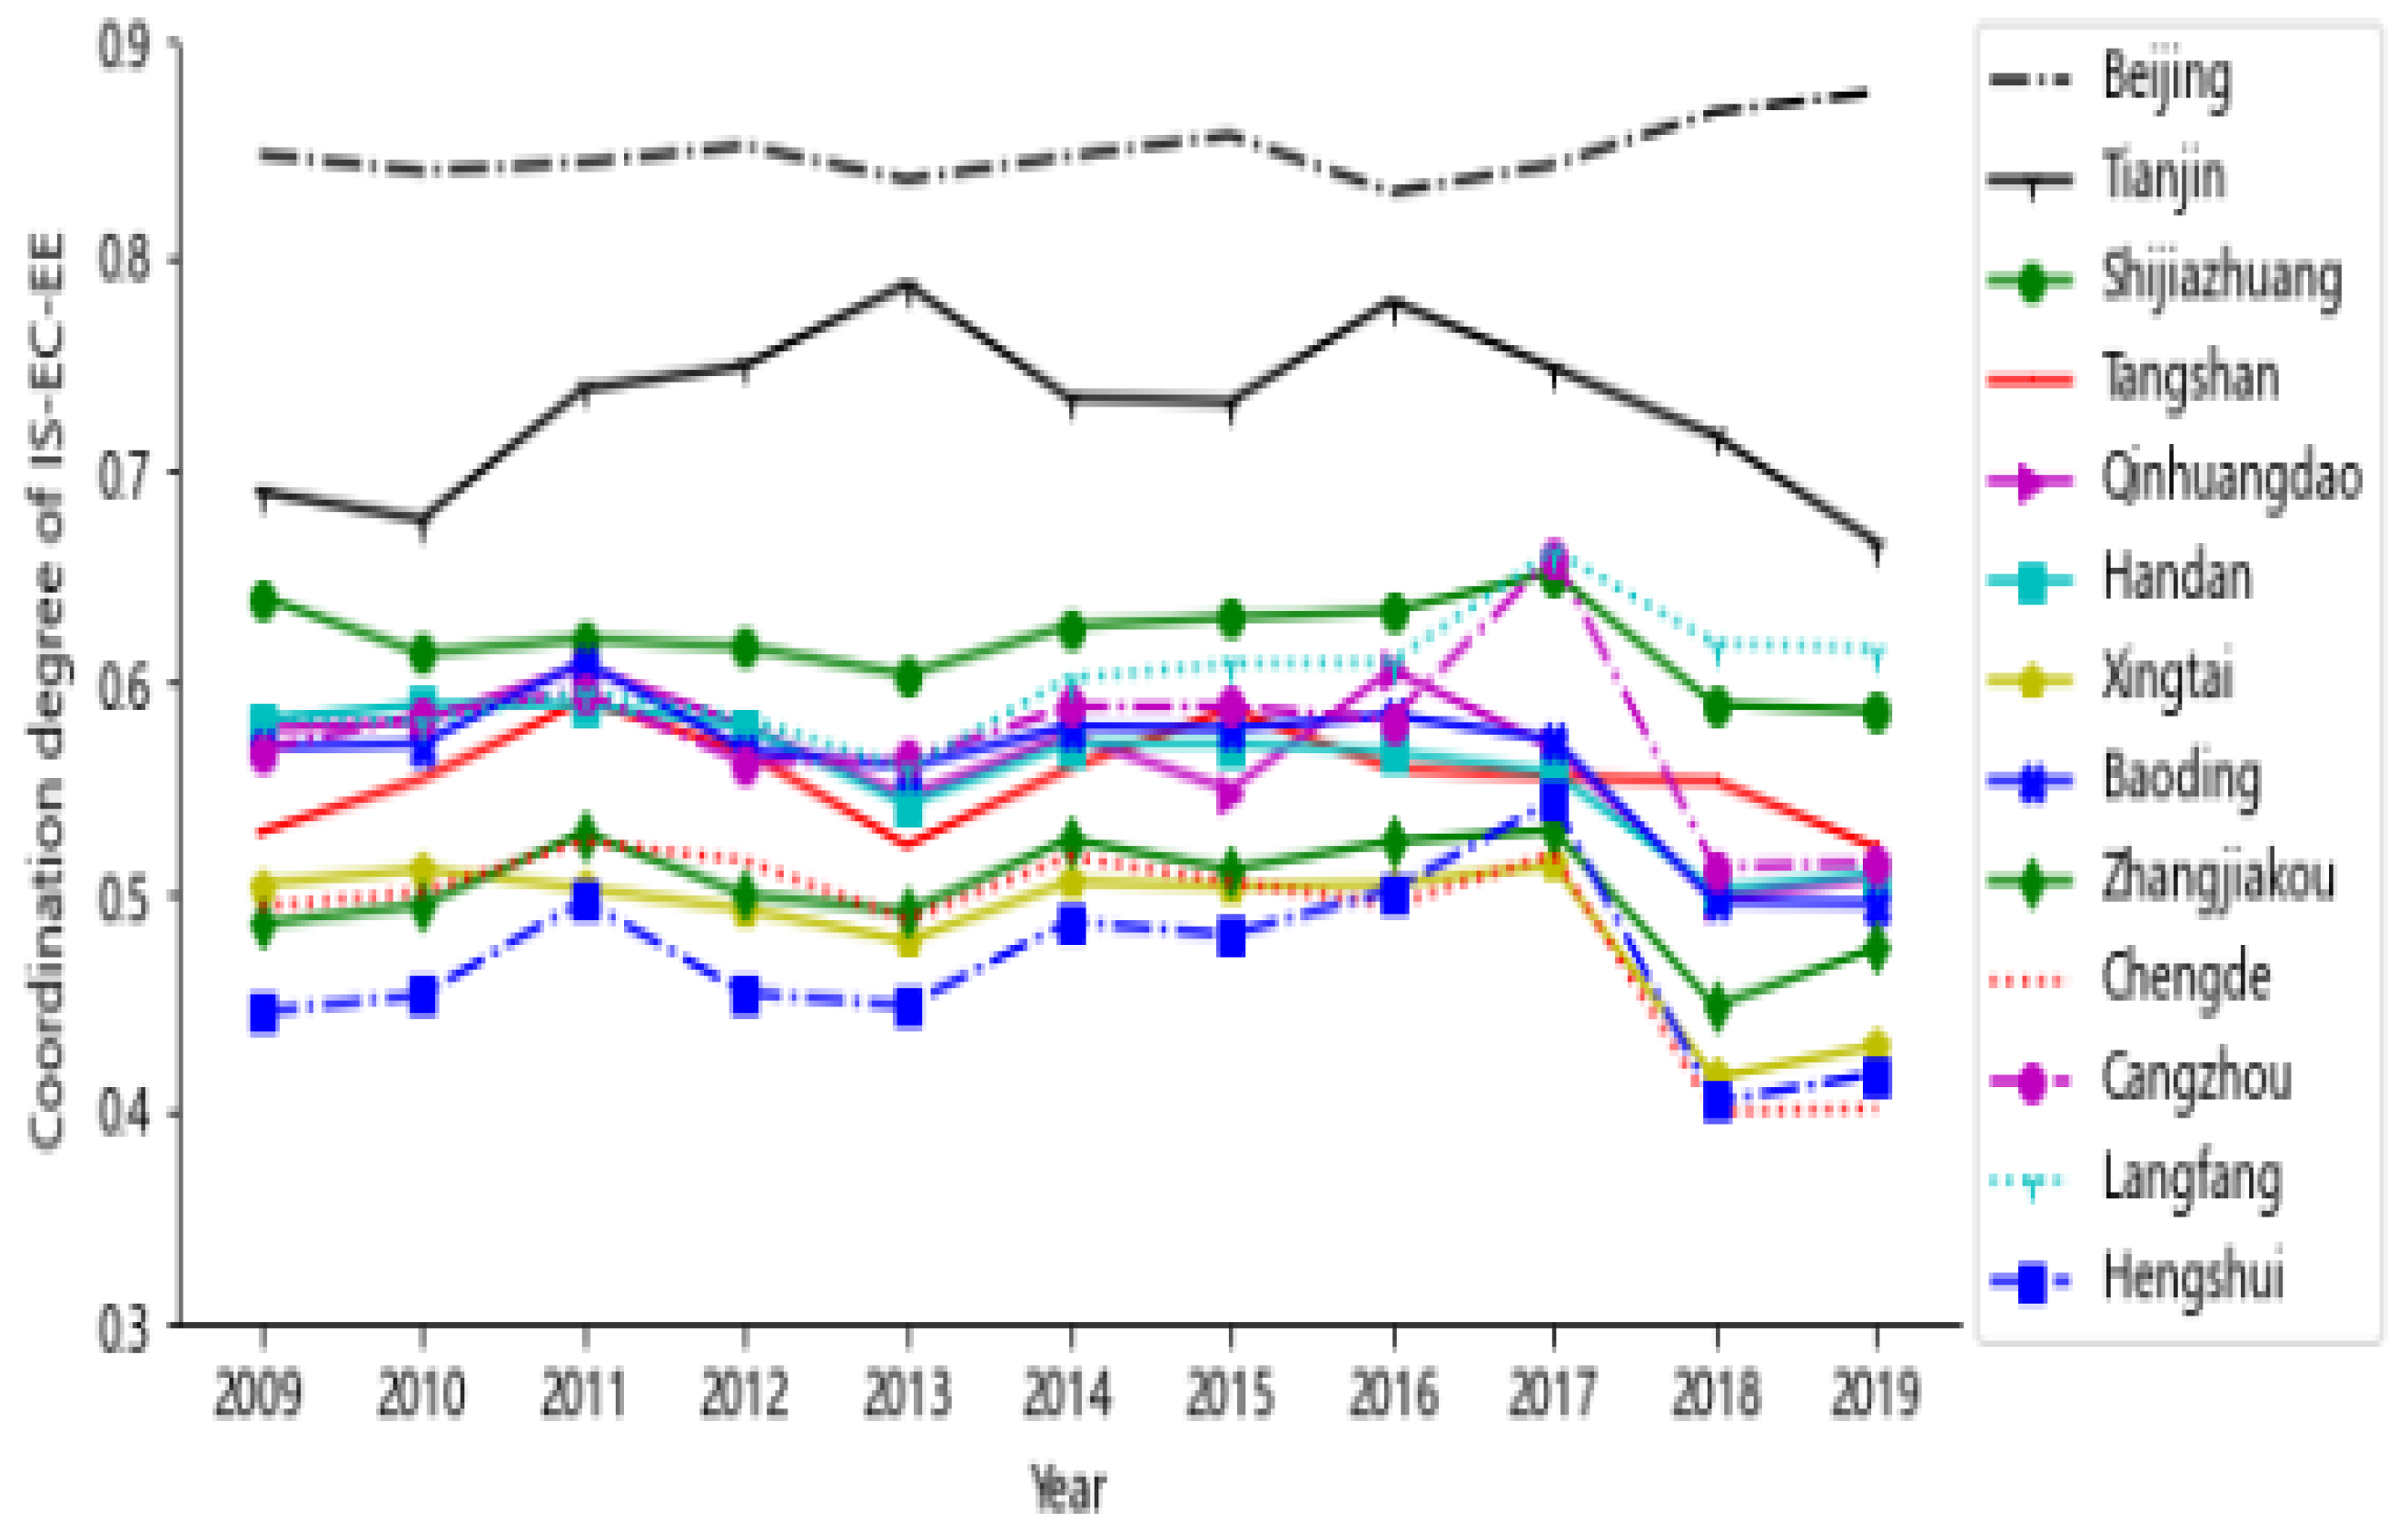
3.3. Analysis of Coordinated Level of the IS-EC-EE Complex System in BTH
3.4. Evolution of the Coordination Degree of the IS-EC-EE Complex System
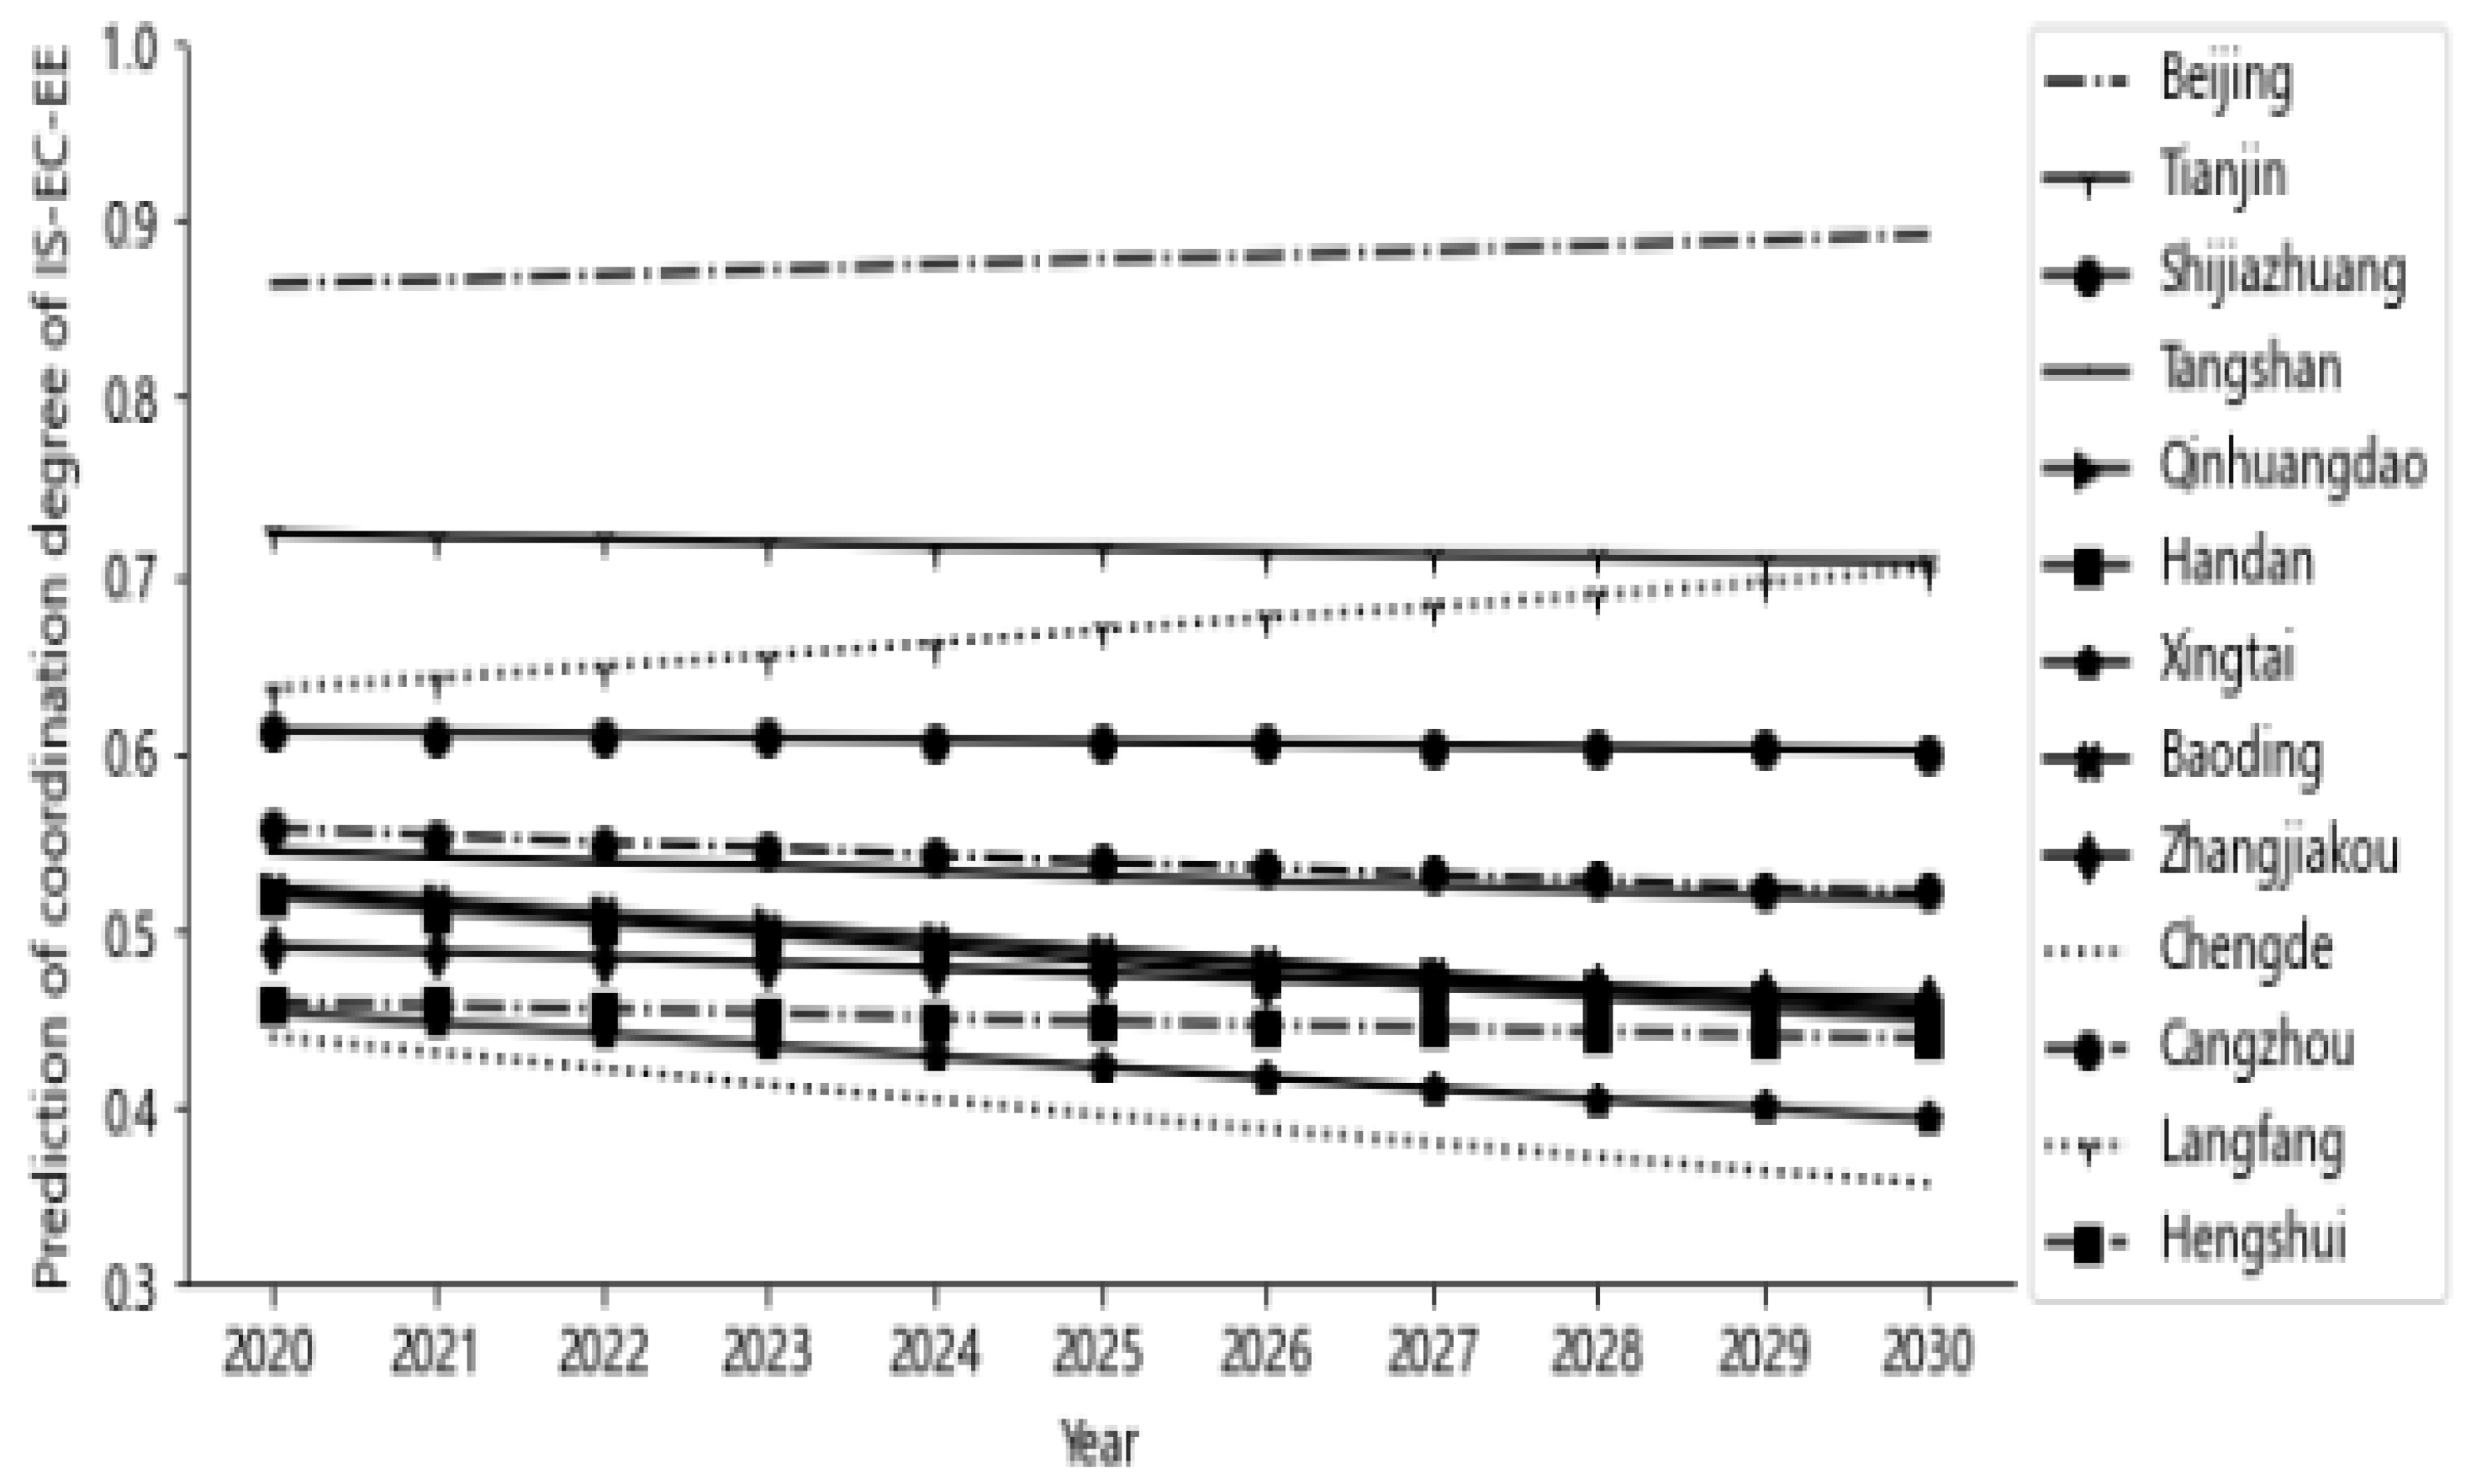
3.5. Prediction of Coordination Degree of the IS-EC-EE Complex System
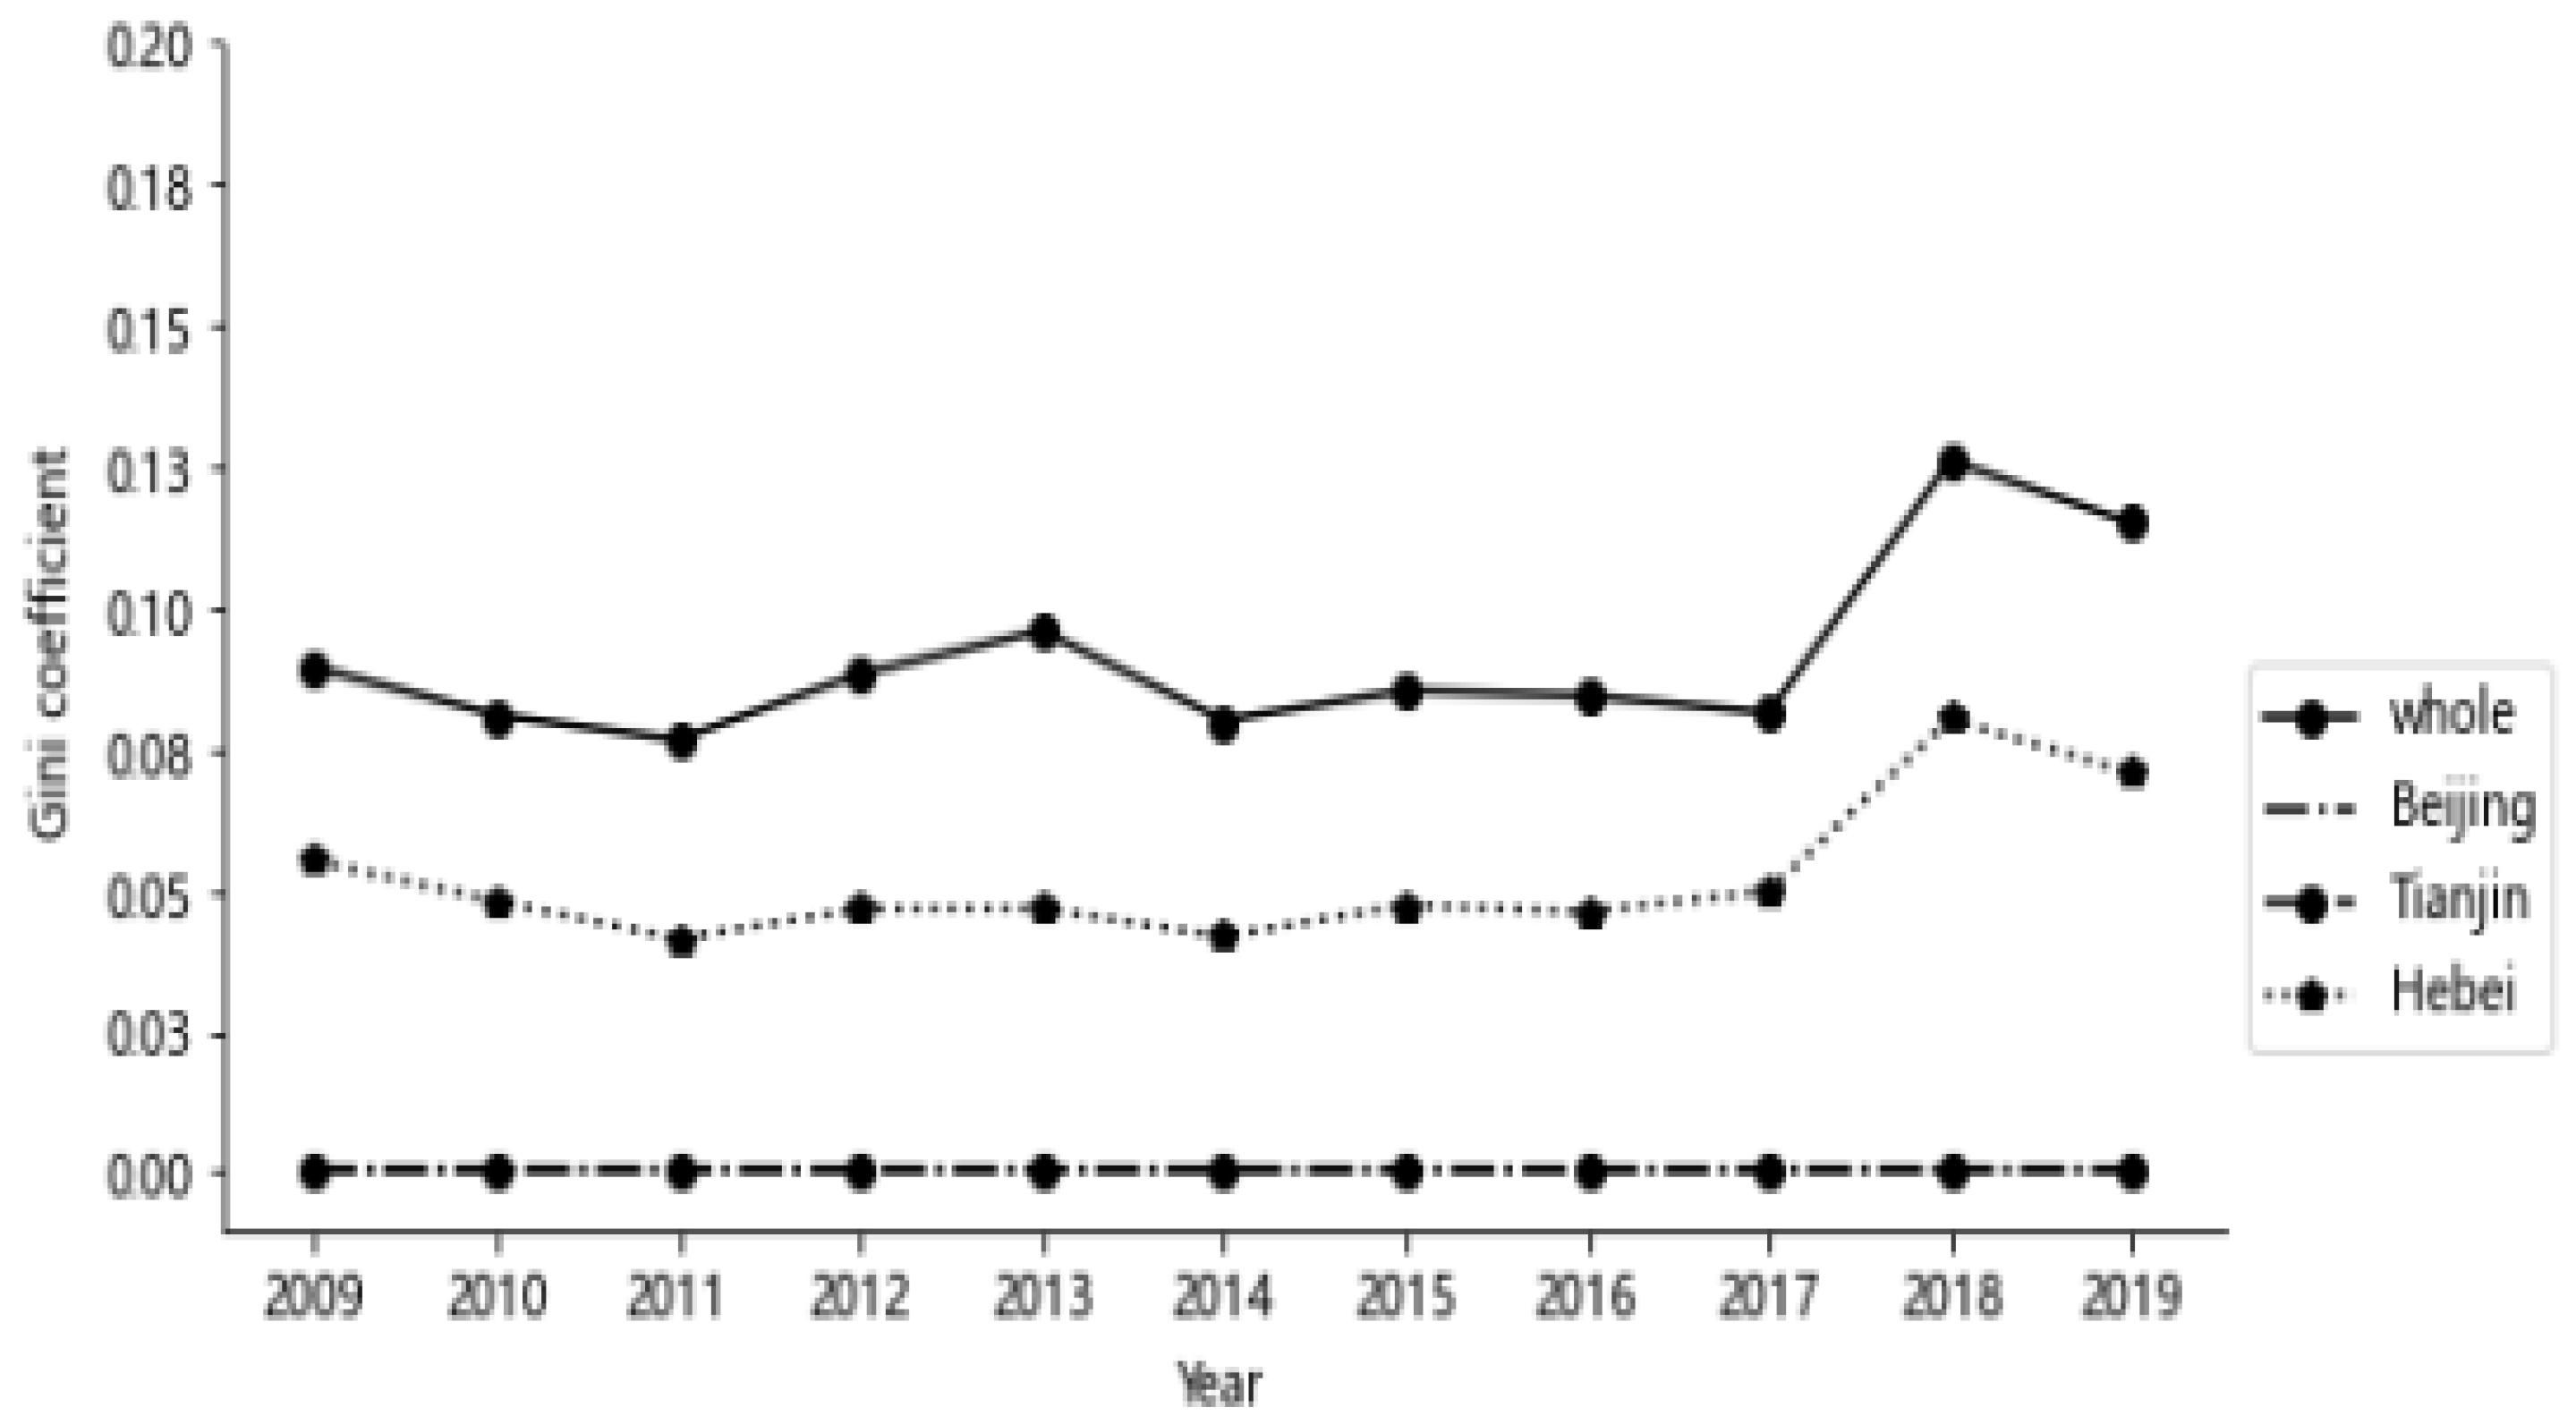
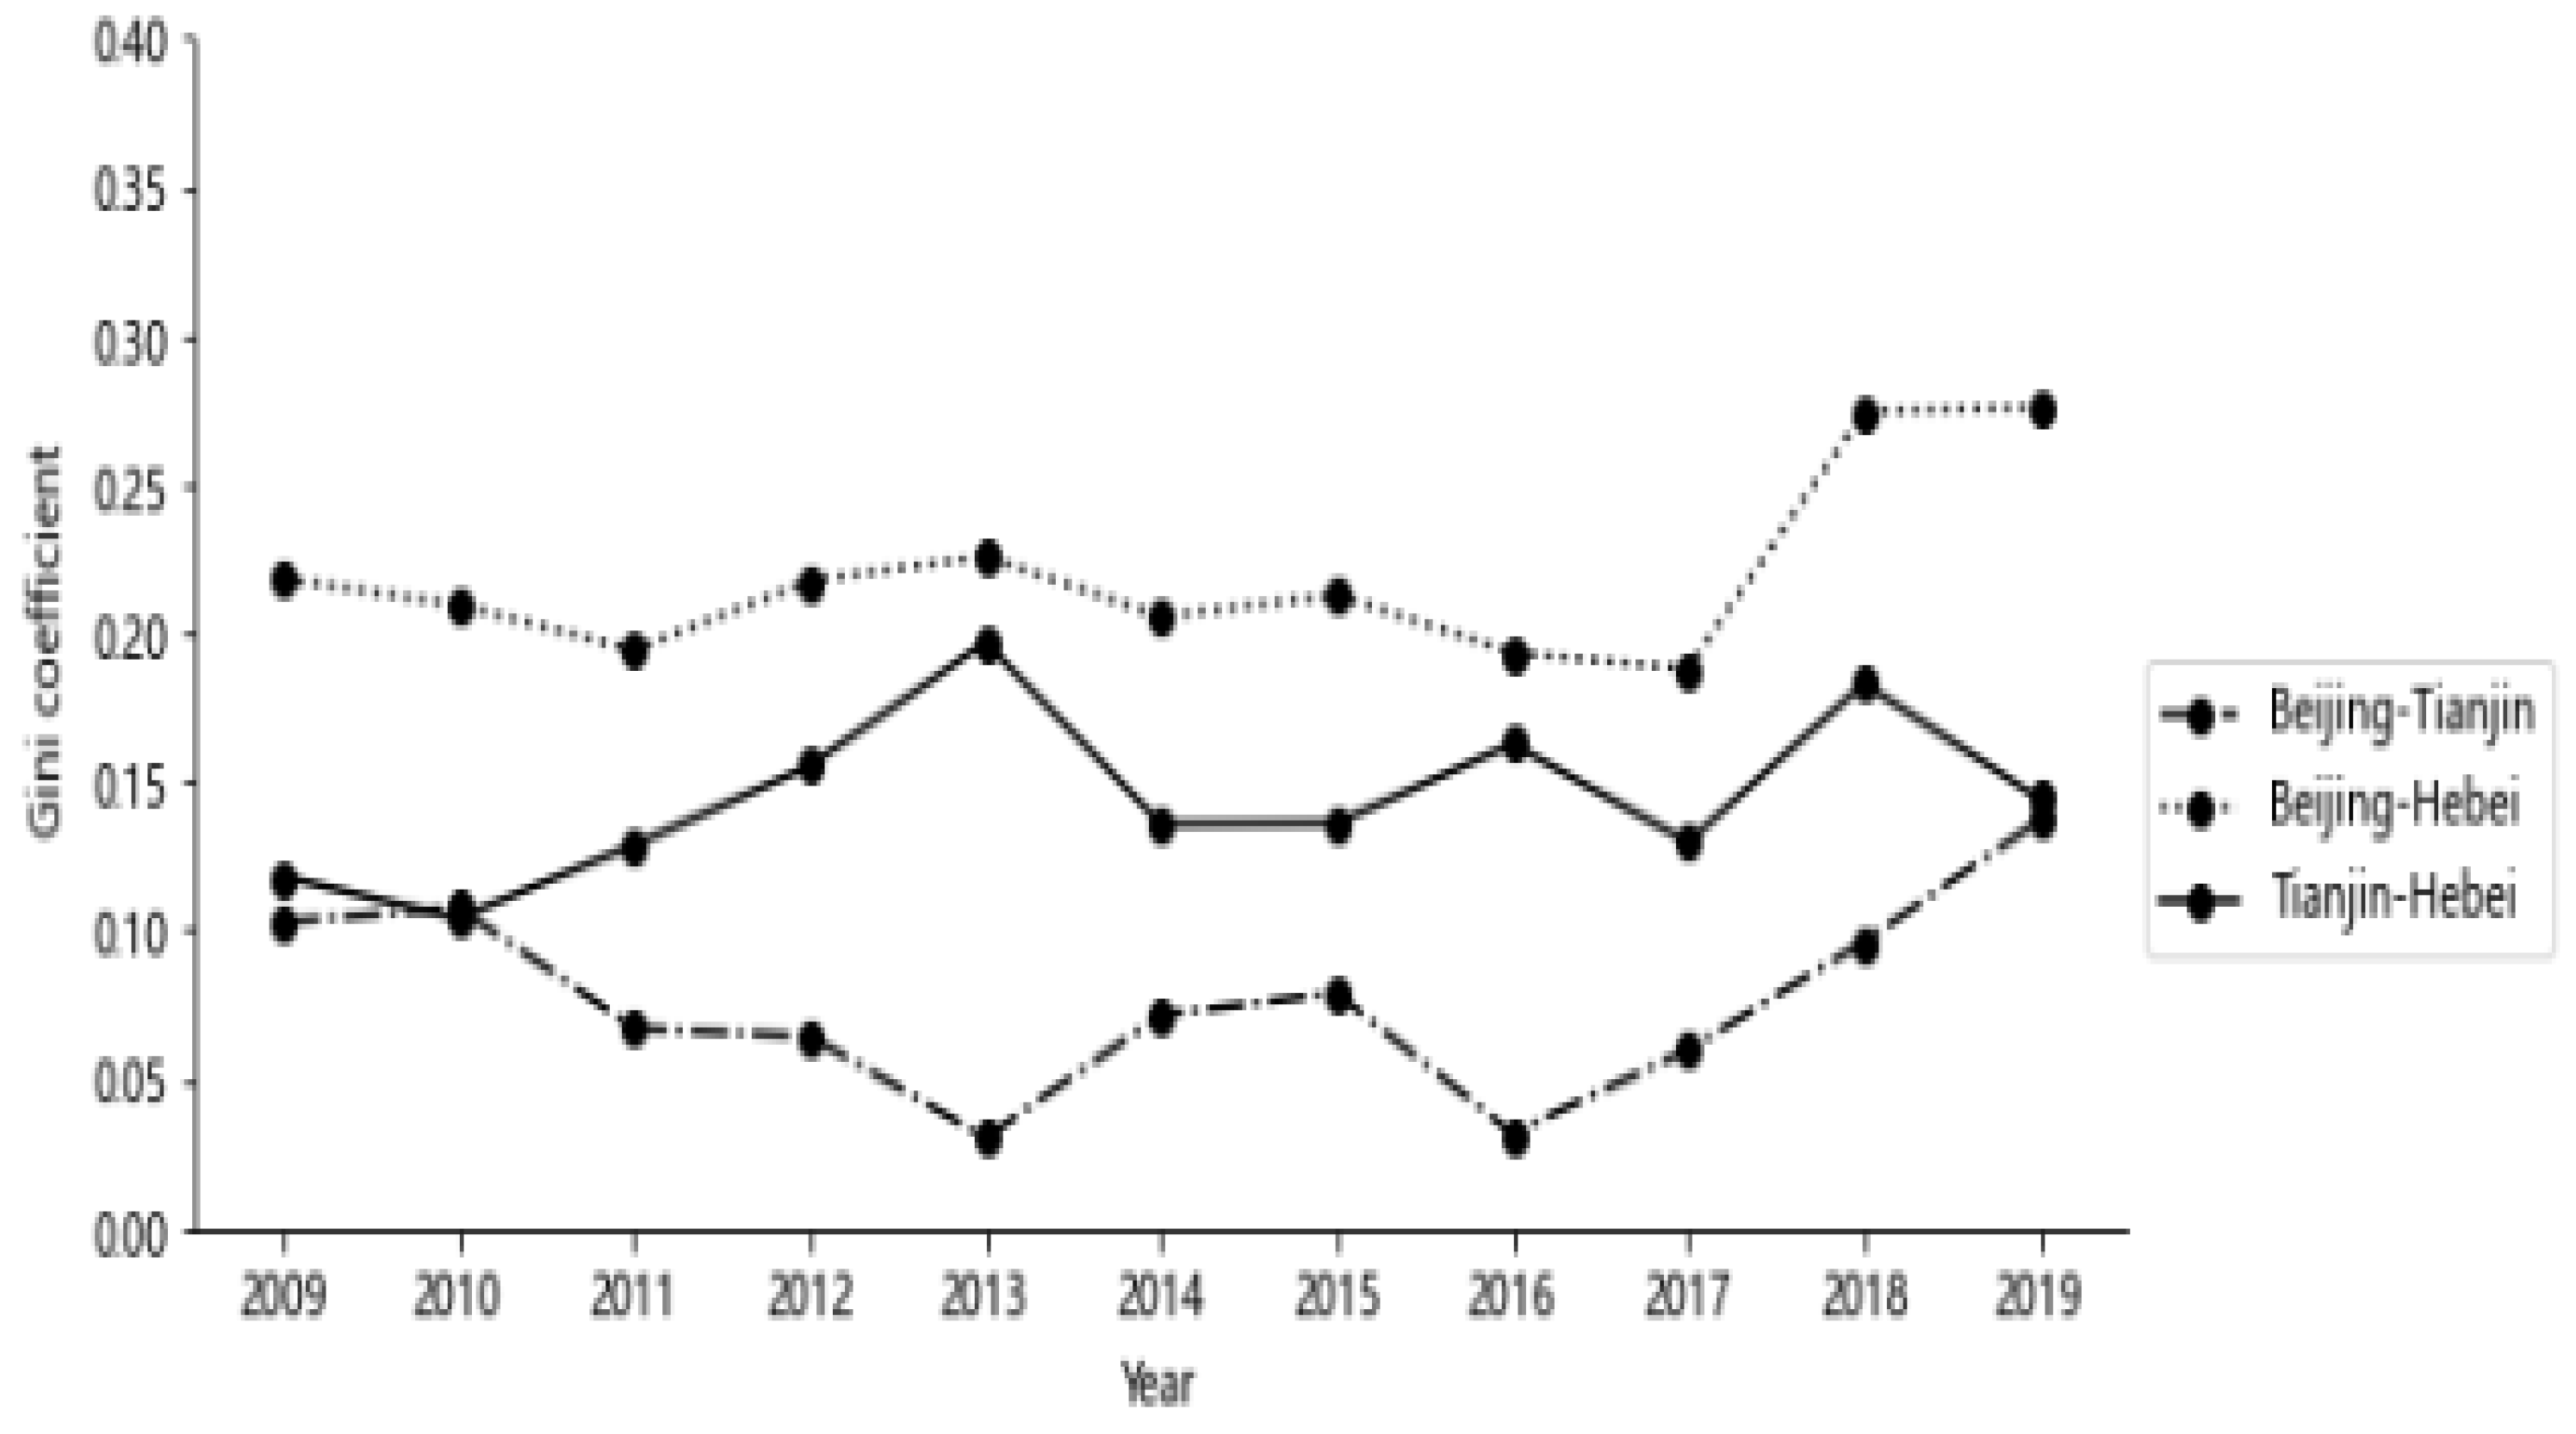
3.6. Regional Differences in the IS-EC-EE Complex System Coordination
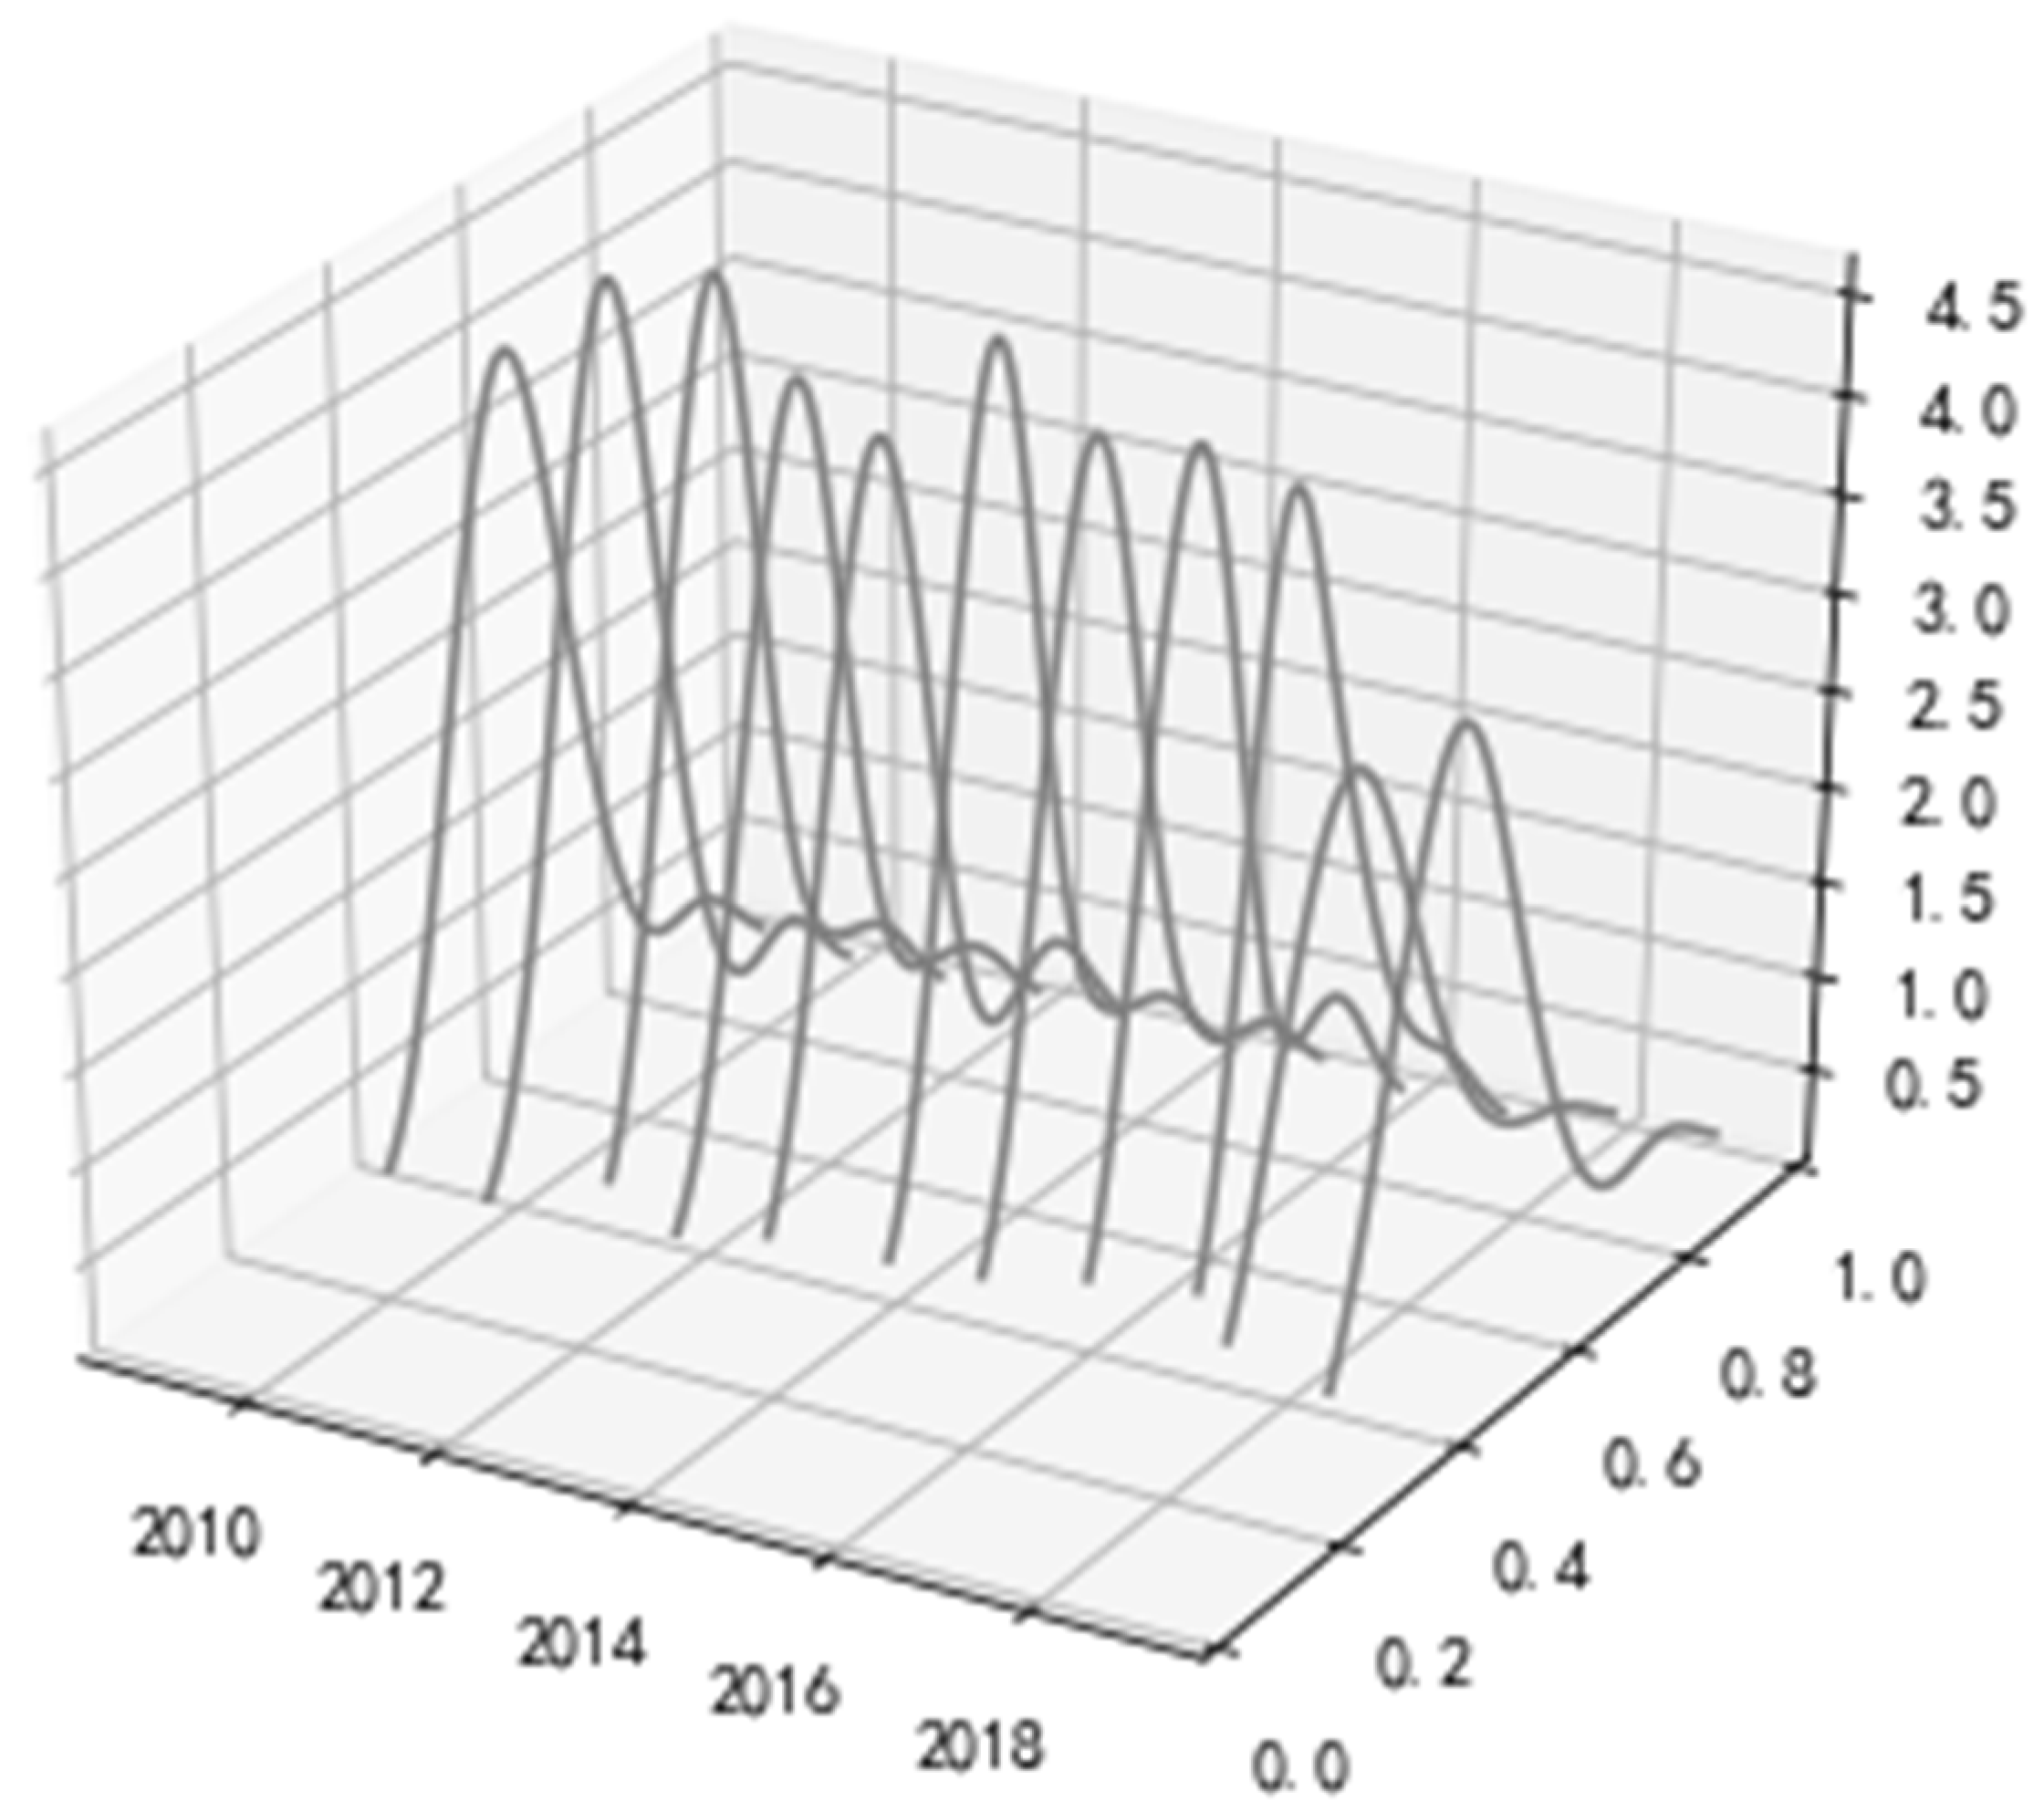
3.7. Distribution Dynamic Evolution of the IS-EC-EE System Coordination
4. Discussion and Conclusions
4.1. Discussion
4.2. Conclusions
Author Contributions
Funding
Institutional Review Board Statement
Informed Consent Statement
Data Availability Statement
Conflicts of Interest
References
- Wang, X.P.; Song, J.N.; Duan, H.Y.; Wang, X.E. Coupling between energy efficiency and industrial structure: An urban agglomeration case. Energy 2021, 234, 121304. [Google Scholar] [CrossRef]
- Ding, L.; Chen, K.; Hua, Y.; Dong, H.; Wu, A. Investigating the Relationship between the industrial structure and atmospheric environment by an integrated system: A case study of Zhejiang, China. Sustainability 2020, 12, 1278. [Google Scholar] [CrossRef]
- Sun, Y.; Cui, Y. Analyzing urban infrastructure economic benefit using an integrated approach. Cities 2018, 79, 124–133. [Google Scholar] [CrossRef]
- Nie, L.; Chen, P.; Liu, X.; Shi, Q.; Zhang, J. Coupling and Coordinative Development of Green Finance and Industrial-Structure Optimization in China: Spatial-Temporal Difference and Driving Factors. Int. J. Environ. Res. Public Health 2022, 19, 10984. [Google Scholar] [CrossRef] [PubMed]
- Zhang, X.; Zheng, J.Y.; Wang, L.G. Can the Relationship between Atmospheric Environmental Quality and Urban Industrial Structure Adjustment Achieve Green and Sustainable Development in China? A Case of Taiyuan City. Energies 2022, 15, 3402. [Google Scholar] [CrossRef]
- Zhou, D.; Zhang, X.R.; Wang, X.Q. Research on coupling degree and coupling path between China’s carbon emission efficiency and industrial structure upgrading. Environ. Sci. Pollut. Res. 2020, 27, 25149–25162. [Google Scholar] [CrossRef] [PubMed]
- Ren, H.X.; Ou, X.J.; Zhu, H.X. Spatial characteristics and coupling coordination between carbon emission efficiency and industrial structure in three metropolitan areas of Jiangsu Province, China. Sci. Prog. 2023, 106, 368504231176146. [Google Scholar] [CrossRef] [PubMed]
- Chen, Y.Q.; Zhao, L.M. Exploring the relation between the industrial structure and the eco-environment based on an integrated approach: A case study of Beijing, China. Ecol. Indic. 2019, 103, 83–93. [Google Scholar] [CrossRef]
- Rong, B.; Chu, C.J.; Zhang, Z.; Li, Y.T.; Yang, S.H.; Wang, Q. Assessing the coordinate development between economy and ecological Environment in China’s 30 Provinces from 2013 to 2019. Environ. Model. Assess. 2023, 28, 303–316. [Google Scholar] [CrossRef]
- An, S.; Zhang, S.; Hou, H.; Zhang, Y.; Xu, H.; Liang, J. Coupling Coordination Analysis of the Ecology and Economy in the Yellow River Basin under the Background of High-Quality Development. Land 2022, 11, 1235. [Google Scholar] [CrossRef]
- Yin, Y.Q.; Xu, Z.X. The coupling synergy effect of economic and environment in developed area: An empirical study from the Yangtze River Delta urban agglomeration in China. Int. J. Environ. Res. Public Health 2022, 19, 7444. [Google Scholar] [CrossRef] [PubMed]
- Li, W.W.; Yi, P.T.; Zhang, D.N.; Zhou, Y. Assessment of coordinated development between social economy and ecological environment: Case study of resource-based cities in Northeastern China. Sustain. Cities Soc. 2020, 59, 102208. [Google Scholar] [CrossRef]
- Huang, J.H.; Li, F. Coupling coordination degree measurement and spatial distribution between economic development and ecological environment of countries along the Belt and Road. Pol. J. Environ. Stud. 2021, 30, 3615–3626. [Google Scholar] [CrossRef] [PubMed]
- Wang, J.K.; Han, Q.; Wun, K.X.; Xu, Z.T.; Liu, P. Spatial-temporal patterns and evolution characteristics of the coordinated development of industrial economy, natural resources and environment in China. Resour. Policy 2022, 75, 102463. [Google Scholar] [CrossRef]
- Xing, L.; Xue, M.G.; Hu, M.S. Dynamic simulation and assessment of the coupling coordination degree of the economy–resource–environment system: Case of Wuhan City in China. J. Environ. Manag. 2019, 230, 474–487. [Google Scholar] [CrossRef] [PubMed]
- Fang, X.; Liu, X.Y. Coordinated development and spatial relationship analysis of energy-economy-environment in Yangtze River economic belt, China. Fresenius Environ. Bull. 2020, 29, 4769–4776. [Google Scholar]
- Han, H.; Guo, L.; Zhang, J.Q.; Zhang, K.; Cui, N. Spatiotemporal analysis of the coordination of economic development, resource utilization, and environmental quality in the Beijing-Tianjin-Hebei urban agglomeration. Ecol. Indic. 2021, 127, 107724. [Google Scholar] [CrossRef]
- Fang, X.J.; Cao, J.W. Statistical and analytical research of coordinated development of economy, resource and environment. Fresenius Environ. Bull. 2019, 28, 8158–8164. [Google Scholar]
- Dong, B.Y.; Ma, X.J.; Zhang, Z.L.; Zhang, H.B.; Chen, R.M.; Song, Y.Q.; Shen, M.C.; Xiang, R.B. Carbon emissions, the industrial structure and economic growth: Evidence from heterogeneous industries in China. Environ. Pollut. 2020, 262, 114322. [Google Scholar] [CrossRef]
- Liu, K.; Qiao, Y.R.; Shi, T.; Zhou, Q. Study on coupling coordination and spatiotemporal heterogeneity between economic development and ecological environment of cities along the Yellow River Basin. Environ. Sci. Pollut. Res. 2021, 28, 6898–6912. [Google Scholar] [CrossRef]
- Wang, J.K.; Han, Q.; Du, Y.H. Coordinated development of the economy, society and environment in urban China: A case study of 285 cities. Environ. Dev. Sustain. 2021, 24, 12917–12935. [Google Scholar] [CrossRef]
- Lv, C.C.; Bian, B.C.; Lee, C.C.; He, Z. Regional gap and the trend of green finance development in China. Energy Econ. 2021, 102, 105476. [Google Scholar] [CrossRef]
- Wang, K.L.; Xu, R.Y.; Zhang, F.Q.; Miao, Z.; Peng, G. Spatiotemporal heterogeneity and driving factors of PM2.5 reduction efficiency: An empirical analysis of three urban agglomerations in the Yangtze River Economic Belt, China. Ecol. Indic. 2021, 132, 10830. [Google Scholar] [CrossRef]
- Zor, C.; Çebi, F.H. Demand prediction in health sector using fuzzy grey forecasting. J. Enterp. Inf. Manag. 2018, 31, 937–949. [Google Scholar] [CrossRef]
- Wu, Y.P.; Wang, J.B.; Wang, C.T. Application of model GM (1,1) to settlement forecast of high-fill airport. Appl. Mech. Mater. 2014, 580–583, 2810–2814. [Google Scholar] [CrossRef]
- Miao, X.K.; Li, M.Y. Application of Grey Model(1,1) in road traffic accident forecast. Appl. Mech. Mater. 2011, 65, 551–556. [Google Scholar] [CrossRef]
- Xue, Y.T.; Liu, K. Regional differences, distribution dynamics, and convergence of air quality in urban agglomerations in China. Sustainability 2022, 14, 7330. [Google Scholar] [CrossRef]
- Dagum, C. A new approach to the decomposition of the Gini income inequality ratio. Empir. Econ. 1997, 22, 515–531. [Google Scholar] [CrossRef]
- Wu, A.B.; Zhao, Y.X.; Qin, Y.J.; Liu, X.; Shen, H.T. Analysis of Ecological Environment Quality and Its Driving Factors in the Beijing-Tianjin-Hebei Region of China. Sustainability 2023, 15, 7898. [Google Scholar] [CrossRef]
- Gu, J.; Zheng, J.Y.; Zhang, J. Research on the coupling coordination and prediction of industrial convergence and ecological environment in rural of China. Front. Environ. Sci. 2022, 10, 1014848. [Google Scholar] [CrossRef]
- Ying, S.P.; Zakaria, S.; Mutalib, S.S.S.A. A comparative study on GM (1,1) and FRMGM (1,1) model in forecasting FBM KLCI. AIP Conf. Proc. 2017, 1905, 050038. [Google Scholar] [CrossRef]


| Subsystem | Index Layer and Description | Unit | Index Attribute |
|---|---|---|---|
| IS subsystem | The proportion of primary industry | % | − |
| The proportion of secondary, tertiary industry | % | + | |
| The specific gravity of primary industry | RMB 10,000 | − | |
| The specific gravity of secondary, tertiary industry | RMB 10,000 | + | |
| The proportion of employees in primary industry | % | − | |
| The proportion of employees in secondary, tertiary industry | % | + | |
| Industrial agglomeration (proportion of regional gross industrial output value in GDP relative to that of national) | 1 | + | |
| Industrial structure advancement (ratio of output value of the tertiary industry to that of the secondary industry) | 1 | + | |
| Industrial structure rationalization Theil index (, are the output value and employment number of the ith industry, respectively | 1 | + | |
| EC subsystem | Population | 10,000 people | + |
| GDP per capita | RMB 10,000 | + | |
| Actual utilization level of foreign capital | USD 10,000 | + | |
| Investment in fixed assets per capita | RMB 10,000 | + | |
| Public financial expenditure per capita | RMB 10,000 | + | |
| Per capita disposable income of urban residents | RMB | + | |
| EE subsystem | Total energy consumption | Standard coal tons | − |
| Growth rate of energy consumption | % | − | |
| GDP energy intensity | Ton/RMB 10,000 | − | |
| Comprehensive utilization rate of industrial solid waste | % | + | |
| Industrial smoke and dust emission | ton | − | |
| Industrial SO2 emission | ton | − | |
| Total industrial wastewater discharge | 10,000 tons | − |
| Variable | Obs | Mean | Std. Dev. | Min | Max |
|---|---|---|---|---|---|
| The specific gravity of primary industry | 143 | 839,293.1 | 1,134,581 | 15,866 | 5,312,190 |
| The specific gravity of secondary industry | 143 | 10,400,000 | 13,300,000 | 812,724 | 76,100,000 |
| The specific gravity of tertiary industry | 143 | 18,600,000 | 39,200,000 | 478,431 | 295,000,000 |
| The proportion of primary industry | 143 | 4.151049 | 4.102382 | 0.32 | 20.26 |
| The proportion of secondary industry | 143 | 45.30552 | 12.26229 | 16.16 | 66.23 |
| The proportion of tertiary industry | 143 | 50.54301 | 12.58269 | 29.64 | 83.52 |
| The proportion of employees in primary industry | 143 | 0.7185315 | 0.8213446 | 0.01 | 4.06 |
| The proportion of employees in secondary industry | 143 | 37.36322 | 18.39597 | 10.58 | 165.47 |
| The proportion of employees in tertiary industry | 143 | 64.64224 | 45.40601 | 18.92 | 576.25 |
| Industrial structure advancement | 143 | 1.537832 | 0.8381772 | 0.59 | 5.17 |
| Industrial agglomeration | 143 | 1.618322 | 2.721588 | 0.1 | 11.34 |
| Theil index | 143 | 13.08161 | 14.45865 | 0.01 | 64.72 |
| GDP per capita | 143 | 50,233.75 | 30,029.12 | 15,174 | 164,220 |
| Investment in fixed assets per capita | 143 | 1.866993 | 1.928644 | 0.16 | 8.7 |
| Public financial expenditure per capita | 143 | 9957.236 | 10,466.66 | 1734.26 | 54,270 |
| Population | 143 | 759.0912 | 323.1529 | 287.24 | 1397 |
| Per capita disposable income of urban residents | 143 | 27,109.1 | 11,103.34 | 1173 | 73,849 |
| Actual utilization level of foreign capital | 143 | 252,139.6 | 513,200.9 | 1610 | 3,082,563 |
| Total energy consumption | 143 | 2646.039 | 2658.747 | 264.87 | 8260 |
| Growth rate of energy consumption | 143 | 0.590979 | 2.3551 | −5.03 | 16.07 |
| GDP energy intensity | 143 | 122.7205 | 155.7709 | 17.63 | 800 |
| Total industrial wastewater discharge | 143 | 8816.362 | 6297.723 | 615 | 31,058 |
| Industrial SO2 emission | 143 | 76,106.58 | 70,403.89 | 1132 | 331,863 |
| Industrial smoke and dust emission | 143 | 81,273.86 | 180,082.3 | 3349 | 1,859,866 |
| Comprehensive utilization rate of industrial solid waste | 143 | 75.29042 | 25.18788 | 4.74 | 100 |
| 1 | 2 | 3 | 4 | |
|---|---|---|---|---|
| 1 | 0.5000 | 0.5000 | 0.0000 | 0.0000 |
| 2 | 0.0714 | 0.7714 | 0.1286 | 0.0286 |
| 3 | 0.0000 | 0.1667 | 0.6250 | 0.2083 |
| 4 | 0.0000 | 0.0000 | 0.0000 | 1.0000 |
Disclaimer/Publisher’s Note: The statements, opinions and data contained in all publications are solely those of the individual author(s) and contributor(s) and not of MDPI and/or the editor(s). MDPI and/or the editor(s) disclaim responsibility for any injury to people or property resulting from any ideas, methods, instructions or products referred to in the content. |
© 2024 by the authors. Licensee MDPI, Basel, Switzerland. This article is an open access article distributed under the terms and conditions of the Creative Commons Attribution (CC BY) license (https://creativecommons.org/licenses/by/4.0/).
Share and Cite
Cao, N.; Cui, X.; Wen, S. Exploring Differences and Evolution of Coordination Level of the Industrial Structure, Economy and Ecological Environment Complex System in Beijing–Tianjin–Hebei Urban Agglomeration. Sustainability 2024, 16, 4828. https://doi.org/10.3390/su16114828
Cao N, Cui X, Wen S. Exploring Differences and Evolution of Coordination Level of the Industrial Structure, Economy and Ecological Environment Complex System in Beijing–Tianjin–Hebei Urban Agglomeration. Sustainability. 2024; 16(11):4828. https://doi.org/10.3390/su16114828
Chicago/Turabian StyleCao, Na, Xinlei Cui, and Shufeng Wen. 2024. "Exploring Differences and Evolution of Coordination Level of the Industrial Structure, Economy and Ecological Environment Complex System in Beijing–Tianjin–Hebei Urban Agglomeration" Sustainability 16, no. 11: 4828. https://doi.org/10.3390/su16114828