Article

Research on the Optimization Path of Regional Innovation “Dualization” Effect Based on System Dynamics

1
School of Management, Wuhan University of Technology, Wuhan 430070, China
2
Business School, University of Jinan, Jinan 250022, China
*
Author to whom correspondence should be addressed.
Sustainability 2024, 16(11), 4869; https://doi.org/10.3390/su16114869
Submission received: 26 March 2024 / Revised: 3 June 2024 / Accepted: 4 June 2024 / Published: 6 June 2024

Abstract

:
Coordinated regional development is an important issue for China in the new era, and the influence of innovation ability on regional economic development is increasing, but the current regional innovation is characterized by an increasingly obvious “dualization” effect. In this paper, by constructing innovation efficiency, science and technology innovation, innovation culture, and innovation policy as the four key subsystems of regional innovation effect, and using system dynamics to establish a regional innovation effect model, Wuhan and Enshi as the representatives of central city and non-central city, selecting the data from 2014 to 2021, and adopting different parameters to simulate the evolution trend of the innovation effect, it is concluded that the growth rate of industrial enterprises and the intensity of R&D expenditures have increased, and the innovation effect has become more and more obvious, which is the most important issue in the new era of China’s development. It is also concluded that the growth rate of industrial enterprises and the intensity of R&D expenditure are the key factors influencing the innovation effect of central and non-central cities, and suggestions are made for optimizing the “dualization” effect of regional innovation.

1. Introduction

Regional economic development has been less driven by the traditional impetus of factors since China’s economy entered into the new pattern, while human capital quality and technology innovation capability are playing a more important role than before. For regions, it is effective to speed up implementing the innovation-driven development strategy, transforming traditional growth impetus and building new innovation-driven engines to transform growth drivers. Meanwhile, the global economy has become more and more regionalized, and regional innovation capability determines how to develop regional economy. Thus, building regional innovation systems has become an important goal for regional development. All regions across the country have been actively building scientific and sound regional innovation systems to improve the competitiveness of regional industries and enhance the drivers of regional economic growth.
While regional central cities invest a lot into R&D expenditures and personnel and they also grow rapidly, the advancement of science and technology is not always coordinated with economic development. Instead, some dilemmas arise, including some inefficient technological innovation and weak capability of original innovation, which will surely constrain the effective implementation of China’s innovation-driven development strategy if the situation lasts long. Therefore, we have to solve the “dualization” phenomenon in regional innovation development and enhance the overall efficiency of regional innovation, significant to implement the innovation-driven development strategy and innovative China initiative.
As a result, this paper takes the internal causes and symptoms of the dualization effect of regional innovation development as the penetration point, explores the historical trajectory and spatial distribution of regional innovation agglomeration, and sorts out stage effects of innovation-driven development and the endogenous mechanism of dualization. Then, the paper proposes the relevant suggestions for optimization based on the identified key paths and elements through quantitative evaluation and simulation of regional innovation dualization effect. This is of practical significance for eliminating the imbalance of regional innovation development, improving efficiency of some innovation in regions, and promoting the coordinated innovation development of regions.

2. Literature Review

The concept of the regional innovation system was introduced as a new field in the global economics community and geography community in 1992, an extension of the national innovation system. Freeman (1987) [1], Lundvall (2010) [2], and Nelson (1993) [3] all indicated that the concept of the innovation system begins at the national level. In China, the research of regional innovation systems started within the framework of a national innovation system in 1996. Huang Lucheng (2000) [4] explained the composition of a regional innovation system from the following four perspectives: “innovation is the generation, diffusion and utilization of knowledge”, the structure of innovation, the dynamic process of innovation, and the object of innovation. Ren Shenggang et al. (2006) [5] believed that the regional innovation system is a spatial organization system for innovation development, which is composed of interconnected innovation entities within a certain geographical scope and in a certain institutional environment. Wang Lijing (2010) [6] believed that in essence, a regional innovation system is a complex social system within a specific geographical scope, composed of subject elements and non-subject elements linked to innovation. It is an organic entirety composed of economic system, social system, and natural environment. Wang Song et al. (2013) [7] defined regional innovation system as a complex system generated in a specific region. With the aim of innovative development, innovation entities improve innovation environment and upgrade industries via content innovation like capital and management. Su Yi et al. (2016) [8] proposed that a regional innovation system is a complicated social system, which mainly includes three parts: innovation entity subsystem, innovation resource subsystem, and innovation environment subsystem.
For the study of regional innovation systems and duality, Li Xueqing (2007) [9] argues that the rapid growth of China’s economy has made China’s dual economic structure present complex and diverse explanations. The traditional dualistic economic theory does not take into account the changes in the spatio-temporal view of regional economy caused by the difference in regional economic growth rate. Li Chunyan and Nie Yazhen (2014) [10] showed that the process of urban–rural integration can be promoted by improving the planning of central towns, strengthening the construction of central towns and market town belts, accelerating the realization of the “nationalization” of the treatment of farmers entering cities and towns, improving the level and coverage of rural public services, and innovating rural social management and social undertakings. Gao Wenwu and Xu Mingyang (2018) [11] took Anhui Province as an example, selected the time series data of Anhui Province from 1995 to 2016, used the Theil index to measure the income gap between urban and rural residents in Anhui Province, and empirically analyzed the impact of economic development and urban–rural dualization on the income gap between urban and rural residents in Anhui Province by using the generalized additive model. Based on the individual-environment matching theory, using spatial econometric methods, Zhou Yong and Chen Jinyue (2020) [12] studies the impact of technology transfer on regional dualistic innovation capabilities in 30 provinces and cities in mainland China from 2011 to 2016. Zhu Yuhao and Deng Jing et al. (2022) [13] established a spatial econometric model to study the green spillover effect of collaborative innovation in the Beijing–Tianjin–Hebei region, and found that collaborative innovation has obvious spatial spillover effects, which can effectively promote the green economic growth of local and adjacent regions. Industrial structure, opening-up, employment, capital investment, and industrial development can promote local green economic growth, but have a negative effect on the green economic growth of surrounding areas. Huang Xiaowu and Zong Shuwang et al. (2022) [14] constructed an index system based on five dimensions, green credit, green securities, green insurance, green investment, and carbon finance; used the subjective and objective weighting method to calculate the green finance development index from 2005 to 2018; analyzed the regional differences and dynamic evolution trend of green finance development through the Dagum Gini coefficient decomposition method, Kernel density estimation method, and Markov chain method; and studied the innovation effect and mechanism of green finance development in China. Based on the panel data of the Yangtze River Delta urban agglomeration from 2016 to 2020, starting from the innovation endowment and spillover endowment, Bai Yunpu and Zhao Hongyang (2023) [15] constructed the evaluation index system of innovation spillover effect in the Yangtze River Delta urban agglomeration with innovation input, innovation output, spillover environment, and spillover breadth as the secondary indicators. Li Zhihui and Liu Jie (2024) [16] analyzed the main components of the regional innovation ecosystem from the perspective of ecosystem, constructed an evaluation system for the regional innovation ecosystem considering the influencing factors of digital development, and used the VIKOR method to evaluate the regional innovation capacity of the Beijing–Tianjin–Hebei urban agglomeration from 2010 to 2020. Fang Dachun and Wang Linlin (2024) [17] selected the data of 30 provinces (autonomous regions and municipalities) in China from 2017 to 2021, and used the fuzzy set qualitative comparative analysis method (fsQCA) to identify multiple configuration driving paths driving regional high-level innovation, and tested the driving effects of different configuration paths on regional innovation. Based on the data of 30 provinces (autonomous regions and municipalities) in China, Fang Dachun and Wang Linlin (2024) [18] used the spatial autocorrelation test and social network analysis to investigate the spatial correlation characteristics of regional innovation in China, and further explore the influence of individual network structure characteristics on innovation ability.
Based on the results of system dynamics research and drawing on the existing research results, Xue Yang, Hu Lina et al. (2021) [19] constructed a system dynamics simulation model for the improvement of urbanization quality in the Beijing–Tianjin–Hebei urban agglomeration, and set up simulation schemes under four scenarios: economy-oriented, social-oriented, ecological-oriented, and coordinated development. The urbanization quality improvement path of the Beijing–Tianjin–Hebei urban agglomeration under different schemes was simulated, and the system dynamic mechanism of improvement was clarified. Zhao Dongqing and Wang Qin (2020) [20] constructed a system model of economic green competitiveness in Gansu Province based on system dynamics, constructed system evaluation indicators, and set up single policies and combination policies for regulation, prediction, and evaluation of possible problems in each subsystem. Jiang Qijun (2023) [21] summarized the connotation and development process of offshore trade in the pilot free trade zone, used system dynamics to construct a causal diagram and a system flow diagram, identified and defined the key factors affecting the development of offshore trade, and divided the offshore trade development system in the pilot free trade zone into environmental subsystem and policy subsystem. Based on the development status of offshore trade in the Shanghai Pilot Free Trade Zone, the parameters were set to analyze and simulate different strategies for the development of offshore trade. Qiao Han, Xu Junru et al. (2023) [22] used the system dynamics method to reveal the evolution law of the community e-commerce ecosystem, and evaluate the impact of product design, commission incentives, product quality, cost performance, and logistics services on value creation. Tao Ma, Wuyang Hong, Zhan Cao et al. (2024) [23] mainly studied the connection patterns and resilience simulation of innovation network in the context of technology transfer. This study Combines the “Buzz-Gatekeeper-Pipeline” model to introduce a comprehensive analytical framework and leverages network methodologies effectively uncovers regional knowledge exchange and transfer patterns. Mousa Al-Kfairy, Souheil Khaddaj, and Robert B. Mellor (2020) [24] evaluated the effect of organizational architecture in developing science and technology parks under differing innovation environments. They sought innovations and innovators, and encouraged innovation amongst the constituent firms, including by networking and knowledge spill over between the inhabitants, universities, and sources of capital. Three different types of architecture were investigated in this study: open (market), star (hierarchy), and closed strong (adhocracy, ambidextrous).
Based on the literature review of the concept and application of the regional innovation system, the duality of regional innovation, and system dynamics, the research on regional innovation systems at home and abroad started early, and most of the studies combined with data and used theories and models to conduct in-depth research on the economy, innovation ability, and innovation system of different regions. Therefore, based on the above research literature, this paper constructs four key subsystems of regional innovation effect, which are innovation benefit, scientific and technological innovation, innovation culture, and innovation policy, and uses system dynamics to establish a model of regional innovation effect and study the effect of regional innovation duality. With the continuous development of society and the gradual deepening of research, the definition of regional innovation system is also constantly expanding and improving. And the main description of regional innovation system can be found in Table 1.

3. Model Construction

3.1. Causality Diagram of Subsystems

In essence, the dualization effect of regional innovation development is formed by differentiation of regional innovation benefit, technological innovation, innovation culture, and innovation policy in different spatial attributes, such as central cities or not. Therefore, the dualization effect is closely related to the above factors, including innovation benefit, technological innovation, innovation culture, and innovation policy. These factors influence the different aspects of the elements involved in innovation, further exerting impacts on the regional innovation dualization effect. Therefore, the four factors are considered as the fundamental factors of the regional innovation development system.

3.1.1. Innovation Benefit-Driven Subsystem and Causality Diagram

Benefit drive can be explained as a process in which behavioral agents pursue their own benefits under certain institutional conditions and use the benefits as growth drivers to achieve the goals. The regional innovation benefit-driven subsystem refers to the collection of production process and entities aiming to obtain benefits within the system. The benefit-driven subsystem directly has a great influence on the state of regional innovation and potential innovation capability from the perspectives of enterprise innovation return, talent remuneration, achievement transformation efficiency, and improved supporting facilities. The high return mechanism of innovation benefit will facilitate the gathering of innovation factors, and the absorption of various innovation factors will directly influence the input and output of regional innovation, promoting regional innovation development. Boosted by economic growth, the regional innovation-driven system will inevitably enhance benefit return of regions. Therefore, the causal feedback mechanism driven by benefit will be established in regional innovation systems if repeating in this way. The innovation benefit driving subsystem is shown in Figure 1.

3.1.2. Technological Innovation-Pushed Subsystem and Causality Diagram

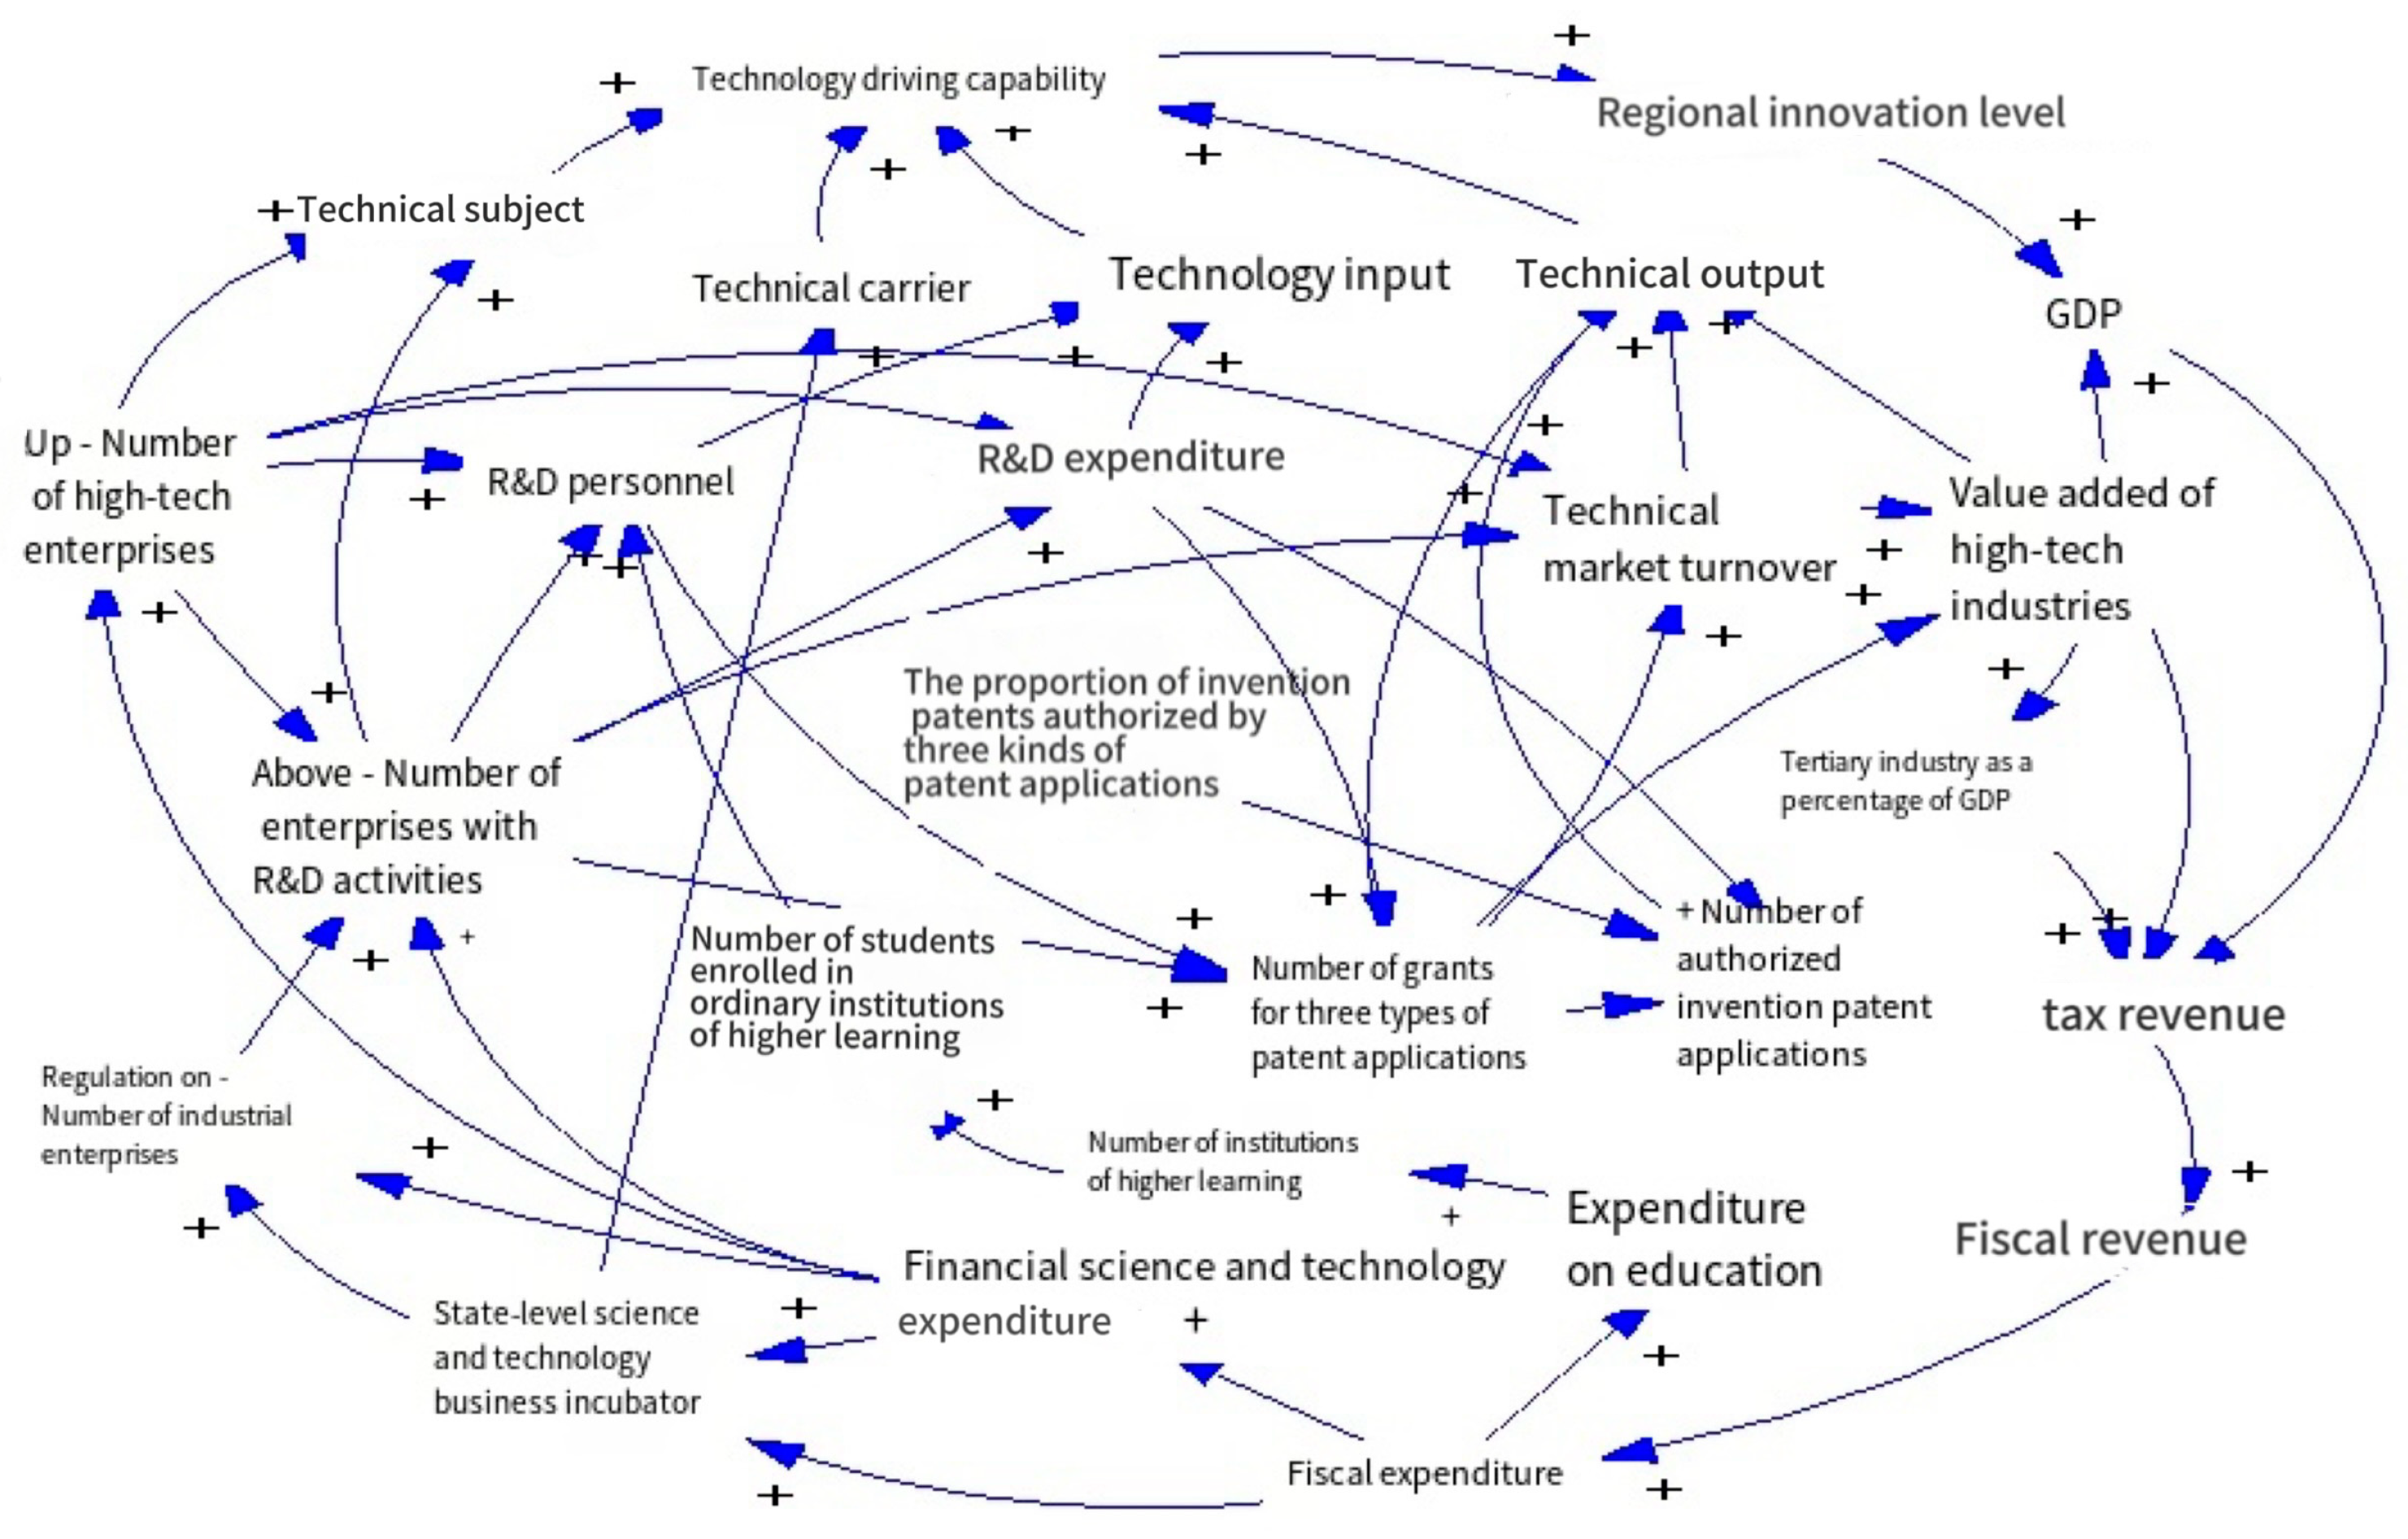
Technological innovation involves technological innovation entities, technological innovation carriers, technological innovation input, and technological innovation output. Enterprises are the main entities of technological innovation, as well as the basic unit for regional innovation. In particular, expenditure on R&D and personnel, served as the engines in business innovation, are important factors in determining innovation output; technological innovation carriers are conducive to the incubation and upgrading of enterprises. A sound industry–academia–research cooperation mechanism also provides endless vitality to innovation entities and enhance the impetus of enterprise innovation. In addition, the growth of entities and carriers will increase the input of regional technological innovation, and then enrich the technological innovation output. With considerable R&D revenue, more innovation entities will be gravitated to the region and more innovation carriers will be cultivated, forming a positive feedback cycle pushed by regional technological innovation. The science and technology innovation promotion subsystem is shown in Figure 2.

3.1.3. Innovation Culture-Catalyzed Subsystem and Causality Diagram

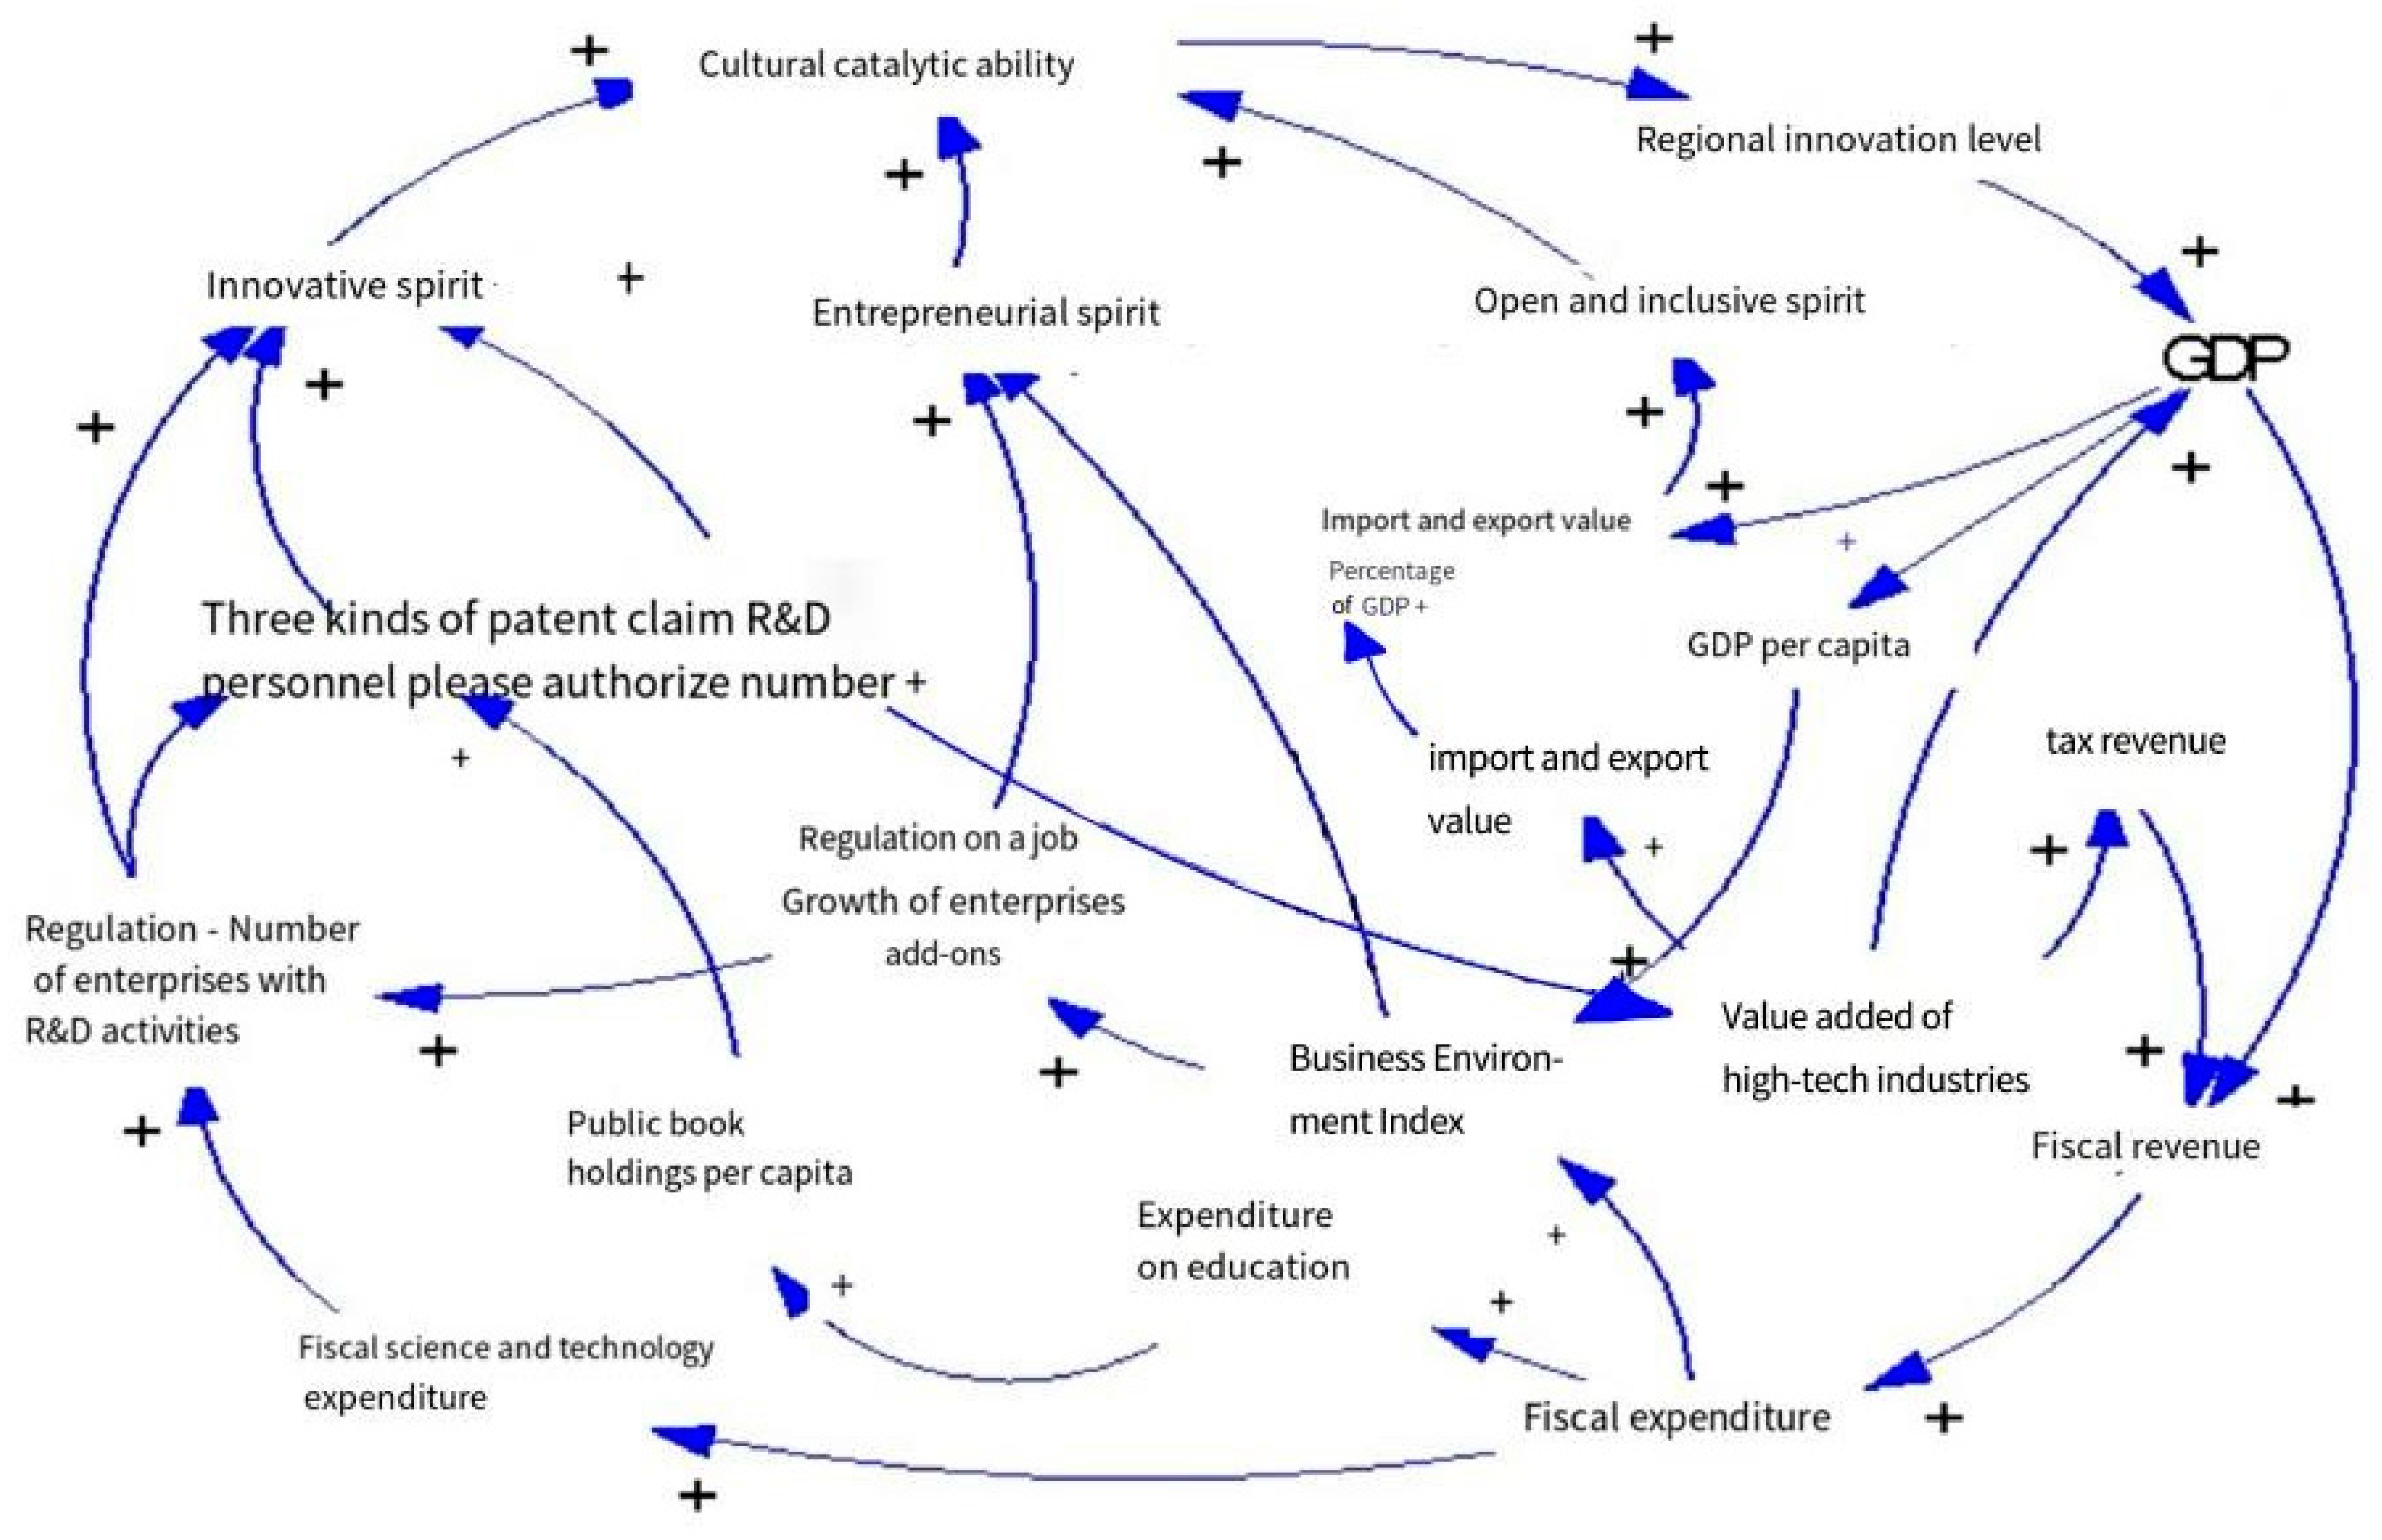
The innovation culture-catalyzed subsystem is the cornerstone and soul of developing regional innovation system, and the most important soft environment that catalyzes regional innovation. Positive regional innovation culture can arouse great innovation energy and enthusiasm and stimulate the initiative and responsibility of regional innovation entities to help organizations achieve specific innovation goals, then realizing the sustainable social and economic development of regions. In addition, the culture can establish positive concepts of regional innovation, promote the production and diffusion of knowledge, and cultivate spirit of innovation, entrepreneurship, openness, and inclusiveness, ultimately increasing the regional innovation index. Regions with a higher innovation index are bound to have more innovation carriers, support more enterprises to carry out R&D activities, encourage more entrepreneurial business behavior, and promote inter-regional openness and cooperation. At the same time, the more enthusiastic the regional innovation activities are, the higher the efficiency of the innovation output is, and the higher the regional innovation index is. The catalytic subsystem of innovation culture is shown in Figure 3.

3.1.4. Innovation Policy-Guided Subsystem and Causality Diagram

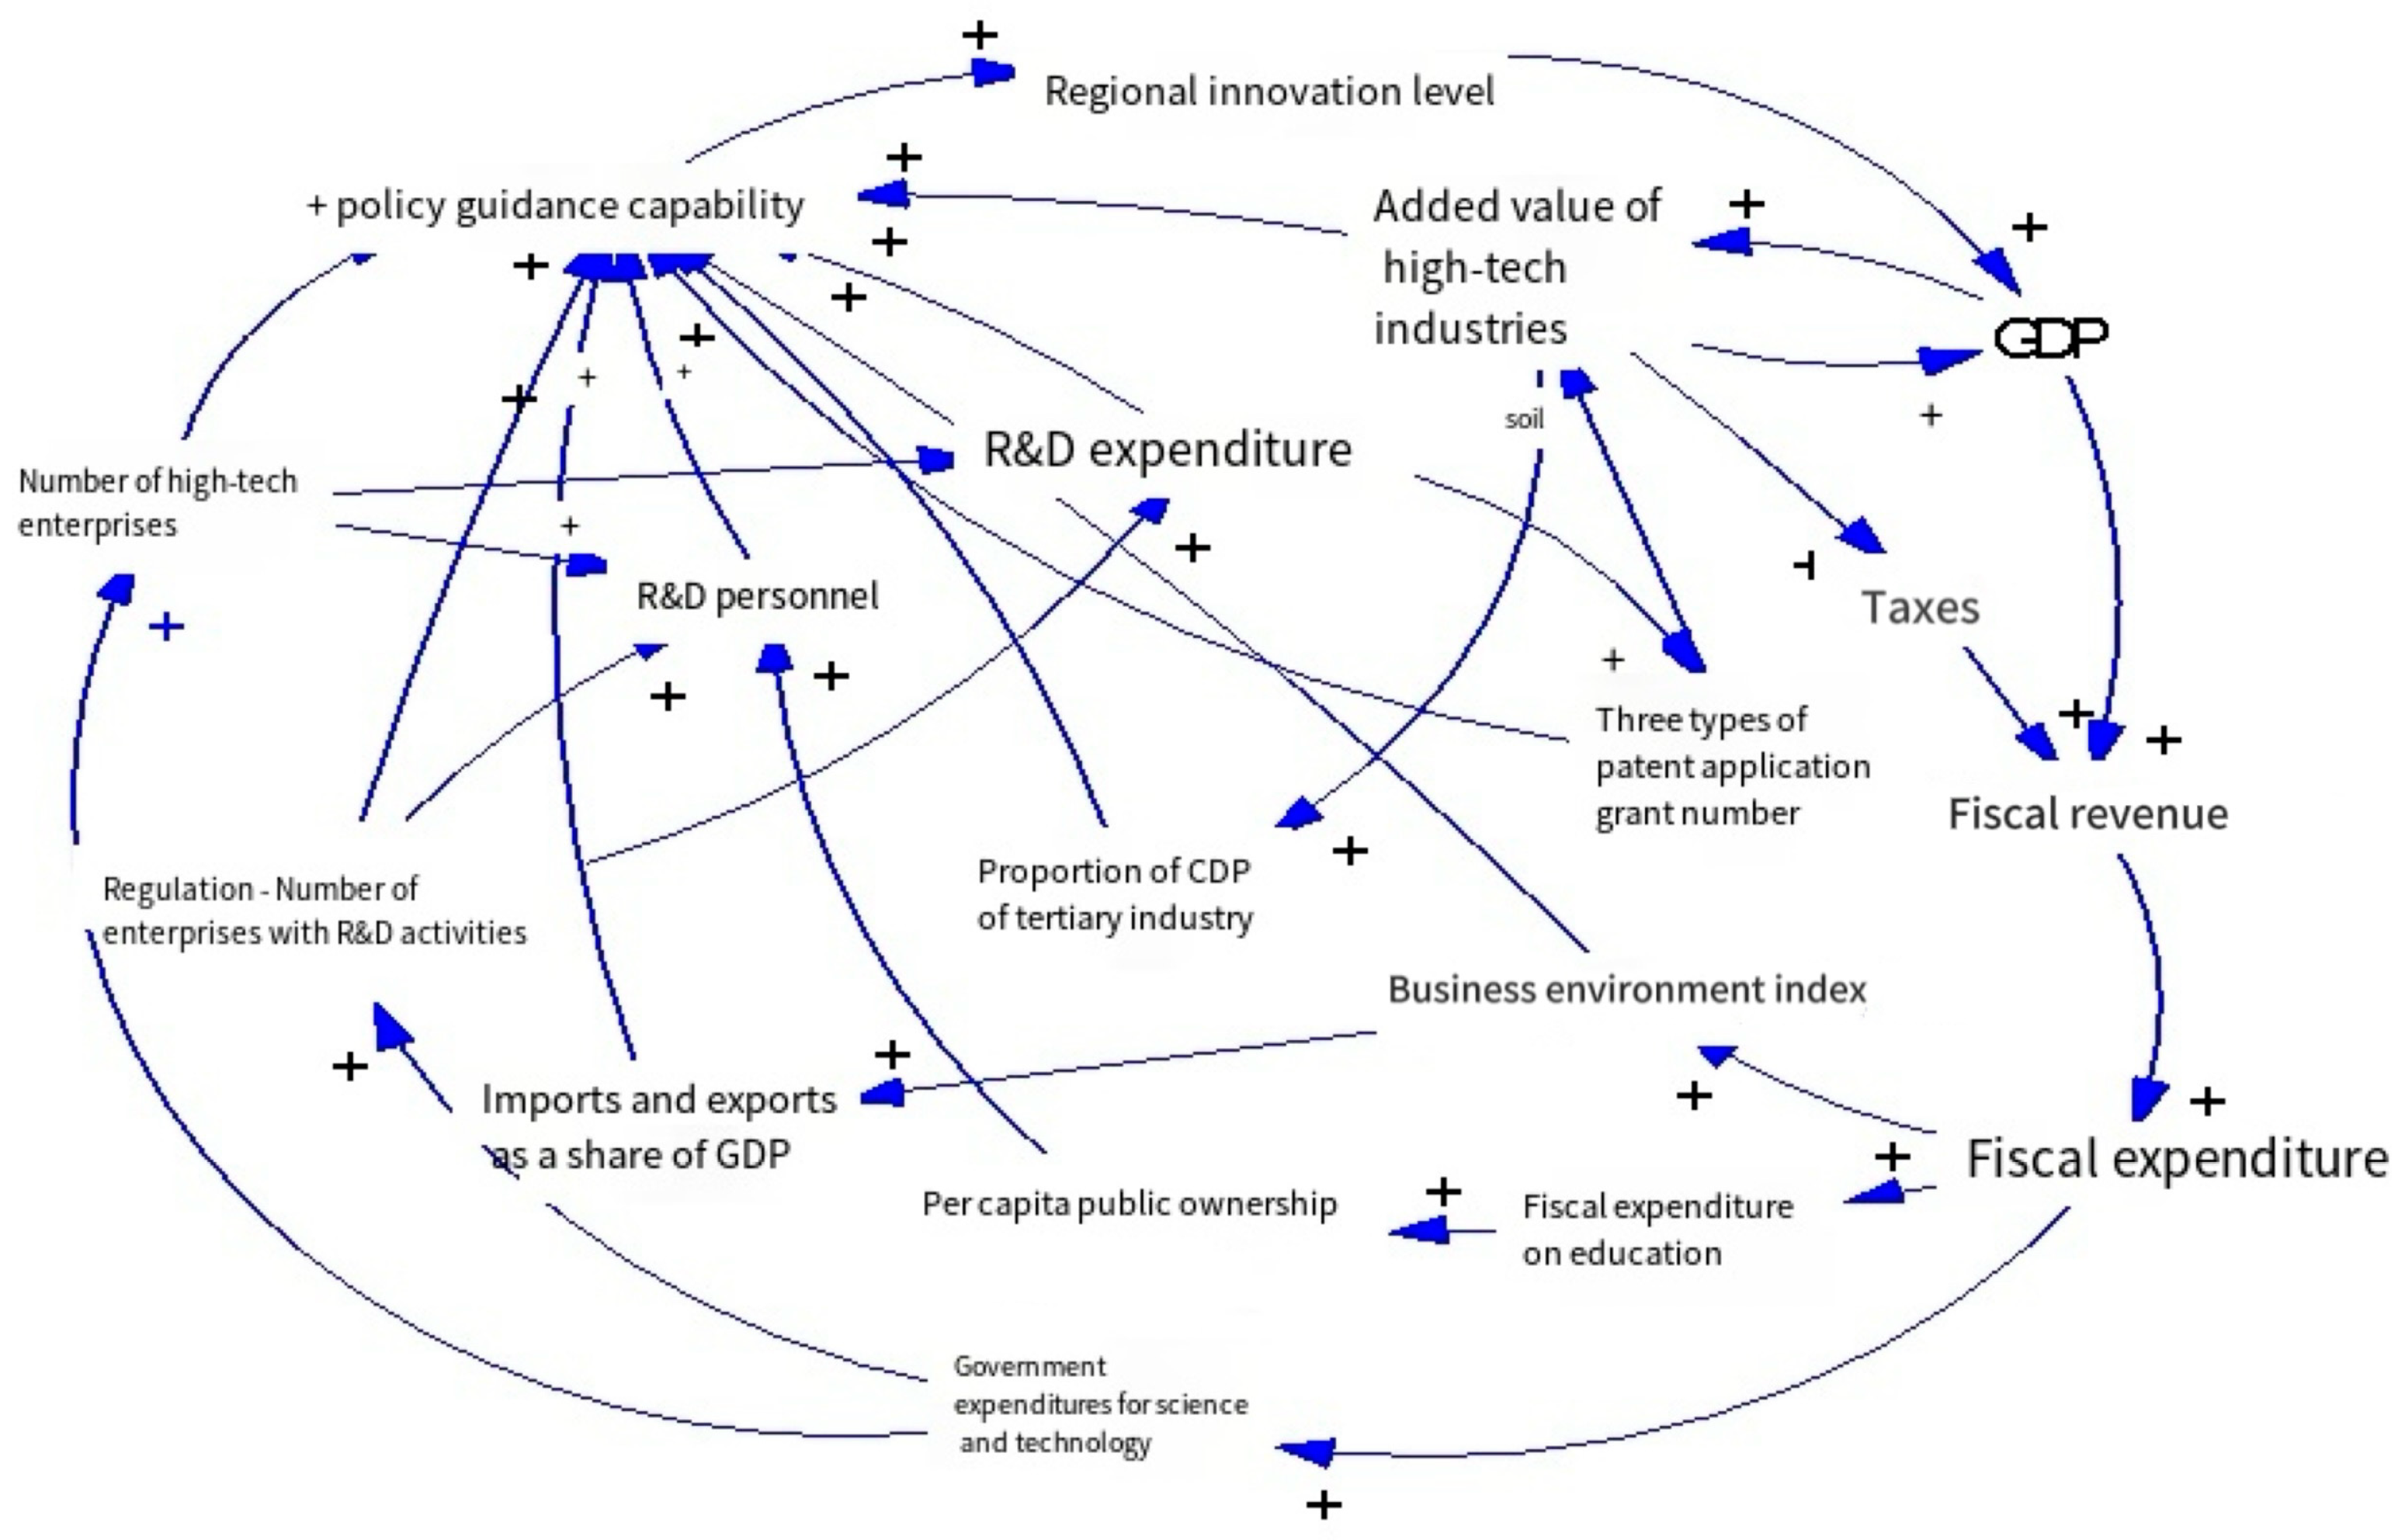
The innovation policy-guided subsystem has a significant impact on the state of regional innovation and potential innovation capability from the perspectives of awareness cultivation, policy guidance, resource domination, and others. The government’s emphasis on regional innovation is reflected in the introduction of major guidance policies, which directly influences regional R&D investment, innovation environment, infrastructure, etc., further affecting regional innovation output. And the contribution of innovation output in economic growth will strengthen the government’s emphasis, and more policies will be introduced for regional innovation; if the cycle is repeated, a causal feedback mechanism of innovation policy guidance will be established the regional innovation system. The innovation policy guidance subsystem is shown in Figure 4.

3.1.5. Causality Diagram of Regional Innovation Development System

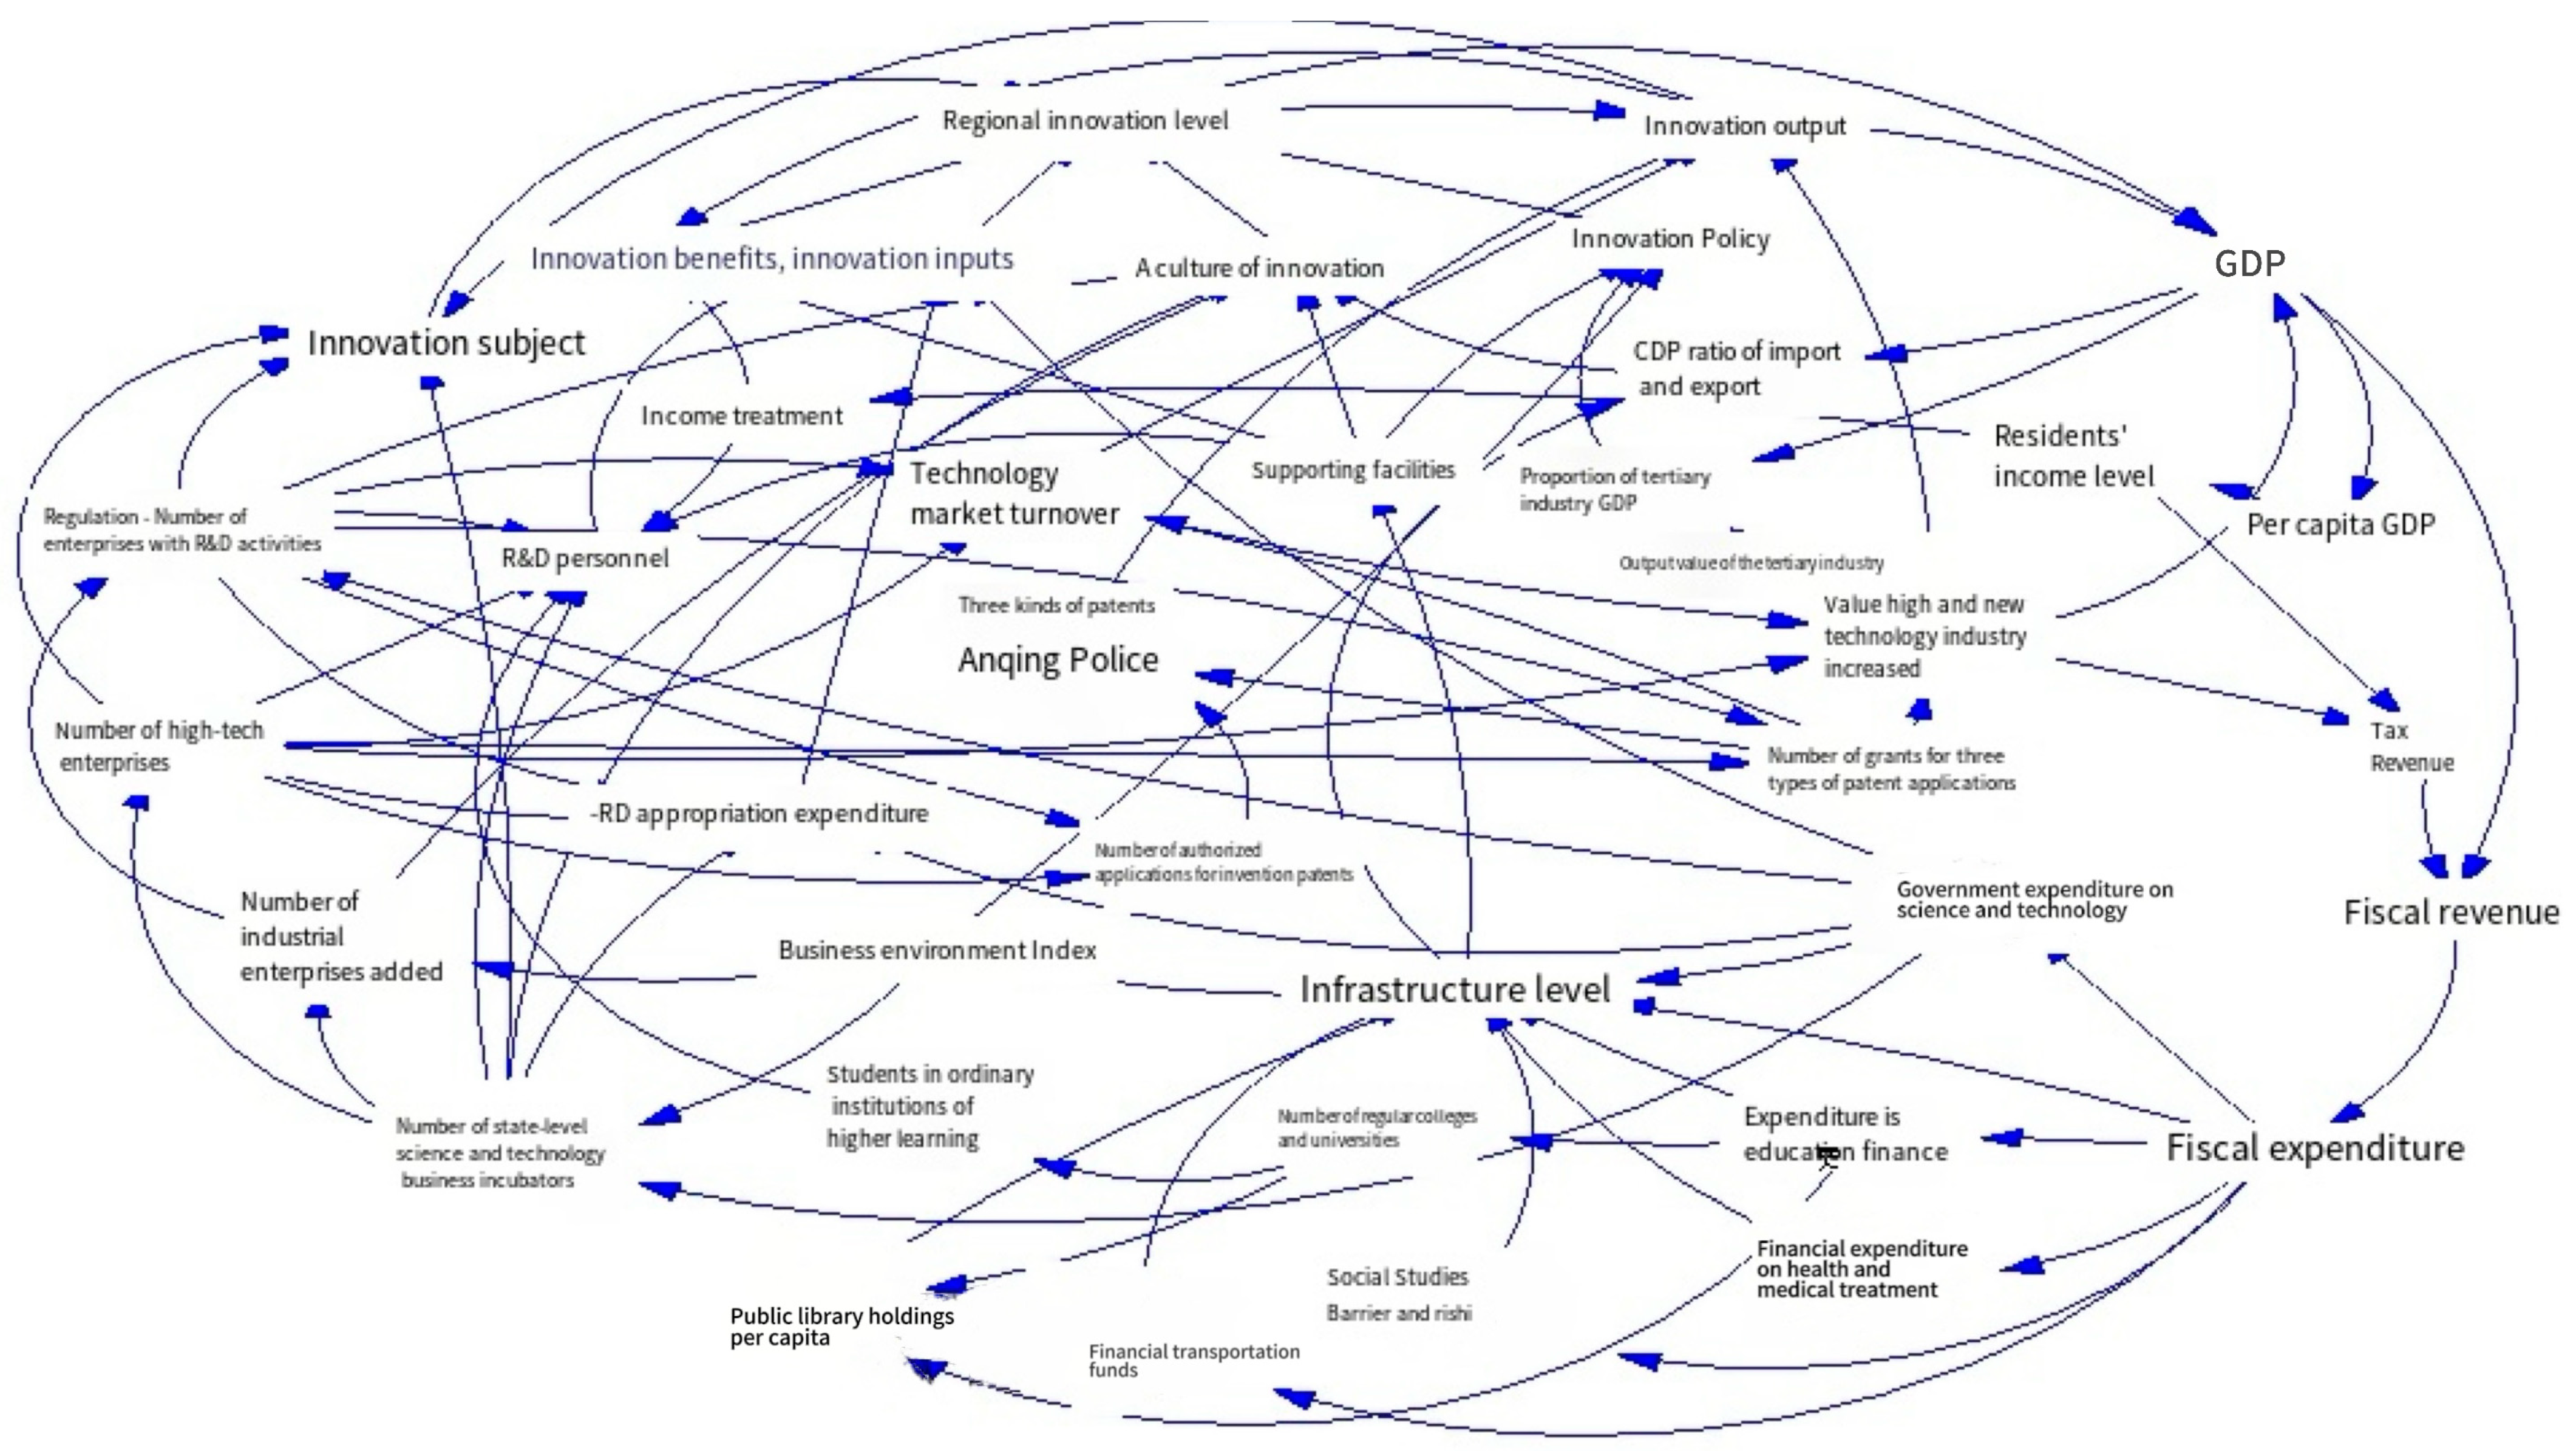
In the causality analysis of factors in the innovation-driven development system, the causality of factors of subsystems are analyzed in different stages and comprehensive consideration are given according to their roles in the whole system. Thus, the causality diagram of an innovation-driven development system has been constructed, as shown in the Figure 5.

3.2. System Flowchart and Parametric Equation

3.2.1. System Flowchart and Variables

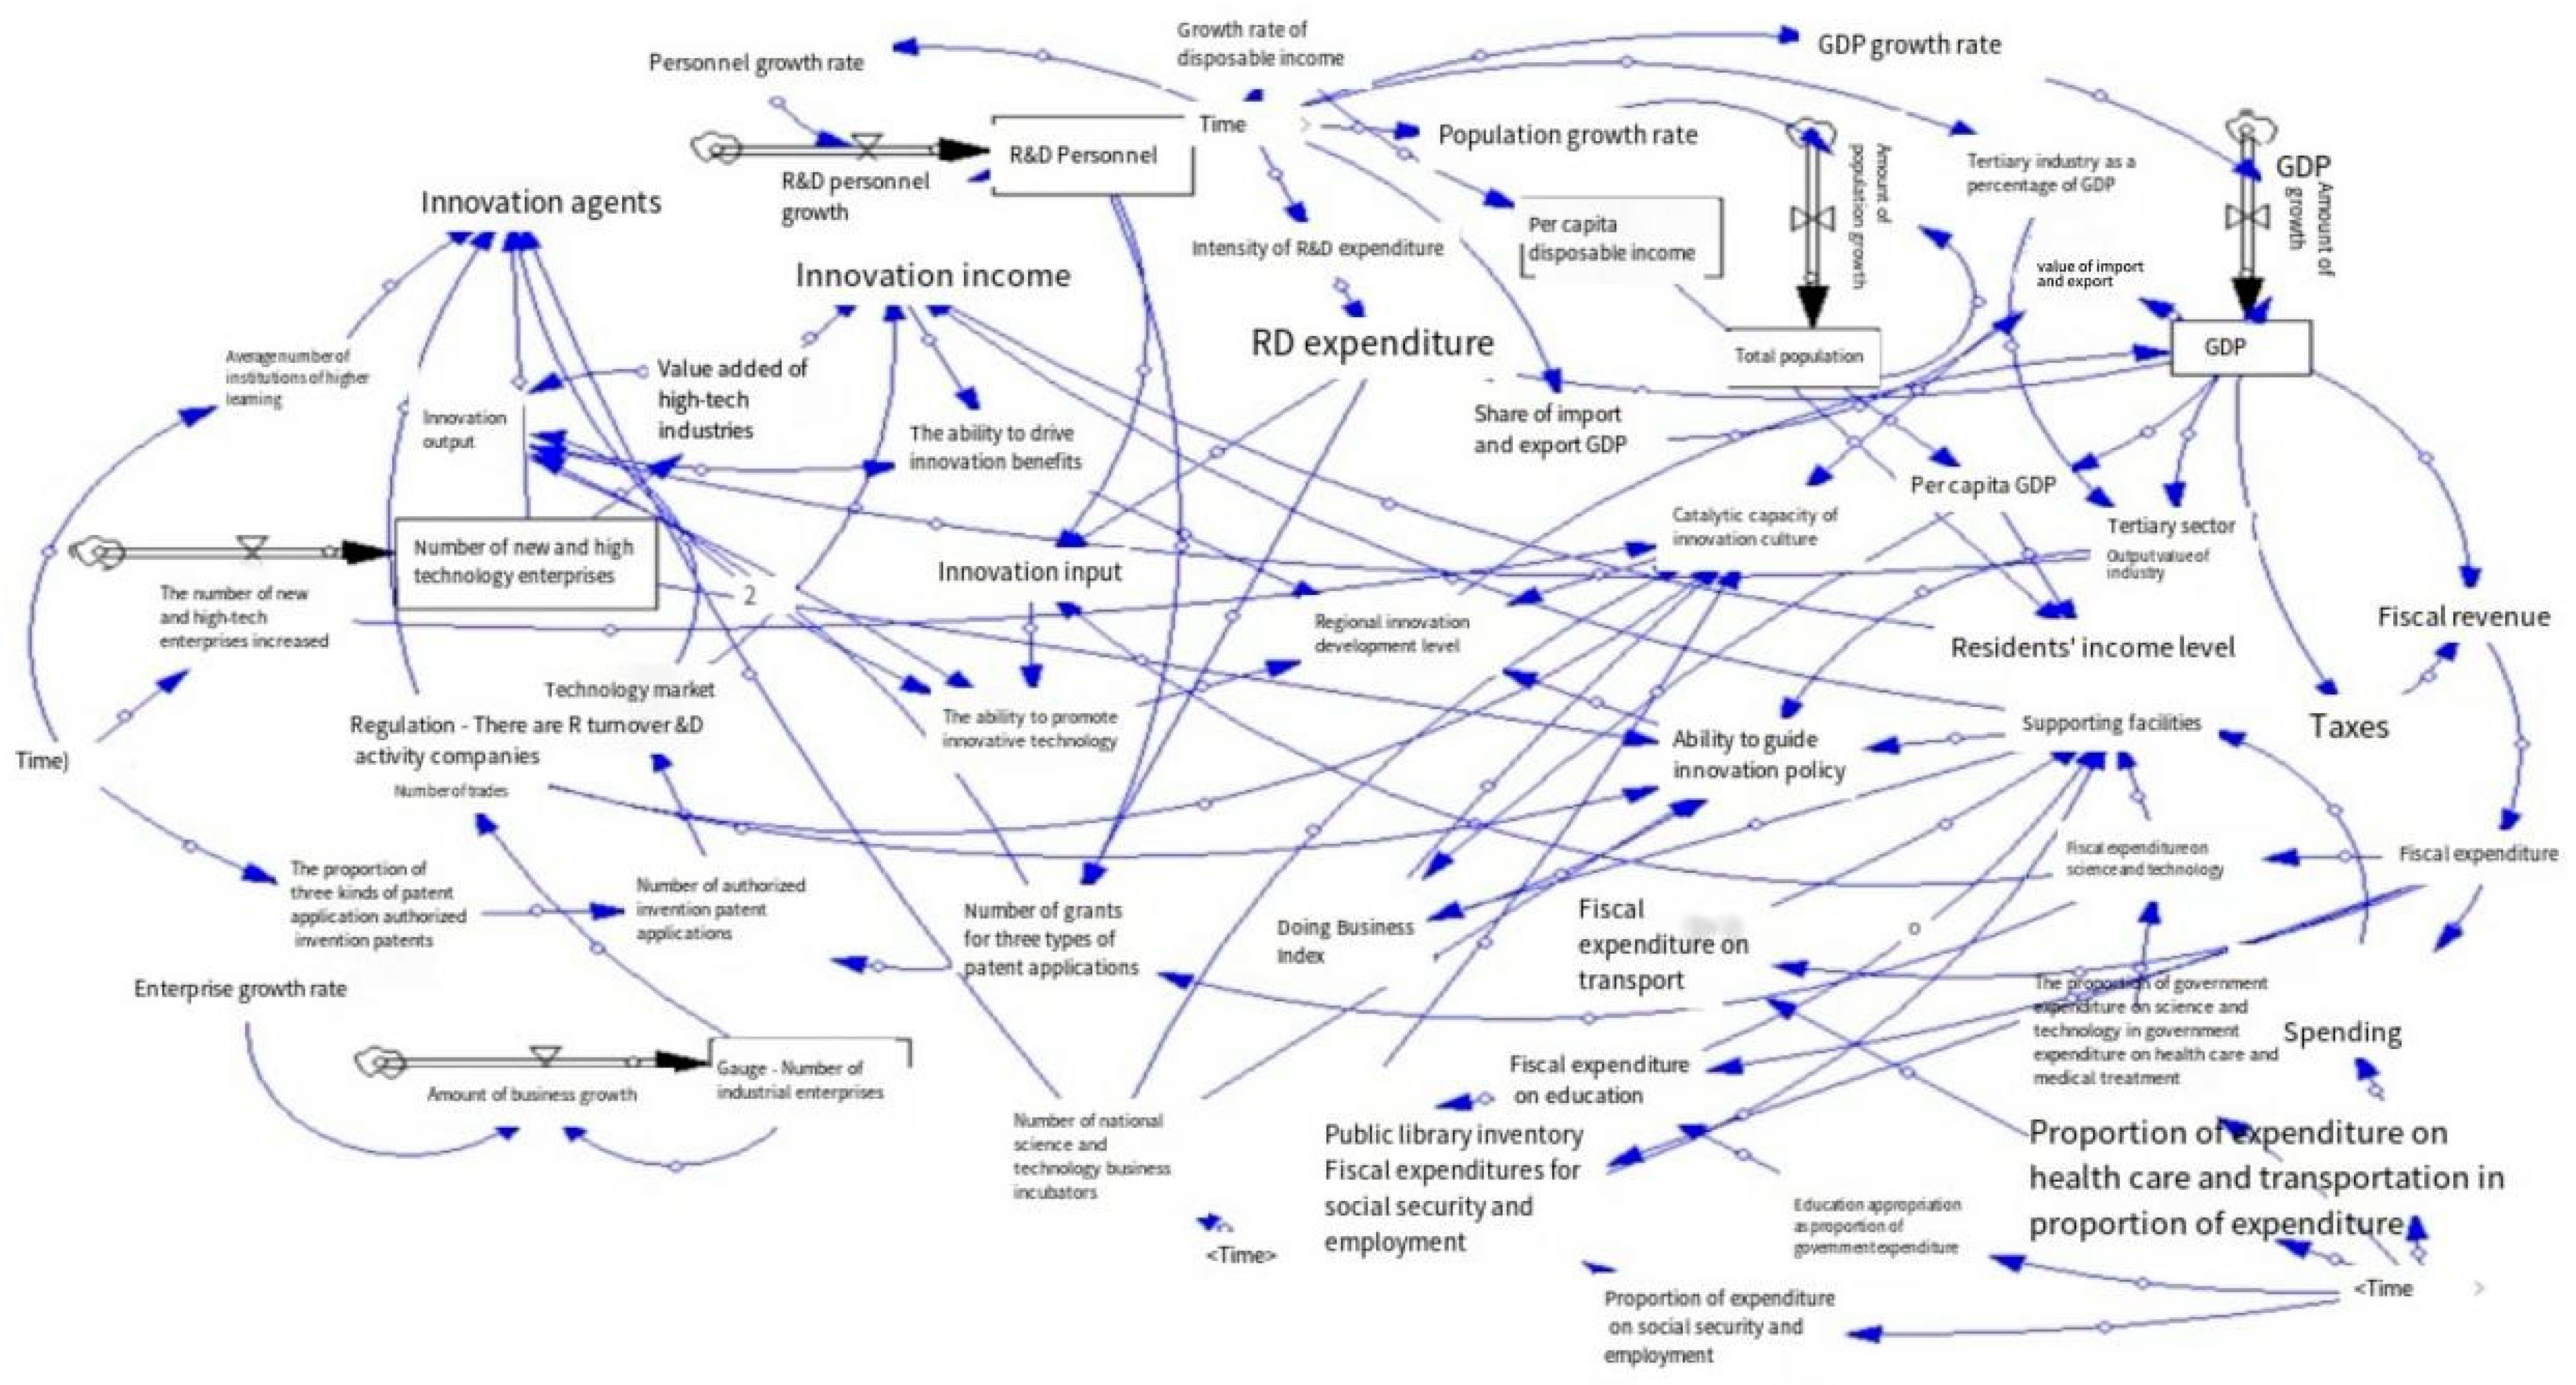
The system flowchart of regional innovation development contains four major modules, namely, benefit-driven, technology-pushed, culture-catalyzed, and policy-guided, all of which have their own factors that are expressed by different variables in the flowchart. Innovation can increase return to boost economic growth, laying a solid foundation for further regional innovation development. The system flowchart and the specific variables are represented in the following Figure 6 and Table 2.
Through the system dynamics flowchart of regional innovation development system, each variable, the type, and unit are clear to see in the Table 2.

3.2.2. Parametric Equation

The research object is the evolution trends of innovation development influenced by innovation benefit, technological innovation, innovation culture, and innovation policy based on regional differences. The software of Vesim-PLE 10.0 is used to simulate the situation of the whole system between 2014 and 2033. And the majority of the data involved are from China Statistical Yearbook of 2014–2021 which can be found at https://www.stats.gov.cn/sj/ndsj/ (accessed on 3 June 2024), and some are from the China Statistical Yearbook on Science and Technology of 2014–2021 which can be found at https://www.zgtjnj.org/navipage-n3018021902000118.html (accessed on 3 June 2024). Wuhan and Enshi in Hubei Province are regarded as the representatives of central city and non-central city, respectively, in this paper. The relative data of the two cities can be found at https://tjj.hubei.gov.cn/tjsj/sjkscx/tjnj/qstjnj/ (accessed on 3 June 2024). In view of the availability of data, the data of 2014–2019 are used for fitting, and the data of 2020 and 2021 are used to test the objective reality of the model. In doing so, the simulation analysis of the relationship can be conducted between innovation development and innovation benefit, technological innovation, innovation culture, and innovation policy during the period of 2014–2033. The main equations of the system variables are as follows, and the completed equations can be found in the Supplementary Materials.
1. Central city model parameters
(01) INITIAL TIME = 2014
(02) FINAL TIME = 2033
(03) GDP = INTEG (GDP growth, 1.00259 × 10⁸)
(04) GDP growth rate = WITH LOOKUP (Time, ([(2014, −0.2)–(2033, 1)], (2014, 0.052), (2015, 0.0933), (2016, 0.1352), (2017, 0.1404), (2018, 0.0867), (2019, −0.0436), (2020, 0.1418), (2021, 0.0649), (2022, 0.05)))
(05) GDP growth = GDP growth rate * GDP
……
2. Non-central city model parameters
(01) INITIAL TIME = 2014
(02) FINAL TIME = 2033
(03) GDP = NTEG (GDP growth, 1.29727 × 10⁷)
(04) GDP growth rate = WITH LOOKUP (Time, ([(2014, −0.2)–(2033, 10)], (2014, 0.060319), (2015, 0.0992643), (2016, 0.0961734), (2017, 0.133751), (2018. 0.0822704), (2019, −0.0774276), (2020, 0.130342), (2021, 0.0377677), (2022, 0.07031))))
(05) GDP growth = GDP × GDP growth rate
……

4. Simulation Analysis of System Model

4.1. Prediction Analysis of System Index

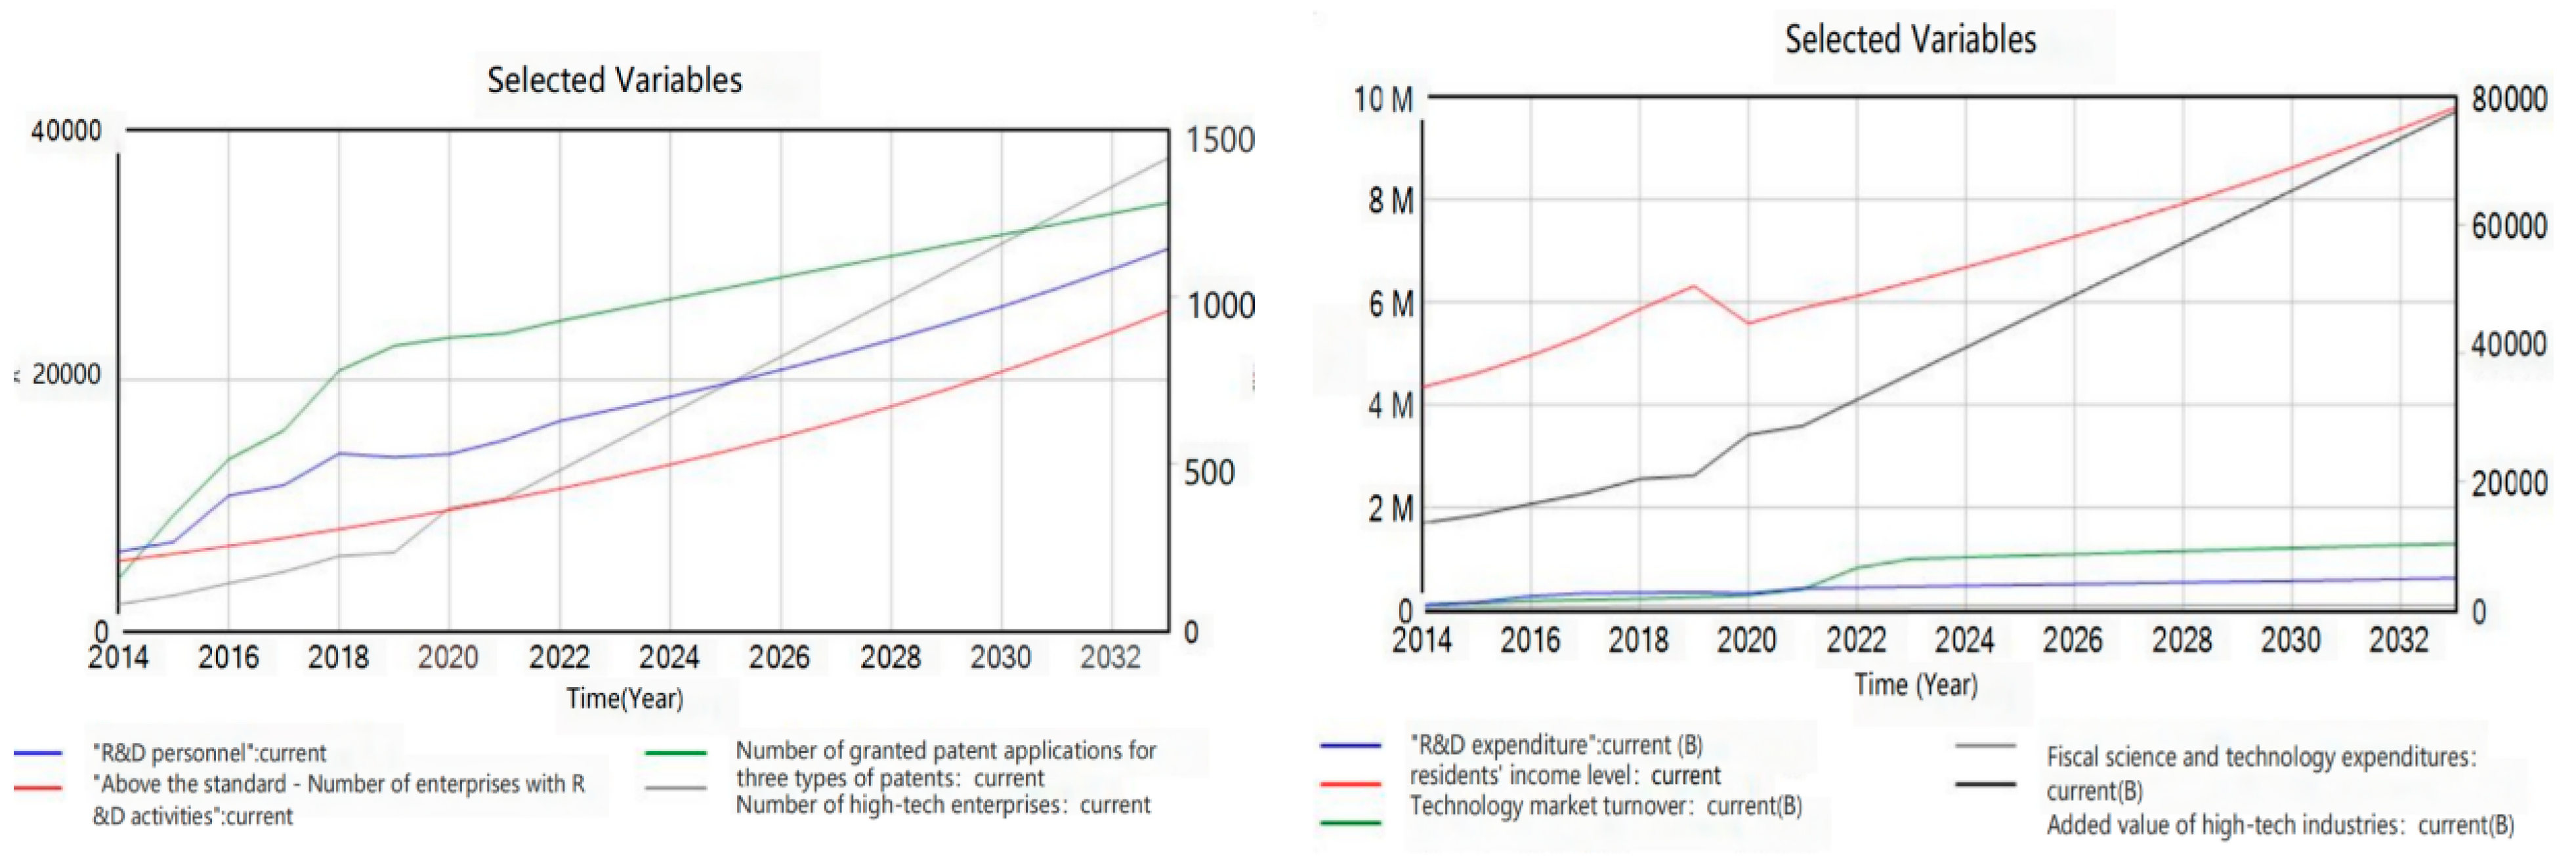
In the simulation of the basic behavior of the system, it starts the simulation run in accordance with initial setup. The values of all factors are consistent with the current policy, and the basic parameters of the model are kept unchanged. The following running results are obtained from the simulation of the central city and non-central city from the four aspects of innovation benefit, technological innovation, innovation culture, and innovation policy.

4.1.1. Prediction Results of Major Indicators of Innovation System in Central City

From Figure 7, it can be seen that each major indicator of the central city in the regional innovation development system shows a growing trend as time goes on. From the simulation results, in terms of innovation entities, the investment in innovation by all sectors of society is also on the increase as the concept of innovation-driven development continues to improve. Sufficient talent support and financial security lay a solid foundation for the smooth progress of innovation-driven development. The advanced economic development ensures a favorable economic environment for innovation-driven development.

4.1.2. Forecast of Major Indicators of Innovation System in Non-Central City

Based on the differences in regional innovation, each major indicator of an innovation system performs differently in central city and non-central city. Figure 8 shows the prediction of major indicators of a regional innovation development system in a non-central city. According to the running situation of the existing model, major industrial firms with R&D activities and high-tech companies are the important social innovation entities in the non-central city and their number are on the increase based on the trend of simulation running. With the in-depth implementation of the innovation-driven development strategy, the non-central cities are investing more and more in innovation, which shows that our society has been paying more and more attention to investment innovation. In terms of innovation output and transformation, the total amount of patent authorization, the turnover of technology contracts, and the added value of high-tech industry in the non-central city have increased by 703.46%, 1424.23%, and 570.66%, respectively. All these show that innovation output and transformation have been greatly improved, owing to the joint efforts of the government and all sectors of the society. Ultimately, the continuous improvement of the innovation-driven development will also promote the regional socio-economic growth.
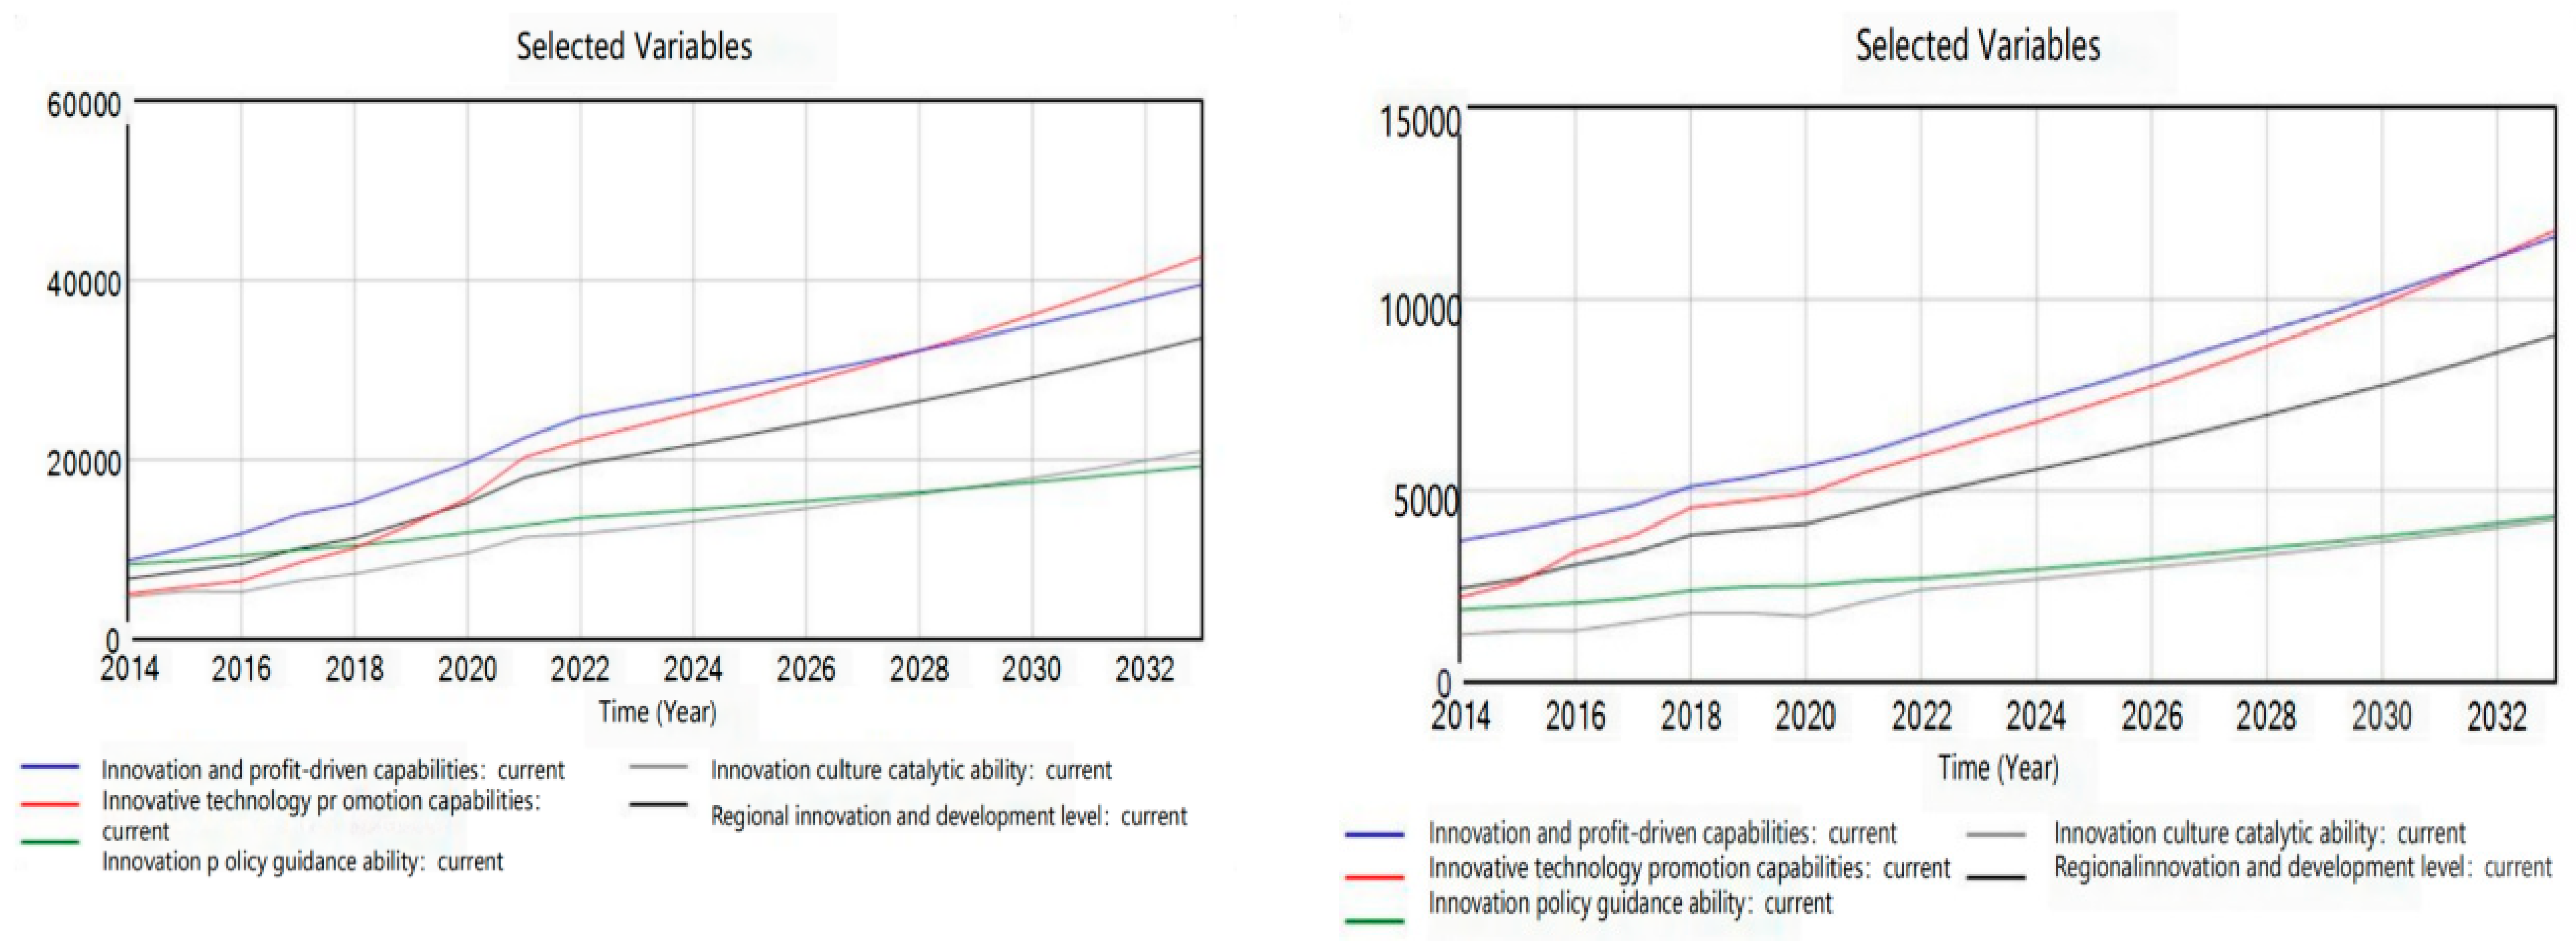
Overall, central cities and non-central cities have been showing a divergent trend in the details of regional innovation development. As shown in visualization Figure 9 above, in both the central and non-central cities, China’s regional innovation-driven development will keep growing, according to the analysis of the present development trend of innovation benefit, technological innovation, innovation culture, and innovation policy. However, the innovation policy-guided capability and innovation culture-catalyzed capability are weaker than the innovation benefit-driven capability and technological innovation-pushed capability, which is more obvious in the non-central city.
In the late stage of system simulation, the growth rate of technological innovation-pushed capability is faster than that of innovation benefit-driven capability. In central cities, the latter will exceed the former around 2028, while the two have been approaching in the non-central city.

4.2. Analysis of System Simulation Results

In essence, the analysis of how to drive development by regional innovation is based on the model of system dynamics. The operation of the system is simulated through the change of parameters. In doing so, some references will be provided for decision-making. Therefore, it is necessary to select some variables for simulation in the established system dynamics model targeted at regional innovation-driven development. All these are to realize the regional innovation-driven development and promote its healthy and sustainable economic development. Considering the purpose of modeling and the limitations of the objective conditions, the development of the scenario is assumed to start from 2014 and end in 2022. The plans are designed on the basis of the previous research of regional innovation sub-systems, and some key elements are selected as variables in each subsystem. A total of 12 variables are selected, including the growth rate of R&D personnel, the intensity of R&D expenditure, government expenditure on science and technology, supporting facilities, high-tech company growth, the growth rate of major industrial enterprises, the proportion of invention patent authorization, government expenditure on education, the proportion of import and export volume in GDP, the number of incubators of tech companies, resident income, the proportion of tertiary industry, etc. Paths are designed by varying the control variables to carry out the simulation of different paths. In addition, this study adopts a 20% change ratio for better simulation results, which does not affect the correctness of the trend of policy making. The results are as follows.

4.2.1. Simulation of Innovation Benefit-Driven Elements

(1) Improve innovative economic environment and increase resident income
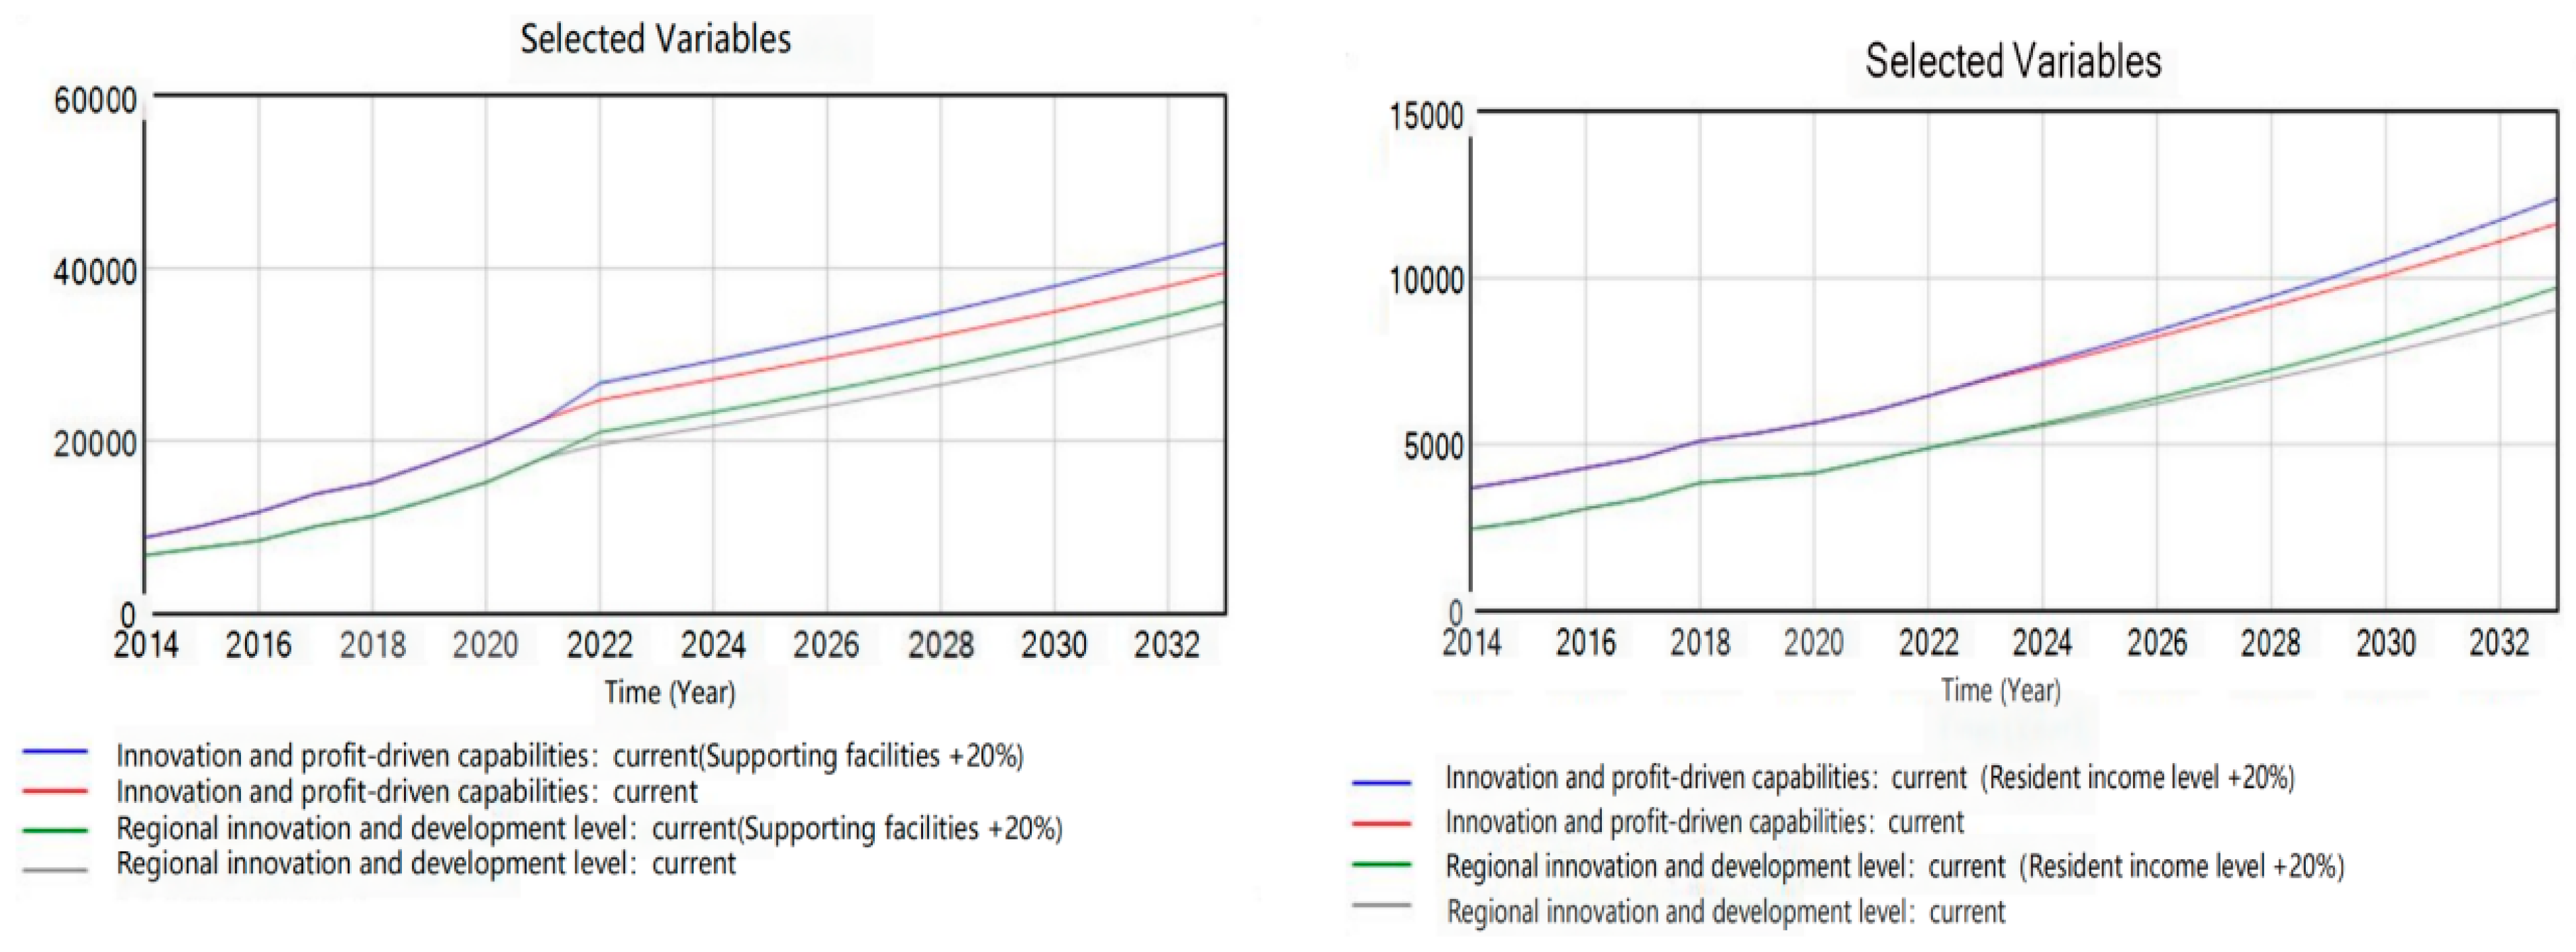
It is assumed that the government has been committed to improving the city’s economic environment since 2023, and the resident income grows further. From 2023 onwards, the resident income will be increased by 20%. That is to say, the growth rate of GDP and personal disposable income will increase by 20% simultaneously. The simulation results of innovation benefit-driven capability and regional innovation-driven development are shown in Figure 10. The increase in resident income attracts and retains more innovative talent by satisfying their salary expectations, and provide a broader consumer market for enterprises, which will stimulate enterprises to conduct rapid innovation to increase the number of innovation products and innovation output value. Thus, the simulation results of innovation benefit-driven capability and regional innovation-driven development are improved.
(2) Improve Innovation Supporting Facilities and Strengthen Social Infrastructure
Sound supporting facilities can drive regional innovation development. Excellent infrastructure not only facilitates the life of residents, but also promotes inter-regional innovation cooperation and enhances the capability of regional innovation development. From 2022 onwards, the investment in supporting facilities is increased by 20%, and the simulation results of innovation benefit-driven capability and regional innovation-driven development are shown in Figure 11. The investment in supporting facilities directly determines the development of regional infrastructure, influencing the residents’ life satisfaction in the local area and companies’ development needs for external environment, then exerting impacts on regional innovation.

4.2.2. Simulation of Technological Innovation-Driven Factors

(1) Enhance Regional Innovation Strength and Increase the Proportion of Invention Patent Authorization
The number of invention patents is the symbol of an organization’s innovation capability and core competitiveness. Also, with significant commercial value, the patents are important intangible assets of enterprises or individuals, which can bring sound economic benefits, assuming that the investment in invention patents will be increased from 2022 to enhance the proportion of invention patents in regional patent application authorization. The simulation results are shown in Figure 12 if the proportion of invention patents authorized is to increase by 20% from 2022. Based on the value of the simulation in 2033, in the central city, the annual technological innovation-driven capability increases by about 4.11%, innovation benefit-driven capability by about 3.41%, and regional innovation-driven development by about 5.9%; in the non-central city, the figures are 8.72%, 3.33%, and 5.2%, respectively.
(2) Enhance Social R&D Capability and Strengthen R&D Investment
Enterprise selects enterprise R&D investment as the variable, which can influence the output of technological innovation through R&D personnel and expenditures, and directly drive innovation. From 2022 onwards, the variables of enterprise R&D personnel and expenditure input will increase by 20%, and the simulation results are shown in Figure 13 and Figure 14. They clearly show that the increase in enterprise R&D expenditure can obviously enhance technological innovation-driven capability and innovation development.
(3) Cultivate Innovation Entities and Increase Number of Innovative Enterprises
Colleges and research institutions do not play a significant role in capital investment, while innovation enterprises are the most important innovation entities of the society. Therefore, the number of high-tech companies and major industrial firms are chosen as control variables. The aim is to study whether the annual high-tech company growth and the growth rate of major industrial firms can influence technological innovation-pushed capability and regional innovation development, assuming that the government strengthens efforts to cultivate more innovative enterprises, and the number of high-tech enterprises and major industrial firms witnesses a significant increase. The simulation results are shown in Figure 15 and Figure 16 while the number of high-tech company growth and the growth rate of major industrial firms are set to increase by 20% from 2022.

4.2.3. Simulation of Innovation Culture-Catalyzed Factors

(1) Improve Innovation Facilities and Increase Number of Incubators of Tech-companies
High-tech business incubators (also known as high-tech entrepreneurship service centers, hereinafter referred to as entrepreneurship centers) are high-tech entrepreneurship service institutions aiming to promote the transformation of scientific and technological achievements and cultivate high-tech enterprises and entrepreneurs. The number of entrepreneurship centers can not only show the cultural atmosphere of local innovation and entrepreneurship, but also provide endless new innovation entities for social development, assuming that the construction efforts of high-tech business incubators are strengthened from 2022 to increase the number of regional high-tech business incubators by 20%. The simulation results are shown in Figure 17.
(2) Strengthen Exchanges between Internal and External Industries and Increase Regional Import and Export Volume
Import and export development will drive the development of domestic related industries through the industrial chains and strengthen the exchanges between internal and external industries within the region, giving full play to the driving effect of foreign trade on the construction of local modernized industrial system. By observing the proportion of regional import and export volume, the correlation degree between internal and external industries can be measured to analyze the admission and cooperation of local industries for external industries, assuming that from 2022, the cooperation with external industries will be strengthened, and the proportion of import and export in regional GDP is to increase by 20%. The simulation results are shown in Figure 18.
(3) Enhance Education Cause and Strengthen Support for Education
It is assumed that the government will pay more attention to education and increase education expenditure. From 2022, the proportion of education expenditure in the fiscal expenditure will increase by 20%, and the simulation results of innovation benefit-driven capability and regional innovation development are shown in Figure 19.

4.2.4. Simulation of Innovation Policy-Guided Factors

(1) Improve Government Support for Innovation and Increase Fiscal Expenditure on Science and Technology
The government selects government expenditure on science and technology as the variable because it may drive R&D investment to influence regional innovation development. From 2022 onwards, the government invests more in innovation funds, and will increase expenditure on science and technology by 20%. Figure 20 shows that the increase in government expenditure on science and technology can obviously improve the number of innovation achievements and innovation output value.
(2) Optimize Innovation Industrial Structure and Increase Share of Tertiary Industry
The tertiary industry is an important part of the service sectors in the national economy, and increasing the proportion of the tertiary industry can effectively promote regional urban modernization to a certain degree. Moreover, people’s life becomes more comfortable and convenient, and social development and innovation capacity are improved. It is set that from 2022, the share of the tertiary industry in GNP will be increased by 20%, and the simulation results are shown in Figure 21.

4.2.5. Comprehensive Analysis

Comprehensive analysis is conducted to compare the simulation results of the key variables selected from the following four aspects: innovation benefit-driven factor, technological innovation-pushed factor, innovation culture-catalyzed factor, and innovation policy-guided factor, which is shown in Table 3. We design different paths based on the changes of key factors in 2022, and rank the simulation results in 2033 from high to low, for the central city, the growth rate of major industrial firms, resident income, the proportion of invention patent authorization, the growth of high-tech enterprises, supporting facilities, the number of high-tech business incubators, the intensity of R&D expenditure, the growth rate of R&D personnel, government expenditure on science and technology, the proportion of the tertiary industry, the proportion of import and export value in GDP, and government expenditure on education. And for the non-central city, the intensity of R&D expenditure, the growth of high-tech enterprises, the growth rate of major industrial firms, supporting facilities, resident income, the growth rate of R&D personnel, the proportion of the tertiary industry, the proportion of invention patent authorization, the number of high-tech business incubators, government expenditure on science and technology, the proportion of import and export value in GDP, and government expenditure on education. The visualization figures are shown in Figure 22.

5. Conclusions and Recommendations

Based on system dynamics, a dynamic system was constructed in simulation to study the dualization effect of regional innovation development. We explored the development of regional innovative outcomes and economic effects in different paths of varied innovation factors. According to the simulation results, the factors of innovation benefit and technological innovation are still the most fundamental ones for innovative development in both central and non-central cities. For central cities, the focus should be shifted to optimize the structure and efficiency of R&D personnel and expenditure allocation, along with cultivating key innovation entities, improving the return of innovative talent and strengthening the quality of innovative outcomes. On the other hand, non-central cities should focus more on the accumulation of innovation factors, and the increase in innovation capital investment and the number of innovation entities are still the most crucial aspects for enhanced regional innovation development.
Through the quantification and systematic simulation of the dualization symptoms of regional innovation development, optimization paths are proposed to shed light on solving the dualization of regional innovation development. In ideas and thinking, we should promote the efficient flow of talent resources across regions, value talent, coordinate industrial deployment, and realize the integration of industrial chains and value chains; in systematic and mechanical innovation, attention should be paid to cultivate innovation entities in non-central cities, and enhance the innovation vitality of enterprises; in innovation resources allocation, we should strengthen the infrastructure of regional innovation, and shore up the basis of regional innovation development, and the government should appropriately tilt human and material resources to non-central cities for improved regional innovation; in talent aggregation, we should vigorously attract innovation talent from all dimensions and improve the attractiveness of non-central cities; in sharing platforms, we should promote the in-depth integration of sharing platforms and innovative business, make good use of the features of sharing platforms, such as wide coverage, flexibility and efficiency, to promote the establishment of innovation sharing platforms and raise resources for the public to engage in innovation activities; in ecological systems, we should set up reasonable transfer delivery rate and special key funds should be set up to increase the innovation initiative of businesses; in culture, it is important to cultivate regional innovative culture and build an open and inclusive innovation environment.

Supplementary Materials

The following supporting information can be downloaded at: https://www.mdpi.com/article/10.3390/su16114869/s1, The main equations of the system variables.

Author Contributions

Conceptualization, R.H. and J.X.; methodology, B.Z.; software, W.P.; validation, R.H. and B.Z.; formal analysis, J.X.; investigation, W.P.; resources, H.D.; data curation, B.Z.; writing—original draft preparation, J.X.; writing—review and editing, J.X. and W.P.; visualization, R.H. and B.Z.; super vision, B.Z.; project administration, H.D.; funding acquisition, J.X. All authors have read and agreed to the published version of the manuscript.

Funding

This research was funded by the Program of National Social Science Planning Foundation, Grant number [20BJY038].

Institutional Review Board Statement

Not applicable.

Informed Consent Statement

Informed consent was obtained from all subjects involved in the study, and written consent was obtained from the patients to publish this paper.

Data Availability Statement

The data presented in this study are available on request from the corresponding author.

Conflicts of Interest

The authors declare that they have no conflict of interest.

References

  1. Freeman, C. Technology and Economic Performance: Lessons from Japan; Pinter Publishers: London, UK, 1987. [Google Scholar]
  2. Lundvall, B.A. National Systems of Innovation: Toward a Theory of Innovation and Interactive Learning; Anthem Press: London, UK, 2010. [Google Scholar]
  3. Nelson, R.R. National Innovation Systems: A Comparative Analysis; University of Illinois at Urbana-Champaign’s Academy for Entrepreneurial Leadership Historical Research Reference in Entrepreneurship; Oxford University Press: Cary, NC, USA, 1993. [Google Scholar]
  4. Huang, L. Approach to the Main Content of Regional innovation System. Sci. Res. Manag. 2000, 21, 43–48. [Google Scholar]
  5. Ren, S.; Tao, G. The Research on Connotation and Analysis Frame of Regional Innovation System. Soft Sci. 2006, 20, 90–94. [Google Scholar]
  6. Wang, L. The Evolution Research of Regional Innovation System Based on the Self-Organization Theory. Sci. Sci. Manag. S T 2010, 31, 128–132. [Google Scholar]
  7. Wang, S.; Hu, S.; Mou, R. Origins and Framework of Regional Innovation System Theory. Stud. Sci. Sci. 2013, 31, 344–349+436. [Google Scholar]
  8. Su, Y.; Jiang, X.S.; Lei, J.S.; Lin, Z. Research on Collaborative Evolution of Regional Innovation System. China Soft Sci. Mag. 2016, 3, 44–61. [Google Scholar]
  9. Li, X. The transformation of dual economic structure and regional economic development in the spatio-temporal view of regional economy. Econ. Rev. 2007, 3, 94–102. [Google Scholar]
  10. Li, C.; Nie, Y. Research on the ideas and countermeasures to crack the dual economic structure of urban and rural areas. Stat. Manag. 2014, 12, 44–46. [Google Scholar]
  11. Gao, W.; Xu, M.; Fan, J.; Long, Y. An empirical analysis of the impact of economic development and urban-rural dualization on the income gap between urban and rural residents. Stat. Decis. 2018, 34, 147–150. [Google Scholar]
  12. Zhou, Y.; Chen, J.; Lu, S. The impact of ICT industry technology transfer on regional dual innovation capabilities. Geogr. Geo-Inf. Sci. 2020, 36, 55–63. [Google Scholar]
  13. Zhu, Y.; Deng, J.; Jiang, H.; Ma, R.; Shang, L. Research on the spillover effect of green economy of regional collaborative innovation in Beijing-Tianjin-Hebei urban agglomeration. Stat. Theory Pract. 2022, 12, 20–27. [Google Scholar] [CrossRef]
  14. Huang, X.; Zong, S.; Lin, Y. Regional differences in the development of green finance and its innovation effects. Stat. Decis. 2022, 38, 139–142. [Google Scholar]
  15. Bai, Y.; Zhao, H. Evaluation of innovation spillover effect and its spatiotemporal evolution in Yangtze River Delta urban agglomeration. Sci. Technol. Manag. Res. 2023, 43, 79–88. [Google Scholar]
  16. Li, Z.; Liu, J. Research on the evaluation of regional innovation ecosystem in Beijing-Tianjin-Hebei urban agglomeration under the background of digitalization. China Soft Sci. 2024, 191–202. [Google Scholar]
  17. Fang, D.; Wang, L. Research on the multi-configuration path and driving effect of regional innovation in China. Reg. Econ. Rev. 2024, 1, 78–87. [Google Scholar]
  18. Fang, D.; Wang, L. Research on the spatial correlation characteristics and effects of China’s regional innovation ability. Dev. Res. 2024, 1, 12–22. [Google Scholar]
  19. Xue, Y.; Hu, L.; Liu, H.; Li, D. Construction of system dynamics simulation model for urbanization quality improvement in Beijing-Tianjin-Hebei urban agglomeration. Stat. Decis. 2021, 37, 185–188. [Google Scholar]
  20. Zhao, D.; Wang, Q. Simulation evaluation and prediction of system dynamics of economic green competitiveness in Gansu Province. Sci. Technol. Manag. Res. 2020, 40, 206–215. [Google Scholar]
  21. Jiang, Q. Analysis on the operation mechanism of offshore trade development in pilot free trade zone based on system dynamics: A case study of Shanghai pilot free trade zone. Enterp. Econ. 2023, 42, 5–14+2. [Google Scholar]
  22. Qiao, H.; Xu, J.; Zhang, S. Research on the impact effect of value creation of community e-commerce based on system dynamics. Syst. Eng. Theory Pract. 2023, 43, 2615–2631. [Google Scholar]
  23. Ma, T.; Hong, W.; Cao, Z.; Zhang, L.; Yang, X. Connection Patterns and Resilience Simulation of Innovation Network in the Context of Technology Transfer: A Case Study of Strategic Emerging Industries in the Guangdong-Hong Kong-Macao Greater Bay Area. Sustain. Cities Soc. 2024, 106, 105396. [Google Scholar] [CrossRef]
  24. Al-Kfairy, M.; Khaddaj, S.; Mellor, R.B. Evaluating the effect of organizational architecture in developing science and technology parks under differing innovation environments. Simul. Model. Pract. Theory 2020, 100, 102036. [Google Scholar] [CrossRef]
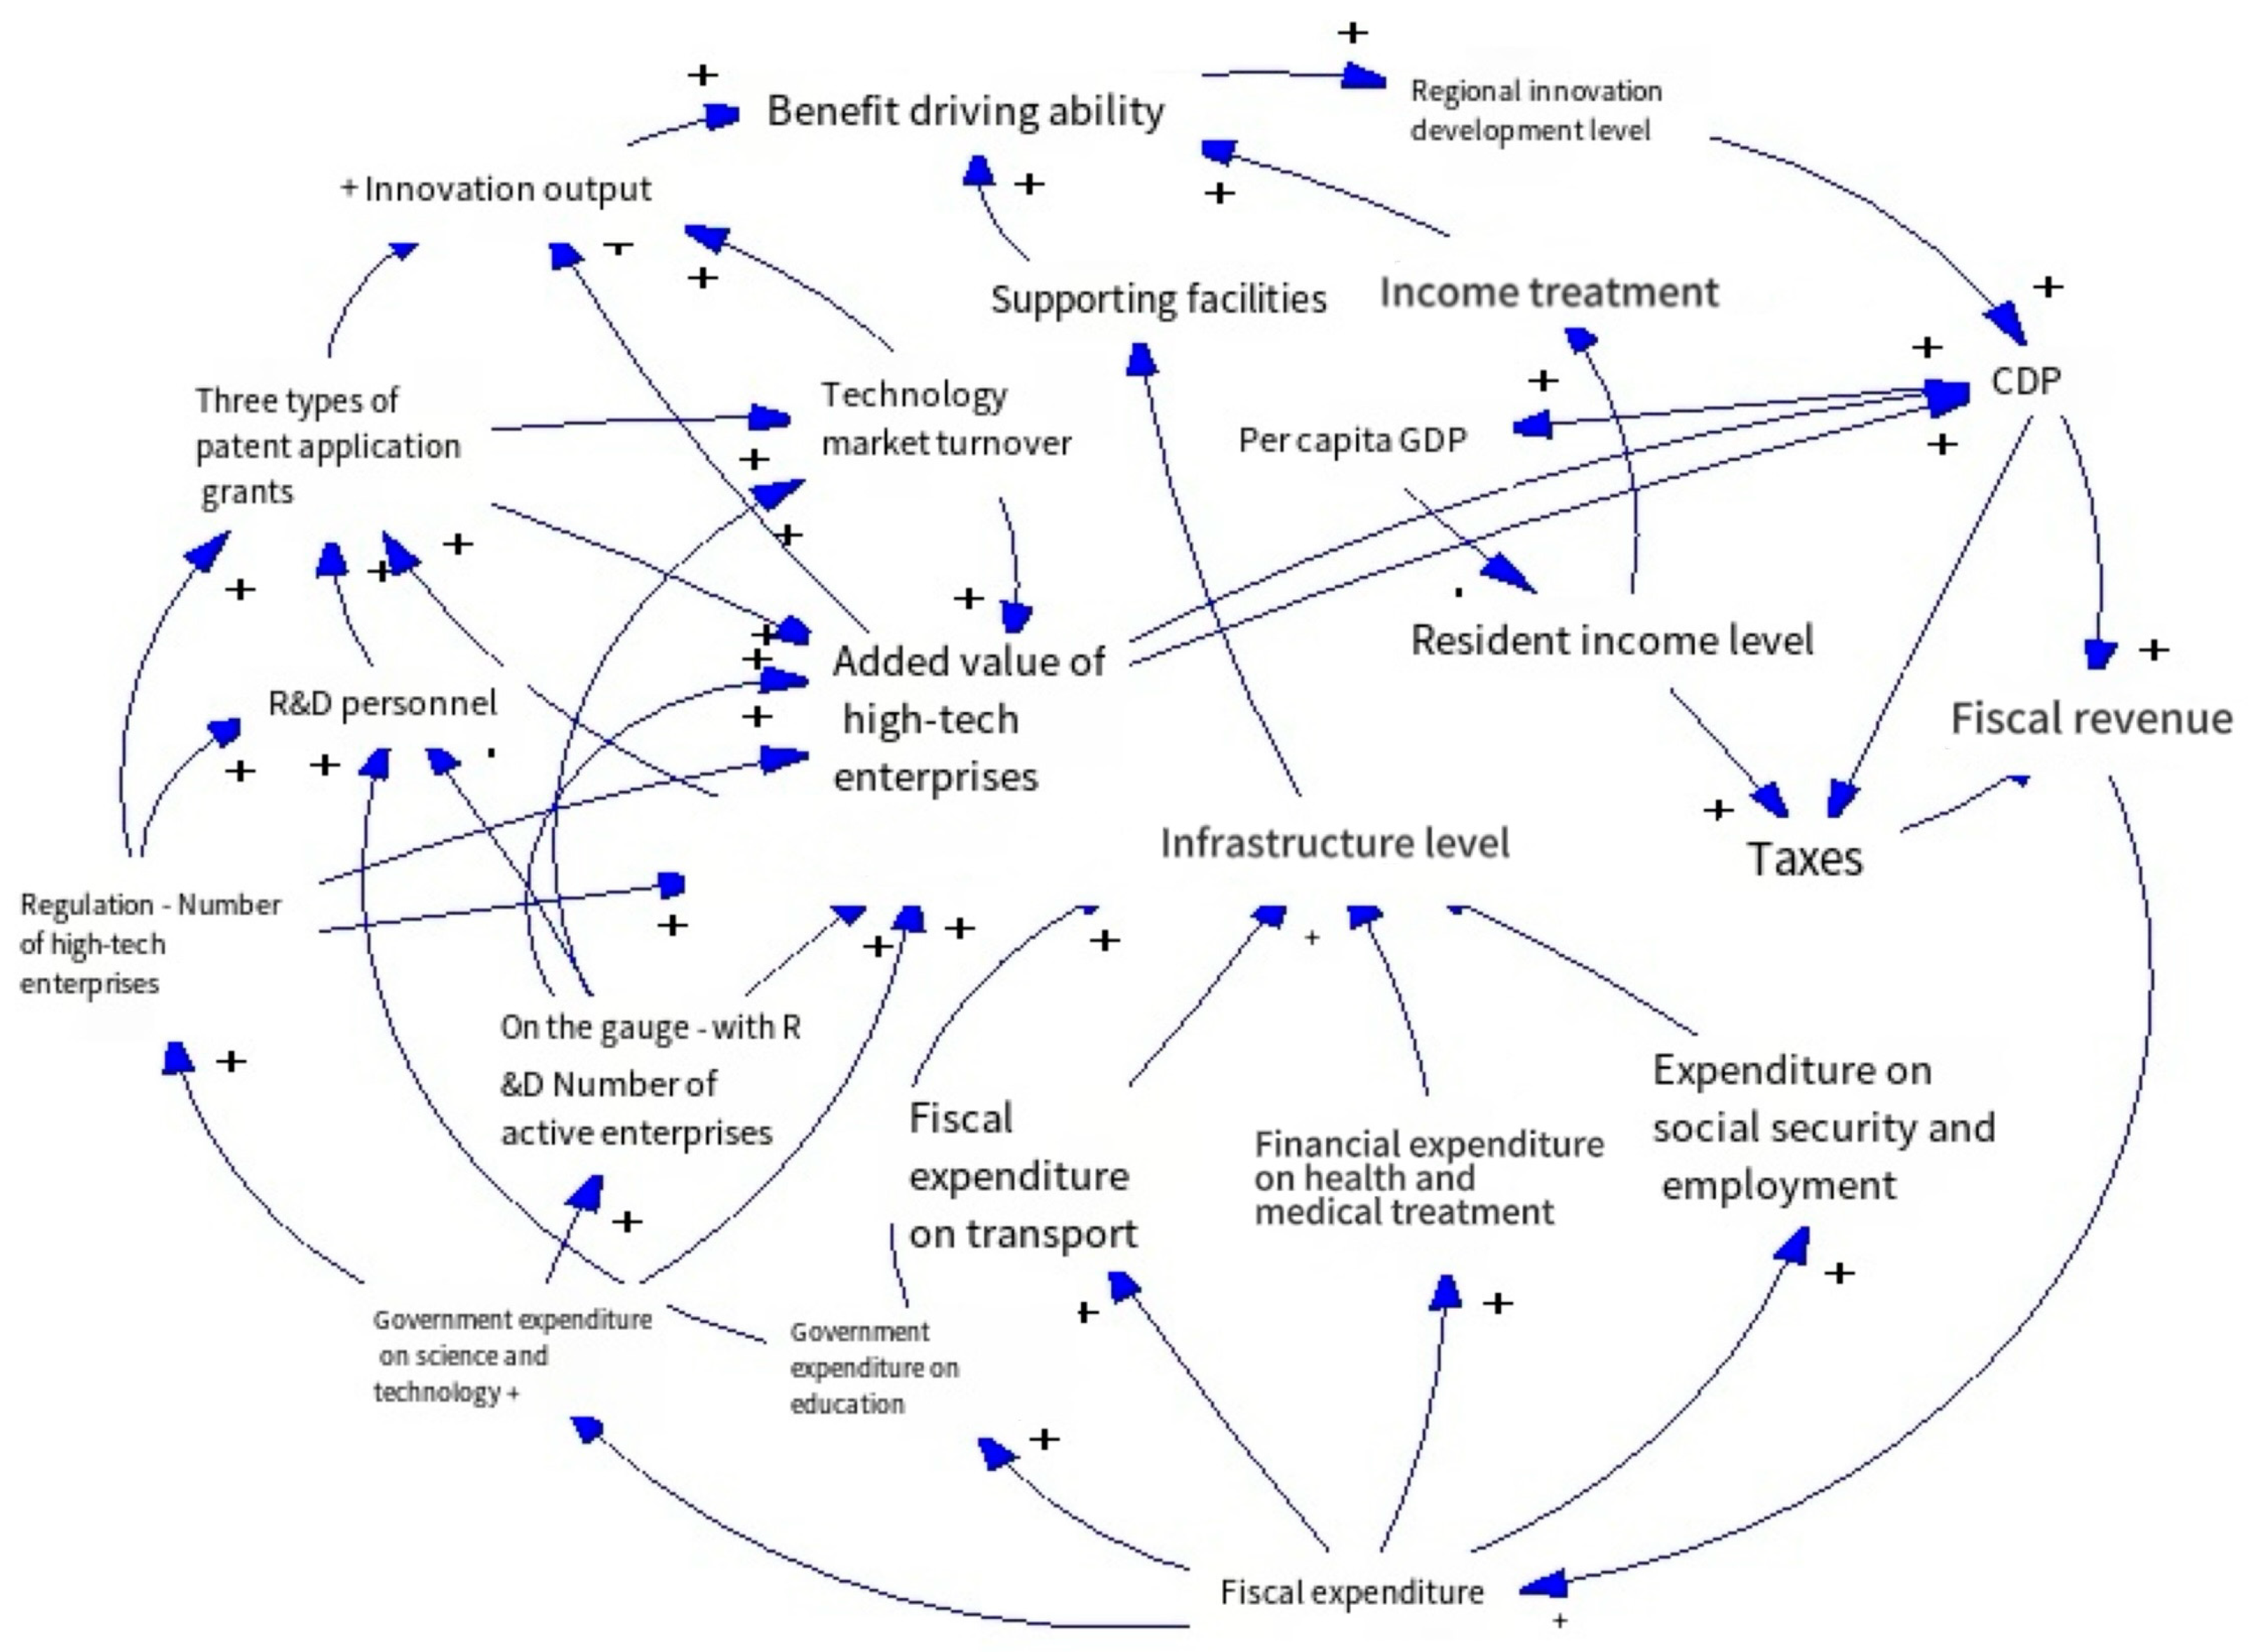
Figure 1. Innovation benefit driving subsystem. Note: “+” stands for positive feedback.
Sustainability 16 04869 g001
Figure 2. Science and technology innovation promotion subsystem. Note: “+” stands for positive feedback.
Sustainability 16 04869 g002
Figure 3. Catalytic subsystem of innovation culture. Note: “+” stands for positive feedback.
Sustainability 16 04869 g003
Figure 4. Innovation policy guidance subsystem. Note: “+” stands for positive feedback.
Sustainability 16 04869 g004
Figure 5. Causal relationship of regional innovation development system. Note: “+” stands for positive feedback.
Sustainability 16 04869 g005
Figure 6. System dynamics flow diagram of regional innovation development system.
Sustainability 16 04869 g006
Figure 7. Forecast of Major Indicators of Central City-Regional Innovation Development System.
Sustainability 16 04869 g007
Figure 8. Major Elements and Indicators of Non-central City-Regional Innovation Development System.
Sustainability 16 04869 g008
Figure 9. Prediction of Regional Innovation Development System in Central city (left) and Non-central city (right).
Sustainability 16 04869 g009
Figure 10. Simulation Results of Increasing Resident Income in Central city (Left) and Non-central City (Right).
Sustainability 16 04869 g010
Figure 11. Simulation Results of Increasing Supporting Facilities Input in Central City (Left) and Non-central City (Right).
Sustainability 16 04869 g011
Figure 12. Simulation Results of Increasing Share of Invention Patent Authorization in Central City (Left) and Non-central City (Right).
Sustainability 16 04869 g012
Figure 13. Simulation Results of Boosting R&D Personnel Input in Central City (Left) and Non-central City (Right).
Sustainability 16 04869 g013
Figure 14. Simulation Results of Boosting R&D Expenditure Input in Central City (Left) and Non-central City (Right).
Sustainability 16 04869 g014
Figure 15. Simulation Results of Increasing Growth of High-tech Companies in Central City (Left) and Non-central City (Right).
Sustainability 16 04869 g015
Figure 16. Simulation Results of Increasing Growth rate of Major Industrial Firms in Central City (Left) and Non-central City (Right).
Sustainability 16 04869 g016
Figure 17. Simulation Results of Increasing Proportion of Invention Patent Authorization in Central City (Left) and Non-central City (Right).
Sustainability 16 04869 g017
Figure 18. Simulation Results of Increasing Proportion of Import and Export in Central City (Left) and Non-central City (Right).
Sustainability 16 04869 g018
Figure 19. Simulation Results of Increasing Government Expenditure on Education in Central City (Left) and Non-central City (Right).
Sustainability 16 04869 g019
Figure 20. Simulation Results of Increasing Government Expenditure on Science and Technology in Central City (Left) and Non-central City (Right).
Sustainability 16 04869 g020
Figure 21. Simulation Results of Increasing Share of Tertiary Industry in Central City (Left) and Non-central City (Right).
Sustainability 16 04869 g021
Figure 22. Comprehensive Simulation Results of Indicators to Regional Innovation in Central City (Left) and Non-central City (Right).
Sustainability 16 04869 g022
Table 1. Definition of regional innovation system concept.
Visual AngleDefinitionMain Point
Element composition theoryThe regional innovation department covers various elements, such as government agencies, intermediary organizations, scientific research institutions, universities and enterprises, etc. There are certain connections and influences among these thematic elements.① Regional innovation system includes scientific research institutions, universities, government agencies, intermediary organizations, and other elements;
② The system with industrial cluster as the main body and innovation service system as the constituent element is the regional innovation system, whose fundamental goal is to cultivate regional industries and develop characteristic industrial clusters.
Complex system theoryInnovation is a complex system process with the participation of multiple actors and multiple links, which has the characteristics of open boundaries.An innovation system space and organizational structure with open borders, a specific regional spatial scale, and a variety of innovation subject elements are covered. These subject units influence and function each other. In the process of playing the role of innovation, the system is influenced by the environment, its own organization, and the innovation structure, and can act on the ecological development and social economic development.
institutionalismThe regional innovation system is mainly a set of regional system that realizes the sustainable development of regional economy by means of technological innovation.Innovation system is a new system composed of corresponding regional laws, regulations, and practices, which can serve the development of innovation. Regional system and corresponding institutional background play a very important role in the maintenance and emergence of regional innovation system.
Innovation network theoryThe key to regional innovation system lies in an innovation network, which is composed of the interrelation between the main elements in the system.① Research on the network structure of regional innovation system;
② Research on the practice of regional innovation system based on the actual industrial cluster network;
③ Research on regional innovation system from a more complex perspective;
④ From the perspective of sociology, this paper hypothesizes (or empirically quantifies) the relationships among the subjects of the regional innovation system, and discusses the regional innovation system network.
Resource allocation theoryRegional innovation system belongs to the regional level of national innovation system, and is also an important method theory that can realize the optimal allocation of regional resources.The regional innovation system has many similarities with the national innovation system in structure, which is composed of innovation infrastructure, innovation environment, innovation resources, and innovation implementation institutions.
Diffusion theory of technologyTechnology diffusion system based on technology application and development is the essence of regional innovation system.The Regional innovation system, a special organization that combines both private and public forms, can play an active role in promoting the development and application of technology.
Theoretical analysis frame theoryRegional innovation system is a new system framework to measure, detect, and guide the development of regional innovation.In 2007, Bengt proposed a new conceptual analysis method and framework for national innovation systems, which also provided a reliable basis for the construction of the theoretical framework of regional innovation systems.
Table 2. Variables involved in regional innovation system.
Variable NameVariable TypeUnitVariable NameVariable TypeUnit
Total populationState variablethousandNumber of institutions of higher learningAuxiliary variable
GDPState variablethousandOn the plan—there are R&D active industrial enterprisesAuxiliary variable
Number of high-tech enterprisesState variable Gauge—Number of industrial enterprisesState variable
Regional innovation and development capacityState variableDmnlThree types of authorizationAuxiliary variable
Population growthRate variablethousandNumber of authorized applications for invention patentsAuxiliary variable
GDP growthRate variablethousandThree kinds of authorized invention patents accounted forAuxiliary variable
The number of high-tech enterprises increasedRate variable Technology market turnoverAuxiliary variablethousand
Innovation efficiency driving abilityState variableDmnlAdded value of high-tech industryAuxiliary variablethousand
The ability to promote scientific and technological innovationState variableDmnlNumber of national science and technology enterprise incubatorsAuxiliary variable
Catalytic ability of innovation cultureState variableDmnlR&D personnelState variable
Innovation policy guidance capacityState variableDmnlR&D expenditureAuxiliary variablethousand
Innovation inputAuxiliary variableDmnlR&D funding intensityAuxiliary variable%
Innovation incomeAuxiliary variableDmnlPer capita disposable incomeState variable
Innovation outputAuxiliary variableDmnlPer capita GDPAuxiliary variable
Import and exportAuxiliary variablethousandShare of import and export GDPAuxiliary variable%
Output value of tertiary industryAuxiliary variablethousandThe proportion of tertiary industry GDPAuxiliary variable%
Resident income levelAuxiliary variable Supporting facilitiesAuxiliary variableDmnl
revenueAuxiliary variablethousandFiscal revenueAuxiliary variablethousand
Fiscal expenditureAuxiliary variablethousandBusiness environment indexAuxiliary variableDmnl
Science and technology expenditure as a proportion of government expenditureAuxiliary variable%Government expenditure on science and technologyAuxiliary variablethousand
Education appropriation as a proportion of government expenditureAuxiliary variable%Financial expenditure on educationAuxiliary variablethousand
Transport expenditure as a proportion of fiscal expenditureAuxiliary variable%Fiscal expenditure on transportAuxiliary variablethousand
The proportion of health and medical expenditure to fiscal expenditureAuxiliary variable%Financial expenditure on health and medical treatmentAuxiliary variablethousand
Expenditure on social security and employment as a proportion of government expenditureAuxiliary variable%Fiscal expenditure on social security and employmentAuxiliary variablethousand
Personnel growth rateAuxiliary variable%Population growth rateAuxiliary variable%
Disposable income growth rateAuxiliary variable%Public library stockAuxiliary variablethousand
Enterprise growth rateconstant%R&D personnel growthRate variable
Growth rate of industrial enterprisesRate variable
Table 3. Degree of Impact of Different Variables to Regional Innovation in Central City and Non-central City.
Central CityNon-Central City
indexInfluence degree (%)indexInfluence degree (%)
Growth rate of industrial enterprises6.79R&D funding intensity8.75
Resident income level6.2The number of high-tech enterprises increased8.28
The proportion of invention patents granted5.9Growth rate of industrial enterprises8.21
The number of high-tech enterprises increased5.74Level of supporting facilities7.63
Level of supporting facilities5.61Resident income level7.26
Number of science and technology incubators5.37R D personnel growth rate6.14
R&D funding intensity4.46The proportion of tertiary industry5.68
R&D personnel growth rate3.43The proportion of invention patents granted5.2
The proportion of tertiary industry3.09Number of science and technology incubators4.16
Government expenditure on science and technology2.2Government expenditure on science and technology3.06
Share of import and export GDP1.64Share of import and export GDP1.54
Disclaimer/Publisher’s Note: The statements, opinions and data contained in all publications are solely those of the individual author(s) and contributor(s) and not of MDPI and/or the editor(s). MDPI and/or the editor(s) disclaim responsibility for any injury to people or property resulting from any ideas, methods, instructions or products referred to in the content.