Article

Sentiments of Rural U.S. Communities on Electric Vehicles and Infrastructure: Insights from Twitter Data

1
College of Journalism & Mass Communications, University of Nebraska-Lincoln, 330 Andersen Hall, Lincoln, NE 68588-0443, USA
2
Department of Civil & Environmental Engineering, University of Nebraska-Lincoln, 262K Prem Paul Research Center at Whittier School, 2200 Vine Street, Lincoln, NE 68583-0851, USA
3
Community and Regional Planning Program, College of Architecture, University of Nebraska–Lincoln, 217 Architecture Hall, Lincoln, NE 68588-0106, USA
*
Author to whom correspondence should be addressed.
Sustainability 2024, 16(11), 4871; https://doi.org/10.3390/su16114871
Submission received: 24 May 2024 / Revised: 31 May 2024 / Accepted: 4 June 2024 / Published: 6 June 2024
(This article belongs to the Special Issue Electric Vehicles: Production, Charging Stations, and Optimal Use)

Abstract

:
The widespread adoption of electric vehicles (EVs) and the development of charging infrastructure is key to achieving sustainable transportation and reducing greenhouse emissions. This research paper presents a novel exploration of the public sentiments expressed by rural U.S. communities toward EVs and EV infrastructure using Twitter data. To understand the factors influencing public sentiment, three distinct models were developed and applied: Generalized Linear Models, Hierarchical Linear Models, and Geographically Weighted Regression. These models explored the relationships between sentiment and several impact factors, including the topics of the tweets, and the age and sex of tweet senders as well as the number of charging stations and historical accident data in the geographical vicinity of each tweet’s origin. Results indicate that a more positive sentiment on EVs resulted (1) when the tweet discussed EV infrastructure investment and equity, (2) when the tweeter was male, and (3) when more charging stations were present and fewer EV accidents occurred in the county, especially in rural areas. Counties with higher rural percentages generally exhibited more positive sentiments toward EV usage. The paper contributes to the existing literature by shedding light on the sentiments of rural residents toward EVs and the infrastructure.

1. Introduction

The rapid growth of social media platforms has profoundly changed how people communicate, share information, and express their opinions [1]. Social media platforms, particularly Twitter, offer an unprecedented opportunity to explore public sentiment, providing real-time and large-scale data that captures the diverse perspectives of individuals across various geographical locations. This abundance of data becomes particularly valuable when new products, technologies, facilities, or services are introduced to the general public. By analyzing these large data sets, researchers can quickly gauge public reactions and measure the intensity of sentiments, both positive and negative, surrounding these innovations. Understanding public sentiment toward these innovations is crucial because, for example, negative news can trigger overreactions and amplify existing negative sentiments, potentially leading to harmful herd behavior and disproportionately affecting the perception and success of the innovation [2].
In recent years, the growing interest in sustainable transportation has sparked considerable discussions and debates regarding innovative electric vehicles (EVs) and EV infrastructure. Our preliminary research indicates that EVs are geographically relevant, with development unevenly distributed across the United States, but closely tied to population density and economic growth. As shown in Figure 1, both the distribution of EV registrations and the number of EV policies (including incentives and regulations) exhibit clear spatial patterns.
States along the West and East Coasts have enthusiastically embraced EVs, evidenced by a higher number of registered EVs and their pioneering efforts in promoting EV adoption through multiple favorable policies. The focus on metropolitan areas in the U.S. is understandable, considering the surge in EV sales in these regions [3]. However, in light of transportation equity, it is crucial not to overlook the potential of the EV market in the middle regions of the U.S., especially in rural areas [4].
Our research attempts to address this critical knowledge gap by providing a comprehensive analysis of the sentiments expressed by rural U.S. communities toward EVs and EV infrastructure on Twitter. By acknowledging the importance of geographic relevance and considering spatial variations, our study aims to shed new light on the factors that influence public sentiment in these areas. Through these insights, we aspire to contribute to the development of inclusive and effective approaches for promoting EV adoption, ultimately fostering sustainable transportation practices across diverse geographies.
The widespread use of EVs faces unique challenges in rural areas, where the transportation landscape differs significantly from urban environments (e.g., limited charging infrastructure and scattered settlements). Thus, understanding public sentiment regarding the use of EVs and EV charging infrastructure in rural areas is crucial for policymakers, manufacturers, and other stakeholders to identify the specific challenges and opportunities in promoting EV adoption in these areas.

2. Literature Review

Sentiment refers to the underlying emotional tone or attitude expressed in a tweet. Based on the language used, each tweet can be categorized as having a positive, negative, or neutral sentiment. Positive sentiment reflects favorable opinions or experiences, negative sentiment reflects unfavorable or critical views, and neutral sentiment reflects tweets in which positive or negative emotions are unclear such as stating facts, quoting, or informing. In the context of this study, the analysis of sentiment is adopted to understand public perceptions and attitudes towards EVs and related infrastructure in rural communities.
Many psychology or sociology theories, such as the theory of planned behavior, rational choice theory, and discrete intention, are used to understand how individuals adopt new products or technologies [5]. In the context of EV usage, these theories suggest that a person’s feelings towards EVs, combined with their perceptions of societal expectations and personal behavioral assessments, fundamentally shape their willingness to adopt the new technology [6].
Typically, understanding public sentiment involves utilizing two sources of data: surveys (including questionnaires and interviews) and social media data. Surveys, as structured data collection methods, allow researchers to gather direct insights from respondents, most likely potential EV buyers, thus providing a comprehensive understanding of factors influencing EV sentiment [7,8,9]. However, the survey method may be limited by response bias due to the targeted audience and small sample sizes. Social media platforms, such as Twitter, offer real-time availability, vast data volume, and diverse sample populations to understand public opinion beyond geographic boundaries [10,11]. Unfiltered and authentic user-generated content presents genuine sentiments, while real-world context connects individual perceptions to societal events and emerging trends [12,13,14].
Positive public sentiment, understanding, and attitudes toward EVs can play a key role in promoting EV adoption [15]. Studies examining users’ sentiments have revealed various factors influencing the adoption of EVs [16]. Positive factors include environmental consciousness, lower operating costs, and government incentives. Conversely, concerns about limited driving range, charging infrastructure, upfront costs, and safety performance are key deterrents [6,17,18].
A recent study by Wu et al. discussed the evolving dynamics of public attitudes and sentiments towards new energy vehicles in China using social media data collected from Sina Weibo [6]. A total of 32,381 Weibo posts and 163,767 comments were finally obtained. Using LDA, the research identified four topics: driving range, policy, battery technology, and vehicle attributes such as endurance, price, and appearance. The authors found that the Chinese public exhibits generally positive sentiments (comments containing positive emotions account for 71.23%) towards new energy vehicles, while negative sentiments are primarily driven by concerns over safety and battery technology.
Another study of the sentiment of Indian consumers towards EVs used a total of 36,000 texts in two years (2016–2018) collected in the form of a tweet or Facebook comments. Deep-learning techniques were used for sentiment analysis. Three features that Indian consumers care about most when buying an EV, i.e., price, maintenance, and safety, were used to categorize the social media data into different groups and calculate the final sentiment score. Results indicated that the majority of sentiments are negative for the price of EVs and the maintenance of EV batteries (including the uncertainty of their life). Safety features of EVs showed majorly neutral sentiments in the study [19].
Sentiment is inherently subjective, and its quantification or classification precision can often be challenging. Gong et al. propose a comprehensive framework for analyzing sentiment using 8854 online reviews of EVs from the top 20 sales in 2020 [1]. Their approach, even when working with partial or imprecise sentiment data, reliably provides insights into consumer preferences and sentiments regarding different EV attributes. Consumer reviews were also used for topic classification.
Ha et al. analyzed data from a nationally representative collection of unstructured consumer reviews from 12,720 charging station locations across the United States. This dataset included 127,257 online reviews by 29,532 EV drivers over a 4-year period from 2011 to 2015 [20]. Using transformer-based deep learning, the study conducted a multilabel classification of reviews, identifying the most significant potential behavioral issues for EV charging are range anxiety, dealership practices, cost, service time, availability issues, user interaction, station functionality, and location. The sentiment of these identified topics related to EV charging infrastructure is determined through follow-up research based on user reviews [21].
Public sentiment on EV usage, when considering both rural and urban perspectives, may differ significantly due to various factors unique to each setting. In rural areas, where the availability and accessibility of EV charging infrastructure are often limited, perceptions of EVs may be influenced by practical concerns such as their feasibility of adopting EVs as a viable mode of transportation for long-distance travel (related to the concerns of “range anxiety”) [17]. The lack of charging stations and lower demand for EVs in these regions may lead to a more cautious or hesitant attitude toward EV adoption [22]. On the other hand, in urban areas, the presence of readily available charging stations and shorter travel distances, combined with greater emphasis on sustainability and environmental consciousness, may be fostering a more positive sentiment towards EVs [4,23]. Nonetheless, one aspect that has not received sufficient attention is safety [24]. While no in-depth studies on EV-related crashes have been conducted, it is worth noting that such incidents appear to occur more frequently in urban areas, which may potentially shape the overall sentiment toward EVs in these areas.
The development of adequate EV infrastructure is crucial for boosting public confidence in EV adoption [22] because EV owners and users, as important stakeholders, rely on the availability of charging stations to charge their vehicles. Their feedback and preferences can influence the placement and design of charging infrastructure. While EV infrastructure requires substantial investment, it is a decision heavily influenced by government policies. For example, President Biden’s Bipartisan Infrastructure Law provides the largest-ever federal investment for EV charging infrastructure through the National Electric Vehicle Infrastructure (NEVI) Formula [25]. The NEVI Formula serves as a critical down payment toward fulfilling the U.S. EV potential, especially as it concerns equitable access to EV infrastructure in areas that are socially disadvantaged (e.g., underdeveloped, hazard-bearing, and geographically remote). Once the basic national network is established, the NEVI Formula can provide support to expand charging capacity on any public roads as well as in accessible communities. At this stage, users’ preferences and attitudes, particularly regarding charging station accessibility and reliability, will play an important role in shaping policy formulation [26].
In summary, existing research demonstrates that a well-established charging network positively impacts EV sentiment [6]. However, there is a gap in understanding other influencing factors like EV safety and charging opportunities as well as in considering the characteristics of consumers expressing these sentiments, particularly with an emphasis on rural areas. Rural regions often struggle to establish strong EV infrastructure due to lower population density and limited financial resources [27]. Interestingly, it is conceivable that EV popularity may be higher in rural areas, given the inverse association between urban development and public sentiment towards EVs [4,28]. Therefore, this paper is motivated to explore these lesser-understood factors (e.g., safety and charging opportunities), focusing on rural areas, to gain a comprehensive understanding of public sentiment on the usage of EVs and EV infrastructure.

3. Materials and Methods

3.1. Data

The concept of rural areas lacks a uniform definition. The Census Bureau does not provide a definition of rural areas directly. Rather, it classifies a rural area as “all population, housing, and territory not included within an urban area.” This classification is primarily based on population density, with delineations determined after each decennial census. For instance, in the 2020 census, an urbanized area would consist of a population of 50,000 or more.
In this study, we obtained a full list of the defined urban and rural data, in which the percentage of the population in a county within rural blocks was provided [29]. Figure 2 depicts the geographic distribution of the rural percentage, where 0% represents no identified population within rural blocks of the county and 100% represents all identified populations within rural blocks of the county.
According to the 2020 Census [29], a total of 3112 counties in the 48 states (excluding Alaska and Hawaii for mapping convenience) and the District of Columbia are defined. Counties with higher rural percentages tend to have lower population densities and are characterized by vast expanses of rural land. In contrast, counties with lower rural percentages are typically urban or suburban areas with higher population densities and greater access to amenities and infrastructure. If simply using a 50% cutoff to determine whether a county is rural or urban, approximately 63.8% of all counties would be classified as rural.

3.1.1. Transportation Data

The installation of charging stations promotes the adoption of EVs [30], whereas EV accidents may draw public attention, potentially negative, to the matter [24]. Therefore, our study incorporates both of these impacts.
The locations of EV chargers are determined through the U.S. Department of Energy, Office of Energy Efficiency and Renewable Energy (https://afdc.energy.gov/stations/#/find/nearest, accessed on 15 April 2023). The EV charger location data includes both private and public types, the date when each station opened, and charging station features (e.g., number of ports, charging levels, etc.). Over the past decade (2013–2022), 55,094 EV charging stations have been deployed in the U.S.; 93.5% of them are publicly accessible [31]. In Figure 3, green dots indicate EV charging stations and the background color indicates aggregated counts of the number of charging stations per county.
The number of EVs involved in fatal accidents is tallied using data from the Fatality Analysis Reporting System (https://nhtsa.gov/research-data/fatality-analysis-reporting-system-fars, accessed on 2 June 2023) managed by the National Highway Traffic Safety Administration. While the dataset does not indicate whether an accident involved an EV or not, it provides each vehicle’s 13-digit vehicle identification number (VIN). The effort of identifying EVs from VINs is greatly saved by the programmatic interface of the package “vindecorder” in R [32] developed to decode the VIN API (https://vpic.nhtsa.dot.gov/api/, accessed on 17 June 2023). Note the 4th to 9th digits of a vehicle identification number (VIN) typically provide manufacturer information about the vehicles, including make, model, model year, fuel type, and gross vehicle weight rating. Specifically, the decoding of the 8th digit signifies whether the fuel type is “Electric” or not.
In total, we identified a total of 3702 fatal accidents involving an EV from 2011 to 2020. Figure 3 also displays the locations of EV accidents, represented by red dots, along with the background color indicating the aggregated counts of the number of accidents per county.

3.1.2. Twitter Data

We collected tweets from Sprinklr’s Listening Explorer platform on 12 January 2023. Sprinklr is a customer experience management platform that provides access to historical Twitter data [14]. We used the following query to identify Twitter chatter on EVs in rural America: (“EV” OR “EVs” OR “electric vehicle” OR “electric vehicles” OR “Tesla”) AND “rural.” The search was restricted to English-language tweets from the U.S. from 2015 to 2022 and resulted in 27,478 tweets.
Several variables came directly from Twitter via its API service, including age, sex, and geolocations. In our raw dataset (n = 27,478), 55.6% of tweet senders self-identified as male, 21.4% as female, and 23.0% had missing data. The age of the senders ranged from 16 to 79 years old. It is worth noting that in the raw data, 67.1% of sender ages were recorded as zero and a small fraction (0.1%) of non-zero ages were younger than 16, which were classified as “NA” in the dataset.
The geolocations where each tweet was posted were also provided, allowing us to map them to specific counties within a state based on their latitude and longitude, as can be seen in Figure 4 (the background color indicates aggregated counts of tweets in counties on a log scale). However, to ensure data completeness, counties without any associated tweets (1074 counties) were excluded from the study.
Sentiment, the emotional or opinionated tone (i.e., positive, negative, or neutral) expressed in a tweet, was labeled and provided by Sprinklr. Note that Sprinklr does not openly disclose the specific algorithms it employs to label sentiment in the Twitter data; however, a common idea is that the sentiment analysis is based on the frequency of sentiment-bearing words in the text.
In the raw data (n = 27,478), the sentiment labels indicated that 14.3% of the tweets were negative, 77.2% neutral, and 8.5% positive. Since positive and negative sentiments are the focus of this study, to enhance the model accuracy, this dependent variable was dichotomized into two categories: negative (coded as 0, accounting for 62.4% of the data) and positive (coded as 1, accounting for 37.6% of the data). Neutral data were excluded, following standard practice in the social media analytics industry for sentiment analysis [33].
We also conducted a topic modeling analysis of the tweets using the Latent Dirichlet Allocation (LDA) algorithm to identify the prevailing topics of tweets related to EVs and the charging stations with the “topicmodels” package in R.
Since retweets inflate the same words in topic modeling where scholars are typically interested in unique messages, we removed 15,848 retweets from the raw Twitter data (n = 27,478). As a result, 11,630 unique tweets were retained, whose geolocations involved 2038 counties. These tweets included mentions (n = 1790), replies (n = 5477), and updates (n = 4444). A summary of the data is provided in Table 1.
We then preprocessed these unique tweets, including removing extra character encodings, hypertext links, usernames (@), punctuation marks, some special characters, blanks and spaces, and numbers. We also converted words to lower cases. We then tokenized the tweets by unigrams (i.e., breaking each tweet into words), removed stop words (e.g., “the” and “a”) using both the default stop word dictionary in the “tidytext” package and a customized dictionary created for this dataset after an iterative process of examining top 500 most frequently occurring words for words that would not inform topic modeling (e.g., words in the search query), and finally stemmed the words (i.e., retaining the root of each word).
Assuming each topic of tweets is represented by a word distribution, LDA employs unsupervised learning to discover latent topics and their associated word distributions, using the gamma metric indicating the proportion of the document that is made up of words from the assigned topic. For a detailed description, refer to [34]. The process involved four key steps:
Step 1: We created and explored the document-term matrix (DTM), which showed the number of times the word occurred in the entire corpus of text.
Step 2: We ran the LDA algorithm for topic modeling with the DTM by assigning an initial number of topics k (we set k = 20).
Step 3: We calculated and inspected multiple metrics to analyze an optimal topic number with the “ldatuning” package. Upon plotting the k, we realized that k = 7 gave us the most optimal solution.
Step 4: After a thorough examination of the tweets in each topic, we opted to merge some topics due to similar themes, to balance sample sizes, and to simplify modeling by reducing the number of categories in the next modeling phase.
We identified four predominant topics, representing 14.3%, 26.3%, 27.6%, and 31.8% of the data, respectively. These topics, along with their associated examples, are presented in Table 2.

3.2. Methodology

Our initial research question focused on identifying the factors that impact EV sentiment in rural areas. Specifically, we are interested in understanding how the sentiment is influenced by tweet topics, tweeter characteristics (such as sex and age), safety (measured by crash data), charging station availability, and whether these effects are moderated by a rural versus urban setting.
Therefore, our first hypothesis is that tweet topics, tweeter demographic characteristics (age, gender), the number of crashes (safety), the number of charging stations (charging availability), and the moderating effects of the rural indicator will significantly influence the sentiment towards EVs. To test this, we initially ran a generalized linear model to determine the global regression coefficients for the independent variables.
Given the nature of the data structure, i.e., county-level data (number of crashes, number of charging stations, and rural/urban identification) and individual-level data (the topic, the tweeter, and the expressed sentiment of every single tweet on the EVs), we decided to run the regression in a structured model as it takes cares of within-group and among-group variabilities. Our second hypothesis is that a hierarchical regression model will improve the linear model fit and lead to more accurate model results.
Considering the geographical distribution of tweeters and their interests in different rural regions across the United States, we further examined the role of geographical factors in public sentiment on EVs (e.g., Coastal regions may be more positive in adoption of EVs than Mid-American regions or verse visa). Consequently, our third hypothesis is that a geographical regression model will improve the linear model fit and yield more accurate model results. The model results should also provide additional information regarding the spatial distribution of public sentiment on EVs.

3.2.1. Generalized Linear Model (GLM)

We developed a GLM as a benchmark to explore the relationship between the dependent variable and the explanatory variables, which can be found in Equation (1).
S i = β 0 + β 1 T o p i + β 2 S e x i + β 3 A g e + β 4 S t a + β 5 A c c + β 6 R u r + β 7 S t a R u r + β 8 A c c R u r
where
Si = The reflective sentiment from ith tweet sender on the EVs. S is coded as binary, i.e., S = 0: Negative sentiment, S = 1: Positive sentiment
Topi = One of the four topics the ith tweet sender is talking about
Sexi = The sex of the ith tweet sender
Agei = The age of the ith tweet sender
Sta = The number of EV stations in the county where the tweet is posted
Acc = The number of EV accidents in the county where the tweet is posted
Rur = Whether the county where the tweet is posted is defined as rural or urban
It should be noted that in this model, the predictor Sta and Acc interacts with a moderator Rur. This means that the magnitude of the relationship between the dependent variable Sentiment and the county-level explanatory variables Sta and Acc increases or decreases as the moderator Rur alters from “Yes” to “No”, or vice versa. Our hypotheses were that the moderator of rurality had a “magnifying” or “bolstering” effect on the number of stations but had a “buffering” or “dampening” effect on the number of accidents at the county level.

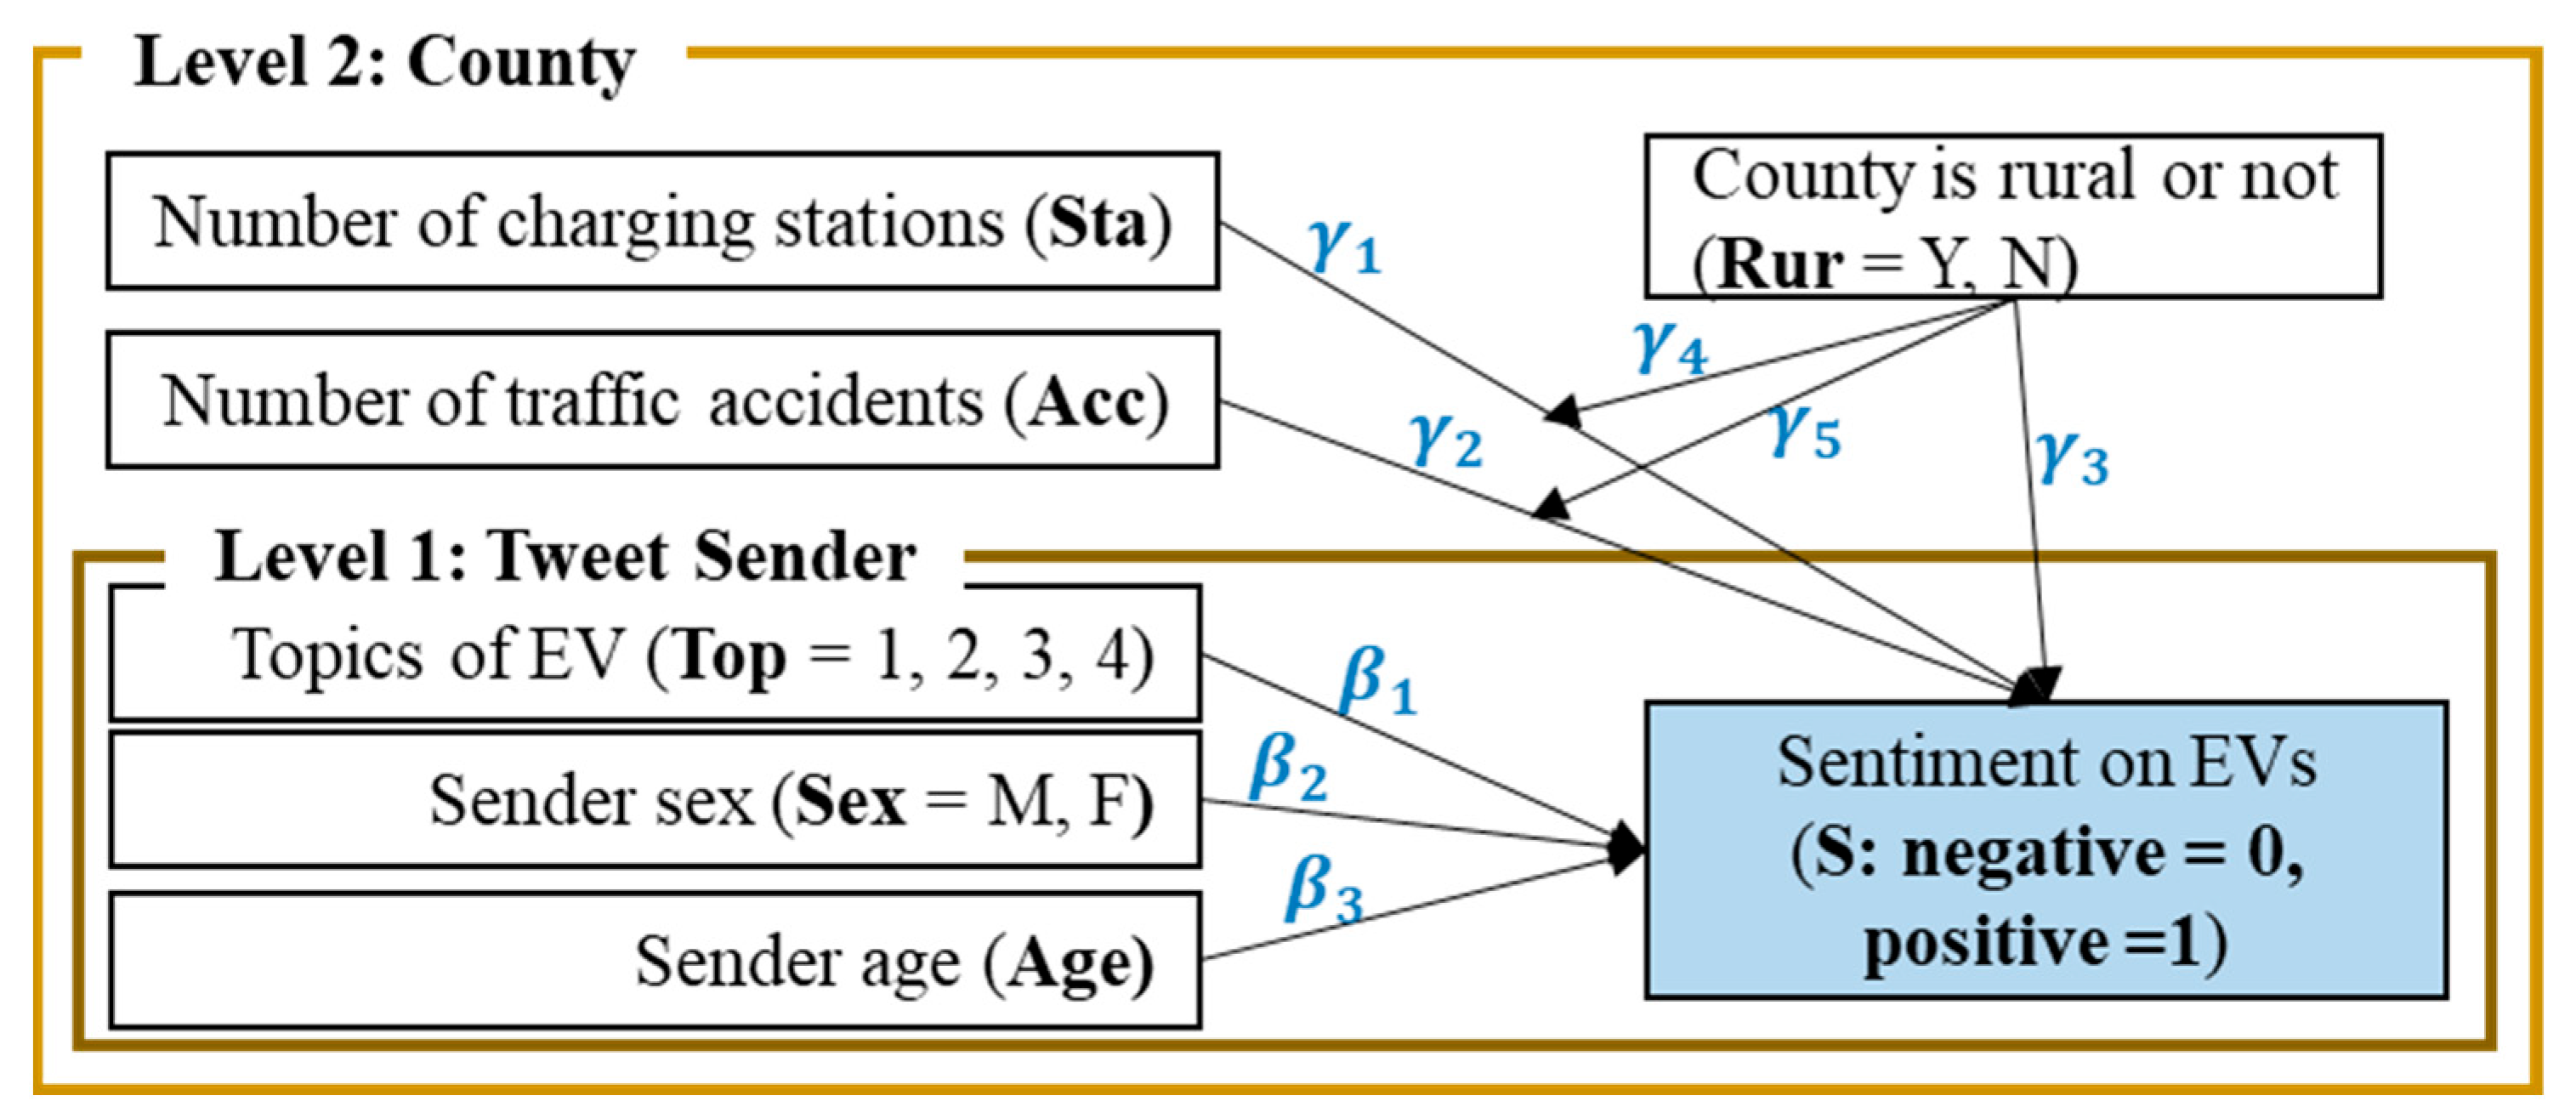
3.2.2. Hierarchical Linear Model (HLM)

Our data were naturally clustered as they included both individual (e.g., tweets) and contextual features (e.g., number of stations in a county). Therefore, we constructed an HLM to account for variances among groups (i.e., counties). The HLM, also known as a multilevel model or linear mixed-effect model, provides a powerful framework for analyzing clustered data by modeling the dependencies and heterogeneity within and between groups. By accounting for the hierarchical structure, this approach enabled us to examine how individual and group characteristics jointly influenced outcomes. The HLM can accommodate unbalanced data, where the number of individuals within groups varies. This flexibility is particularly valuable when working with our datasets as it allows for the inclusion of all available observations without excluding groups with smaller sample sizes.
In this study, we developed a two-level HLM that classified observations into level 1 (i.e., within) or level 2 (between) units. Features of the tweets (i.e., sentiment, topics, and sender sex) represent the level 1 units, and features of the counties (i.e., number of stations, number of accidents, rural identification, and their interactions) represent the level 2 units. The structure of the HLM is illustrated in Figure 5.
Mathematically, the HLM can be expressed in Equations (2)–(6). Variables hold the same meaning as in the GLM in Equation (1). At the tweet sender level (i.e., level 1), it was a single regression model. The county level (i.e., level 2) represented a variance components model. The overall model was a mix of individual-tweet-level and county-level variables with random intercepts.
Level   1 : S i j = β 0 j + β 1 j T o p + β 2 j S e x + β 3 j A g e + ε i j
Level   2 : β 0 j = γ 00 + γ 01 S t a + γ 02 A c c + γ 03 R u r + γ 04 S t a R u r + γ 05 A c c R u r + ϵ 0 j
β 1 j = γ 10 + ϵ 1 j
β 2 j = γ 20 + ϵ 2 j
Overall   model : S i j = γ 00 + γ 10 T o p + γ 20 S e x + γ 30 A g e + γ 01 S t a + γ 02 A c c + γ 03 R u r + γ 04 S t a R u r + γ 05 A c c R u r + ϑ i
To determine whether or not a HLM is necessary, we examined the intraclass correlation coefficient (ICC), which measures the degree of clustering within groups or the degree of variability between groups. If the variance of the dependent variable can be partitioned into variance due to individual variation within a group (v2) and variation across groups (w2), then ICC can be calculated as a ratio of the amount of variance due to groups relative to the total variance of the dependent variable, i.e., ICC = w2/(v2 + w2).

3.2.3. Geographically Weighted Regression (GWR) Model

We looked at another perspective of the data cluster by acknowledging its spatial relationship. Therefore, we apply a GWR model to account for the heterogeneity of spatial distribution patterns across counties. Specifically, we developed the GWR model through separate GLMs for each location (ui, vi) in the dataset, incorporating the outcome and explanatory variables of nearby locations falling within the specified bandwidth [35]. The mathematical model is expressed in Equation (7).
S i = β 0 u i , v i + β 1 u i , v i T o p + β 2 u i , v i S e x + β 3 u i , v i A g e + β 3 u i , v i S t a + β 4 u i , v i A c c + β 5 u i , v i R u r + β 6 u i , v i S t a R u r + β 7 u i , v i A c c R u r + ε i u i , v i
Variables hold the same meaning as before. The GWR model used the coordinates of each sample point (or zone centroid) as a reference point for a spatially weighted least squares regression [27]. The GWR model was designed to allow the coefficient of models to vary spatially, generating coefficient estimates for each predictor at different locations. This unique characteristic allowed us to explore and map spatial heterogeneity in the modeled relationships. Moreover, the GWR model takes into account the spatial autocorrelation of variables. This is to avoid improper assumptions that regression relationships between predictors and the dependent variable are the same throughout counties in the United States.
In the GWR approach, bandwidth represents the distance, or the number of neighbors utilized for each local regression equation. It is a critical parameter as it can significantly impact the coefficient estimates in the model [36]. W calculated the bandwidth using an adaptive kernel within the “gwr.sel” function of the “spgwr” package in R [37]. The function iteratively evaluates the GWR model’s performance for different bandwidth values and selects the one that leads to the most accurate and reliable GWR model. This approach helps to adapt the spatial scale of the model to the underlying spatial patterns in the data, providing more localized and context-specific regression estimates.

4. Results

4.1. GLM Results

Our first base model is a GLM, which establishes a benchmark for the relationship between the dependent and independent variables. The model outcome is provided in Table 3.
The coefficients in Table 3 reveal that the tweet sender’s sex had a marginally positive impact on EV sentiment (β = 0.186, p = 0.086). Male tweeters tended to be more optimistic about EV usage than females. The tweet sender’s age showed minimal influence as the coefficient was close to zero. Topics 2, 3, and 4, relating to EV cost benefits and infrastructure investments in rural areas, had significantly positive sentiment compared to Topic 1, which concerns the electric vehicle charging experience and services in rural areas.
The result also indicates that an increase in EV charging stations led to a more positive sentiment (β = 3.566, p < 0.001), while a higher number of EV accidents resulted in a more negative sentiment (β = −2.771, p = 0.010). As expected, the rural variable moderated the impact of the number of stations and the number of accidents (i.e., Sta and Acc), augmenting their impact on their EV sentiment as shown in their intersection terms (β(Sta) = 3.914, p(Sta) < 0.001; β(Acc) = −2.978, p(Acc) = 0.023).

4.2. HLM Results

To assess the impact of clustering by county, we calculated an ICC of 0.192, indicating that 19.2% of the variance was attributable to the county level. Subsequently, the rationality of using the HLM was further proved by the likelihood ratio test of the model with and without a hierarchical structure.
The test result shows a significant benefit to using a hierarchical model, in which data were structured (χ2 = 170.4, p < 0.001). This indicated the hierarchical structure of the data was relevant. The coefficients of the HLM, including both fixed and random effects, are shown in Table 4.
Table 4 illustrates that the coefficients in the HLM were similar to those in the GLM, enabling a similar interpretation. However, the HLM had a greater capacity to capture more significant variables and to reduce residuals. As a result, the overall model’s performance was significantly enhanced.

4.3. GWR Model Results

The adaptive kernel process resulted in an optimal bandwidth value of 0.297. The GWR model output is presented in Table 5.
The coefficient for the number of stations (Sta) exhibited a range from 0.472 to 0.866, signifying a positive influence on all areas of counties. A higher number of stations installed in a county encourages EV usage, potentially bolstering public support for EV infrastructure. The coefficient for the number of accidents (Acc) ranged from −1.062 to −0.286, suggesting a negative impact on all areas of counties. More accidents occurring in a county tend to deter EV usage, potentially leading to decreased public support of EV infrastructure.
The findings further reveal that the rural percentage ranged from −0.081 to 0.162, predominantly leaning toward the positive side, with only a minor portion exhibiting negative values. The rural variable also influenced both the number of stations and the number of accidents, leading to more positive or more negative intersection coefficients. As a result, the rural factor demonstrates an overall positive impact, implying that counties with higher rural proportions can expect a more positive public sentiment toward EV usage.
The coefficients of the number of EV stations (c_Sta) and the coefficients of the number of EV accidents (c_Acc) are distributed across the United States, as shown in Figure 6a and Figure 6b, respectively. Blank areas are counties without coefficient values from the GWR model due to missing data in these counties.
The use of GWR helps to reveal the spatial patterns of the relationship between sentiment and other variables. As may be seen in Figure 6a, the Midwest region had the lowest, while the Eastern Coast had the highest, impact on the public sentiment. For accident impact, the northwestern region and the greater New York area had the relatively lowest impact on public sentiment. Interestingly, these areas were the ones with the highest number of EV accidents, as well as the ones with the most EV charging stations (recall Figure 3). In the central region of the United States, especially the area around St. Louis shown by the black dots in Figure 6b, the accidents had the greatest negative impact on public sentiment.

5. Conclusions and Discussions

5.1. Conclusion

In this study, we explored public sentiment expressed by Twitter users in the United States on EVs and EV infrastructure. We investigated several factors influencing public sentiment, with a focus on perceptions expressed in social media data to understand the challenges and opportunities for EV promotion in rural areas. This work further highlights the importance of considering rural perspectives on EVs and infrastructure development, as they are less explored in the existing literature.
We utilized three statistical models—the generalized linear model (GLM), the hierarchical linear model (HLM), and geographically weighted regression (GWR)—to examine the relationships between sentiment and various factors, such as tweet topics, the age and sex of the tweet authors, the number of charging stations (i.e., charging availability), and EV-related accidents (i.e., EV safety) near the tweet’s geographical origin. Summarizing the results from Section 4, the key findings are as follows:
  • Twitter data as a source: Twitter provides real-time and large-scale perceptions on EVs, allowing us to explore public sentiment across various geographical locations.
  • Structure model as a method: Model performances are enhanced when accounting for the clustering observations. The GWR model reveals spatial heterogeneity in sentiment and its relationship with variables across different U.S. regions.
  • Sentiment influencing factors:
    (1)
    Topics discussing EV cost benefits and infrastructure investments in rural areas tended to evoke positive sentiment.
    (2)
    Having more EV charging stations in a county was also associated with a more positive sentiment.
    (3)
    Higher numbers of EV accidents in a county led to more negative sentiment.
    (4)
    The sex of tweet senders played a role in shaping sentiment. Male tweeters tended to be more optimistic about EV usage than female tweeters.
    (5)
    The tweet sender’s age did not seem to show a significant difference in sentiment.

5.2. Discussion

The geographic disparities underscore the importance of conducting targeted analyses to understand the unique sentiment of rural areas towards EVs and infrastructure. In this study, we found that counties with higher rural percentages exhibited more positive sentiments toward EVs. This suggests that rural areas may be more receptive to EV adoption.
Despite the knowledge gained from the three models, there are limitations to our study. First, certain variables in the Twitter data may come with peculiar measurement errors. For instance, there is a large number of missing values in the sex and age variables. Apart from refusing to disclose, there is a possibility that Twitter users may provide inaccurate information when registering their age and sex.
Sentiment analysis of tweets also comes with unique challenges. In this paper, we used sentiment labels provided by Sprinklr instead of employing an open-source sentiment lexicon (e.g., “syuzhet”, “AFINN”, “bing”, and “nrc”). Sprinklr first collects data from more than 25 social media platforms, 350 million websites, and other data sources. Then it creates a pre-labeled training dataset by having data experts manually label more than a million messages across 20 industries. This dataset later helps train its sentiment analysis model with deep-learning methodology [38]. Our future work will compare Sprinklr with other sentiment dictionaries to examine the reliability and validity of the sentiment scores used in this study. In addition to examining positive/negative valence in tweets, we can examine how our influencing factors may affect a host of discrete emotions (e.g., anger, joy, and fear). Moreover, achieving a flawless sentiment analysis is difficult due to its inherent limitations, especially when dealing with complex or sarcastic language, slang, and various linguistic nuances that can pose challenges for accurate interpretation [39]. Our future efforts will involve developing proprietary algorithms to discern sentiment labels based on the contextual information of tweets, thereby enhancing the reliability of our research results.
It is worth noting that the GWR model has a certain significance in solving spatial dependence and spatial non-uniform problems. However, it has no impact on the integration of the scale effect. It may be interesting to check the use of a two-stage analysis to establish an HLM–GWR model to reflect the spatial heterogeneity of combined effects [40]. However, due to the scope of the study, this is left for future work.

5.3. Final Remarks

Understanding public sentiment toward EVs and infrastructure in rural areas is crucial for devising effective strategies and policies to promote EV adoption in these regions. Our research provides a lens to look into the factors influencing sentiment, allowing policymakers, manufacturers, and stakeholders in the transportation industry to cater to the specific challenges and opportunities faced by rural communities, ultimately contributing to a more sustainable transportation future.

Author Contributions

The authors confirm their contribution to the paper as follows: study conception and design: M.W. and L.Z.; data collection: L.Z. and M.W.; analysis and interpretation of results: all authors; manuscript preparation and revision: all authors. All authors have read and agreed to the published version of the manuscript.

Funding

This research was supported by the Nebraska Governance & Technology Center (NGTC) as an internal seed fund from the University of Nebraska-Lincoln.

Institutional Review Board Statement

The University of Nebraska-Lincoln IRB office has approved the exemption of this research project for the Protection of Human Subjects (IRB Number: 20230923117EX).

Informed Consent Statement

Not applicable.

Data Availability Statement

Data used in this research may be available upon request.

Acknowledgments

The authors appreciate the funding support from the Nebraska Governance & Technology Center (NGTC) at the University of Nebraska-Lincoln for the project titled: “Understand the Sentiment of Rural Consumers on EV Charging Station Deployments using Real-time Data from Mobile Platforms.” Access to the social media data for this project was supported by the Public Insight Lab at the University of Nebraska-Lincoln. The contents of this paper reflect the views of the authors, who are responsible for the facts and accuracy of the information presented herein and are not necessarily representative of the NGTC and the UNL.

Conflicts of Interest

The authors declare no conflicts of interest.

References

  1. Gong, B.; Liu, R.; Zhang, X.; Chang, C.T.; Liu, Z. Sentiment analysis of online reviews for electric vehicles using the SMAA-2 method and interval type-2 fuzzy sets. Appl. Soft Comput. 2023, 147, 110745. [Google Scholar] [CrossRef]
  2. Kim, J.; Dong, H.; Choi, J.; Chang, S.R. Sentiment change and negative herding: Evidence from microblogging and news. J. Bus. Res. 2022, 142, 364–376. [Google Scholar] [CrossRef]
  3. Fischer, M.; Kramer, N.; Maurer, I.; Mickelson, R. A Turning Point for US Auto Dealers: The Unstoppable Electric Car. Mckinsey & Company. 2021. Available online: https://www.mckinsey.com/industries/automotive-and-assembly/our-insights/a-turning-point-for-us-auto-dealers-the-unstoppable-electric-car (accessed on 4 July 2023).
  4. Newman, D.; Wells, P.; Donovan, C.; Nieuwenhuis, P.; Davies, H. Urban, sub-urban or rural: Where is the best place for electric vehicles? Int. J. Automot. Technol. Manag. 2014, 14, 306–323. [Google Scholar] [CrossRef]
  5. Wang, S.Y.; Fan, J.; Zhao, D.T.; Yang, S.; Fu, Y.G. Predicting consumers’ intention to adopt hybrid electric vehicles: Using an extended version of the theory of planned behavior model. Transportation 2016, 43, 123–143. [Google Scholar] [CrossRef]
  6. Wu, Z.; He, Q.; Li, J.; Bi, G.; Antwi-Afari, M.F. Public attitudes and sentiments towards new energy vehicles in China: A text mining approach. Renew. Sustain. Energy Rev. 2023, 178, 113242. [Google Scholar] [CrossRef]
  7. Chu, W.; Im, M.; Song, M.R.; Park, J. Psychological and behavioral factors affecting electric vehicle adoption and satisfaction: A comparative study of early adopters in China and Korea. Transp. Res. Part D Transp. Environ. 2019, 76, 1–18. [Google Scholar] [CrossRef]
  8. Philipsen, R.; Schmidt, T.; Van Heek, J.; Ziefle, M. Fast-charging station here, please! User criteria for electric vehicle fast-charging locations. Transp. Res. Part F Traffic Psychol. Behav. 2016, 40, 119–129. [Google Scholar] [CrossRef]
  9. Carley, S.; Krause, R.M.; Lane, B.W.; Graham, J.D. Intent to purchase a plug-in electric vehicle: A survey of early impressions in large US cites. Transp. Res. Part D Transp. Environ. 2013, 18, 39–45. [Google Scholar] [CrossRef]
  10. Debnath, R.; Bardhan, R.; Reiner, D.M.; Miller, J.R. Political, economic, social, technological, legal and environmental dimensions of electric vehicle adoption in the United States: A social-media interaction analysis. Renew. Sustain. Energy Rev. 2021, 152, 111707. [Google Scholar] [CrossRef]
  11. Christakis, N.A.; Fowler, J.H. Connected: The Surprising Power of Our Social Networks and How They Shape Our Lives; Little, Brown Spark: New York, NY, USA, 2009. [Google Scholar]
  12. Ding, Y.; Korolov, R.; Wallace, W.A.; Wang, X.C. How are sentiments on autonomous vehicles influenced? An analysis using Twitter feeds. Transp. Res. Part C Emerg. Technol. 2021, 131, 103356. [Google Scholar] [CrossRef]
  13. Kohl, C.; Mostafa, D.; Böhm, M.; Krcmar, H. Disruption of individual mobility ahead? A longitudinal study of risk and benefit perceptions of self-driving cars on twitter. In Proceedings of the 13th International Conference on Business Informatics (WI 2017), St. Gallen, Switzerland, 12–15 February 2017; pp. 1220–1234. [Google Scholar]
  14. Penmetsa, P.; Okafor, S.; Adanu, E.; Hudnall, M.; Ramezani, S.B.; Holiday, S.; Jones, S. How is automated and self-driving vehicle technology presented in the news media? Technol. Soc. 2023, 74, 102290. [Google Scholar] [CrossRef]
  15. Wibowo, A.S.; Septiari, D. How Does the Public React to the Electric Vehicle Tax Incentive Policy? A Sentiment Analysis. J. Tax Reform 2023, 9, 413–429. [Google Scholar] [CrossRef]
  16. Christidis, P.; Focas, C. Factors affecting the uptake of hybrid and electric vehicles in the European Union. Energies 2019, 12, 3414. [Google Scholar] [CrossRef]
  17. Lashari, Z.A.; Ko, J.; Jang, J. Consumers’ intention to purchase electric vehicles: Influences of user attitude and perception. Sustainability 2021, 13, 6778. [Google Scholar] [CrossRef]
  18. Egbue, O.; Long, S. Barriers to widespread adoption of electric vehicles: An analysis of consumer attitudes and perceptions. Energy Policy 2012, 48, 717–729. [Google Scholar] [CrossRef]
  19. Jena, R. An empirical case study on Indian consumers’ sentiment towards electric vehicles: A big data analytics approach. Ind. Mark. Manag. 2020, 90, 605–616. [Google Scholar] [CrossRef]
  20. Ha, S.; Marchetto, D.J.; Dharur, S.; Asensio, O.I. Topic classification of electric vehicle consumer experiences with transformer-based deep learning. Patterns 2021, 2, 100195. [Google Scholar] [CrossRef] [PubMed]
  21. Ha, S.; Marchetto, D.J. Labeling Sentiment and Topics of User Generated Reviews on Electric Vehicle Charging Experience for Supervised Machine Learning. 2020. Available online: https://github.com/asensio-lab/transformer-EV-topic-classification/blob/master/training-manual/training-manual.pdf (accessed on 23 May 2024).
  22. Hsu, C.W.; Fingerman, K. Public electric vehicle charger access disparities across race and income in California. Transp. Policy 2021, 100, 59–67. [Google Scholar] [CrossRef]
  23. Jensen, A.F.; Cherchi, E.; Mabit, S.L. On the stability of preferences and attitudes before and after experiencing an electric vehicle. Transp. Res. Part D Transp. Environ. 2013, 25, 24–32. [Google Scholar] [CrossRef]
  24. Liu, C.; Zhao, L.; Lu, C. Exploration of the characteristics and trends of electric vehicle crashes: A case study in Norway. Eur. Transp. Res. Rev. 2022, 14, 6. [Google Scholar] [CrossRef]
  25. U.S. Department of Transportation. Bipartisan Infrastructure Law. National Electric Vehicle Infrastructure (NEVI) Formula Program. Available online: https://www.fhwa.dot.gov/bipartisan-infrastructure-law/nevi_formula_program.cfm (accessed on 13 July 2023).
  26. Chen, Y.; Lin, B. Are consumers in China’s major cities happy with charging infrastructure for electric vehicles? Appl. Energy 2022, 327, 120082. [Google Scholar] [CrossRef]
  27. Jones, A.; Begley, J.; Berkeley, N.; Jarvis, D.; Bos, E. Electric vehicles and rural business: Findings from the Warwickshire rural electric vehicle trial. J. Rural Stud. 2020, 79, 395–408. [Google Scholar] [CrossRef]
  28. Wang, Y.; Chi, Y.; Xu, J.H.; Yuan, Y. Consumers’ attitudes and their effects on electric vehicle sales and charging infrastructure construction: An empirical study in China. Energy Policy 2022, 165, 112983. [Google Scholar] [CrossRef]
  29. U.S. Census Bureau. Urban and Rural. Available online: https://www.census.gov/programs-surveys/geography/guidance/geo-areas/urban-rural.html (accessed on 18 July 2023).
  30. Kumar, R.R.; Chakraborty, A.; Mandal, P. Promoting electric vehicle adoption: Who should invest in charging infrastructure? Transp. Res. Part E Logist. Transp. Rev. 2021, 149, 102295. [Google Scholar] [CrossRef]
  31. U.S. Department of Energy. Alternative Fueling Station Locator. Available online: https://afdc.energy.gov/stations/#/find/nearest (accessed on 18 July 2023).
  32. Vindecodr: Provides an Interface to the Department of Transportation VIN Decoder. Available online: https://cran.r-project.org/web/packages/vindecodr/index.html (accessed on 2 July 2023).
  33. Chikersal, P.; Poria, S.; Cambria, E.; Gelbukh, A.; Siong, C.E. Modelling public sentiment in Twitter: Using linguistic patterns to enhance supervised learning. In Computational Linguistics and Intelligent Text Processing. CICLing 2015; Gelbukh, A., Ed.; Lecture Notes in Computer Science; Springer: Berlin/Heidelberg, Germany, 2015; Volume 9042, pp. 49–65. [Google Scholar]
  34. Qi, B.; Costin, A.; Jia, M. A framework with efficient extraction and analysis of Twitter data for evaluating public opinions on transportation services. Travel Behav. Soc. 2020, 21, 10–23. [Google Scholar] [CrossRef]
  35. De Smith, M.J.; Goodchild, M.F.; Longley, P. Geospatial Analysis: A Comprehensive Guide to Principles, Techniques and Software Tools; Troubador Publishing Ltd.: Leicestershire, UK, 2007. [Google Scholar]
  36. Fotheringham, A.S.; Brunsdon, C.; Charlton, M. Geographically Weighted Regression: The Analysis of Spatially Varying Relationships; John Wiley & Sons: Hoboken, NJ, USA, 2003. [Google Scholar]
  37. RDocumentation. spgwr (Version 0.6-36). Available online: https://www.rdocumentation.org/packages/spgwr/versions/0.6-36/topics/gwr.sel (accessed on 3 July 2023).
  38. Sprinklr. Detect the Sentiment Present in Customer Messages Accurately. 2023. Available online: https://www.sprinklr.com/help/articles/ai-enrichments/detect-the-sentiment-present-in-customer-messages-accurately/645b5278e66f2e36b45187ac (accessed on 5 July 2023).
  39. Gandhi, A.; Adhvaryu, K.; Poria, S.; Cambria, E.; Hussain, A. Multimodal sentiment analysis: A systematic review of history, datasets, multimodal fusion methods, applications, challenges and future directions. Inf. Fusion 2023, 91, 424–444. [Google Scholar] [CrossRef]
  40. Xue, F. Hierarchical geographically weighted regression model. J. Quantum Comput. 2019, 1, 9–20. [Google Scholar] [CrossRef]
Figure 1. The number of EV registrations in log scale (left) and the number of EV policies (right) as of 2022. Data are obtained from the U.S. DOE’s Alternative Fuels Data Center.
Sustainability 16 04871 g001
Figure 2. The percentage of the rural population in a county.
Sustainability 16 04871 g002
Figure 3. Locations of the EV charging stations (left) and traffic accidents (right).
Sustainability 16 04871 g003
Figure 4. Log-scale distribution of tweet counts in counties.
Sustainability 16 04871 g004
Figure 5. HLM variable structure.
Sustainability 16 04871 g005
Figure 6. Coefficients distribution in counties, reflecting the influence on EV sentiment.
Sustainability 16 04871 g006
Table 1. Summary of the data.
LevelNTypeMeanSTDMinMax
Sentiment (Positive = 1)Individual11,630Binary0.370.4801
Tweet Topics (1, 2, 3, 4)Individual11,630Discrete2.821.0314
Sender Sex (Male = 1)Individual11,630Binary0.720.4501
Sender AgeIndividual11,630Continuous35.5810.371379
Number of EV stationsCounty2038Continuous17.9898.7503638
Number of EV accidentsCounty2038Continuous1.187.770317
Rural indicator (Yes = 1)County2038Binary0.250.4401
Table 2. Twitter message examples for each topic.
TopicMessageSentimentGamma
Topic 1: EV charging experience in rural areas“An EV driver’s desperate search to find electricity to charge his car in rural Cecil County, Maryland-A drama that unfolded on Dec. 7, 1908, exactly 110 years ago today. #rangeanxiety #onthisday pluginsites.org/1908-fritchle-\x85” Neutral0.157
“Western States Try To Weasel Their Way Out Of Rural EV Charging: “ data-medium-file=“cleantechnica.com/files/2022/05/\x85” data-large-file=“cleantechnica.com/files/2022/05/\x85”/>In a previous article, I covered the aggressive plan the Biden Administration has\x85 dlvr.it/SSXTYf #Renewable #Energy https://t.co/0iJ9IiBWavNeutral0.157
Topic 2: EV driving cost-benefit performance in rural areas“@Locke_Wiggins It absolutely is. That said, so is the gas tax. I think the mileage tax would work for electric vehicles and as we eventually transition completely to them, it would replace the gas tax. Adding a mileage tax on top of gas tax would unfairly burden the rural economy.”Neutral0.157
“Anywhere, but especially in NV, a tax on miles driven is a bad, regressive tax that places the greatest share of the burden on working families in rural communities. If #nvleg wants to recapture the 1% or so of the gas tax lost to EVs, a flat, $50 to $100 reg fee is way to go.” Neutral0.156
Topic 3: EV infrastructure investments toward rural communities“Why America doesn’t have enough EV charging stations: Gas stations spar with utility companies, rural areas predict years of losses on chargers, spotty equipment threatens reliability: The U.S. EV charging network is a mess. dlvr.it/SdZ3Nd ^WSJ #Business #Finance #CFO https://t.co/W95huPTsmKNegative0.159
“From the ample funding for rural water projects & wildfire risk reduction efforts to infrastructure for EV charging stations, we couldn’t be more excited to see this incredible feat of bipartisanship come into fruition.\n\n#TesterGettingIt Done #CleanEnergyforAll#mtpol#mtnews”Positive0.158
Topic 4: Policy equity (energy, economic, environment, technology) on EV infrastructure“A coalition of industry, finance, labor and public interest groups released its guiding principles on how to build the EV charging network we need. A top priority: ensuring charging stations get built in poor, disadvantaged and rural communities. \n\nMore:evcharginginitiative.com/principles”Positive0.153
“How can advocates make sure equity focus grows w/#EV charging infrastructure in rural & urban areas? Zach Henkin @ForthMobility, Darren Epps @SouthernCompany, Terea Macomber @GRID, Philip Pugliese @GOCARTA, & Richard Steinberg @ElectrifyAm work to find out #SUMC19 pic.twitter.com/wOnyfa2KP8”Neutral0.163
Table 3. GLM results (Significant level = 0.05).
Estimate βStd. Errort ValuePr(>|t|) *
(Intercept)−0.560 0.390 −1.437 0.151
SexM0.186 0.108 1.716 0.079
Age0.004 0.003 0.955 0.386
Top20.350 0.169 2.072 0.038
Top30.465 0.167 2.779 0.005
Top40.310 0.164 1.884 0.060
Sta3.566 0.778 4.583 <0.001
Acc−2.771 1.074 −2.580 0.010
Rur0.566 0.433 1.306 0.191
Sta:Rur3.914 0.930 4.207 <0.001
Acc:Rur−2.978 1.311 −2.271 0.023
AIC = 2580
AICc = 2786
Residual sum of square = 1802.81
* Significance level alpha = 0.05.
Table 4. HLM results (Significant level = 0.05).
Fixed EffectsEstimate γStd. Errort ValuePr(>|t|) *
Intercept0.304 0.107 2.848 0.005
SexM0.042 0.024 1.768 0.077
Age0.001 0.001 1.022 0.669
Top20.077 0.036 2.119 0.034
Top30.101 0.036 2.816 0.005
Top40.071 0.035 2.024 0.043
Sta0.660 0.233 2.833 0.005
Acc−0.640 0.285 −2.245 0.026
Rur0.066 0.124 0.535 0.593
Sta:Rur0.709 0.277 2.559 0.012
Acc:Rur−0.689 0.353 −1.952 0.053
Random effectsGroupsNameVarianceStd.Dev.
County(Intercept)0.0100.100
Residual 0.2140.463
AIC = 2751
AICc = 2776
Residual sum of square = 420.71
* Significance level alpha = 0.05.
Table 5. Summary of GWR coefficient estimates.
Global β(u, v)Min1st Qu.Median3rd Qu.Max
Intercept0.414 0.231 0.332 0.362 0.408 0.437
SexM0.040 0.004 0.021 0.029 0.055 0.075
Age0.001−0.003−0.0010.0010.0020.003
Top20.074 0.043 0.073 0.078 0.094 0.123
Top30.099 0.020 0.055 0.092 0.116 0.133
Top40.065 0.033 0.059 0.067 0.075 0.089
Sta0.841 0.472 0.711 0.761 0.830 0.866
Acc−0.570 −1.062 −0.737 −0.581 −0.544 −0.286
Rur0.163 −0.081 0.046 0.098 0.130 0.162
Sta:Rur0.915 0.584 0.748 0.848 0.907 0.979
Acc:Rur−0.601 −1.347 −0.900 −0.675 −0.599 −0.485
Adaptive quantile (optimal bandwidth) = 0.297
AIC = 2716
AICc = 2741
Residual sum of squares: 447.39
Disclaimer/Publisher’s Note: The statements, opinions and data contained in all publications are solely those of the individual author(s) and contributor(s) and not of MDPI and/or the editor(s). MDPI and/or the editor(s) disclaim responsibility for any injury to people or property resulting from any ideas, methods, instructions or products referred to in the content.

