Abstract
Eco-labels promote environmentally conscious behavior through logos and accompanying information. However, research on the optimal combinations of this information is limited. This study examines the impact of the Japanese Eco Mark logo and recycled plastic input information on consumers’ willingness to pay (WTP) for mugs and pens. The survey results show that both elements positively influence WTP, though logos have a greater impact than recycled plastic information. The analysis of personal attributes revealed that females have a higher WTP than males, with no significant differences across age groups. Consistent with behavioral theories, WTP for mugs increased with environmental awareness towards the 3Rs (Reduce, Reuse, Recycle), while trends for pens were less distinct. This indicates that the effectiveness of eco-labels and recycling information varies by product, highlighting the need for further research to explore these differences.
1. Introduction
Plastic serves as a cost-effective and easily processed material for a variety of products. Its global annual production reached 390 million tons in 2021 [1]. As fossil fuels are utilized in their production and significant CO2 emissions are generated in resin manufacturing and waste management, there is a call to reduce plastic usage and promote its circularity at an international level [2]. The European Union (EU), which has worked to promote the circular economy, has been taking measures such as imposing mandatory recycling targets [3] and reducing plastic bag usage [4]. In Japan, the Ministry of Environment established the Plastic Resource Circulation Strategy [5], outlining policy goals for reducing, reusing, and recycling plastic. Such goals include the effective recovery of 100% of used plastics via reuse and recycling by 2035 and doubling the use of recycled content by 2030.
However, in 2021, only about 21% of waste plastics underwent material recycling, and the cyclical use rate of waste [6] remained at around 5%, indicating limited progress in plastic recycling and the adoption of recycled plastic products [7]. However, plastic recycling may incur management costs and additional expenses that are borne by stakeholders, such as producers and consumers [8]. In this context, measuring the acceptance of consumers for these additional expenses is a prerequisite for the societal transformations toward circularity.
Research on consumer and environmentally conscious behavior has thus far mainly focused on container packaging owing to its significant waste volume [9,10,11]. For instance, Yamaguchi and Takeuchi (2016) analyzed the relationship between reductions in plastic packaging and consumer behavior and highlighted that introducing a policy with a unit price for waste collection may improve consumers’ motivation to reduce plastic [12]. However, global analyses of the impact of environmental information on other plastic daily goods are scarce. For instance, Niedermeier et al. (2021) analyzed the influence of environmental information on consumer behavior regarding glue sticks, showing a preference for products with high rates of recycled plastic input [13]. Yet, research on whether this trend applies to other daily goods is limited, and it remains unclear how environmental information could stimulate the purchasing behavior of daily goods with a high recycled plastic content.
In Japan, environmental information is provided to consumers via the Eco Mark, which serves as an environmental label with high recognition [14]. There is debate as to whether eco-labels are an effective tool [15,16,17], but Japan’s Eco Mark has been reported to be effective [14]. The certified products are substantially categorized into two types of display: the Eco Mark alone or the Eco Mark with supplementary information, such as the rate of recycled material input (e.g., recycled plastic content). The display of eco-labels may positively influence environmentally conscious behavior [18] and provide additional information that can enhance label credibility [19,20]. However, an excess of information may lead to opposite results [21]. For example, Dutch university students were found to prefer virgin products over recycled ones [22]. Therefore, the efficiency of additional resource-related information in transforming consumer behavior remains largely unexplored.
The present research focused on daily goods containing plastic and analyzed the influence on consumer behavior of the Eco Mark logo and additional recycled plastic content information. Changes in consumers’ behavior are measured by their willingness to pay (WTP). The hypotheses underlying this work are described in the next section.
2. Hypothesis
Differences in the willingness to pay (WTP) for the presence of the Eco Mark and its associated information are considered indicators of the degree of environmentally conscious behavior. It is calculated by conjoint analysis. To limit the risk of information overload [21], only the recycled plastic input rate was considered additional information. In addition, as the use of recycled material in high-functionality items (mobile phones, printers) may be associated with a loss of trust in product reliability by consumers [22], we targeted mugs and pens, two everyday plastic items, without any complex mechanisms.
Hypothesis
1 (H1): The willingness to pay (WTP) for the Eco Mark logo with recycled plastic input information is higher than for the logo alone.
Furthermore, many studies address the importance of the environmental behavior of individual attributes such as gender, age, and income. For example, Scott and Willits (1994) found that individuals who are female, of older age groups, and with higher household incomes are more likely to buy more frequently environmentally friendly products [23]. Comparable results have been reported in Japan and other studies [24,25]. However, how this reflects on the consumer’s WTP has not been thoroughly verified.
Our second hypothesis aims to confirm the findings of Scott and Willits by examining the willingness to pay for the Japanese Eco Mark and additional recycled plastic input information.
Hypothesis
2 (H2): The willingness to pay for women and older age groups is higher.
In addition to individual attributes, cognitive and attitude attributes were considered. Behavioral theories such as the Hirose model [26] and the Ajzen model [27] assume that environmentally conscious behavior is executed through cognitive and attitudinal stages. As shown in Figure 1, environmentally conscious behavior in daily purchases implies first recognizing the existence of environmental issues, second forming attitudes toward these issues, and then taking action. The idea is that willingness to pay increases in the order of “recognition<attitude<behavior”. As the present study focuses on the influence of the recycled material input rate on consumer behavior, the relevant environmental issues are the 3Rs (Reduce, Reuse, Recycle). Few studies have investigated these circular strategies in Japan [28]. Furthermore, since previous research reported that behaviors related to each of the 3Rs are driven by different and specific factors [29], the willingness to pay is studied separately for each of the 3Rs.

Figure 1.
Cognitive, attitudinal, behavioral stages (adapted from Hirose model [23]).
Hypothesis
3 (H3): The WTP for each of the 3Rs (Reduce, Reuse, Recycle) follows the order positive respondents to recognition < positive respondents to attitude < positive respondents to behavior.
3. Data and Methodology
This study focused on plastic mugs and ballpoint pens as daily goods made of recycled plastic products and conducted a conjoint analysis, which is a standard methodology for estimating WTP [30]. In this method, there are several steps, such as sample collection (Section 3.1), decision of the factors and levels (Section 3.2), creation profile (Section 3.3), and estimation of WTP using utility the function and logit model (Section 3.4).
3.1. Sample Collection and Classification
The survey was conducted among 830 individuals from 12 January to 13 January 2023. As shown in Table 1, an equal number of samples per gender and age group was collected to test H2 (Table 1). Additionally, for H3, apart from the choice questions used in the conjoint analysis, a segmentation question was employed to categorize respondents or samples. In this question, respondents were asked to rate their recognition, attitude, and behavior regarding the 3Rs (Reduce, Reuse, Recycling) on a 5-point scale. Respondents who answered 4 or 5 were categorized as positive, while those who answered 1 to 3 were categorized as not positive (Table 2).

Table 1.
Participant profile.

Table 2.
Structure of questions.
3.2. Experimental Design
To create profiles for the choice questions, a table of factors and levels (Table 3) was constructed.

Table 3.
Factors and levels.
In this study, to examine the effects of the presence of information and changes in quantitative information, two types of choice questions were prepared regarding variations in the Eco Mark display type and its accompanying information, including the recycled plastic input rate (Q1. Mark type, Q2. Variation). Among the factors for quantitative information (price, recycled plastic input rate), the upper and lower limits were set based on information gathered from interviews with manufacturing companies. The assumption was made that prices and input rates correlate, and realistic values were set accordingly.
3.3. Products Profiles and Choice Questions
Questions Q1 (Mark type) and Q2 (Variation) present three profiles each, from which respondents selected one preferred option (Figure 2). As this process was repeated multiple times, the number of profiles needed to be a multiple of three to create a three-choice question. For instance, for Q2 on mugs, Variation can create a total of 16 profiles. To align this with a multiple of three, we either needed to add 2 profiles or remove 1 profile. To reduce respondent burden, this study adopted the latter approach. The number of profiles was adjusted using the D-optimum design to maximize the precision of parameter estimation [31]. Additionally, as the recycled plastic input rate was supplementary information to the Eco Mark, combinations like “No Logo, Input rate present” were excluded during profile creation.
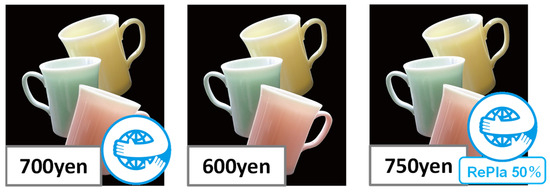
Figure 2.
Product profiles for Mark type (mug).
In the end, each respondent was presented with a total of 7 questions for Q1. Mark type (mug: 4 questions; pen: 3 questions) and 8 questions for Q2. Variation (mug: 5 questions; pen: 3 questions).
3.4. Random Parameter Logit Model and Marginal Willingness to Pay (MWTP)
Based on Train (2009), we conducted an analysis using the software NLOGIT6 (version 6) with a random parameter logit model [32]. In doing so, based on the random utility theory, we assumed the utility obtained by respondent to be described by the following function.
Here, represents the price element of option chosen by respondent in the -th response; is the price coefficient of respondent, ; denotes the non-price elements of option chosen by respondent in the t-th response; stands for the coefficients of non-price elements of respondent ; and represents the error term (following the Gumbel distribution).
As mentioned earlier, our study involves two types of questions (Q1. Mark type, Q2. Variation), each requiring a distinct set of factors; hence, we assumed the utility functions separately for each question. Note that, regardless of the question type, the random draw method used in the analysis model adopted the Halton sequence method (draw times = 100).
Furthermore, following Yamashige et al. (2015), we estimated the mean parameter vectors and from the coefficients derived using the random parameter logit model and calculated MWTP () for each element [33].
Here, represents the mean parameter vector for prices, while represents the mean parameter vector for non-price elements.
By computing these elements for all samples and for each segmented sample (such as by gender and positive responses regarding the 3Rs), we derived the MWTP for each sample and element.
4. Results
The MWTP estimated for H1–3 is presented in Figure 3, Figure 4, Figure 5, Figure 6, Figure 7 and Figure 8. In these figures, the upper part represents the estimation results for (a) mugs, whereas the lower part depicts the results for (b) pens. Please refer to the Appendix A for the model fit for each sample and product.
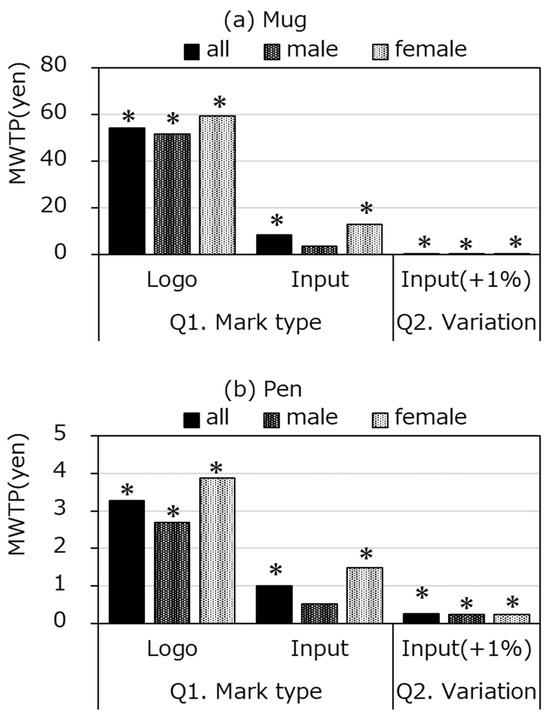
Figure 3.
Estimated MWTP by gender. Note: “*” in the graph is the MWTP calculated from significant parameters (level at 10%).
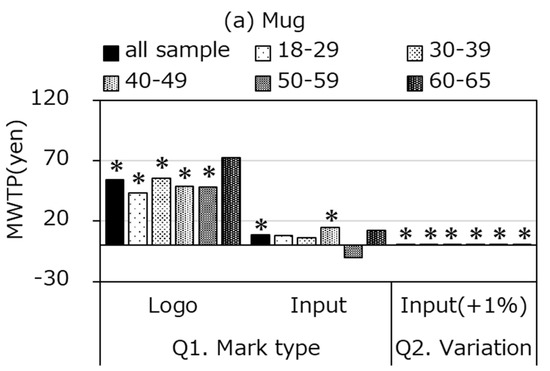
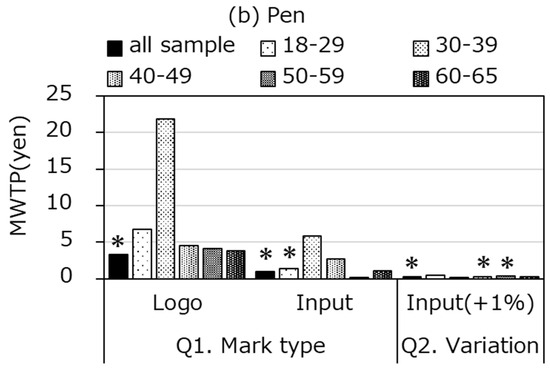
Figure 4.
Estimated MWTP by age. Note: “*” in the graph is the MWTP calculated from significant parameters (level at 10%).
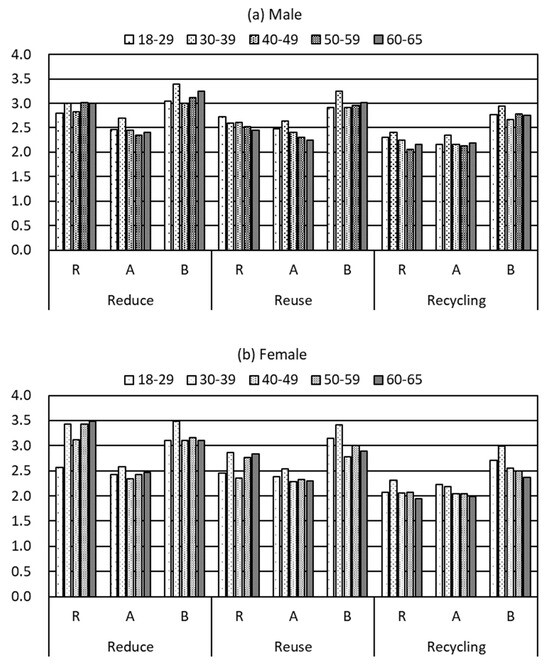
Figure 5.
Average scores of answers to classification questions. Note: in the figures, “R” refers to recognition, “A” to attitude, and “B” to behavior.
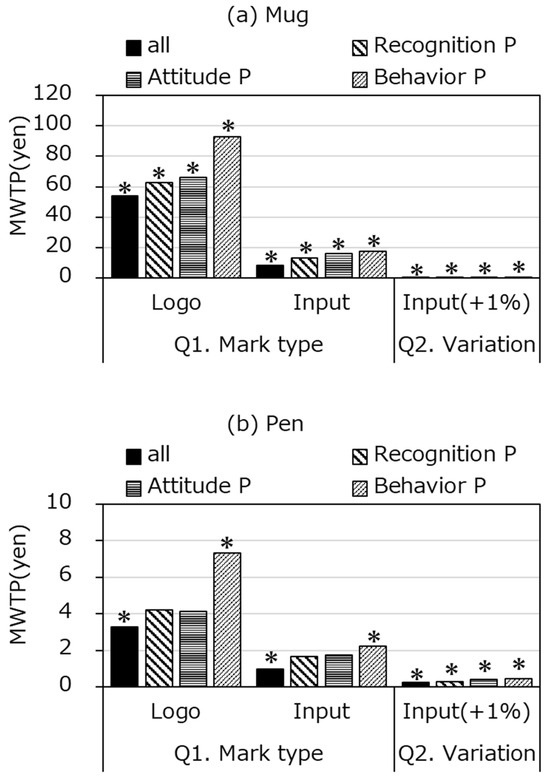
Figure 6.
Estimated MWTP by reduce. Note: “*” in the graph is the MWTP calculated from significant parameters (level at 10%).
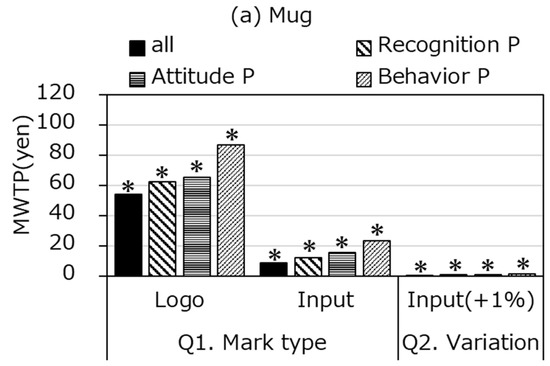
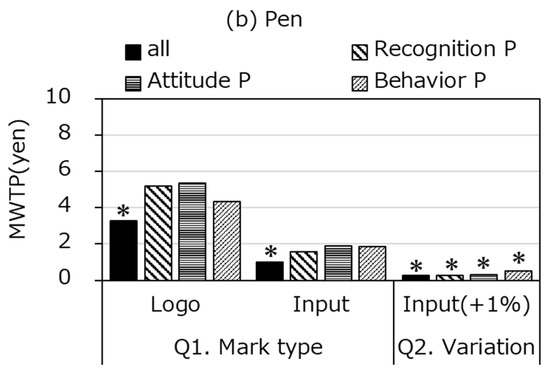
Figure 7.
Estimated MWTP by reuse. Note: “*” in the graph is the MWTP calculated from significant parameters (level at 10%).
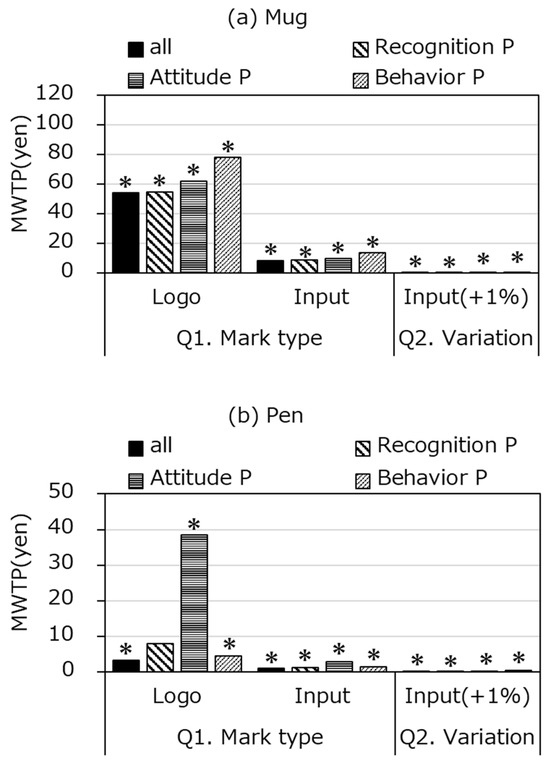
Figure 8.
Estimated MWTP by recycling. Note: “*” in the graph is the MWTP calculated from significant parameters (level at 10%).
4.1. H1 and H2 (Information Display, Gender, and Age)
The estimation results are in accordance with H1 and partially in accordance with H2. The results of the MWTP derived from the responses of the whole sample and male/female respondents are shown in Figure 3.
First, as a general trend across the whole sample, the MWTP for selection Q1 is positively valued for both the eco-label and the inclusion of recycled plastic content. When both are listed, the WTP for the mug (JPY 62.7) is higher than that for the pen (JPY 4.3), and the trend is similar when comparing WTP per unit of price. Therefore, while the levels may vary by product, the impact of the label on consumer behavior is significant, and the addition of recycled plastic content information also has a positive effect.
Moreover, concerning the increase in content rate (+1%) for Q2, the MWTP is positive as well, but the values for mugs are smaller than those for content rate display, while pens exhibit the opposite trend. Owing to the different assumed utility functions, a direct comparison is not feasible, yet it suggests varying trends among products. Generally, increasing the recycled plastic content has a positive impact on consumer behavior, though its effect may be smaller compared to the label display according to H1.
Second, in terms of MWTP for males and females, as per H2, the MWTP for females is higher for each question/factor. For instance, for mugs in Q1, the MWTP of the logo display is higher for females (JPY 59.3) than for males (JPY 51.7). The same trend was observed for pens, but the relative difference widened. Additionally, in Q1, the MWTP for the content rate display was not calculated from significant parameters for both products, indicating a clearer trend for females compared to males.
Furthermore, age-specific MWTP calculations for both mugs and pens did not show any correlation between age and MWTP, and the MWTP calculated from significant parameters was also minimal (Figure 4). To explore factors that do not align with trends in existing research, responses to segmentation questions indicating the level of environmental consciousness (Section 3.1) were examined by gender and age group (Figure 5). Although there were slight differences between genders, respondents aged 30–39 showed higher average response scores for recognition, attitude, and behavior for each of the 3Rs.
For occupations in this age group, male respondents mostly worked as company employees (75%), while females were split between company employees (38%) and homemakers (31%). With the rise in sustainable finance [34], efforts by companies to address environmental issues are now being appreciated by investors. It is considered crucial for employees in companies to be environmentally conscious [35], and environmental education aimed at them should not be limited to environmental departments [36]. Recently, environmental education for company employees has been included in corporate training programs, which might have led to higher average response scores in the 30–39 age group. Additionally, as 45% of all respondents are company employees, the presence of a certain number of environmentally conscious respondents across all age groups might have contributed to the lack of clear trends in age-specific MWTP. Such phenomena suggest a changing relationship between environmental behavior and respondent attributes.
4.2. H3 (Information Display and 3Rs)
In the cases of mugs in Q1-2 and pens in Q2, the trend was consistent with H3. However, the MWTP of pens in Q1 did not follow this hypothesis, and a unique trend was observed for recycling.
4.2.1. Reduce
Here, the MWTP results for the samples that provided positive responses are given (score > 4; see Section 3.1) regarding recognition, attitudes, and behaviors toward reduce for all samples and specific segments (e.g., behavior P), as shown in Figure 6.
In the results for each sample, the MWTP for recognition, attitude, and behavior increased notably in the case of Q1 mugs. Although a similar trend was observed for pens as for mugs, several MWTPs were derived from non-significant coefficients. In the cases of mugs in Q1-2 and pens in Q2, the trend was consistent with H3. Thus, displaying the logo or input rate for pens may not necessarily encourage positive action toward the concept of reduce among respondents.
4.2.2. Reuse
In Figure 7, the results showing the MWTP for respondents who provided positive responses regarding recognition, attitude, and behavior are shown toward reuse across the whole sample.
Similar to reduce, the results for respondents in each sample showed that MWTP for mugs increased in the order of recognition, attitude, and behavior for both questions. Just like reduce, In the cases of mugs in Q1-2 and pens in Q2, the trend was consistent with H3. Even with plastic daily goods, the impact of each factor on consumer behavior may vary depending on the product.
4.2.3. Recycling
We present the results of MWTP for samples that provided positive responses regarding recognition, attitude, and behavior toward recycling for all samples (Figure 8).
Like the patterns observed in reduce and reuse, the findings across respondents for both mug-related inquiries revealed a consistent increase in MWTP across the domains of recognition, attitude, and behavior. Overall, the level of MWTP was lower compared to reduce and reuse, and MWTP derived from non-significant coefficients in Q1 decreased compared to reduce.
Additionally, like reduce and reuse, differences in MWTP trends between products were observed.
In this context, the levels of MWTP for mugs in each of the 3Rs generally follow the trend of average response scores (Figure 4). The results of each of the 3Rs were consistent with H3 for mugs in Q1-2 and pens in Q2. However, only pens in Q1 showed a different tendency for reduce. That is, in the MWTP calculated from the significant coefficients, a reversal phenomenon was observed in some areas, indicating the so-called rebound effect. Similar phenomena have been reported in research cases in the United States [37], suggesting that promoting recycling behavior in specific groups may lead to the negation of other environmental conservation behaviors. However, as one factor in the United States, the strong correlation between political parties and environmental policies or the fact that the experiments targeted low-income students are cited. Therefore, it is believed that the rebound effect occurs only under specific conditions. The reasons for this trend are not clear, so more analysis is required to identify detailed factors.
5. Discussion
We estimated the MWTP for the Eco Mark and supplementary information regarding gender, age, and the RAB (recognition, attitude, and behavior) of the 3Rs, and they were consistent with H1. However, the basic type of Eco Mark in Japan is the logo only. Since this is an approach in the opposite direction to the results of this study, it is necessary to consider how to display this label. In addition, since Eco Mark is classified as a Type I label in ISO14020 [38], it may be effective to display the logo and additional information at the same time for similar ecolabels. If Type I labels include both the logo and accompanying information, it promotes the purchasing behavior of such environmentally friendly products. Ultimately, this contributes to the improvement of environmental issues related to the certification standards of these labels.
Also, we observed different trends among the products. Although the MWTP for mugs followed H1–3, the same was not true for pens, which had fewer significant coefficients. One reason for this difference could be attributed to differences in product characteristics such as usage and lifespan. As tableware, mugs may be selected by many consumers with long-term use in mind. Conversely, pens, as stationery, may be considered an inexpensive product intended for shorter-term use. Additionally, there may be varying consumer sensitivities to price between frequent users, such as office workers and students, and other consumers. Although both mugs and pens are everyday items, the distinctiveness of stationery items might have resulted in different trends. Considering the production and consumption of many other plastic everyday items, it is necessary to compare and analyze the characteristics of these products and their MWTP. With further analysis of other everyday products, it will be possible to consider appropriate eco-labeling methods based on product characteristics.
Finally, in this study, we categorized the current display types into profiles. Therefore, we did not examine how much other resource circulation information, which is provided as part of the eco-labeling criteria, influences consumer behavior. Given that all current display types have positive MWTP values, they are believed to have a positive impact on consumer behavior. However, while we confirmed the significant impact of eco-labeling alone, further discussion is required regarding the kind of information that is appropriate as ancillary information to stimulate consumer behavior toward eco-labeled products. Considering the progress of the circular economy, it is essential to organize and analyze a broader range of resource circulation information beyond traditional resource cycling [39].
6. Conclusions
In this study, we analyzed the impact of the logo of Japan’s most recognized environmental label, the eco mark, and the accompanying resource recycling information on consumer behavior, focusing on everyday products made from recycled plastic. Consequently, the following conclusions were drawn.
- (1)
- Regardless of sample segmentation, both products showed a higher MWTP for the logo in Q1., Mark type, and a lower MWTP for the increase in recycling rate in Q2. on Variation. Although the levels vary across products, the influence of the logo on consumer behavior was significant, suggesting that adding or increasing information about recycled plastic input can also have a positive impact.
- (2)
- When comparing MWTP between genders, women exhibit a higher MWTP. This aligns with the findings of previous studies [23], although there was no clear trend observed across age groups, suggesting a shift in the relationship between environmentally concerned behavior and respondent attributes over time.
- (3)
- In each of the 3Rs categories, mugs exhibited a significant increase in MWTP in the order of recognition, attitude, and behavior, suggesting a purchasing behavior aligned with behavioral theories. Conversely, pens only partially fitted the hypotheses for some factors, yielding many MWTP values derived from non-significant coefficients. Therefore, the type of eco-labeling that stimulates purchasing behavior may vary depending on the product.
Thus, even though these everyday items use recycled plastic, the specific type of product may influence how well eco-labels and recycling information align with behavioral theories or how useful they are perceived to be.
Author Contributions
D.T.: Writing—Original draft, Conceptualization, Methodology, Software, Validation, Formal analysis, Investigation, Visualization. S.M.R.D.: Writing—Review and Editing, Methodology. S.H.: Writing—Review and Editing, Methodology, Resources, Supervision, Funding acquisition. All authors have read and agreed to the published version of the manuscript.
Funding
This research was supported by the Environment Research and Technology Development Fund (JPMEERF20223C02) of the Environmental Restoration and Conservation Agency provided by the Ministry of Environment of Japan.
Institutional Review Board Statement
The web research company appropriately conducted our survey based on ethical standards, such as the Declaration of Helsinki.
Informed Consent Statement
Informed consent was obtained from all subjects involved in the study when they joined the web survey.
Data Availability Statement
The raw data supporting the conclusions of this article will be made available by the authors on request.
Acknowledgments
We would like to express our gratitude to the Eco Mark Office, Azumi-sangyo Co., Ltd. (Saitama city, Japan) and Kokuyo Co., Ltd. (Osaka, Japan), for their cooperation in the hearing survey and providing images.
Conflicts of Interest
The authors declare no conflicts of interest.
Appendix A

Table A1.
Number of answers for each classification sample.
Table A1.
Number of answers for each classification sample.
| Clarification Question | Mug | Pen | |||
|---|---|---|---|---|---|
| Positive (Score = 4–5) | Not Positive (Score = 1–3) | Positive (Score = 4–5) | Not Positive (Score = 1–3) | ||
| Reduce | Recognition | 1300 | 2020 | 975 | 1515 |
| Attitude | 1904 | 1416 | 1428 | 1062 | |
| Behavior | 940 | 2380 | 705 | 1785 | |
| Reuse | Recognition | 1968 | 1352 | 1476 | 1014 |
| Attitude | 2140 | 1180 | 1605 | 885 | |
| Behavior | 1224 | 2096 | 918 | 1572 | |
| Recycling | Recognition | 2620 | 700 | 1965 | 525 |
| Attitude | 2652 | 668 | 1989 | 501 | |
| Behavior | 1760 | 1560 | 1320 | 1170 | |

Table A2.
Results of random parameter logit model (Q1. Mug).
Table A2.
Results of random parameter logit model (Q1. Mug).
| Samples | Logo | Input Rate | Price | |
|---|---|---|---|---|
| All samples | 2.00152 *** | 0.31575 ** | −0.03692 *** | |
| Gender | Male | 1.61437 *** | 0.11419 | −0.03122 *** |
| Female | 2.22590 *** | 0.48136 ** | −0.03752 *** | |
| Age | 18–29 | 2.16965 *** | 0.40564 | −0.04975 *** |
| 30–39 | 2.08120 ** | 0.24384 | −0.03746 ** | |
| 40–49 | 1.26762 *** | 0.38072 * | −0.02592 *** | |
| 50–59 | 2.71675 *** | −0.55859 | −0.05636 *** | |
| 60–65 | 3.3255 | 0.57524 | −0.04571 | |
| Reduce | Recognition P | 2.92393 ** | 0.61837 * | −0.04649 ** |
| Attitude P | 1.50368 *** | 0.17699 | −0.03145 *** | |
| Behavior P | 2.34204 * | 0.92005 | −0.55495 | |
| Reuse | Recognition P | 2.50248 *** | 0.48950 ** | −0.04027 *** |
| Attitude P | 2.35017 *** | 0.54856 *** | −0.03612 *** | |
| Behavior P | 2.96431 ** | 0.80287 ** | −0.03421 *** | |
| Recycling | Recognition P | 2.34001 *** | 0.37680 ** | −0.04253 *** |
| Attitude P | 1.24135 *** | 0.09771 | −0.02648 *** | |
| Behavior P | 3.88819 | 0.65769 ** | −0.48025 *** | |
Note: ***, **, * represent significance at the 1%, 5%, or 10% level.

Table A3.
Results of random parameter logit mode (Q2. Mug).
Table A3.
Results of random parameter logit mode (Q2. Mug).
| Samples | Input Rate | Price | |
|---|---|---|---|
| All samples | 0.02875 *** | −0.06873 *** | |
| Gender | Male | 0.02520 *** | −0.07282 *** |
| Female | 0.03013 *** | −0.06787 *** | |
| Age | 18–29 | 0.04195 *** | −0.07748 *** |
| 30–39 | 0.02018 *** | −0.07626 *** | |
| 40–49 | 0.02712 *** | −0.07283 *** | |
| 50–59 | 0.07002 ** | −0.08972 *** | |
| 60–65 | 0.02601 *** | −0.06675 *** | |
| Reduce | Recognition P | 0.04828 *** | −0.07997 *** |
| Attitude P | 0.02234 *** | −0.06584 *** | |
| Behavior P | 0.14165 *** | −0.49621 *** | |
| Reuse | Recognition P | 0.03393 *** | −0.06748 *** |
| Attitude P | 0.01812 *** | −0.06464 *** | |
| Behavior P | 0.15424 *** | −0.55252 *** | |
| Recycling | Recognition P | 0.03555 *** | −0.09477 *** |
| Attitude P | 0.00753 | −0.06927 *** | |
| Behavior P | 0.14148 *** | −0.55491 *** | |
Note: ***, ** represent significance at the 1%, 5%, or 10% level.

Table A4.
Results of random parameter logit model (Q1. Pen).
Table A4.
Results of random parameter logit model (Q1. Pen).
| Samples | Logo | Input Rate | Price | |
|---|---|---|---|---|
| All samples | 1.62154 *** | 0.49337 *** | −0.49433 *** | |
| Gender | Male | 1.38499 *** | 0.26486 | −0.51372 *** |
| Female | 1.90814 *** | 0.72685 *** | −0.49227 *** | |
| Age | 18–29 | 3.86295 | 0.77578 * | −0.56831 *** |
| 30–39 | 11.2305 | 2.97555 | −0.51346 *** | |
| 40–49 | 2.2756 | 1.39349 | −0.50867 | |
| 50–59 | 2.53764 | 0.12438 | −0.61230 ** | |
| 60–65 | 1.91185 * | 0.52241 | −0.49732 | |
| Reduce | Recognition P | 2.16738 ** | 0.93194 *** | −0.49968 |
| Attitude P | 1.12770 *** | 0.19645 | −0.55581 *** | |
| Behavior P | 2.84390 ** | 0.86664 ** | −0.38725 *** | |
| Reuse | Recognition P | 2.69425 | 0.80783 | −0.52038 ** |
| Attitude P | 2.97038 | 0.66294 | −0.54271 *** | |
| Behavior P | 2.16738 ** | 0.93194 *** | −0.49968 | |
| Recycling | Recognition P | 3.88819 | 0.65769 ** | −0.48025 *** |
| Attitude P | 18.5647 ** | 1.43664 *** | −0.48195 *** | |
| Behavior P | 0.44495 | 0.40956 | −0.52386 * | |
Note: ***, **, * represent significance at the 1%, 5%, or 10% level.

Table A5.
Results of random parameter logit mode (Q2. Pen).
Table A5.
Results of random parameter logit mode (Q2. Pen).
| Samples | Input Rate | Price | |
|---|---|---|---|
| All samples | 0.11044 *** | −0.42318 *** | |
| Gender | Male | 0.12437 *** | −0.53267 *** |
| Female | 0.14768 *** | −0.63390 *** | |
| Age | 18–29 | 0.16010 ** | −0.31365 |
| 30–39 | 0.06030 ** | −0.48129 *** | |
| 40–49 | 0.13384 ** | −0.44472 ** | |
| 50–59 | 0.15441 *** | −0.49434 *** | |
| 60–65 | 0.13542 ** | −0.54215 | |
| Reduce | Recognition P | 0.25411 *** | −0.50817 *** |
| Attitude P | 0.07918 *** | −0.45655 *** | |
| Behavior P | 0.22042 *** | −0.47284 *** | |
| Reuse | Recognition P | 0.15424 *** | −0.55252 *** |
| Attitude P | 0.08165 *** | −0.46523 *** | |
| Behavior P | 0.25411 *** | −0.50817 *** | |
| Recycling | Recognition P | 0.14148 *** | −0.55491 *** |
| Attitude P | 0.05750 *** | −0.17924 *** | |
| Behavior P | 0.18259 *** | −0.48592 *** | |
Note: ***, ** represent significance at the 1%, 5%, or 10% level.

Table A6.
The model fit for each sample (Q1. Mug).
Table A6.
The model fit for each sample (Q1. Mug).
| Samples | Log Likelihood Function | McFadden R2 | AIC/N | |
|---|---|---|---|---|
| All samples | −2380.11 | 0.35 | 1.44 | |
| Gender | Male | −1224.94 | 0.33 | 1.49 |
| Female | −1152.39 | 0.37 | 1.40 | |
| Age | 18–29 | −505.00 | 0.31 | 1.55 |
| 30–39 | −464.90 | 0.36 | 1.43 | |
| 40–49 | −451.67 | 0.38 | 1.39 | |
| 50–59 | −476.38 | 0.35 | 1.46 | |
| 60–65 | −459.35 | 0.37 | 1.41 | |
| Reduce | Recognition P | −920.29 | 0.36 | 1.43 |
| Attitude P | −1349.95 | 0.35 | 1.43 | |
| Behavior P | −676.06 | 0.35 | 1.46 | |
| Reuse | Recognition P | −1362.33 | 0.37 | 1.39 |
| Attitude P | −1518.86 | 0.35 | 1.43 | |
| Behavior P | −909.43 | 0.32 | 1.50 | |
| Recycling | Recognition P | −1794.59 | 0.38 | 1.38 |
| Attitude P | −1853.61 | 0.36 | 1.41 | |
| Behavior P | −1272.08 | 0.34 | 1.46 | |

Table A7.
The model fit for each sample (Q2. Mug).
Table A7.
The model fit for each sample (Q2. Mug).
| Samples | Log Likelihood Function | McFadden R2 | AIC/N | |
|---|---|---|---|---|
| All samples | −3181.97 | 0.30 | 1.54 | |
| Gender | Male | −1701.95 | 0.25 | 1.65 |
| Female | −1507.71 | 0.34 | 1.46 | |
| Age | 18–29 | −642.75 | 0.30 | 1.56 |
| 30–39 | −700.56 | 0.23 | 1.70 | |
| 40–49 | −648.61 | 0.29 | 1.58 | |
| 50–59 | −569.96 | 0.37 | 1.39 | |
| 60–65 | −596.70 | 0.35 | 1.45 | |
| Reduce | Recognition P | −1211.35 | 0.32 | 1.50 |
| Attitude P | −1718.21 | 0.34 | 1.45 | |
| Behavior P | −908.75 | 0.30 | 1.56 | |
| Reuse | Recognition P | −1793.29 | 0.34 | 1.46 |
| Attitude P | −1902.33 | 0.35 | 1.43 | |
| Behavior P | −1143.18 | 0.32 | 1.50 | |
| Recycling | Recognition P | −2382.07 | 0.34 | 1.46 |
| Attitude P | −2390.14 | 0.34 | 1.45 | |
| Behavior P | −1644.37 | 0.32 | 1.50 | |

Table A8.
The model fit for each sample (Q1. Pen).
Table A8.
The model fit for each sample (Q1. Pen).
| Sample | Log Likelihood Function | McFadden R2 | AIC/N | |
|---|---|---|---|---|
| All samples | −1841.92 | 0.33 | 1.48 | |
| Gender | Male | −939.17 | 0.31 | 1.52 |
| Female | −883.40 | 0.35 | 1.43 | |
| Age | 18–29 | −331.49 | 0.39 | 1.37 |
| 30–39 | −394.14 | 0.28 | 1.62 | |
| 40–49 | −353.43 | 0.35 | 1.46 | |
| 50–59 | −360.69 | 0.34 | 1.49 | |
| 60–65 | −363.04 | 0.34 | 1.49 | |
| Reduce | Recognition P | −651.63 | 0.39 | 1.36 |
| Attitude P | −928.60 | 0.41 | 1.31 | |
| Behavior P | −418.29 | 0.46 | 1.21 | |
| Reuse | Recognition P | −982.42 | 0.39 | 1.34 |
| Attitude P | −1031.82 | 0.41 | 1.30 | |
| Behavior P | −558.23 | 0.45 | 1.24 | |
| Recycling | Recognition P | −1379.23 | 0.36 | 1.41 |
| Attitude P | −1363.59 | 0.38 | 1.38 | |
| Behavior P | −851.41 | 0.41 | 1.30 | |

Table A9.
The model fit for each sample (Q2. Pen).
Table A9.
The model fit for each sample (Q2. Pen).
| Samples | Log Likelihood Function | McFadden R2 | AIC/N | |
|---|---|---|---|---|
| All samples | −1826.91 | 0.33 | 1.48 | |
| Gender | Male | −946.86 | 0.31 | 1.53 |
| Female | −887.85 | 0.35 | 1.43 | |
| Age | 18–29 | −396.34 | 0.28 | 1.61 |
| 30–39 | −383.50 | 0.30 | 1.56 | |
| 40–49 | −365.78 | 0.33 | 1.49 | |
| 50–59 | −341.08 | 0.38 | 1.39 | |
| 60–65 | −334.96 | 0.39 | 1.37 | |
| Reduce | Recognition P | −661.51 | 0.38 | 1.37 |
| Attitude P | −946.29 | 0.40 | 1.33 | |
| Behavior P | −457.01 | 0.41 | 1.31 | |
| Reuse | Recognition P | −988.94 | 0.39 | 1.35 |
| Attitude P | −1020.71 | 0.42 | 1.28 | |
| Behavior P | −605.14 | 0.40 | 1.33 | |
| Recycling | Recognition P | −1351.65 | 0.37 | 1.38 |
| Attitude P | −1350.52 | 0.38 | 1.36 | |
| Behavior P | −900.44 | 0.38 | 1.37 | |

Table A10.
Multiple test of classification questions.
Table A10.
Multiple test of classification questions.
| Reduce_Recognition: Steel–Dwass Test | |||||
|---|---|---|---|---|---|
| 18–29 | 30–39 | 40–49 | 50–59 | 60–65 | |
| 18–29 | 1.000 | 0.001 | 0.138 | 0.001 | 0.001 |
| 30–39 | 0.001 | 1.000 | 0.414 | 0.900 | 0.900 |
| 40–49 | 0.138 | 0.414 | 1.000 | 0.350 | 0.197 |
| 50–59 | 0.001 | 0.900 | 0.350 | 1.000 | 0.900 |
| 60–65 | 0.001 | 0.900 | 0.197 | 0.900 | 1.000 |
| Reduce_Behavior: Steel–Dwass Test | |||||
| 18–29 | 30–39 | 40–49 | 50–59 | 60–65 | |
| 18–29 | 1.000 | 0.406 | 0.900 | 0.833 | 0.900 |
| 30–39 | 0.406 | 1.000 | 0.509 | 0.030 | 0.052 |
| 40–49 | 0.900 | 0.509 | 1.000 | 0.714 | 0.792 |
| 50–59 | 0.833 | 0.030 | 0.714 | 1.000 | 0.900 |
| 60–65 | 0.900 | 0.052 | 0.792 | 0.900 | 1.000 |
| Reuse_Recognition: Steel–Dwass Test | |||||
| 18–29 | 30–39 | 40–49 | 50–59 | 60–65 | |
| 18–29 | 1.000 | 0.063 | 0.900 | 0.900 | 0.900 |
| 30–39 | 0.063 | 1.000 | 0.059 | 0.077 | 0.325 |
| 40–49 | 0.900 | 0.059 | 1.000 | 0.900 | 0.900 |
| 50–59 | 0.900 | 0.077 | 0.900 | 1.000 | 0.900 |
| 60–65 | 0.900 | 0.325 | 0.900 | 0.900 | 1.000 |
| Reuse_Attitude: Steel–Dwass Test | |||||
| 18–29 | 30–39 | 40–49 | 50–59 | 60–65 | |
| 18–29 | 1.000 | 0.243 | 0.900 | 0.900 | 0.819 |
| 30–39 | 0.243 | 1.000 | 0.056 | 0.032 | 0.012 |
| 40–49 | 0.900 | 0.056 | 1.000 | 0.900 | 0.900 |
| 50–59 | 0.900 | 0.032 | 0.900 | 1.000 | 0.900 |
| 60–65 | 0.819 | 0.012 | 0.900 | 0.900 | 1.000 |
| Recycling_Recognition: Steel–Dwass Test | |||||
| 18–29 | 30–39 | 40–49 | 50–59 | 60–65 | |
| 18–29 | 1.000 | 0.015 | 0.900 | 0.900 | 0.852 |
| 30–39 | 0.015 | 1.000 | 0.010 | 0.118 | 0.209 |
| 40–49 | 0.900 | 0.010 | 1.000 | 0.900 | 0.831 |
| 50–59 | 0.900 | 0.118 | 0.900 | 1.000 | 0.900 |
| 60–65 | 0.852 | 0.209 | 0.831 | 0.900 | 1.000 |
| Recycling_Attitude: Steel–Dwass Test | |||||
| 18–29 | 30–39 | 40–49 | 50–59 | 60–65 | |
| 18–29 | 1.000 | 0.127 | 0.577 | 0.900 | 0.900 |
| 30–39 | 0.127 | 1.000 | 0.001 | 0.050 | 0.017 |
| 40–49 | 0.577 | 0.001 | 1.000 | 0.707 | 0.900 |
| 50–59 | 0.900 | 0.050 | 0.707 | 1.000 | 0.900 |
| 60–65 | 0.900 | 0.017 | 0.900 | 0.900 | 1.000 |
| Recycling_Behavior: Steel–Dwass Test | |||||
| 18–29 | 30–39 | 40–49 | 50–59 | 60–65 | |
| 18–29 | 1.000 | 0.397 | 0.900 | 0.900 | 0.699 |
| 30–39 | 0.397 | 1.000 | 0.049 | 0.091 | 0.018 |
| 40–49 | 0.900 | 0.049 | 1.000 | 0.900 | 0.900 |
| 50–59 | 0.900 | 0.091 | 0.900 | 1.000 | 0.900 |
| 60–65 | 0.699 | 0.018 | 0.900 | 0.900 | 1.000 |
Note: Respondent groups were based on classification questions and age, and a multiple comparison test was conducted on the scores for classification questions within each group. If normality and homoscedasticity were confirmed, Tukey’s test was performed following the significant differences observed through ANOVA. Otherwise, in cases where significant differences were detected through the Kruskal–Wallis test, a Steel–Dwass test was conducted. Only significant results are displayed.
References
- Plastics Europe. Plastics—the Facts 2022. 2022. Available online: https://plasticseurope.org/knowledge-hub/plastics-the-facts-2022/ (accessed on 1 May 2024).
- World Economic Forum, Ellen MacArthur Foundation, McKinsey & Company. The New Plastics Economy—Rethinking the Future of Plastics. 2016. Available online: https://www.ellenmacarthurfoundation.org/the-new-plastics-economy-rethinking-the-future-of-plastics (accessed on 1 May 2024).
- EPC. Directive 2004/12/EC of the European Parliament and of the Council of 11 February 2004 amending Directive 94/62/EC on packaging and packaging waste. Off. J. Eur. Union. 2004, L47, 26–31. [Google Scholar]
- EPC. Directive (EU) 2015/720 of the European Parliament and of the Council of 29 April 2015 amending directive 94/62/EC as regards reducing the consumption of lightweight plastic carrier bags. Off. J. Eur. Union. 2015, L115, 11–15. [Google Scholar]
- Japanese Ministry of Environment. Japan’s Resource Circulation Strategy for Plastics. 2019. Available online: https://www.env.go.jp/content/000050297.pdf (accessed on 1 May 2024)(English Summary).
- Japanese Ministry of Environment. Annual Report on the Environment in Japan 2023; 2023. Available online: https://www.env.go.jp/content/000175158.pdf (accessed on 1 May 2024).
- Plastic Waste Management Institute. An Introduction to Plastic Recycling 2022. 2022. Available online: https://www.pwmi.or.jp/ei/plastic_recycling_2022.pdf (accessed on 1 May 2024).
- d’Ambrières, W. Plastics recycling worldwide: Current overview and desirable changes. Field Actions Sci. Reports. J. Field Actions 2019, 19, 12–21. Available online: https://journals.openedition.org/factsreports/5102 (accessed on 1 May 2024).
- Aday, M.S.; Yener, U. Understanding the buying behaviour of young consumers regarding packaging attributes and labels. Int. J. Consum. Stud. 2014, 38, 385–393. [Google Scholar] [CrossRef]
- Klaiman, K.; Ortega, D.L.; Cloé Garnache, C. Consumer preferences and demand for packaging material and recyclability. Resour. Conserv. Recycl. 2016, 115, 1–8. [Google Scholar] [CrossRef]
- Rokka, J.; Uusitalo, L. Preference for green packaging in consumer product choices—Do consumers care? Int. J. Consum. Stud. 2008, 32, 516–525. [Google Scholar] [CrossRef]
- Yamaguchi, K.; Takeuchi, K. Consumer preferences for reduced packaging under economic instruments and recycling policy. Waste Manag. 2016, 48, 540–547. [Google Scholar] [CrossRef]
- Niedermeier, A.; Emberger-Klein, A.; Menrad, K. Drivers and barriers for purchasing green fast-moving consumer goods: A study of consumer preferences of glue sticks in Germany. J. Cleaner Prod. 2021, 284, 124804. [Google Scholar] [CrossRef]
- Japanese Consumer Affairs Agency. Japanese Consumer Affairs Agency, Regarding “Ethical Consumption” Consumer Awareness Survey Report (Japanese). 2020. Available online: https://www.caa.go.jp/policies/policy/consumer_education/public_awareness/ethical/investigation/assets/consumer_education_cms202_210323_01.pdf (accessed on 1 May 2024).
- Camilla, C.; Collins, L. Eco-Labelling: Success or failure? Environmentalist 1997, 17, 125–133. [Google Scholar] [CrossRef]
- Sharma, N.K.; Kushwaha, G.S. Eco-labels: A tool for green marketing or just a blind mirror for consumers. Electron. Green J. 2019, 1. [Google Scholar] [CrossRef]
- Meis-Harris, J.; Klemm, C.; Kaufman, S.; Curtis, J.; Borg, K.; Bragge, P. What is the role of eco-labels for a circular economy? A rapid review of the literature. J. Clean. Prod. 2021, 306, 127134. [Google Scholar] [CrossRef]
- Rex, E.; Baumann, H. Beyond ecolabels: What green marketing can learn from conventional marketing. J. Clean. Prod. 2007, 15, 567–576. [Google Scholar] [CrossRef]
- Teisl, M.F. What we may have is a failure to communicate*: Labeling environmentally certified forest products. For. Sci. 2003, 49, 668–680. [Google Scholar] [CrossRef]
- Thøgersen, J. Promoting green consumer behavior with eco-labels. In New Tools for Environmental Protection: Education Information and Voluntary Measures; Dietz, T., Stern, P.C., Eds.; National Academy Press: Washington, DC, USA, 2002; pp. 83–104. Available online: https://nap.nationalacademies.org/read/10401/chapter/6 (accessed on 1 May 2024).
- Scammon, D.L. “Information load” and consumers. J. Consum. Res. 1977, 4, 148–155. [Google Scholar] [CrossRef]
- Harms, R.; Linton, J.D. Willingness to pay for eco-certified refurbished products: The effects of environmental attitudes and knowledge. J. Ind. Ecol. 2015, 20, 893–904. [Google Scholar] [CrossRef]
- Scott, D.; Willits, F.K. Environmental attitudes and behavior: A Pennsylvania survey. Environ. Behav. 1994, 26, 239–260. [Google Scholar] [CrossRef]
- Chen, T.B.; Chai, L.T. Attitude toward the environment and green products: Consumers’ perspective. Manag. Sci. Eng. 2010, 4, 27–39. [Google Scholar]
- Swenson, M.R.; Wells, W.D. Useful correlates of pro-environmental behavior. In Social Marketing: Theoretical and Practical Perspectives; Goldberg, M.E., Fishbein, M., Middlestadt, S.E., Eds.; Psychology Press: Hove, UK, 1997; pp. 91–109. [Google Scholar] [CrossRef]
- Hirose, S. Determinants of environment-conscious behavior. Jpn. J. Soc. Psychol. 1994, 10, 44–55. [Google Scholar] [CrossRef]
- Ajzen, I. The theory of planned behavior. Organ. Behav. Hum. Decis. Process. 1991, 50, 179–211. [Google Scholar]
- Barr, S. Factors influencing environmental attitudes and behaviors: A U.K. case study of household waste management. Environ. Behav. 2007, 39, 435–473. [Google Scholar]
- Shinoki, M. A study of factors affecting recycling and waste reduction—A time-series analysis from Sendai, Japan, 2005–2015. J. Jpn. Soc. Mater. Cycles Waste Manag. 2017, 28, 58–67. [Google Scholar] [CrossRef][Green Version]
- Elrod, T.; Louviere, J.J.; Davey, K.S. An empirical comparison of ratings-based and choice-based conjoint models. J. Market. Res. 1992, 29, 368–377. [Google Scholar] [CrossRef]
- Atkinson, A.; Donev, A.; Tobias, R. Optimum Experimental Designs, with SAS; Oxford University Press: Oxford, UK, 2007. [Google Scholar] [CrossRef]
- Train, K.E. Discrete Choice Methods With Simulation; Cambridge University Press: Cambridge, UK, 2009. [Google Scholar] [CrossRef]
- Yamashige, S.; Tanaka, Y.; Abe, M. Estimation of willingness to pay for “Tokuho Labels” (Japanese). Iryo To Shakai 2015, 25, 305–319. [Google Scholar] [CrossRef]
- Global Sustainable Investment Alliance. Global Sustainable Investment Review 2020. 2021. Available online: https://www.gsi-alliance.org/trends-report-2020/ (accessed on 1 May 2024).
- Alhaddi, H. Triple bottom line and sustainability: A literature review. Bus. Manag. Stud. 2015, 1, 6–10. [Google Scholar] [CrossRef]
- Calia, R.C.; Guerrini, F.M.; de Castro, M. The impact of Six Sigma in the performance of a pollution prevention program. J. Cleaner Prod. 2009, 17, 1303–1310. [Google Scholar] [CrossRef]
- Truelove, H.B.; Yeung, K.L.; Carrico, A.R.; Gillis, A.J.; Raimi, K.T. From plastic bottle recycling to policy support: An experimental test of pro-environmental spillover. J. Environ. Psychol. 2016, 46, 55–66. [Google Scholar] [CrossRef]
- ISO 14020:2022; Environmental Statements and Programmes for Products—Principles and General Requirements Edition 3. ISO: London, UK, 2022. Available online: https://www.iso.org/standard/79479.html#lifecycle (accessed on 28 May 2024).
- Boyer, R.H.W.; Hunka, A.D.; Linder, M.; Whalen, K.A.; Habibi, S. Product labels for the circular economy: Are customers willing to pay for circular? Sustain. Prod. Consum. 2021, 27, 61–71. [Google Scholar] [CrossRef]
Disclaimer/Publisher’s Note: The statements, opinions and data contained in all publications are solely those of the individual author(s) and contributor(s) and not of MDPI and/or the editor(s). MDPI and/or the editor(s) disclaim responsibility for any injury to people or property resulting from any ideas, methods, instructions or products referred to in the content. |
© 2024 by the authors. Licensee MDPI, Basel, Switzerland. This article is an open access article distributed under the terms and conditions of the Creative Commons Attribution (CC BY) license (https://creativecommons.org/licenses/by/4.0/).

