Abstract
This study explores the integration of greywater recovery systems (GRSs) within single-family buildings across European countries. The analysis evaluates the impacts of these systems from multiple perspectives: potable water conservation, economic feasibility, energy consumption, and environmental impact. Employing life cycle cost (LCC) and net present value (NPV) analyses, the research assesses the economic viability of these systems compared to standard water installations. Positive NPV is observed in countries such as Belgium, Germany, Denmark, Finland, and Norway, according to the base scenario. Additionally, the implementation of subsidies can enhance economic incentives for adopting GRSs by reducing the payback period (PBP). Significant findings include reductions in potable water demand by up to 43.0%, and energy savings of up to 42.6% are also observed with the use of GRSs. Additionally, notably lower carbon dioxide emissions (CDEs) were reported, with reductions being directly proportional to the decreases in energy use. This holistic approach aims to establish frameworks for decision-making processes, emphasizing that economic and environmental aspects are mutually complementary and significant.
1. Introduction
Due to diminishing natural water resources and the increasing global population, the problem of searching for alternative water sources is becoming more intense. A trend in improving the management of freshwater resources is the utilization of innovative solutions [1,2].
One of the main consumers using significant amounts of drinking water is identified as the building sector [3]. It should be emphasized that not all water draw points in buildings require the supply of potable water. This creates an opportunity for the reuse of water, which, in a typical plumbing system, would be directed into the sewerage [4,5]. By using recovered water for non-potable purposes, the demand for potable water decreases, and the volume of sewage in the sewage system is reduced. This results in both environmental and economic benefits [6].
One of the solutions is hybrid systems that utilize both rainwater and greywater. This approach is due to the fact that rainwater availability is irregular and sometimes insufficient in some regions [7,8]. Leong et al. [8] emphasize the complexities of utilizing hybrid rainwater–greywater systems to mitigate water scarcity. The variability in the quality and quantity of both rainwater and greywater leads to thorough treatment processes due to the presence of various pathogens. Chen et al. [9] investigate the economic feasibility of hybrid systems by employing cooperative theory, focusing on a case study in Japan. These systems are found to be economically feasible with government subsidies. It has been noted by some researchers [10,11,12] that the community exhibits a greater willingness to use greywater for toilet flushing and irrigation. On the other hand, a decrease in interest is observed as the potential contact with greywater increases. This was determined based on a community survey, where hygiene concerns were primarily raised. The study [12] reveals that low applicability in residential buildings is observed due to the long return on investment without subsidization. Nonetheless, it could be cost-effective in households with high water consumption.
This work focuses on another group of solutions for wastewater reuse, which primarily aims at the recovery of greywater. It has been reported that 50–80% of household wastewater, excluding toilet waste, consists of greywater, marked by its low organic content and high volume, posing challenges for urban treatment facilities designed for more concentrated waste [13]. Advantages of local greywater reuse are highlighted by its availability, and benefits tied to energy and sustainability. Conversely, obstacles are identified in the problematic quality of greywater posing health risks, the absence of legal frameworks, the need for safety monitoring, and negative public perceptions [13,14,15]. In the study [16], a greywater recovery system (GRS) with an existing centralized water system is examined. Greywater is treated using submerged membrane bioreactors for reuse in non-potable applications. For single-family zones, there is a 17–49% reduction in non-potable water demand. For multi-family zones, the reduction is 6–32%. Electricity use decreases by 17–49% in single-family zones. In multi-family zones, it drops by 32–41%. Furthermore, a life cycle assessment indicates a 20–41% improvement compared to the conventional system. In the research [17], the recovery of greywater is identified as one of the components of alternative water supply systems to achieve the goal of net zero water (NZW) use. The authors conclude that, despite a significant reduction in water consumption, hybrid solutions are associated with higher costs and energy consumption. On this basis, the complexity of achieving NZW in urban areas is emphasized. Lam et al. [18], compares four water management scenarios, highlighting the decentralized anaerobic fluidized bed membrane bioreactor system for greywater recycling as the most eco-efficient option for non-potable uses in domestic buildings.
From the perspective of legislation and subsidy programs, the first sector where the requirement for wastewater recovery can be introduced is single-family housing. In a typical single-family house, the use of greywater recovery can be considered an optimal solution in the context of standard living needs. This results from the fact that the production of greywater approximately balances with its demand. For irrigation, collecting rainwater can be seen as a more favorable solution. Taking this into account, the current study focuses on the application of greywater recovery in the single-family housing sector. European countries are considered, due to the adoption of water supply and sewage market data from report [19] as input variables.
Based on the literature review conducted, it is observed that GRSs are primarily analyzed for their economic viability. Here, the main novelty can be identified as the analysis from multiple perspectives:
- ▪ potable water conservation;
- ▪ economic feasibility;
- ▪ energy consumption;
- ▪ environmental impact.
The primary objective of this research is to evaluate the integration of GRS in single-family buildings across European countries, focusing on these four areas. Traditional analyses of GRS primarily concentrate on their economic viability. However, this study aims to bridge a significant research gap by providing a comprehensive analysis from multiple perspectives. This holistic approach allows the coupling between water resources, investment profitability, and the impact of energy consumption on CO2 emissions to be captured.
The critical research questions addressed in this study are:
- ▪ How does greywater recovery contribute to sustainable water management in single-family houses?
- ▪ What are the economic, environmental, and energy consumption implications of adopting GRS compared to conventional water use strategies?
By answering these questions, the study aims to offer valuable insights into the water–energy–carbon nexus, thereby contributing to the development of sustainable water management practices [20].
The structure of this paper is organized as follows. After the introduction, the integration of greywater recycling into building design is described. Additionally, information regarding the modeling of water consumption in single-family houses, along with a financial analysis, energy consumption, and assessment of carbon dioxide emission, is discussed. Subsequently, the results are obtained and the discussion thereof is presented. Finally, the conclusions are listed.
2. Materials and Methods
This part explains the materials and methods of this study. First, in Section 2.1, integrating greywater recycling into building design is discussed. Then, in Section 2.2 and Section 2.3, the details about the daily water consumption profile and financial analysis are given. In Section 2.4, the way to determine energy consumption and carbon dioxide emissions is explained. Finally, in Section 2.5, the limitations of the used input data are disclosed.
2.1. Integrating Greywater Recycling into Building Design
The classic solution for the building is to use a sewerage system that discharges mixed domestic wastewater, which includes both blackwater and greywater. However, this approach restricts the potential for reusing greywater. To enable the use of alternative water sources in the building, a dual plumbing system must be designed, with one system for blackwater (fecal sewage) and another for greywater. According to the standard EN 16941 [21], greywater is defined as wastewater from the kitchen (sink, dishwasher), the bathroom (shower, bath, sink), and the washing machine. Light greywater specifically refers to wastewater from showers, bathtubs, hand wash basins and washers, excluding kitchen wastewater (sink, dishwasher) due to its higher organic and grease content. The options for the collection and use of light greywater in the analyzed solution are shown in Figure 1.
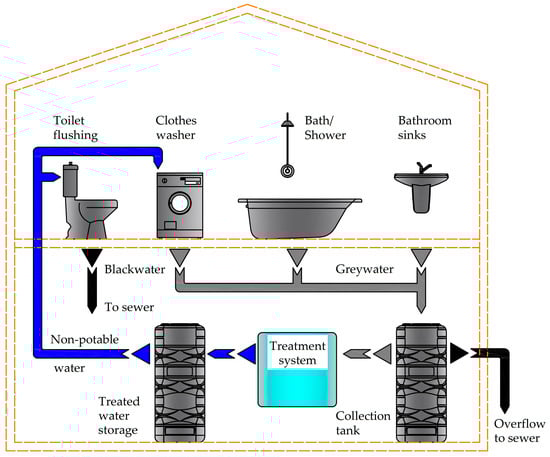
Figure 1.
Schematic of the proposed GRS in a single-family house.
The treated greywater can be used for non-potable purposes such as flushing toilets, washing clothes and watering the garden (see Figure 1). This requires separate and unconnected water supply systems, one for drinking water and the other for treated greywater. The implementation of a greywater recovery and reuse system in a building is only feasible if the wastewater has been treated to meet the accepted quality requirements for bacteriological and physicochemical properties [21]. Greywater recycling systems can vary in terms of treatment method and resulting water disinfection. Various methods are available for treating greywater, including physical, chemical, biological, or a combination of these methods. The solution described involves collecting grey sewage through an internal sewer and storing it in a tank equipped with an emergency overflow to direct excess liquid to the external sewer. Furthermore, it is important to ensure that the tank capacity is suitable for the yield of greywater. After undergoing the treatment process, the water is directed to a storage tank. The water may be further disinfected using methods such as ultraviolet rays or chemicals before it is used in the domestic water supply for washing or flushing toilets.
2.2. Daily Water Consumption Profile
The development of a water usage simulation for a single-family house utilizes a detailed Matlab script. It includes input variables such as the number of occupants, and the average daily water usage per person. It accounts for the weekly variations in water use, differentiating between weekdays and weekends, with the observation that Saturday marks the peak of water consumption. To add realism to the simulation, a variance of ±30% on the daily water consumption has been introduced to reflect daily fluctuations.
While the average European household size is around two people, this figure includes multi-family buildings [19]. It is assumed that single-family houses, which are the focus of this study, typically have a higher average household size. For the purpose of simplification and to better reflect the actual situation in single-family homes, a household size of four people is considered. Based on data from the same report [19], it is determined that the average water consumption is 125 L per person per day, which is adopted for further analysis. This standardization helps establish consistent input conditions for the comparative analysis, allowing for a clearer identification of trends and their justification.
In this simulation, categorizing water usage is crucial for two primary reasons: it enables the estimation of potential greywater production and helps in assessing the household’s greywater needs. The consumption categories analyzed include showering/bathing, laundry, handwashing, toilet flushing, dishwashing, and cooking [22,23], as these activities significantly contribute to the total water usage and thus the potential for greywater recycling. This can be written as:
Based on the comprehensive review paper [24], the daily probability of using water draw-off points was adopted. Finally, the developed simulation model generates an annual profile of water consumption in a household on a daily step, detailing the draw-off in the adopted categories of water consumption.
The model for simulating the performance of a GRS operates on a daily balance principle, asserting that the sum of greywater utilized each day cannot exceed the total daily greywater generated and stored within the system (Equations (2) and (3)). If the demand for greywater exceeds the current supply, the system is supplemented with water from the municipal supply. The inclusion of the washing machine as both a source and a use of greywater aligns with the standards outlined in reference [21].
2.3. Financial Analysis
The economic feasibility of GRSs is evaluated using life cycle cost (LCC), net present value (NPV), and payback period (PBP) analyses, taking into account a set of basic assumptions listed in Table 1. What needs to be emphasized is that Variant 0 (V0) represents the conventional plumbing system in a single-family house, while Variant 1 (V1) integrates a GRS into the conventional setup. Therefore, the economic analysis only considers the difference in additional costs resulting from the implementation of the GRS. It is assumed that the cost of conventional installation in both V0 and V1 are approximately the same.

Table 1.
Basic assumptions adopted for the analysis of greywater recovery.
The conducted LCC analysis assess the financial performance of various installation options, incorporating initial capital costs (ICCs), utility costs (UCs), but excluding disposal costs (DCs) [10,26]. As ICCs, only the costs of installing a GRS in a new single-family house are assumed. The formula for LCC is given by:
The NPV analysis complements the LCC by evaluating the profitability of the GRS. It calculates the present value of all cash flows (CFs) associated with the project, both inflows and outflows, over its entire life. The formula for NPV is:
PBP is ascertained by determining the time needed to recover the cost of an investment. The PBP value in years is taken as the first year in the analyzed period when the NPV turns positive.
2.4. Determining Energy Consumption and Carbon Dioxide Emissions
The calculation of annual energy consumption for a single household (Euse) is derived from the cumulative energy consumption factor for the extraction, treatment, and distribution of drinking water, and for the collection and treatment of wastewater (EFcumulative), as reported in [19]. The report separately provides data for water supply and wastewater collection. For further analysis, the sum of these values is adopted as EFcumulative. Additionally, the annual water consumption by the household (Vtotal) must be taken into account. The formula for this calculation is expressed as follows:
To estimate carbon dioxide emissions (CDEs) based on the given energy consumption, it is essential to understand that, according to literature data, the majority of the energy required for water and wastewater services is electrical. For simplification, carbon dioxide emission factors (CDEFs) for electricity generation are applied. This approach is justified by findings that emissions from electricity constitute the largest share of water-related energy emissions in 98% of the investigated drinking water utilities, as reported in [27]. It is important to note, however, that wastewater treatment utilities consume more fuel for heating purposes (e.g., natural gas), but electricity still accounts for approximately 88% of their energy use [27]. The formula for calculating CDE is given by:
The CDEFs for gross electricity production in European countries, which account for combustion emissions, fuel upstream emissions, and construction emissions, were adopted according to [28].
2.5. Limitations of Used Input Data
The exclusion of some European countries is due to challenges highlighted in [19], which serves as the input data for our comparative analysis and the applicability of GRS. Figures 3, 4, and 6 show that not all countries have complete data sets needed for the conducted analyses.
Firstly, the diversity of national figures poses significant challenges, as data collection methods and standards vary widely across countries, making uniform reporting difficult. Additionally, specific data are not collected in some countries due to differences in national regulations, priorities, or resource availability, leading to gaps in the dataset beyond the authors’ control.
For coherence in our comparative analysis, data from countries with comprehensive information in four analyzed areas—water consumption, water tariffs, energy consumption, and consequently, CDEs for countries with provided energy consumption data—are utilized.
3. Results and Discussion
A comprehensive analysis of the integration of greywater recovery in a single-family building is conducted, based on the methodology described in Section 2. It is compared with a standard water installation from the perspectives of potable water savings, economic benefits, reduction in energy consumption for potable water supply and sewage collection, and the potential to mitigate CDEs.
3.1. Comparative Analysis of Potable Water Consumption
Based on the information provided in Section 2.2 and Equation (1), the daily water consumption profile divided into typical usage categories for single-family houses is generated, assuming a four-person household. The water consumption per resident is averaged at 125.0 L per day. The results of the simulation generating daily water consumption by category throughout the year are shown in Figure 2a. A detailed analysis of the possibilities for reducing the demand for potable water requires precise determination of greywater yield and demand as per Equations (2) and (3). The profile of water usage across different categories enables the creation of a balance of greywater demand and supply over consecutive days of the year.
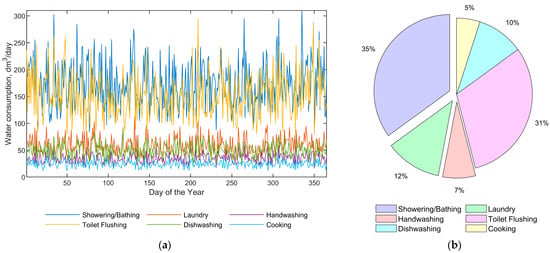
Figure 2.
Daily water consumption profile divided into typical usage categories in single-family houses: (a) Daily water consumption by category throughout the year; (b) Average share of each category in total water consumption.
As a result of the simulation, the average share of each category in total water consumption is obtained, as depicted in Figure 2b. It shows the breakdown of daily water consumption, revealing that showering/bathing and toilet flushing are the primary uses, accounting for 35% and 31% of the total, respectively. These two categories alone indicate substantial potential for greywater collection and reuse. This is significant as the yielded greywater covers the categories with the highest demand.
In Figure 3, the potable water consumption per person across various European countries is depicted. A comparative analysis of the V0 and V1 systems was conducted to assess the justification for using greywater recovery. This allowed for the determination of the reduction in potable water demand in a single-family house with the proposed V1 system. As a starting point for the analysis, data on water consumption according to the report [19], along with generated water consumption profiles divided into categories of usage, are used. The data on potable water consumption per person reveal a significant reduction when transitioning from the standard water system V0 to the V1 with GRS. The analysis determines that the application of a GRS can reduce potable water consumption by up to 43.0% per user. On average, the consumption for V0 is calculated at 124.2 L per person, while V1 shows a decreased consumption at 70.8 L per person. Notably, Italy demonstrates the highest consumption for V0 at 222.8 L, with a substantial decrease to 127.0 L for V1. Conversely, the lowest consumption rates are observed in Malta, showing 75.0 L for V0 and 42.7 L for V1. The obtained results highlight the potential for water conservation through the adoption of GRS in single-family buildings.
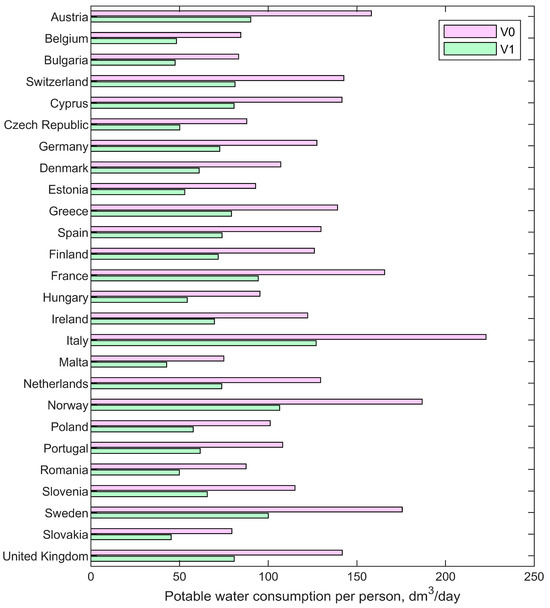
Figure 3.
Potable water consumption per person in various European countries.
3.2. Comparative Analysis of Economic Viability
Average water and sewerage prices in European countries are sourced from the report [19]. For Germany, the methodology from [25] is applied due to the absence of this data in the original report. Attention is drawn to the fact that the charge for water supply and sewage collection is referenced to the cubic meter of water consumption. This is because sewage collection is billed based on the water meter reading from the water supply network. Charges across European countries tend to vary significantly, as evidenced by Figure 4. The price per cubic meter of water is observed to range widely, with countries like Denmark and Norway exhibiting some of the highest prices, at EUR 9.32 and EUR 6.24, respectively. On the other hand, Greece and Romania are noted for having some of the lowest, at EUR 1.23 and EUR 1.57, respectively. The mean and median prices for Europe are calculated to be EUR 3.62 and EUR 3.31 per cubic meter, respectively. It is emphasized that the determined average daily consumption of potable water per person in a household, equal to 124.2 L per day, is adopted for further analysis.
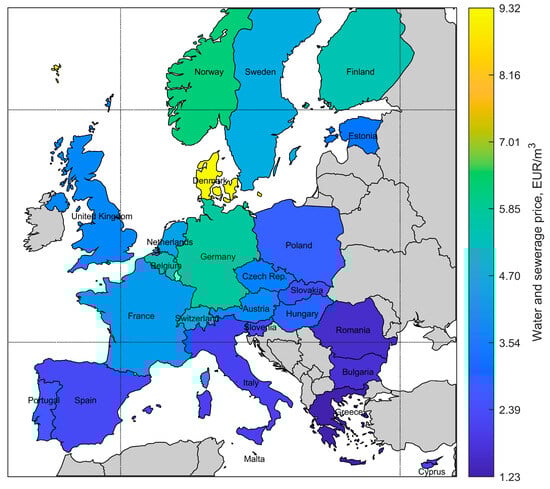
Figure 4.
Map of average water and sewerage prices in European countries [19].
Based on the assumptions outlined in Table 1 and incorporating the average water and sewage prices as depicted in Figure 4, the NPV and LCC for two variants, V0 and V1, are calculated. The outcomes of these calculations are presented in Figure 5. It is observed that the financial outcomes vary significantly across countries. Positive NPVs, indicating the profitability of the investment, are obtained for five countries: Belgium with EUR 9, Germany with EUR 466, Denmark with EUR 4878, Finland with EUR 108, and Norway with EUR 1072. Consequently, the LCC in these countries is more favorable for the system V1 with GRS. It demonstrates that while initial costs may be higher for V1, the investment could lead to long-term financial benefits. It is highlighted that these are the countries with the most elevated water and sewage prices among those analyzed.
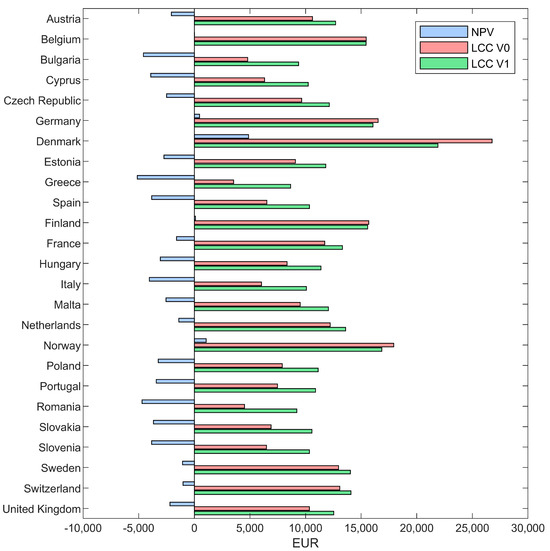
Figure 5.
Comparison of NPV and LCC values for the application of GRS in various European countries.
Subsequently, a sensitivity analysis is conducted on the obtained LCC and PBP values by changing key parameters such as household water consumption, increase in water supply and sewage collection prices, the discount rate, and reduction in investment costs through subsidies. Other assumptions are adopted for the financial analysis according to the initial assumptions listed in Table 1. The results are presented in Table 2, Table 3, Table 4 and Table 5, including only those countries where a PBP of less than 20 years is achieved.
Table 2.
Analysis of the impact of annual household water consumption on the investment’s profitability.
Table 3.
Analysis of the impact of annual increase in water supply and sewage collection prices on the investment’s profitability.
Table 4.
Analysis of the impact of discount rate on the investment’s profitability.
Table 5.
Analysis of the impact of potential subsidies on the investment’s profitability.
Table 2 shows the impact of annual household water consumption on the profitability of investment in the V1 system employing GRS. The PBP is used to evaluate profitability, while the comparison between V0 and V1 variants is assessed by the LCC calculated for the assumed lifespan of the systems set at 20 years. It is noted that with the increase in water consumption, the PBP for the V1 system decreases. This justifies the implementation of GRS in single-family buildings characterized by high water consumption. In Belgium, the PBP for V1 is reduced from 35 to 18 years as consumption increases from 125 to 200 m3/year. A similar trend is observed in Denmark, where V1’s PBP decreases from 16 to 9 years with rising consumption. Finland, Germany, and Norway also show reductions in PBP as annual water use grows. It is observed that the LCC for V0 is always lower than V1 when the PBP exceeds 20 years.
Table 3 illustrates an analysis focused on how the annual increases in water supply and sewage collection prices influence the profitability of investment in system V1. As shown, with a 2% annual price increase, Belgium has a PBP of 23 years for V1, which drops to 16 years as the increase reaches 6%. In Denmark, the PBP for V1 decreases from 11 years to 9 years as the price rise changes from 2% to 6%. The Netherlands, featuring the longest PBP at 35 years, exhibit a reduction to 20 years with a 6% price increase. As prices increase, the profitability of using GRS is enhanced. In considering investments in GRS in single-family buildings, rising trends in water and sewage charges must be taken into account, as they significantly influence the shortening of PBP.
Table 4 assesses how the profitability of investments in water system V1 is sensitive to changes in the discount rate, with scenarios being presented at 5.0%, 7.5%, and 10.0%. As the discount rate increases from 5.0% to 10.0%, there is a significant decrease in the LCC across all countries, due to the reduced present value of future cash flows. However, this increase also leads to a longer PBP. Denmark exhibits an increase in PBP from 11 to 15 years as the discount rate rises. The steady increase in PBP with the rising discount rate can be observed, highlighting a decrease in the investment returns. At the 10.0% discount rate, the PBP becomes not calculable for all countries except Denmark, suggesting that the investment is not profitable within the adopted lifespan of the system. Due to the high initial cost of the investment, the investment’s profitability exhibits considerable sensitivity to an increase in the discount rate. It is only in Denmark, where operational costs are the highest, that an acceptable compensation for the reduction in the value of future cash flows with the rise of the discount rate is observed.
In Table 5, a comparison is shown regarding how subsidies might affect the profitability of investments. Two subsidy amounts, EUR 1000 and EUR 2000, are analyzed. In both subsidy scenarios for Belgium, Denmark, Finland, Germany, and Norway, it is found that the LCC for the system V1 is lower than that for the standard system V0. Additionally, a reduction in the PBP by an average of 3 years is achieved when a EUR 2000 subsidy is applied. In Denmark, where charges are the highest, significant benefits from the subsidy are observed, with a decrease in PBP to 9 and 7 years, respectively. However, the V1 system is found to be profitable even without subsidies. France, with an initial PBP of 24 years, shows a considerable decrease to 18 years when the higher EUR 2000 subsidy is applied. Similar trends are observed in the Netherlands, Sweden, and Switzerland, where only the increased subsidy correlates with a PBP below 20 years. The conducted analysis reveals that additional financing for the implementation of GRS could be notable in promoting this solution. As a result, subsidies can reduce the PBP, enhancing the economic benefits and accelerating the adoption of water-saving approaches in single-family houses.
3.3. Comparative Analysis of Energy Consumption
Drawing from [19], the cumulative energy consumption, termed EFcumulative, for the extraction, treatment, and distribution of drinking water, as well as the collection and treatment of wastewater, has been established. The outcomes are illustrated in Figure 6, where Finland exhibits the highest rate of EFcumulative at 1.88 kWh/m3, while Estonia presents the lowest at 0.94 kWh/m3. An average EFcumulative of 1.44 kWh/m3 is derived from the available data. Through the application of GRS, countries where water treatment and sewage collection processes are highly energy-intensive exhibit a greater potential for reducing energy demand.
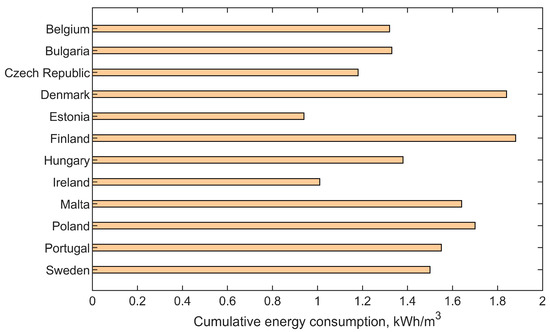
Figure 6.
Cumulative energy consumption for the extraction, treatment, and distribution of drinking water, and for the collection and treatment of wastewater [19].
Employing Equations (1) and (6) and considering the data presented in Figure 6, the annual cumulative energy consumption for both the conventional water system (V0) and the water system with GRS (V1) was evaluated. This comparative analysis, visualized in Figure 7, shows that V0’s energy use spans from 168.47 kWh in Estonia to 336.22 kWh in Finland, whereas V1 demonstrates significant energy savings—with consumption dropping to 96.71 kWh for Estonia and 193.00 kWh for Finland, resulting in a 42.60% decrease. A direct correlation is observed between the decrease in energy demand for water distribution and sewage collection and the achieved reduction in the demand for potable water. This could result in the wider adoption of GRS in single-family houses.
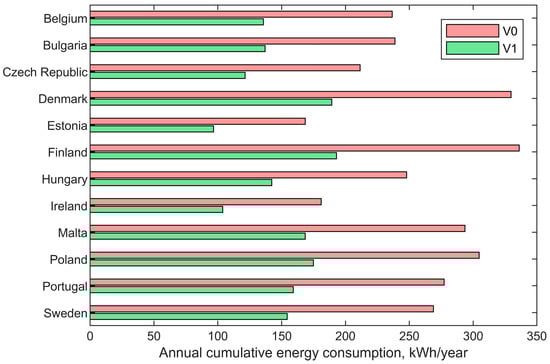
Figure 7.
Comparative analysis of annual cumulative energy consumption for standard water system (V0) versus water system with GRS (V1).
3.4. Comparative Analysis of CDE
According to [28], the CDEF associated with the production of electrical energy is estimated, and the respective values are illustrated in Figure 8. The CDEF is determined for the EFcumulative of the countries analyzed in the previous section. The CDEF ranges from a remarkably low 0.03 kgCO2/kWh for Sweden to a higher 0.75 kgCO2/kWh for Poland. An average CDEF of 0.30 kgCO2/kWh is established for the 27 EU countries. Significant variations in the CDEF can be observed, which are clearly linked to the energy mix of the respective country.
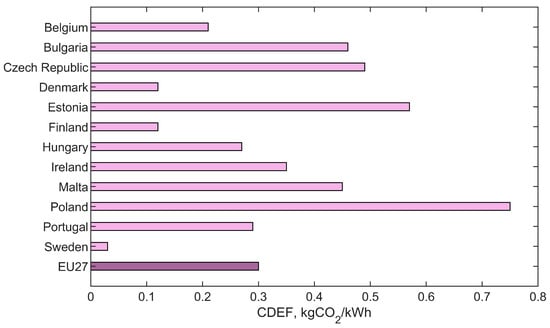
Figure 8.
Carbon dioxide emissions from gross electricity production in European countries related to combustion emissions, fuel upstream emissions, and construction emissions [28].
In order to assess the implementation potential of GRS from an environmental perspective, a comparative analysis of the annual CDE for the conventional water system (V0) and the water system with GRS (V1) is conducted. Figure 9 illustrates the results obtained by combining Equation (7) with the data from Figure 7 and Figure 8.
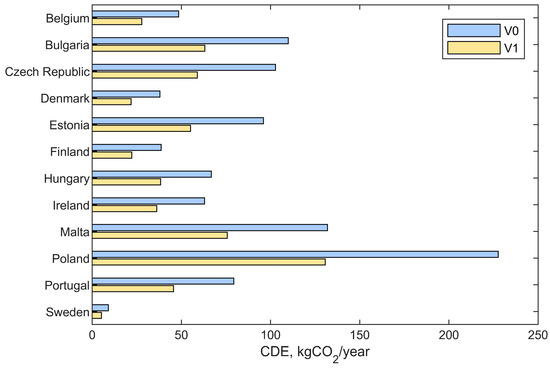
Figure 9.
Annual carbon dioxide emissions comparison for standard water system (V0) versus water system with GRS (V1).
A significant contrast in CDE reduction can be observed between system V0 and the proposed system V1 across European countries. Poland is noted for the most significant decrease, with a CDE reduction for V0 observed at 227.65 kgCO2/year, and for V1 at 130.68 kgCO2/year, indicative of the country’s highest CDEF and a substantial EFcumulative. In contrast, Sweden, with its minimal CDEF, is associated with the smallest reduction in CDEs, dropping from 9.06 kgCO2/year for V0 to 5.20 kgCO2/year for V1. The proposed V1 system, utilizing GRS, is found to allow a reduction in CDE up to 42.60%. It is highlighted that the drop in CDEs is directly proportional to the decrease in Euse. The transition to GRS demonstrates a consistent trend of CDE reduction, highlighting the extensive potential for mitigating environmental impact. It can lead to notable decreases in CDEs, with some countries like Poland benefiting more due to their specific circumstances in terms of CDEF and EFcumulative.
3.5. Discussion with Other Studies
The findings of this study are compared with those of similar research to provide a broader context. The reduction in potable water demand by up to 43.0% observed in this study aligns with other studies, such as the reduction of 17–49% in single-family zones and 6–32% in multi-family zones reported in hybrid systems with membrane bioreactors [16], and the savings of 55.3% in commercial hybrid rainwater–greywater systems [29]. In a residential complex in Colombia, a GRS achieves a potable water saving of 44% [12]. In Australia, a combination of alternative water supplies and water-efficient appliances saves up to 77% of total potable water use [11]. In Los Angeles, greywater recovery reduces potable water demand by 27% in single-family buildings and 38% in multi-family buildings [30].
Here, economic feasibility is confirmed by the positive NPV and PBP below 20 years. In India, domestically produced systems are more cost-effective than imported ones, with benefit–cost ratios of 2.09 and 1.59, respectively [26]. The selected configuration in Colombia shows a rate of return on investment of 6.5% and an estimated payback period of 23 years [12]. The Interior Customized Greywater System in Taiwan has a minimum PBP of 4 years [31].
Significant energy savings of up to 42.60% in this study are comparable to the 17–49% savings in single-family zones and 32–41% in multi-family zones [16]. In Los Angeles, greywater recycling can reduce water supply- and treatment-related energy consumption by 43,000 MW·h/year [30].
Furthermore, the reductions in CDE have not previously been studied in the manner presented by the authors. This comprehensive comparison highlights the effectiveness and benefits of GRS in diverse geographical and technological contexts.
4. Conclusions
A holistic approach to the analysis of GRS application in single-family buildings is aimed at establishing frameworks for decision-making processes. Importantly, and requiring emphasis, economic and environmental aspects are considered to be mutually complementary and significant. A comprehensive comparative analysis is provided which considers potable water conservation, economic feasibility, energy consumption, and environmental impact. The following findings can be listed from this investigation:
- GRSs significantly reduce potable water demand, up to 43.0% per user, compared to traditional systems;
- Positive NPV is observed in countries such as Belgium, Germany, Denmark, Finland, and Norway, according to the base scenario;
- The implementation of subsidies can reduce the PBP, enhancing economic incentives for adopting GRSs;
- Significant energy savings of up to 42.60% are observed with the use of GRSs;
- Notable reductions in CDEs, with reductions directly proportional to the decreases in energy use;
- The highest CDE reduction was observed in Poland, from 227.65 to 130.68 kgCO2/year.
Moreover, further studies are recommended to explore the scalability and applicability of GRSs in different types of residential and public utility buildings. Future research on the social aspects of GRS adoption, such as public perceptions, is also recommended. Additionally, optimizing greywater treatment technologies to improve efficiency and safety in different applications is proposed for future research.
Author Contributions
Conceptualization, K.R.; methodology, K.R.; software, K.R.; validation, K.R.; formal analysis, K.R. and S.E.; investigation, K.R.; data curation, K.R.; writing—original draft preparation, K.R. and S.E.; writing—review and editing, K.R., S.E. and A.S.; visualization, K.R. and S.E.; supervision, K.R. All authors have read and agreed to the published version of the manuscript.
Funding
This research received no external funding.
Institutional Review Board Statement
Not applicable.
Informed Consent Statement
Not applicable.
Data Availability Statement
Data is contained within the article.
Conflicts of Interest
The authors declare no conflicts of interest.
Nomenclature
| CDE | Carbon dioxide emission, kgCO2/year |
| CDEF | Carbon dioxide emission factor, kgCO2/kWh |
| Euse | Electric energy demand, kWh/year |
| EFcumulative | Cumulative energy consumption factor for the extraction, treatment, and distribution of drinking water, and for the collection and treatment of wastewater, kWh/m3 |
| GW | Greywater |
| GRS | Greywater recovery system |
| LCC | Life cycle cost, EUR |
| NPV | Net present value, EUR |
| PBP | Payback period, year |
| V | Water consumption, dm3/day |
References
- Boretti, A.; Rosa, L. Reassessing the Projections of the World Water Development Report. NPJ Clean Water 2019, 2, 15. [Google Scholar] [CrossRef]
- United Nations. The United Nations World Water Development Report 2023: Partnerships and Cooperation for Water; UNESCO: Paris, France, 2023. [Google Scholar]
- Mannan, M.; Al-Ghamdi, S.G. Environmental Impact of Water-Use in Buildings: Latest Developments from a Life-Cycle Assessment Perspective. J. Environ. Manag. 2020, 261, 110198. [Google Scholar] [CrossRef] [PubMed]
- Shaikh, I.N.; Ahammed, M.M. Quantity and Quality Characteristics of Greywater: A Review. J. Environ. Manag. 2020, 261, 110266. [Google Scholar] [CrossRef] [PubMed]
- Kordana-Obuch, S.; Starzec, M.; Wojtoń, M.; Słyś, D. Greywater as a Future Sustainable Energy and Water Source: Bibliometric Mapping of Current Knowledge and Strategies. Energies 2023, 16, 934. [Google Scholar] [CrossRef]
- Elhegazy, H.; Eid, M.M.M. A State-of-the-Art-Review on Grey Water Management: A Survey from 2000 to 2020s. Water Sci. Technol. 2020, 82, 2786–2797. [Google Scholar] [CrossRef] [PubMed]
- Stec, A.; Kordana, S. Analysis of Profitability of Rainwater Harvesting, Gray Water Recycling and Drain Water Heat Recovery Systems. Resour. Conserv. Recycl. 2015, 105, 84–94. [Google Scholar] [CrossRef]
- Leong, J.Y.C.; Oh, K.S.; Poh, P.E.; Chong, M.N. Prospects of Hybrid Rainwater-Greywater Decentralised System for Water Recycling and Reuse: A Review. J. Clean. Prod. 2017, 142, 3014–3027. [Google Scholar] [CrossRef]
- Chen, W.; Gao, W.; Wei, X.; Gong, Y. Economic Analysis of Hybrid Rainwater-Greywater Systems between Demand and Supply Sides Based on Cooperative Theory. J. Clean. Prod. 2023, 382, 135283. [Google Scholar] [CrossRef]
- Stec, A.; Słyś, D. Financial and Social Factors Influencing the Use of Unconventional Water Systems in Single-Family Houses in Eight European Countries. Resources 2022, 11, 16. [Google Scholar] [CrossRef]
- Muthukumaran, S.; Baskaran, K.; Sexton, N. Quantification of Potable Water Savings by Residential Water Conservation and Reuse—A Case Study. Resour. Conserv. Recycl. 2011, 55, 945–952. [Google Scholar] [CrossRef]
- Oviedo-Ocaña, E.R.; Dominguez, I.; Ward, S.; Rivera-Sanchez, M.L.; Zaraza-Peña, J.M. Financial Feasibility of End-User Designed Rainwater Harvesting and Greywater Reuse Systems for High Water Use Households. Environ. Sci. Pollut. Res. 2018, 25, 19200–19216. [Google Scholar] [CrossRef] [PubMed]
- Van de Walle, A.; Kim, M.; Alam, M.K.; Wang, X.; Wu, D.; Dash, S.R.; Rabaey, K.; Kim, J. Greywater Reuse as a Key Enabler for Improving Urban Wastewater Management. Environ. Sci. Ecotechnol. 2023, 16, 100277. [Google Scholar] [CrossRef] [PubMed]
- Oron, G.; Adel, M.; Agmon, V.; Friedler, E.; Halperin, R.; Leshem, E.; Weinberg, D. Greywater Use in Israel and Worldwide: Standards and Prospects. Water Res. 2014, 58, 92–101. [Google Scholar] [CrossRef] [PubMed]
- Vuppaladadiyam, A.K.; Merayo, N.; Prinsen, P.; Luque, R.; Blanco, A.; Zhao, M. A Review on Greywater Reuse: Quality, Risks, Barriers and Global Scenarios. Rev. Environ. Sci. Biotechnol. 2019, 18, 77–99. [Google Scholar] [CrossRef]
- Jeong, H.; Broesicke, O.A.; Drew, B.; Crittenden, J.C. Life Cycle Assessment of Small-Scale Greywater Reclamation Systems Combined with Conventional Centralized Water Systems for the City of Atlanta, Georgia. J. Clean. Prod. 2018, 174, 333–342. [Google Scholar] [CrossRef]
- Naserisafavi, N.; Yaghoubi, E.; Sharma, A.K. Alternative Water Supply Systems to Achieve the Net Zero Water Use Goal in High-Density Mixed-Use Buildings. Sustain. Cities Soc. 2022, 76, 103414. [Google Scholar] [CrossRef]
- Lam, C.-M.; Leng, L.; Chen, P.-C.; Lee, P.-H.; Hsu, S.-C. Eco-Efficiency Analysis of Non-Potable Water Systems in Domestic Buildings. Appl. Energy 2017, 202, 293–307. [Google Scholar] [CrossRef]
- EurEau. Europe’s Water in Figures: An Overview of the European Drinking Water and Waste Water Sectors; The European Federation of National Associations of Water Services: Brussels, Belgium, 2021. [Google Scholar]
- Yateh, M.; Li, F.; Tang, Y.; Li, C.; Xu, B. Energy Consumption and Carbon Emissions Management in Drinking Water Treatment Plants: A Systematic Review. J. Clean. Prod. 2024, 437, 140688. [Google Scholar] [CrossRef]
- EN 16941-2:2021; On-Site Non-Potable Water Systems–Part 2: Systems for the Use of Treated Greywater. European Committee for Standardization: Brussels, Belgium, 2021.
- Willis, R.M.; Stewart, R.A.; Giurco, D.P.; Talebpour, M.R.; Mousavinejad, A. End Use Water Consumption in Households: Impact of Socio-Demographic Factors and Efficient Devices. J. Clean. Prod. 2013, 60, 107–115. [Google Scholar] [CrossRef]
- Englart, S.; Jedlikowski, A. The Influence of Different Water Efficiency Ratings of Taps and Mixers on Energy and Water Consumption in Buildings. SN Appl. Sci. 2019, 1, 525. [Google Scholar] [CrossRef]
- Mazzoni, F.; Alvisi, S.; Blokker, M.; Buchberger, S.G.; Castelletti, A.; Cominola, A.; Gross, M.-P.; Jacobs, H.E.; Mayer, P.; Steffelbauer, D.B.; et al. Investigating the Characteristics of Residential End Uses of Water: A Worldwide Review. Water Res. 2023, 230, 119500. [Google Scholar] [CrossRef] [PubMed]
- Lauruschkus, F.; Meermann, K.; Bürger, K.; Albrecht, H. VEWA-Comparison of European Water and Wastewater Prices; BDEW, German Association of Energy and Water Industries: Berlin, Germany, 2015; Available online: https://www.lebensraumwasser.com/wp-content/uploads/2019/10/BDEW_VEWA_Study_English_20150423.pdf (accessed on 30 May 2024).
- Sarkar, D. Life Cycle Costing Analysis of Grey Water Recycling Systems for Commercial and Residential Projects of Ahmedabad, India. Mater. Today Proc. 2023, 77, 254–259. [Google Scholar] [CrossRef]
- Zib, L.; Byrne, D.M.; Marston, L.T.; Chini, C.M. Operational Carbon Footprint of the U.S. Water and Wastewater Sector’s Energy Consumption. J. Clean. Prod. 2021, 321, 128815. [Google Scholar] [CrossRef]
- Scarlat, N.; Prussi, M.; Padella, M. Quantification of the Carbon Intensity of Electricity Produced and Used in Europe. Appl. Energy 2022, 305, 117901. [Google Scholar] [CrossRef]
- Leong, J.Y.C.; Balan, P.; Chong, M.N.; Poh, P.E. Life-Cycle Assessment and Life-Cycle Cost Analysis of Decentralised Rainwater Harvesting, Greywater Recycling and Hybrid Rainwater-Greywater Systems. J. Clean. Prod. 2019, 229, 1211–1224. [Google Scholar] [CrossRef]
- Yu, Z.L.T.; Deshazo, J.R.; Stenstrom, M.K.; Cohen, Y. Cost–Benefit Analysis of Onsite Residential Graywater Recycling: A Case Study on the City of Los Angeles. J. AWWA 2015, 107, E436–E444. [Google Scholar] [CrossRef]
- Juan, Y.-K.; Chen, Y.; Lin, J.-M. Greywater Reuse System Design and Economic Analysis for Residential Buildings in Taiwan. Water 2016, 8, 546. [Google Scholar] [CrossRef]
Disclaimer/Publisher’s Note: The statements, opinions and data contained in all publications are solely those of the individual author(s) and contributor(s) and not of MDPI and/or the editor(s). MDPI and/or the editor(s) disclaim responsibility for any injury to people or property resulting from any ideas, methods, instructions or products referred to in the content. |
© 2024 by the authors. Licensee MDPI, Basel, Switzerland. This article is an open access article distributed under the terms and conditions of the Creative Commons Attribution (CC BY) license (https://creativecommons.org/licenses/by/4.0/).