Abstract
In order to promote the healthy development of China’s fund market and alleviate the phenomenon of “funds make money, investors don’t”, this paper explores the impact and economic consequences of fund signals on investors’ decisions in China. An analysis of quarterly Chinese fund data from January 2010 to December 2022 finds that Chinese investors tend to rely on strong signals and flow their money to highly rated or high-yielding funds. Sustainability is an integral part of ESG ratings, which have gradually become a focal point in the international investment market, but the lack of a platform to display ESG ratings in China has prevented investors from effectively utilizing these ratings in their investment decisions. The study also found that individual investors prefer short- and medium-term returns, while both institutional and individual investors chase ratings, with individual investors relying more on these signals. In addition, strong signals are not effective in predicting fund performance returns, while ESG ratings show significant positive predictive effects, validating the irrational preference of Chinese investors to blindly follow strong signals.
1. Introduction
Fund investors are the foundational elements of the fund market. To cultivate a robust and well-regulated market, it is imperative to enhance relevant systems and regulations, drawing on the experiences of developed foreign markets and tailoring measures to the actual circumstances of domestic investors in China. This approach aims to effectively safeguard the interests of fund investors, making a comprehensive understanding of their decision-making mechanisms a prerequisite and basis for this study. Given that China’s capital market developed later than its Western counterparts, individual investors still dominate market volatility. Unlike institutional investors, individual investors often lack professional expertise, and the incentives for both sales organizations and fund companies differ significantly from those in European and American markets (Li and Liu, 2019) [1]. Therefore, due to the unique characteristics of the Chinese fund market and the multifaceted constraints faced by investors, the behavior of Chinese fund investors exhibits distinct patterns, warranting in-depth examination in this paper. This study aims to explore the impact of fund signals on investors’ decision making and the subsequent economic consequences to better understand the behavioral decisions of fund investors in China and contribute to the high-quality development of China’s fund industry.
In traditional financial theory, investors are presumed to be rational agents with unlimited attention, capable of obtaining and processing all market information. Investors should use Bayesian learning to interpret historical fund performance, form rational expectations about a fund’s abilities, and make informed investment decisions (Berk and Green, 2004) [2]. However, behavioral finance developments suggest that limited attention is more realistic; investors often focus on a limited number of signals due to their specialization, knowledge structure, and time constraints, leading to biases in the investment process. Research indicates a significant relationship between fund performance and capital flows (Vozlyublennaia and Wu, 2018) [3], and between fund flows and Morningstar ratings (Reuter and Zitzewitz, 2021) [4]. Additionally, socially responsible investing (SRI) enhances capital flows (Pablo et al., 2019) [5], while simple signals on cash flows, as opposed to more complex factors, have a stronger appeal (Ben-David, 2022) [6]. Further studies show that funds with high media exposure or social media campaigns attract more cash flows (Gil-Bazo and Imbet, 2020) [7]. In the context of Chinese investors, Li and Liu (2019) [1] find that Chinese investors prefer simplified CAPM-alpha over more sophisticated Fama–French multifactor models, indicating a lack of advanced assessment capabilities.
ESG stands for environmental, social, and governance (hereinafter collectively referred to as ESG ratings). ESG ratings encompass a set of standards and methodologies designed to evaluate a company or fund’s performance across these three essential dimensions. Through the utilization of ESG ratings, investors can gain comprehensive insights into a company’s performance in environmental stewardship, social responsibility, and corporate governance. This enables investors to incorporate these factors into their investment decisions, thereby aiming to achieve more sustainable and responsible investment outcomes. ESG ratings have garnered significant attention in leading international publications. Morningstar, a prominent global fund rating agency, integrates ESG ratings as sustainability ratings, which are prominently featured on fund information pages. Hartzmark and Sussman (2019) [8] concluded that ESG ratings significantly influence perceptions of sustainability. However, the Chinese public fund market, which began later and has developed more slowly, lacks a dedicated platform for presenting the ESG ratings. Additionally, the cost of obtaining these ratings remains prohibitive for many investors (Lu et al., 2024) [9]. This paper innovatively incorporates the ESG ratings as a fund investment signal and explores their impact on investors’ decision-making processes. It contrasts these with strong signals, such as historical performance and traditional ratings, and weak signals, such as ESG ratings and excess returns. This analysis aims to provide a deeper understanding of how ESG considerations influence investment behavior, particularly in the context of the Chinese market.
This study reveals several intriguing features of the Chinese fund market: 1. Chinese fund investors primarily chase historical performance and strong rating signals, reflecting limited attention and a disregard for ESG ratings, which contrasts with the findings by Hartzmark and Sussman (2019) [8]. 2. The strong signals of historical performance and traditional ratings do not necessarily result in positive returns. The contributions of this paper are threefold: 1. It analyzes the mechanisms behind Chinese investors’ preference for simple signals, enriching existing research on investor behavioral biases. 2. It extends the study of the fund cash flow–signal relationship from the perspective of limited attention, incorporating an ESG perspective to better explain investor behavior biases, enhancing the understanding of Chinese investor behavior, and providing regulatory insights. 3. It demonstrates that strong signals like historical performance and traditional ratings may not yield positive economic returns, advocating for a long-term investment philosophy to protect investor rights and promote sustainable development of the fund market.
2. Theoretical Analysis and Research Hypothesis
2.1. Theoretical Analysis
The fundamental premise of this paper asserts that investors, constrained by limited attention and a lack of professional expertise, struggle to process comprehensive market information. Consequently, they often resort to simpler, lower-cost signals, such as performance rankings and rating systems, to inform their investment decisions. This tendency towards irrational decision making exacerbates the phenomenon known as “funds making money, fundholders not making money”.
Berk and Green (2004) [2] proposed a hypothesis suggesting that fund returns consist of two primary components: the fund’s ability to generate excess returns (Alpha) and a noise term representing luck or market factors. While past research has advocated for investors to use excess returns as a metric for evaluating a fund’s ability, the actual utilization of complex Alpha remains inconclusive. The studies by Chevalier and Ellison (1997) [10] and Barber et al. (2016) [11] indicate a preference among investors for the unadjusted rates of return and simplistic CAPM models in assessing fund performance, a trend observed both in the US and Chinese markets.
Rational and professional investors possess the capability to gather relevant data factors related to excess returns and employ sophisticated asset pricing models to evaluate fund capabilities. Their investment decisions are guided by rational metrics such as excess return, incorporating risk considerations to make informed judgments about a fund’s potential. In contrast, irrational or resource-constrained investors may lack access to excess return information and gravitate towards simpler signals, such as raw, unrisk-adjusted yields or ratings from prominent platforms, driving investment decisions. This dichotomy in investor behavior, influenced by the prevalence of rational or signal-dependent decision making, shapes the overall market dynamics and investor learning trends regarding fund capabilities.
2.2. Hypothesis Development
Building upon insights from DailyFund.com, China’s premier fund platform, it becomes apparent that prominently displayed icons leading to fund NAVs, rankings, and ratings are ubiquitous features across major financial websites. This prevailing trend is also observed on platforms such as PrivateEquity.com and Morningstar.com. Informed by the research insights of Ben-David (2022) [6], this study identifies raw returns and comprehensive ratings—factors that capture substantial investor attention and are readily accessible—as robust signals. Consequently, the paper delves into the intricate relationship between investor behavior and these signals.
Compared to the U.S. capital market, which has a long history of sophisticated investors, China’s fund market has grown rapidly and has a relatively low level of investor sophistication. While China’s institutional framework and investor expertise are still evolving, recent research by foreign scholars suggests that even in the U.S., fund investors still rely heavily on simplistic signals, especially on raw yields, and Morningstar ratings, which are strong indicators of fund attractiveness. This study suggests that fund investors in China may also exhibit similar signal-chasing tendencies. Therefore, this study proposes the following hypothesis:
H1:
Fund investors will demonstrate a preference for high-yielding funds.
H2:
Fund investors will exhibit a tendency to pursue highly rated funds.
Expanding on this notion, the visibility of ESG ratings on fund platforms plays a pivotal role in shaping their impact on cash flow. Unlike Morningstar Information, which actively promotes ESG ratings by featuring them prominently on fund homepages, major domestic platforms like Wind or CSI lack the direct public promotion of ESG ratings and fail to establish clear access thresholds for individual investors. This disparity in display availability not only undermines the visibility of ESG ratings but also inhibits their recognition as strong signals in the domestic market. Consequently, while ESG ratings may hold sway as robust indicators in foreign markets, their potential as signals remains unrealized within the confines of domestic platforms.
Drawing on this theoretical framework, the study posits that the absence of adequate display platforms hampers the signal status of ESG ratings in domestic markets, setting them apart from their foreign counterparts. As such, the following hypothesis is advanced:
H3:
There will be no significant pursuit of ESG ratings by domestic fund investors.
Previous studies have shown that investors have weak identification and computational abilities for complex pricing models due to limited constraints and endowment constraints. Domestic scholars have likewise come up with similar results in the Chinese market, finding that Chinese fund investors also primarily consider CAPM-alpha when evaluating fund capabilities (Li, and Liu 2019) [1].It is able to identify simple historical performance and CAPM models, but not the more complex Carhart four-factor and Fama–French five-factor models, which are not computationally sound and recognizable. This paper further proposes the following hypothesis:
H4:
Fund investors as a whole have a low level of recognition of complex excess returns.
According to the theory of behavioral finance, investors’ behavioral biases primarily stem from limited attention and emotional responses. Institutional investors, equipped with comprehensive investment teams and information channels, are less affected by limited attention compared to individual investors. Moreover, institutional decision-making processes tend to be more standardized, mitigating the influence of personal emotions. Scholars contend that institutional investors exhibit a higher degree of rationality in their investment decisions. They are adept at applying the principles of prudence in fund management, discerning the effectiveness of signal transmission amidst information overload, and effectively timing investments while selecting alpha indicators judiciously (Eriksen and Kvaloy, 2010; Alevy et al., 2007; Welch, 2022) [12,13,14].
However, some scholars argue that institutional investors are not immune to behavioral biases and may engage in signal-chasing behaviors akin to individual investors, thereby exhibiting myopic tendencies (Liu and Xu, 2012) [15]. This study posits a nuanced perspective that acknowledges the coexistence of rational and behavioral elements in institutional investor decision making. While institutional investors may not achieve absolute rationality, their reliance on strong signals is lower compared to individual investors, yet they demonstrate a heightened recognition of excess returns. In the realm of professional calculation, they align more closely with the rational learning indicators of asset pricing models. Therefore, the following hypothesis is proposed:
H5:
The pursuit of yield exists among both institutional and individual investors, but institutional investors exhibit lower dependence on yield signals.
H6:
The pursuit of ratings exists among both institutional and individual investors, but institutional investors rely less on rating signals.
H7:
Institutional investors demonstrate greater recognition of excess returns compared to individual investors.
Given that ESG ratings in China are still in the exploratory development stage, investors’ unfamiliarity with the concept of ESG ratings, inadequate regulatory incentives, and the prioritization of immediate economic returns over sustainable and responsible investments contribute to this nascent stage. Therefore, without established platforms to effectively communicate the value of ESG ratings and without broader educational initiatives to raise awareness, ESG considerations are likely to remain secondary for the majority of investors in China. Consequently, the following hypothesis is proposed:
H8:
Both institutional and individual investors generally do not place significant importance on ESG ratings.
This chapter further delves into the economic implications of irrational behavioral biases, particularly concerning the consequences of the investors’ pursuit of simplistic signals at the expense of recognizing the true excess returns indicative of a fund’s capabilities. The blind chase for signals among fund investors disproportionately rewards exposures that amplify volatility. According to the theory of significance, funds exhibiting higher volatility are more likely to capture investors’ attention; however, heightened volatility often accompanies significant pullbacks, impacting the stability of a fund’s returns. Moreover, the investors’ erroneous assessments of a fund’s abilities can yield negative outcomes, such as short-term overcrowding into star funds that surpass managers’ control capacities, resulting in diminished returns.
In contrast, excess returns serve as rational benchmarks reflecting a fund’s true capabilities to a certain extent. Utilizing excess returns as investment references has the potential to enhance returns. Thus, the following hypotheses are posited:
H9:
Signals of high ratings and performance do not reliably forecast future fund performance positively.
H10:
High excess returns and ESG ratings are rational indicators that have the ability to positively predict the fund’s future performance.
3. Research Design
3.1. Sample Data
The study period for this paper spans from January 2010 to December 2022, utilizing data sourced from the CSMAR database. The funds with less than 2 years of inception were omitted to facilitate the calculation of fund ratings and cash flows. Moreover, in a bid to mitigate the potential influence of outliers on research outcomes, a 1% winsorization treatment was applied to all continuous variables. Following these procedures, the chapter ultimately culled 756 funds, yielding a total of 15,464 valid observations for fund-quarter analysis.
3.2. Main Variables and Definitions
- (1)
- Fund financial flows (Flow)
Referring to the way domestic and international studies define fund flows for fund investors (Li, 2011) [16], this study uses the net cash inflow ratio to represent the investment behavior of fund investors to construct the fund net inflow indicator. In this paper, the fund net inflow of fund i in quarter t is defined as follows:
where is fund i’s net assets at the end of quarter t, and is the return of fund i at quarter t, constructed with reference to the following Equation (2):
Of these, the and denote the compounded net value of fund i in period t and period t − 1, respectively.
Referring to Zuo and Lu (2013) [17], define institutional investor cash flow () and individual investor cash flow () as follows:
where denotes the share–share ratio of institutional investors holding fund i at the end of quarter t, and denotes the share–share of individual investors holding fund i at the end of quarter t. These two share–share ratios always add up to one.
- (2)
- Excess return (Alpha)
Some domestic and foreign scholars have conducted research on the relationship between excess returns and cash flows, yielding similar results. Specifically, CAPM-alpha has been found to be attractive to investors (Greenwood and Shleifer, 2014; Li and Liu, 2019) [1,18]. However, the CAPM model assumes that asset returns depend solely on market risk, neglecting other factors such as company size and market–book ratio that may influence returns. Consequently, this model may fail to fully explain the excess returns of funds. Unlike studies employing a single excess return, in order to explore whether the increasing complexity of models with the addition of factors exacerbates investors’ professional endowment constraints, this study employs the commonly used Fama–French three-factor model, Fama–French–Carhart four-factor model, and Fama–French five-factor model to better compare the explanatory power of different excess return models. The details are as follows:
CAPM-alpha model
Of which is the fund at time the expected rate of return; is the time of the risk-free rate of return; is the time of the market factor.
Fama–French three-factor model
Of which is the fund at time the expected rate of return; is the time of the risk-free rate of return; is the time of the market factor; is the time of the market capitalization factor for time; the is the time the book-to-bill factor of time.
Fama–French–Carhart four-factor model
Of which is the fund at time the expected rate of return; is the time of the risk-free rate of return; is the time of the market factor; is the time of the market capitalization factor for time; the is the time the book-to-bill factor of time; is the time the yield factor for time.
Fama–French five-factor model
Of which is the fund at time the expected rate of return; is the time of the risk-free rate of return; is the time of the market factor; is the time of the market capitalization factor for time; the is the time the book-to-bill factor of time; is the time the yield factor of time; is the time of the investment style factor.
- (3)
- Control variables
With reference to the existing research on fund cash flows, a range of control variables were considered to ensure the accuracy of the analysis, and four control variables were selected, namely: fund age (age): expressed in the form of the natural logarithm of the number of years the fund has been in existence, this measure was designed to assess the possible impact of fund maturity on its cash flows. Fund size (TNA): expressed as the natural logarithm of the fund’s net asset value at the end of the period, this measure is used to examine the potential impact of fund size on cash flows. Fund return volatility (Vol): based on the volatility of the fund’s daily raw returns over the past 12 months, taken as its natural logarithm. This variable is used to explore the impact of return volatility on fund cash flows. Fund family size (FTNA): expressed as the natural logarithm of the fund management company’s net asset value at the end of the period, this variable is used to consider the potential impact of the fund management company’s size on fund cash flows.
In order to avoid the problem of multicollinearity, a two-way fixed effects model was chosen for this study, aiming to ensure the accuracy of the model and the validity of the results. Table 1 below shows the list of main variables defined in this section.

Table 1.
Definitions of key variables.
3.3. Definition of Signal Strength
This study systematically distinguishes between strong and weak signals based on a synthesis of the definitions of the signals in the domestic and international literature (Barber, 2016; Hartzmark and Sussman, 2019; Ben-David, 2022) [6,8,11], combined with the feedback from 2583 valid questionnaires of Chinese general fund investors recovered through the public and Weibo financial blogger platforms. The data presented in Figure 1 show that the vast majority of investors’ primary consideration in making investment decisions is past performance, especially annual returns, followed by concerns about composite ratings. While fund annual and semi-annual reports are given less attention than performance and ratings, they are likewise significantly more important than a few excess returns. This finding suggests that historical performance and composite ratings can be seen as strong signals, while excess returns and ESG ratings are weak signals. For investors, past performance and rating information from professional organizations tend to be key factors in their decision making, while more complex or emerging signals are paid less attention by investors.
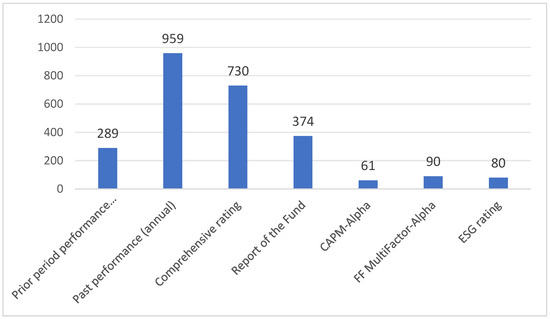
Figure 1.
Fund investors’ judgement of strong signals in the questionnaire.
3.4. Modelling
In order to test whether Chinese fund investors are over-seeking strong signals, i.e. to examine whether hypotheses 1 and 2 hold true, this chapter constructs the following model by referring to the mainstream empirical research methodology in the domestic and international literature (Hartzmark and Sussman, 2019; Reuter and Zitzewitz, 2021) [4,8]:
where the explanatory variable is the fund i’s net inflow of funds in the quarter t + 1; the explanatory variable is the fund i’s return in the quarter t; the other explanatory variable is the comprehensive rating of the fund i in the quarter t. In this study, in order to prevent the rating method of individual rating agencies from having a tendency to affect the empirical results, the five most mainstream ratings in the market are selected to make a comprehensive argument, which are Ji’an Jinxin Comprehensive, Shanghai Securities for 3 years, Market Comprehensive for 3 years, Wind Rating, and Morningstar Rating; are other control variables affecting the fund’s cash flow, which are defined in detail in the subsection of variable definition; and represent the unobservable fund individual fixed effects and quarterly fixed effects, respectively, and are error terms.
The concept of weak signals contrasts with that of strong signals, referring to indicators that are less widely recognized by the general public. In this chapter, two weak signals are examined: excess return and ESG ratings. Excess return, a well-established metric in the classic literature, is considered a decision indicator for rational investors, although its complexities often render it unfamiliar to the broader investing public due to computational difficulties and access thresholds for relevant factors.
On the other hand, ESG ratings have gained prominence in recent years, especially in top foreign publications. Morningstar Information, a leading foreign fund rating company, prominently displays ESG ratings on its fund information pages. Hartzmark and Sussman (2019) [8] affirm the significance of sustainability ratings based on ESG metrics as prominent signals. However, within China, only Wind and CSI Index Limited provide ESG ratings, and the high price thresholds of these two platforms limit public access to relevant information. Therefore, this paper defines ESG ratings as weak signals, which reflects the unique Chinese context and differs significantly from the relevant foreign literature.
In order to assess the impact of weak signals on the fund’s cash flows and to test the validity of hypotheses 3 and 4, the following specific models are used in this paperl:
where the explanatory variable is the fund flow of the fund i in quarter t + 1, and the explanatory variables represents the excess return of the fund i in the quarter t. In this paper, four types of Alpha are selected as the variables of excess return, namely CAPM-alpha, FFAlpha, FFC4-Alpha, and FF5-Alpha, and their explanatory power of cash flow is tested separately. Another explanatory variable represents the fund i’s ESG rating at quarter t. In this paper, two dominant domestic ESG ratings, CSI ESG and Wind ESG, are used as core proxy variables.
According to the theory of limited investor attention, institutional investors receive smaller endowment constraints and will be less dependent on the strong signals than individual investors, so in order to verify that institutional investors are less affected by the signals of high returns than individual investors, i.e., to test whether hypotheses 5 are valid, this paper adopts the model:
With high return approximation, high ratings also as a strong signal to investors have greater attraction, but institutional investors have independent research teams and evaluation systems, and individual investors do not have the corresponding investment research capabilities, so in order to verify whether institutional investors rely on ratings less than individual investors, i.e., to test whether the hypothesis 6 is valid, the specific use of the following model is undertaken:
In the classical literature are regarded the excess return as an indicator of whether the investor is rational to judge the fund’s ability, but in real life, the factors of excess return have a certain threshold of access and are notoriously difficult to compute, and the mass investor does not have the relevant professional skills. Therefore, in order to verify whether institutional investors’ ability to recognize excess return is higher than that of individual investors, i.e., In order to test the validity of Hypotheses 7 and 8, the following model has been used in this chapter:
There are few direct comparisons of the impact of different signals or indicators on cash flows in the existing domestic literature. In this chapter, we refer to Ben-David’s (2022) [6] Horse Racing (HORSE RACING) approach to test the strong and weak magnitude of the impact on cash flow in different signals by cascading the head samples of different signals into a difference analysis of the impact on cash flow. Referring to the setting methodology of the mainstream literature, the number of header samples is based on the total sample share of five-star ratings, which is 9.2% in this paper. Each quarter, the entire sample of funds is taken as a high group by taking the batch with the highest rankings of the different signal values, and the weighted net fund flows of each group are calculated to compare the variability of the net fund flows among the high groups. Therefore, the following model is used in this chapter:
In particular, since five-star ratings account for 9.2% of the total sample, the top 9.2% of high-yield funds and high excess yield funds are taken and a t-statistic is constructed for the comparison between high ratings–high yield, high ratings–high excess yield, and high yield–high excess yield, where is the mean value of cash flows in the high-yield fund group, and is the mean value of cash flows in the five-star rated fund group, and is the mean value of cash flows in the high excess yield; , the and and are the variances in the high yield fund group, the high rating fund group, and the high excess return, respectively, and n and m are the sample sizes of the numerator for the current period.
Independent samples t-test was used to test whether there is a significant difference between the cash flows of the highly rated fund group and each inter-signal Top group, and the two were compared.
According to the theory of significance, the greater the volatility of the fund, it is more likely to stand out at a certain stage from the same kind of funds in the eyes of investors, but high volatility may not bring better future performance expectations, because the high volatility of the fund may not have the performance of the continuity of the fund, and after a short period of time, the rapid crowding of funds into the fund is easy to make the size of more than the manager’s control ability; according to the scale of the corrosion of the hypothesis, the situation is more likely to cause a decline in returns. Therefore, in order to verify whether strong and weak signals lead to better future performance returns, i.e., to test whether hypotheses 9 and 10 are valid, the following model is used in this paper:
In this case, following the high return cut-off setting described above, in the grouping of the high and low groups, the high group (HEAR, HStar, HAlpha) represents 9.2% of the data samples in the first 9.2% of each signal, and the low group (LEAR, LStar, LAlpha) represents 9.2% of the data samples in the last 9.2% of each signal, so as to reflect the direct comparison of the high and low groups in terms of whether the high returns and the high ratings, as compared to the ability of high returns and high ratings to result in significant positive return predictions compared to low returns and low ratings.
4. Empirical Testing and Analysis of Results
4.1. Descriptive Statistics
This study employs the econometric analysis software to conduct a descriptive statistical analysis of variables, the results are shown in Table 2 below. Panel A presents the descriptive statistics of the variables under consideration. The mean value of fund quarterly net fund flow (flow) in the sample interval is −0.1%, with a standard deviation of 28.1%. The median value is −3.4%, suggesting significant variability in fund quarterly net fund flow across funds or over time, with more than half of the funds experiencing a net fund outflow.
Table 2.
Descriptive statistical analysis.
The mean value of each rating is approximately 3, with standard deviation values hovering around 1. The median is also around 3, indicating that most ratings are greater than 3, belonging to medium-high ratings. The mean values of annual return and semi-annual return are 18.5% and 7.2%, respectively, with the median values of 22.7% and 5.3%. While the majority of annual funds yield positive returns, this contradicts the fact that the funds are facing net fund outflows. Thus, it suggests that the public does not solely focus on annual returns when selecting funds, prompting a comprehensive examination of cash flows in conjunction with ratings.
The sample size for ESG ratings excludes funds with less than two years of existence, and all continuous variables are subject to a one percent reduction. Consequently, this chapter analyzes 1421 funds, totaling 15,502 valid “fund-quarter” observations.
Panel B presents the descriptive statistics for Wind and CSI ESG ratings. The mean value of Wind ESG ratings is 2.532, with a standard deviation of 0.909 and a median value of 3, indicating that most Wind ESG ratings are above three. For CSI ESG ratings, the mean value is 3.940, with a standard deviation of 1.225 and a median of four, suggesting that most CSI ESG ratings are greater than or equal to four. This chapter initiates an in-depth study of cash flows in conjunction with ratings.
4.2. Benchmark Regression
- (1)
- The impact of strong signals and fund cash flows
Table 3 shows the results of the benchmark regression, and it can be observed that both long-term and short-term yields have a positive and significant attraction to the fund’s cash flows, indicating that the fund’s yield acts as a strong signal to bring positive buying expectations to investors, thus verifying hypothesis 1. Meanwhile, in the comparison of the explanatory power of the different time periods, the annual yield has the highest R², which indicates that compared to the other variables it has a stronger explanatory power for fund cash flow.
Table 3.
Impact of yield on the fund’s financial flows.
Similar to yield, fund composite ratings are also investment signals that investors will favor; as can be seen from the results in Table 4, the positive impact of fund composite ratings on cash flow is very significant, regardless of whether it is the short- to medium-term considerations of Jinan Jinxin Composite, Wind Ratings, and Morningstar Ratings, or the longer-period considerations of 3 years for Shanghai Securities and 3 years for the Market Composite, which have a significant positive impact on cash flow, thus verifying hypothesis 2.
Table 4.
Impact of ratings on the fund’s financial flows.
- (2)
- Impact of weak signals on fund cash flows
In recent years, many scholars at home and abroad have regarded the excess return as an indicator of rational learning, and it is found that investors do not have a strong ability to identify the excess return, and CAPM is less difficult to calculate the excess return which will be better than other complex models. From the empirical results in Table 5, it can be seen that the excess yield has a negative and significant effect on fund cash flow regardless of the model used for calculation, thus verifying hypothesis 4, which is consistent with the findings of the existing literature on the inability of investors to effectively identify the excess yield. Where the significance of the parameters is comparable, the R² of CAPM will be slightly higher than several other excess returns, indicating a relatively strong explanatory power.
Table 5.
Impact of the excess rate of return on the fund’s financial flows.
In recent years, following Morningstar’s prominent placement of sustainability ratings at the forefront of fund information pages, foreign scholars have begun investigating the correlation between sustainability ratings and fund cash flows. These studies have found that high sustainability ratings can have a significantly positive impact (Hartzmark and Sussman, 2019) [8]. As sustainability is a component of ESG (environmental, social, and governance) ratings, which provide a more comprehensive assessment framework, it is crucial to consider the broader implications of ESG ratings.
In China, however, the lack of platforms for presenting fund ESG ratings and the high barriers to access for ordinary investors hinder their widespread use and visibility. Consequently, in this study, ESG ratings are considered a weak signal, not easily observable by investors. As shown in Table 6, regardless of whether Huazheng or Wind ESG rating samples are used, the results are consistent: past performance has a significant impact on cash flows, whereas ESG ratings do not exhibit a significant effect, thus verifying hypothesis 3. In fact, Huazheng’s ESG ratings show a negative correlation with cash flows. This suggests that, in the absence of platforms to disseminate these signals, funds with high ESG ratings incur additional costs related to environmental protection, social responsibility, and corporate governance. As a result, investors do not consider them to be favourable investment options.
Table 6.
Impact of ESG ratings on fund flows.
4.3. Heterogeneity Analysis
This study further decomposed the CSIESG rating into three parts, and the results are shown in Table 7: environmental (E), social (S), and governance (G), to examine their respective impacts on fund cash flows in the subsequent quarter. The findings reveal that each component of the ESG rating (E, S, G) has a significantly negative impact on fund cash flows. This negative relationship suggests that the adverse effects of environmental (E), social (S), and governance (G) components on fund cash flows in the Chinese market can be attributed to several factors. First, Chinese investors may perceive these initiatives as not directly contributing to short-term financial performance. Second, achieving higher ESG ratings involves high compliance costs. Lastly, the perceived non-essentiality of ESG practices and the nascent stage of ESG awareness among Chinese investors further contribute to this negative impact.
Table 7.
Impact of E, S, and G ratings on fund cash flows.
Hypothesis 5 posits that institutional investors, benefiting from their independent research teams, are relatively less constrained by limited attention compared to individual investors, who may exhibit greater sensitivity to strong signals due to their constrained ability to focus and lack of expertise. The results presented in Table 8 shed light on this hypothesis. Odd columns in the table represent the sensitivity of institutional investors to high returns, while even columns depict the sensitivity of individual investors to high returns. Both groups display a positive and significant sensitivity to returns; however, the significance is higher for individual investors. Notably, the significance difference between quarterly and semi-annual returns is more pronounced, whereas the dependence on annual returns shows minimal variation. This suggests that individual investors exhibit a stronger preference for short- and medium-term returns compared to institutional investors.
Table 8.
Impact of yield on individual/institutional fund flows.
In Table 9, odd columns depict the correlation between the proportion of institutional investors and ratings, while even columns illustrate the correlation between the proportion of individual investors and ratings. The empirical findings reveal a positive and statistically significant correlation between net cash inflows and ratings for both institutional and individual investors, with significance levels at 1%. To test hypothesis 3b, which suggests that both institutional and individual investors pursue ratings but with a greater reliance among individual investors, the results from multiple rating agencies are aggregated.
Table 9.
Impact of ratings on individual/institutional fund flows.
In accordance with hypothesis 7, individual investors exhibit a poorer ability to identify excess returns when controlling for other variables. The results presented in Table 10 reveal that odd columns depict the correlation between the proportion of institutional investors and ratings, whereas even columns illustrate the correlation between the proportion of individual investors and ratings. Additionally, the correlation of excess returns with either institutional or individual investors is significantly negative, indicating that both groups lack a rational perception of excess returns. However, the magnitude of the negative correlation for individual investors is notably larger than that for institutional investors, suggesting that individual investors, in contrast, face constraints related to their endowments and possess a lower degree of the recognition of excess.
Table 10.
Impact of excess yield on individual/institutional fund flows.
In line with hypothesis 8, this study examines the level of recognition of ESG ratings among individual and institutional investors using CSI ESG ratings, Table 11. It is evident that neither individual nor institutional investors demonstrate a significant positive impact on ESG ratings. Several factors may account for this phenomenon. Firstly, the absence of regulatory mandates or incentives to incorporate ESG considerations into investment decisions may lead investors to prioritize other factors, such as short-term financial performance metrics, over ESG ratings. Secondly, the relatively nascent stage of ESG awareness and education among investors in China contributes to a general lack of recognition regarding the importance of ESG criteria in investment analysis, regardless of whether they are institutional or individual investors.
Table 11.
Impact of Esg ratings on individual/institutional fund flows.
4.4. Economic Consequences of Different Signals
Due to the distinct characteristics of the data sample utilized for ESG ratings compared to other signals, this study conducts a regression analysis to examine the impact of ESG ratings on the fund’s returns for the latter half of the year, the results are shown in Table 12. The findings reveal a significant positive association between ESG ratings and the fund’s returns for the latter half of the year, with the social (S) factor exerting the most substantial influence. This suggests that ESG ratings not only enhance the long-term return of investment portfolios but also contribute to reducing the risk level of investment portfolios. Furthermore, ESG investing can also foster corporate social responsibility awareness and sustainable development principles, thereby positively impacting society and the environment. Therefore, integrating ESG factors into investment decision making not only facilitates the diversification of asset allocation but also contributes to achieving sustainable development goals.
Table 12.
The results of the rating univariate ranking.
The preceding empirical analysis establishes that fund investors in China exhibit a propensity to blindly pursue strong signals such as high returns and high ratings, thereby lacking the ability to rationally learn about funds. To further ascertain whether investors’ reliance on signals is a behavioral bias rather than a consequence of Bayesian learning, this section investigates different signals and excess returns as the predictors of fund performance to assess their predictive efficacy on future fund returns. If strong signals yield positive and significant fund performance returns, while excess return Alpha fails to do so, it implies that investors are engaging in signal-chasing behavior rather than rational learning, and vice versa.
Table 13 presents the univariate ranking of returns, revealing that the future raw return of the low annual return group 1 stands at 7.344%, whereas the future raw return of the high annual return group 5 is only 5.624%, indicating a significant 1.72% decrease compared to group 1. This suggests that high annual returns have a negative and significant impact on future raw returns. Similar negative and significant effects are observed for annual returns on future excess returns (including CAPM, FF F, FFC 4-F, and FF 5-F). Therefore, regardless of whether raw return or excess return is used as a metric of the fund’s future performance, the results indicate that high past returns do not lead to positive future returns.
Table 13.
Univariate ranking table (HEAR-LEAR).
In addition to high returns, high ratings also serve as strong signals. However, rating agencies consider risk and stability in their assessment of funds, mitigating the economic consequences of blind faith in ratings compared to chasing historical performance.
For each quarter tt, the entire sample of funds is stratified into five groups (group 1 being the lowest and group 5 being the highest) based on their weighted ratings in quarter t − 1, ranging from lowest to highest. Weighted raw and excess returns are then calculated for each group, and the variability in the performance of raw return and excess return in the future period is compared between the high and low factor rating groups.
Table 14 presents the results of the rating univariate ranking. It can be inferred that the future raw return of the low-rating group 1 is 6.028%, while the future raw return of the high-rating group 5 is 6.373%, indicating a 0.345% increase compared to the low-rating group. This suggests that high ratings do not have a significant positive predictive effect on future raw returns. Similarly, the effect of high ratings on the excess return in the future period (including CAPM, FF3, FF4, and FF5) reveals a negative and significant impact on excess returns.
Table 14.
Univariate ranking table (HStar-LStar).
The two strong signals mentioned above have a strong ability to absorb money but cannot play a positive predictive role in the future performance of the fund; on this basis, we further test whether the excess return Alpha obtained from the rational learning ability highlighted in the literature can have a positive and significant impact on the future performance of the fund. It is clear from Table 15 that funds with high excess returns in the T period are able to obtain significantly better raw and excess returns in the T + 1 period, and except for FF4 which is more specific, the excess returns are progressive with the complexity of the model, and the high group of FF 5-F Alpha has a higher raw return than the low group, which suggests that incorporating excess returns into the investment consideration is a rational judging system that investors should have to build.
Table 15.
Univariate ranking table (HAlpha-LAlpha).
4.5. Robustness Tests
- (1)
- Propensity score matching PSM test
To mitigate potential endogeneity concerns stemming from sample self-selection, this study employs propensity score matching (PSM) methodology, which allows for a more rigorous examination of the relationship between fund annual returns, fund rating levels, and other pertinent factors. To ensure the robustness of the core findings, separate tests are conducted for both fund annual returns and fund rating levels.
For each quarter tt, the funds with annual returns above the 50th percentile are designated as the experimental group, while those below the 50th percentile form the control group. A Logit model is utilized to analyze various factors, including the fund ratings, fund size, fund age, fund family size, fund return volatility, and lagged net fund inflow. Three distinct matching techniques are employed: (1) Nearest Neighbor Matching (NNM) with 1-unit matching, (2) Nearest Neighbor 1-unit non-return sampling (NRS) matching, and (3) RADIUS Matching. The results, as shown in Table 16, reveal that the average treatment effect (ATT) is statistically significant for both annual returns and each rating, irrespective of the matching methodology utilized. This consistency across different matching techniques underscores the robustness and reliability of the findings presented in this paper.
Table 16.
Average treatment effect (ATT).
5. Conclusions and Policy Recommendations
5.1. Conclusions of the Study
The empirical analyses presented in this paper yield the following research conclusions:
- This study introduces ESG ratings to examine their impact on cash flows, yielding results contrary to those of foreign scholars regarding ESG rating research. Due to the lack of platforms showcasing ESG ratings for funds domestically, Chinese fund investors generally lack access to ESG rating signals for investment decision-making references.
- Chinese fund investors rely on simplistic signals, tending to allocate funds to high-rated or high-yield funds. Due to significant differences in the sources, prominence, and calculation complexity of various simplistic signals and excess return rates, there are significant discrepancies in investors’ acceptance levels and frequency of application, with a preference towards selecting straightforward indicators for investment decisions.
- Strong signals fail to predict positive fund performance outcomes, while the often-overlooked ESG ratings can positively impact a fund’s long-term returns. This underscores the importance of incorporating ESG ratings into Chinese investors’ investment references to achieve sustainable and responsible investment outcomes. By integrating ESG factors into the investment decision-making process, Chinese investors can potentially enhance the financial performance of their portfolios while promoting environmental, social, and governance objectives.
5.2. Policy Recommendations
- Increased investment in the development of the ESG evaluation system is warranted, alongside efforts to refine ESG assessment standards and methodologies to enhance the accuracy and credibility of ESG ratings. Simultaneously, establishing robust ESG information disclosure and communication platforms can lower the barriers for ordinary investors to access ESG ratings. By providing Chinese investors with more comprehensive and transparent ESG information, these platforms can facilitate better investment decision-making and risk management practices.
- Strengthening investor awareness of ESG ratings and excess return rates can be achieved through initiatives such as investor education activities and relevant training programs. These efforts aim to foster rational investment concepts and decision-making habits among investors, thereby enhancing their investment decision-making capabilities and mitigating irrational behavioral biases resulting from blindly following strong signals.
- Enhanced market supervision efforts are imperative to regulate fund market behaviors, prevent and combat false advertising and fraudulent activities, and safeguard the legitimate rights and interests of investors. Furthermore, promoting and standardizing the disclosures of environmental, social, and governance-related information in financial reports by financial institutions, listed companies, and other entities can contribute to the wider adoption and development of ESG investing practices.
Author Contributions
Conceptualization, W.Q. and Z.S.; methodology, Z.S.; software, Z.S.; validation, W.Q.; formal analysis, W.Q.; investigation, Z.S.; resources, W.Q.; data curation, W.Q.; writing—original draft preparation, Z.S.; writing—review and editing, W.Q.; visualization, Z.S.; supervision, W.Q.; project administration, W.Q.; funding acquisition, W.Q. All authors have read and agreed to the published version of the manuscript.
Funding
This research received no external funding.
Institutional Review Board Statement
Not applicable.
Informed Consent Statement
Not applicable.
Data Availability Statement
The data presented in this study are available upon request from the corresponding author.
Conflicts of Interest
The authors declare no conflicts of interest.
References
- Li, Z.B.; Liu, X.Y. Fund performance attribution and investor behaviour. Financ. Res. 2019, 2, 192–210. [Google Scholar]
- Berk, J.B.; Green, R.C. Mutual Fund Flows and Performance in Rational Markets. J. Political Econ. 2004, 112, 1269–1295. [Google Scholar] [CrossRef]
- Vozlyublennaia, N.; Wu, Y. Mutual Funds Apart from the Crowd. SSRN Working Paper, 16 May 2018. [Google Scholar]
- Reuter, J.; Zitzewitz, E. How Much does Size Erode Mutual Fund Performance? A Regression Discontinuity Approach. Rev. Financ. 2021, 25, 1395–1432. [Google Scholar] [CrossRef]
- Durán-Santomil, P.; Otero-González, L.; Correia-Domingues, R.H. Does Sustainability Score Impact Mutual Fund Performance? Sustainability 2019, 11, 2972. [Google Scholar] [CrossRef]
- Ben-David, I.; Li, J.; Rossi, A.; Song, Y. What do mutual fund investors really care about? Rev. Financ. Stud. 2022, 35, 1721774. [Google Scholar] [CrossRef]
- Gil-Bazo, J.; Imbet, J.F. Tweeting for Money: Social Media and Mutual Fund Flows. SSRN Electron. J. 2020. [Google Scholar] [CrossRef]
- Hartzmark, S.M.; Sussman, A.B. Do investors value sustainability? A natural experiment examining ranking and fund flows. J. Financ. 2019, 74, 2789–2837. [Google Scholar] [CrossRef]
- Lu, P.; Dong, Z.; Shen, W. Analysis and Prospect of the Development Trend of ESG Investment Funds in China. China Environ. Manag. 2024, 1, 016. [Google Scholar]
- Chevalier, J.; Ellison, G. Risk Taking by Mutual Funds as a Response to Incentives. J. Political Econ. 1997, 105, 1167–1200. [Google Scholar] [CrossRef]
- Barber, B.M.; Huang, X.; Odean, T. Which Factors Matter to Investors? Evidence from Mutual Fund Flows. Rev. Financ. Stud. 2016, 29, 2600–2642. [Google Scholar] [CrossRef]
- Eriksen, K.W.; Kvaløy, O. Myopic investment management. Rev. Financ. 2010, 14, 521–542. [Google Scholar] [CrossRef]
- Alevy, J.E.; Haigh, M.S.; List, J.A. Information cascades: Evidence from a field experiment with financial market professionals. J. Financ. 2007, 62, 151–180. [Google Scholar] [CrossRef]
- Welch, I. The Wisdom of the Robinhood Crowd. J. Financ. 2022, 77, 1489–1527. [Google Scholar] [CrossRef]
- Liu, J.; Xu, H. Institutional investors: Long-term investors or short-term opportunists? Financ. Res. 2012, 55, 141–154. [Google Scholar]
- Li, K. Investors’ limited rationality and fund marketing strategy—Evidence of large fund dividend. Manag. World 2011, 11, 10. [Google Scholar]
- Dayong, Z.; Rong, L. Degree of Rationality and Investment Behaviour—A Study of Behavioural Differences between Institutional and Individual Fund Investors. Financ. and Trade Econ. 2013, 10, 11. [Google Scholar]
- Greenwood, R.; Shleifer, A. Expectations of Returns and Expected Returns. Rev. Financ. Stud. 2014, 27, 714–746. [Google Scholar] [CrossRef]
Disclaimer/Publisher’s Note: The statements, opinions and data contained in all publications are solely those of the individual author(s) and contributor(s) and not of MDPI and/or the editor(s). MDPI and/or the editor(s) disclaim responsibility for any injury to people or property resulting from any ideas, methods, instructions or products referred to in the content. |
© 2024 by the authors. Licensee MDPI, Basel, Switzerland. This article is an open access article distributed under the terms and conditions of the Creative Commons Attribution (CC BY) license (https://creativecommons.org/licenses/by/4.0/).